The capacitance of pristine ice crystals and aggregate ... · PDF fileThe capacitance of...
14
The capacitance of pristine ice crystals and aggregate snowflakes Christopher David Westbrook ∗ , Robin J. Hogan and Anthony J. Illingworth Department of Meteorology, University of Reading, UK. May 4, 2007 ABSTRACT A new method of accurately calculating the capacitance of realistic ice particles is described: such values are key to accurate estimates of deposition and evaporation (sublimation) rates in numerical weather models. The trajectories of diffusing water molecules are directly sampled, using random ‘walkers’. By counting how many of these trajectories intersect the surface of the ice particle (which may be any shape) and how many escape outside a spherical boundary far from the particle, the capacitance of a number of model ice particle habits have been estimated, including hexagonal columns and plates, ‘scalene’ columns and plates, bullets, bullet-rosettes, dendrites, and realistic aggregate snowflakes. For ice particles with sharp edges and corners this method is an efficient and straightforward way of solving Laplace’s equation for the capacitance. Provided that a large enough number of random walkers are used to sample the particle geometry (∼ 10 4 ) the authors expect the calculated capacitances to be accurate to within ∼ 1%. The capacitance for our modelled aggregate snowflakes (C/Dmax =0.25, normalised by the maximum dimension Dmax) is shown to be in close agreement with recent aircraft measurements of snowflake sublimation rates. This result shows that the capacitance of a sphere (C/Dmax =0.5) which is commonly used in numerical models, overestimates the evaporation rate of snowflakes by a factor of two. The effect of vapor ‘screening’ by crystals growing in the vicinity of one another has also been investigated. The results clearly show that neighbouring crystals growing on a filament in cloud chamber experiments can strongly constrict the vapor supply to each other, and the resulting growth rate measurements may severely underestimate the rate for a single crystal in isolation (by a factor of 3 in our model setup). 1. Introduction The growth and evaporation of ice particles by diffusion of water vapor on to and away from the surface of ice particles are fundamental processes for the development of ice clouds and precipitation. The density of water vapor ρ around a (stationary) ice particle is governed by Laplace’s equation: ∇ 2 ρ =0, (1) under steady-state conditions (Pruppacher and Klett 1997). Typically the separation between ice particles in a cloud is such that each ice particle may be consid- ered in isolation against a background vapor density ρ ∞ . If the vapor density at the surface ρ s is assumed to be constant, this leads to the growth rate: dm dt = D s ∇ρ · ds =4πDC(ρ ∞ − ρ s ), (2) by application of Gauss’s law over the particle surface s, where D is the diffusion coefficient for water vapor in air, and the capacitance C characterizes the shape and size of the ice particle. The assumption of constant ρ s implies a constant surface temperature. The temperature T s at any given part of the surface is determined by both the ∗ Corresponding author address : Dr. Chris Westbrook, De- partment of Meteorology, University of Reading, Berkshire, RG6 6BB, UK; email [email protected] flux of vapor on to that part of the crystal, resulting in the release of latent heat; and by the rate at which that heat is conducted away from the crystal. Since the equations for diffusion of vapor and transport of heat take the same form, even if a portion of the sur- face has a larger flux of vapor on to it and becomes hotter through the release of latent heat, it should lose that extra heat at a correspondingly higher rate, resulting in a constant temperature across the whole particle surface. In practice the thermal conductiv- ity of ice is approximately two orders of magnitude larger than the thermal conductivity of moist air, so that even if there is some surface migration of the wa- ter molecules, the surface temperature should remain almost uniform. The assumption of constant ρ s ,T s motivates an analogy with electrostatics, where the results for the capacitance C are well known for simple geometries (see table 1). However, exact solutions for the non- smooth shapes of natural ice particles are not avail- able, and in numerical models (eg. Wilson and Bal- lard 1999) a capacitance based on one of the shapes in table 1 is usually applied in its place. It is far from clear whether this approximation is a reasonable one, or what the capacitance of realistic ice particles actu- ally is, particularly for large particles which may be complex aggregates. Chiruta and Wang (2003) sug- gested a refinement to this situation by approximat- ing bullet rosette crystals by a set of smooth lobes and 1
Transcript of The capacitance of pristine ice crystals and aggregate ... · PDF fileThe capacitance of...

The capacitance of pristine ice crystals and aggregate snowflakes
Christopher David Westbrook∗, Robin J. Hogan and Anthony J. Illingworth
Department of Meteorology, University of Reading, UK.
May 4, 2007
ABSTRACT
A new method of accurately calculating the capacitance of realistic ice particles is described: such valuesare key to accurate estimates of deposition and evaporation (sublimation) rates in numerical weather models.The trajectories of diffusing water molecules are directly sampled, using random ‘walkers’. By countinghow many of these trajectories intersect the surface of the ice particle (which may be any shape) and howmany escape outside a spherical boundary far from the particle, the capacitance of a number of model iceparticle habits have been estimated, including hexagonal columns and plates, ‘scalene’ columns and plates,bullets, bullet-rosettes, dendrites, and realistic aggregate snowflakes. For ice particles with sharp edges andcorners this method is an efficient and straightforward way of solving Laplace’s equation for the capacitance.Provided that a large enough number of random walkers are used to sample the particle geometry (∼ 104) theauthors expect the calculated capacitances to be accurate to within ∼ 1%. The capacitance for our modelledaggregate snowflakes (C/Dmax = 0.25, normalised by the maximum dimension Dmax) is shown to be inclose agreement with recent aircraft measurements of snowflake sublimation rates. This result shows thatthe capacitance of a sphere (C/Dmax = 0.5) which is commonly used in numerical models, overestimates theevaporation rate of snowflakes by a factor of two.
The effect of vapor ‘screening’ by crystals growing in the vicinity of one another has also been investigated.The results clearly show that neighbouring crystals growing on a filament in cloud chamber experiments canstrongly constrict the vapor supply to each other, and the resulting growth rate measurements may severelyunderestimate the rate for a single crystal in isolation (by a factor of 3 in our model setup).
1. Introduction
The growth and evaporation of ice particles bydiffusion of water vapor on to and away from thesurface of ice particles are fundamental processes forthe development of ice clouds and precipitation. Thedensity of water vapor ρ around a (stationary) iceparticle is governed by Laplace’s equation:
∇2ρ = 0, (1)
under steady-state conditions (Pruppacher and Klett1997). Typically the separation between ice particlesin a cloud is such that each ice particle may be consid-ered in isolation against a background vapor densityρ∞. If the vapor density at the surface ρs is assumedto be constant, this leads to the growth rate:
dm
dt= D
∫
s
∇ρ · ds = 4πDC(ρ∞ − ρs), (2)
by application of Gauss’s law over the particle surfaces, where D is the diffusion coefficient for water vaporin air, and the capacitance C characterizes the shapeand size of the ice particle.
The assumption of constant ρs implies a constantsurface temperature. The temperature Ts at anygiven part of the surface is determined by both the
∗Corresponding author address: Dr. Chris Westbrook, De-partment of Meteorology, University of Reading, Berkshire,RG6 6BB, UK; email [email protected]
flux of vapor on to that part of the crystal, resultingin the release of latent heat; and by the rate at whichthat heat is conducted away from the crystal. Sincethe equations for diffusion of vapor and transport ofheat take the same form, even if a portion of the sur-face has a larger flux of vapor on to it and becomeshotter through the release of latent heat, it shouldlose that extra heat at a correspondingly higher rate,resulting in a constant temperature across the wholeparticle surface. In practice the thermal conductiv-ity of ice is approximately two orders of magnitudelarger than the thermal conductivity of moist air, sothat even if there is some surface migration of the wa-ter molecules, the surface temperature should remainalmost uniform.
The assumption of constant ρs,Ts motivates ananalogy with electrostatics, where the results for thecapacitance C are well known for simple geometries(see table 1). However, exact solutions for the non-smooth shapes of natural ice particles are not avail-able, and in numerical models (eg. Wilson and Bal-lard 1999) a capacitance based on one of the shapesin table 1 is usually applied in its place. It is far fromclear whether this approximation is a reasonable one,or what the capacitance of realistic ice particles actu-ally is, particularly for large particles which may becomplex aggregates. Chiruta and Wang (2003) sug-gested a refinement to this situation by approximat-ing bullet rosette crystals by a set of smooth lobes and
1
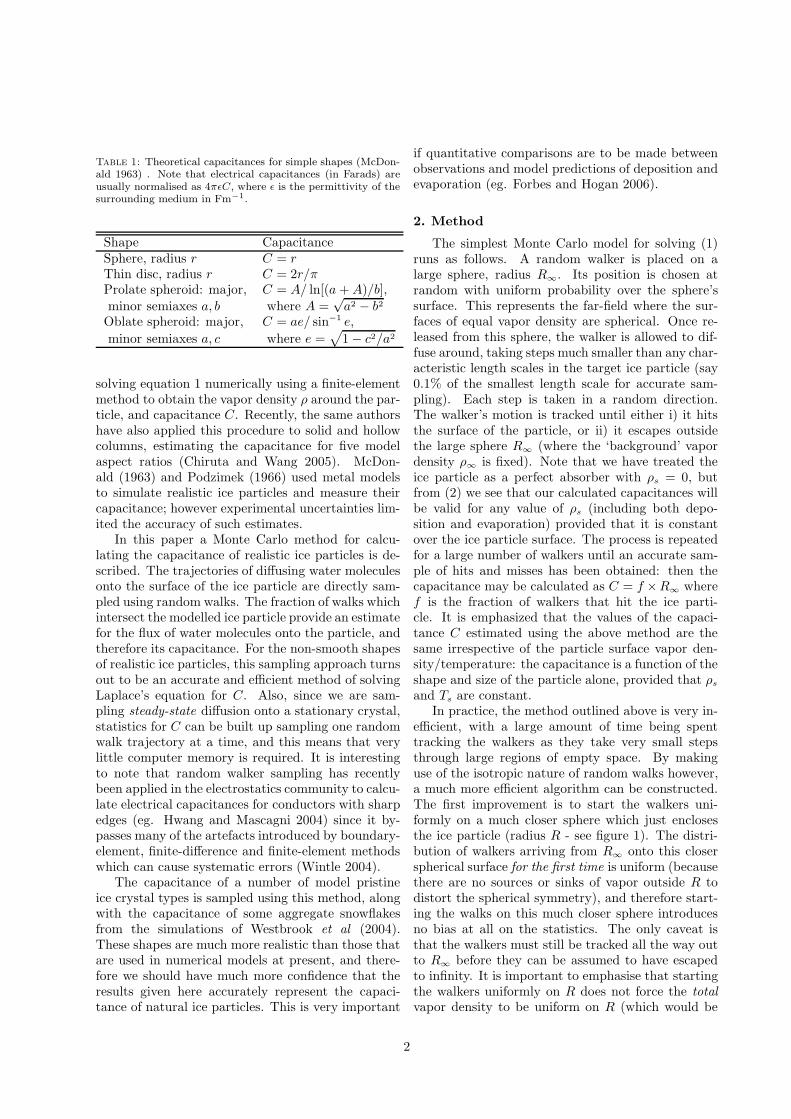
Table 1: Theoretical capacitances for simple shapes (McDon-ald 1963) . Note that electrical capacitances (in Farads) areusually normalised as 4πǫC, where ǫ is the permittivity of thesurrounding medium in Fm−1.
Shape CapacitanceSphere, radius r C = rThin disc, radius r C = 2r/πProlate spheroid: major, C = A/ ln[(a + A)/b],
minor semiaxes a, b where A =√
a2 − b2
Oblate spheroid: major, C = ae/ sin−1 e,
minor semiaxes a, c where e =√
1 − c2/a2
solving equation 1 numerically using a finite-elementmethod to obtain the vapor density ρ around the par-ticle, and capacitance C. Recently, the same authorshave also applied this procedure to solid and hollowcolumns, estimating the capacitance for five modelaspect ratios (Chiruta and Wang 2005). McDon-ald (1963) and Podzimek (1966) used metal modelsto simulate realistic ice particles and measure theircapacitance; however experimental uncertainties lim-ited the accuracy of such estimates.
In this paper a Monte Carlo method for calcu-lating the capacitance of realistic ice particles is de-scribed. The trajectories of diffusing water moleculesonto the surface of the ice particle are directly sam-pled using random walks. The fraction of walks whichintersect the modelled ice particle provide an estimatefor the flux of water molecules onto the particle, andtherefore its capacitance. For the non-smooth shapesof realistic ice particles, this sampling approach turnsout to be an accurate and efficient method of solvingLaplace’s equation for C. Also, since we are sam-pling steady-state diffusion onto a stationary crystal,statistics for C can be built up sampling one randomwalk trajectory at a time, and this means that verylittle computer memory is required. It is interestingto note that random walker sampling has recentlybeen applied in the electrostatics community to calcu-late electrical capacitances for conductors with sharpedges (eg. Hwang and Mascagni 2004) since it by-passes many of the artefacts introduced by boundary-element, finite-difference and finite-element methodswhich can cause systematic errors (Wintle 2004).
The capacitance of a number of model pristineice crystal types is sampled using this method, alongwith the capacitance of some aggregate snowflakesfrom the simulations of Westbrook et al (2004).These shapes are much more realistic than those thatare used in numerical models at present, and there-fore we should have much more confidence that theresults given here accurately represent the capaci-tance of natural ice particles. This is very important
if quantitative comparisons are to be made betweenobservations and model predictions of deposition andevaporation (eg. Forbes and Hogan 2006).
2. Method
The simplest Monte Carlo model for solving (1)runs as follows. A random walker is placed on alarge sphere, radius R∞. Its position is chosen atrandom with uniform probability over the sphere’ssurface. This represents the far-field where the sur-faces of equal vapor density are spherical. Once re-leased from this sphere, the walker is allowed to dif-fuse around, taking steps much smaller than any char-acteristic length scales in the target ice particle (say0.1% of the smallest length scale for accurate sam-pling). Each step is taken in a random direction.The walker’s motion is tracked until either i) it hitsthe surface of the particle, or ii) it escapes outsidethe large sphere R∞ (where the ‘background’ vapordensity ρ∞ is fixed). Note that we have treated theice particle as a perfect absorber with ρs = 0, butfrom (2) we see that our calculated capacitances willbe valid for any value of ρs (including both depo-sition and evaporation) provided that it is constantover the ice particle surface. The process is repeatedfor a large number of walkers until an accurate sam-ple of hits and misses has been obtained: then thecapacitance may be calculated as C = f ×R∞ wheref is the fraction of walkers that hit the ice parti-cle. It is emphasized that the values of the capaci-tance C estimated using the above method are thesame irrespective of the particle surface vapor den-sity/temperature: the capacitance is a function of theshape and size of the particle alone, provided that ρs
and Ts are constant.In practice, the method outlined above is very in-
efficient, with a large amount of time being spenttracking the walkers as they take very small stepsthrough large regions of empty space. By makinguse of the isotropic nature of random walks however,a much more efficient algorithm can be constructed.The first improvement is to start the walkers uni-formly on a much closer sphere which just enclosesthe ice particle (radius R - see figure 1). The distri-bution of walkers arriving from R∞ onto this closerspherical surface for the first time is uniform (becausethere are no sources or sinks of vapor outside R todistort the spherical symmetry), and therefore start-ing the walks on this much closer sphere introducesno bias at all on the statistics. The only caveat isthat the walkers must still be tracked all the way outto R∞ before they can be assumed to have escapedto infinity. It is important to emphasise that startingthe walkers uniformly on R does not force the total
vapor density to be uniform on R (which would be
2

Fig. 1: Diagram illustrating the random walker method.Walkers start from the sphere R enclosing the particle, andare tracked along a random walk until they i) hit the particle,or ii) escape beyond a distant spherical outer boundary R∞.Note that outside R the walker is able to take big jumps with-out any change in its statistics; inside R, the walkers can takea jump equal to the distance to the closest point on the sur-face of the ice particle. In both cases the jumps are in randomdirections.
incorrect). We simply make use of the statistical factthat walkers arriving from R∞ and passing throughthe surface R for the first time do so randomly anduniformly. The total vapor density on R is very muchnon-uniform, and is distorted by the non-spherical iceparticle, which asserts its shape through the statisticsof which of the trajectories that pass through R ac-tually hit the particle directly, and which trajectoriesescape to pass through the surface of R again (andperhaps several times) before hitting the particle orescaping to infinity.
As discussed above, although each walker startson R it must be tracked back to R∞ before it isassumed to have escaped to infinity (otherwise wewould be forcing the vapor density to be uniform onR rather than on R∞). Tracking walkers as they moveoutside of R is not a great burden however: the walk-ers may take large steps (as large as the shortest dis-tance back to the sphere R) in a random directionsince there are no sources or sinks of vapor withinthat distance and therefore the probability distribu-tion for the new position of the walker is isotropic(and would be even if the walker took a series of verysmall steps in random directions to travel the samelinear distance).
While the random walker is inside R we must bemore careful. We can still optimize the step length
however, by calculating the minimum distance fromthe walker’s current position to the closest point onthe ice particle, and setting this distance to be thelength of the next step. The walker is assumed tohave hit the ice particle if it comes within some smalldistance δ of one of the surfaces. The improvementsdescribed above result in a much more efficient al-gorithm, and importantly no extra approximationshave been made. As before, the process is repeatedfor a large number of walkers so that the particle’sgeometry is accurately sampled, and the capacitanceis given by C = f × R.
The accuracy of the method is determined bythree factors: i) the number of walkers used; ii) howfar away the ‘infinite’ boundary R∞ is placed; andiii) the thickness of the thin absorbing layer δ. Inthe calculations presented here the outer boundaryis placed at R∞ = 500R, and the absorption layerthickness δ is set to be less than 0.1% of the smallestside length of any of the faces on the particle. Thereare alternative methods that bypass the constructionof such a layer (Mascagni and Hwang 2003); how-ever, for our purposes, simply using a small value ofδ should be sufficient. To test the accuracy of themethod, the capacitance of a unit cube has been cal-culated, which is known to within a tolerance of 10−7
(Hwang and Mascagni 2004). Provided a large num-ber of walkers are used (> 104), the calculation usingthe method described above shows excellent agree-ment to well within 1% of this value, as shown in fig-ure 2. Sensitivity tests indicate that increasing R∞
to a value of 1000R has no effect on the estimatedcapacitance to within ∼ 0.1%1.
The algorithm has also been tested against par-ticles where the analytic solution is known (see ta-ble 1). For a thin circular disc with unit radius andthickness of 0.001, the capacitance is estimated to beC = 0.639, which matches the exact analytical re-sult for an infinitely thin disc (C = 2/π = 0.637) towithin 1%. For a unit sphere we find that our methodalso agrees with the theoretical value (C = 1) to wellwithin 1%. In both cases 104 walkers were used.
3. Results
Having established that the method is accurate,we proceed to apply it to a number of model ice par-ticle habits, and the results of this are described be-low.
1We note that it is in fact possible to use the Green’s func-tion for a point charge outside a grounded sphere to effectivelyplace the outer boundary at infinity, removing this source oferror entirely. This approach also removes the need to trackthe walkers outside of R: see Zhou et al (1994) for details.
3

102
103
104
105
0.5
0.55
0.6
0.65
0.7
0.75
0.8
0.85
0.9
Number of walkers
Cap
acita
nce
Fig. 2: Capacitance of unit cube as sampled by an increasingnumber of random walkers. Dashed line shows the theoreti-cal value of 0.6607 (to 4 d.p.) as calculated by Hwang andMascagni (2004). The outer boundary was set at R∞ = 500R,and the thickness of the absorption layer was δ = 0.001 (0.1%of the side length).
a. Hexagonal columns and plates
Close to cloud top, one of the most common pris-tine ice crystal habits is the hexagonal prism (Prup-pacher and Klett 1997). Here the random walkermethod has been used to calculate the capacitance ofthese shapes, and two examples of this kind of crys-tal (a column and a plate) are shown in figure 3. Wedefine the width 2a to be the maximum span acrossthe basal (hexagonal) crystal face, and the length Las the span of the crystal perpendicular to the basalface. The aspect ratio of the crystal is defined asA = L/2a, ie. columns correspond to A > 1, platesto A < 1.
The capacitance of each crystal was sampledby 250,000 walkers, each simulation taking approx-imately three minutes on a typical desktop PC. Theconvergence of the sampled capacitances with thenumber of walkers used was consistent with that fora cube, and as a result we estimate that the resultsgiven here for C are accurate to within ∼ 1%. Thedistribution of random walkers incident on the facesof a column are shown in side projection in figure 4:as one would expect from equation 1, walkers impacton the particle all across the surface, but are stronglyconcentrated around the particle edges which showup as strong dark lines on the figure, reflecting thehigh flux of vapor |∇ρ| on to these regions.
Figure 5 shows the capacitance of hexagonalprisms calculated for a constant width (a = 1), wherethe aspect ratio is varied between 0.01 and 50. Theequation:
C = 0.58 (1 + 0.95A0.75) a (3)
Fig. 3: Geometry of pristine hexagonal column and plate iceparticles. Width 2a defined as maximum span across basal(hexagonal) face; length L is the thickness of the plate, orlength of the column (ie. the maximum span of the particle inthe direction perpendicular to the basal face).
Fig. 4: Impact positions of random walkers from our simu-lations onto the surface of a hexagonal column, as viewed inprojection from the side. The flux of walkers is highest onthe sharp edges and corners of the particle, where the vapordensity gradient is largest.
closely approximates the data points (to within 1%)and this curve is overlaid in figure 5 for comparison.
It is common in modelling studies to approximatehexagonal prism type particles as spheroids or circu-lar cylinders. The capacitance for a spheroid withmajor and minor axes matched to the length andmaximal basal span of the hexagonal crystal is shownin figure 5, and there is reasonable agreement over therange of aspect ratios considered here to within 15%.Similarly, Smythe (1962) calculated the capacitanceof a circular cylinder with diameter 2acyl and lengthL as:
C = 0.637(1 + 0.868A0.76)acyl. (4)
It is interesting to note the similar form of equations3 and 4. According to Smythe, (4) is accurate towithin 0.2% for aspect ratios between A = 0 and
4

0.01 0.1 1 10 100
Aspect ratio = L/2a
1
2
3
4
5
6
7
8
9
10
Nor
mal
ised
cap
acita
nce
C/a
0.58(1+0.95A )Chiruta & Wang (2005) fitSpheroidCircular Cylinder (Smyth 1962)Podzimek (1966)Random walker data points
PLATES COLUMNS
0.75
Fig. 5: Capacitance of hexagonal columns and plates with as-pect ratios between A = 0.01 (thin plates) and A = 50 (thincolumns). Diamonds are data points from our calculations inunits of a. Solid line is fitted curve C/a = 0.58(1+0.95A0.75).Dashed line shows the fit suggested by Chiruta and Wang(2005). Dotted curve is the capacitance of a spheroid withmajor and minor axes chosen to match the length L and basalspan 2a of the crystal. Grey line is the capacitance of a circu-lar cylinder of radius a and length L as calculated by Smyth(1962). Cross indicates the metal-model result from the exper-iment of Podzimek (1966).
A = 8. Comparison shows that the hexagonal prismdata lies between the capacitance of a circumscribedcylinder (diameter 2a, length L) and an inscribedcylinder (diameter
√3a, length L), as one would ex-
pect since these cases consitute rigid upper and lowerbounds for C (see appendix A). The curve for the cir-cumscribed cylinder is plotted in figure 5.
Also plotted on figure 5 is the fitted curve derivedfor hexagonal columns and plates by Chiruta andWang (2005) using a finite-element method. Theirlinear fit C = (0.751 + 0.491A)a is 10–25% higherthan our data points over the range of aspect ra-tios which they considered (A = 0.2–3.33), indicat-ing that their results are overestimates. Their fit isalso higher than that for an enclosing circular cylin-der, confirming that their data points are erroneouslyhigh (see appendix A). We note that although theircapacitances are overestimates, Chiruta and Wang’smain conclusion that solid and hollow columns havealmost identical capacitances to one another is stilllikely to be correct, and this is in keeping with metalmodel measurements (Podzimek 1966).
The metal model experiments of McDonald (1963)and Podzimek (1966) allowed estimates of the capac-itance to be made for hexagonal columns and plates.However there were significant sources of error in
these experiments, and the results should be treatedwith care. Podzimek used an electrolytic tank to es-timate the capacitance of a metal hexagonal columnwith L = 50mm and 2a = 19mm (corresponding toA = 2.63), and measured that C = 19.5mm, ie. anormalised capacitance of C/a = 2.05 in apparentagreement with Chiruta and Wang’s results. Unfor-tunately, Podzimek reported a systematic bias of ap-proximately +20% in his experiments (this was esti-mated by comparing the measured value for a thincircular disc with the theoretical value from table 1).To resolve this problem, he measured the capacitancefor a metal model of a spheroid with the same widthand length, and calculated the ratio of the measuredcolumn and spheroid capacitances. This ratio (1.116)was then assumed to be the same as the ratio of thetrue capacitances, and using the formula in table 1he deduced that C/a = 1.67. This point is plottedon figure 5, and is in good agreement with our fittedcurve (C/a = 1.72).
Similar experimental difficulties were encounteredby McDonald (1963) who placed his metal modelsinside a walk-in Faraday cage and estimated the ca-pacitance of the arrangement. The connecting leadfrom the model to the capacitance meter shorted outmany of the field lines which should have led fromthe Faraday cage to the model. This led to C beingunderestimated by as much as 45% for a thin circu-lar disc. His resolution of this problem was the sameas that of Podzimek, and the ratio of the measuredcapacitance of the non-smooth models was estimatedrelative to idealised shapes. From these measured ra-tios, McDonald estimated that a hexagonal plate hasa similar capacitance to that of an equivalent-area cir-cular disc. This is consistent with the data presentedhere: our fit (3) predicts the capacitance of a hexag-onal plate of zero thickness to be C = 0.58a, whilstan equal-area circular disc has the almost identicalcapacitance of C = 0.579a.
b. ‘Scalene’ columns and plates
It has been observed (Bailey and Hallett 2004)that the basal faces of columns and plates are notalways perfect regular hexagons, but are often some-what distorted. Here the capacitance of two so-called‘scalene’ forms similar to those reported in that paperis calculated, and the impact of breaking the perfecthexagonal symmetry is assessed. The shapes of themodel scalene basal faces considered here are shownin figure 6. In both cases the maximum span acrossthe basal face is defined as 2a, and the aspect ratio A
is defined as before. The capacitances of these scalenecrystals have been calculated for three aspect ratios:A = 0.1, A = 1 and A = 10, and the results com-pared with a perfect hexagonal crystal of the same
5

Fig. 6: Geometry of basal faces for the distorted or ‘scalene’hexagonal columns and plates. For both types the maximumspan across the basal face is defined as 2a and all of the inter-nal angles are 120◦. The model shapes are: (a) a ‘flattened’hexagon with 4 short sides and 2 longer sides; (b) a secondscalene type with 3 short sides and 3 longer sides.
maximum basal span and length.The basal face of the first scalene crystal is a ‘flat-
tened’ hexagon, with 4 short sides and 2 longer sides,and a width perpendicular to the maximum basalspan of a (compared to
√3a for a regular hexagon).
The internal angles are all 120◦. For A = 0.1, C isreduced by approximately 15% relative to a regularhexagonal plate; for A = 1 the reduction is ∼ 10%,and for a column with A = 10 it is only 5%.
The second model scalene crystal type has 3 shortsides and 3 long sides, with a span between oppositesides of
√3a (the same as for a regular hexagon). For
this type it was found that C is essentially identical toa regular column/plate for all three aspect ratios, towithin 3%. We conclude that distortion of the hexag-onal geometry of the crystals has a relatively smallimpact on their capacitance, and the only significantdifference in the growth/evaporation rates is likely tobe from surface migration and molecular accomoda-tion effects which are not included here.
c. Bullets and bullet-rosettes
Bullets and bullet-rosettes are one of the mostcommon crystal habits in cirrus clouds (Heymsfieldand Iaquinta 2000). Here we consider some simplemodel bullets and bullet-rosettes as illustrated in fig-ure 7. The bullets are modelled by a hexagonal col-umn of length L, width 2a, with a hexagon-basedpyramid attached to one end. The ratio of the heightof the pyramid cap relative to the column length isdenoted by P , and in what follows we will assume avalue of P = 1
2. The aspect ratio of the columnar
section of the bullet A = L/2a, is defined as before.The capacitance of single bullets with different
Fig. 7: Model geometry for: a) single bullet, b) 2-rosette, c)4-rosette and d) 6-rosette crystal types.
thicknesses corresponding to aspect ratios A between1 and 10 was calculated. The measured capacitancesare plotted in figure 8. Equation 3 for hexagonalcolumns of the same width (= 2a) and total length(= L+PL) is also plotted on the figure. Comparisonbetween the two shows that our model bullets have acapacitance which is reduced by a uniform 10% com-pared to that of a column. Reducing the size of thepyramid cap to P = 1
4(following Macke et al 1996) it
was found the capacitance is only 5% lower than thatthe complete column, and further reductions in P re-sult in an asymptotic approach to the capacitance ofa simple column.
Three model rosettes were constructed, and theseare also illustrated in figure 7. The ‘2-rosette’ is sim-ply a linear combination of the two bullets, joined atthe tip. Calculations for a range of aspect ratios inthe range A = 1 to 10 indicate that the capacitanceof the 2-rosette is reduced by 10–15% relative to asolid column of the same overall length and breadth,which seems reasonable given its geometry.
The ‘4-rosette’ has 4 bullets lying in a plane, eachneighbouring bullet separated by 90◦. Due to themore complex geometry of this crystal shape, its ca-pacitance has been normalized relative to the maxi-mum dimension Dmax (rather than the bullet width).Calculations have been performed for a variety of as-pect ratios: these values are shown in figure 9. Thecurve:
C = 0.35A−0.27Dmax, (5)
was fitted to the data, and appears to provide a closeapproximation to it. Also shown in figure 9 is the ca-pacitance of an oblate spheroid with major and mi-nor axes matched to the overall dimensions of therosette (major axis = 2L + 2LP , minor axis = 2a)and this curve overestimates the capacitance quite
6

1 2 3 4 5 6 7 8 9 10
Aspect ratio = L/2a
0.5
1
1.5
2
2.5
3
3.5
Nor
mal
ised
cap
acita
nce
C/a
Fig. 8: Capacitance of single bullet crystals as a function ofaspect ratio. Diamonds are data points from our calculationsin units of a. Dashed line shows equation 3 for hexagonalcolumns of the same width and total length as the bullet; solidline is that curve reduced by 10%.
severely except when the aspect ratio of the bullets isclose to unity. The capacitance for a circular disc anda sphere of equal maximum dimension are also shownon the figure for comparison. The value for a disc isa close approximation for A ≃ 1.5, but increasinglyoverestimates C as A increases. The capacitance ofthe sphere is a strong overestimate, typically a factorof two larger than the rosette.
The final model crystal is a ‘6-rosette’ made ofsix bullets in a three-dimensional cross shape, eachseperated from its neighbours by an angle of 90◦. Thedata for this rosette is also shown in figure 9 and thecapacitances are approximately 15% higher than forthe 4-bullet rosette. A curve was fitted to this data,and it was found that:
C = 0.40A−0.25Dmax (6)
is a good approximation to it. Again, a sphere ofthe same maximum dimension strongly overestimatesthe capacitance at all aspect ratios; a disc providesa closer approximation, but still overestimates thecapacitance at large aspect ratios (thin arms).
The results above for four- and six-arm rosetteswith A ≃ 1.5 are consistent with the idealised rosettesmodelled by Chiruta and Wang (2003). They used aseries of smooth lobes to represent each bullet andshowed that rosettes with four and six arms had acapacitance broadly similar to that of a circular discwith the same maximum dimension. An importantfeature of the new results presented here is that the
1 2 3 4 5 6 7 8 9 10
Aspect ratio = L/2a
0
0.1
0.2
0.3
0.4
0.5
Nor
mal
ised
Cap
acita
nce
C/D
max
solid sphere
disc
oblate spheroid
Fig. 9: Capacitance of bullet-rosette crystals as a function ofthe aspect ratio of the arms A = L/2a. The capacitances arenormalised relative to the maximum dimension of the rosetteDmax. Diamonds are the sampled values of C for the 4-armrosette; crosses are the values for the 6-arm rosette. Solid blackand gray lines are the respective fitted curves (see text). Thedashed line indicates C for a sphere of the same maximumdimension; the dotted line shows value for a thin disc. Thecapacitance of an oblate spheroid with a major axis of 2L+2LPand minor axis of 2a is shown by the dash-dot line.
capacitance of bullet rosettes is sensitive not onlyto the number of arms, but also to the width ofthose arms. The aspect ratio of the bullets makingup real ice rosettes (as observed by in-situ imaging,eg. Heymsfield et al 2002) is often rather larger thanA = 1.5 and this means that the value of C may infact be somewhat lower than that of a disc (∼ 20%less for a four-arm rosette with A = 3).
d. Stellar and Dendrite crystals
Two model stellar/dendrite crystal types wereconstructed. The first was a simple six-armed starshape, where each arm is a ‘flattened’ hexagonal platesimilar to those described in section (3b). Each ofthese arms is separated from its neighbours by anangle of 60◦. The arms overlap at the centre of thecrystal, and the internal angles of the arms are all120◦. The span between the tips of two oppositearms is defined as 2a, and the thickness is fixed as(2a)/100. The width of the arms is characterised bythe ratio A
′ = w/a which we define as the ratio ofthe separation between the two longest sides of thehexagon w (ie. the arm width) to the arm lengtha. These dimensions are marked on figure 10, whichshows the distribution of impacting walkers for a starcrystal with A
′ = 0.2.
7

Fig. 10: Distribution of walkers impacting on the surface ofstar-type crystal (top) and dendrite with secondary branches(bottom).
The capacitance of these star crystals is plotted asa function of the width of the arms in figure 11. Fora star with thin arms (A′ = 0.02) the capacitance is40% lower than a hexagonal plate of the same overalldimensions (= 0.596a for a plate of thickness 2a/100).As the arms become thicker, the capacitance rises andasymptotically approaches the value for a solid plate.The curve:
C = 0.596(1− 0.38e−4.7A′
)a, (7)
is also plotted in figure 11 and approximates the datato within a few percent.
The second model is an adaptation of the starmodel above, where a pair of secondary brancheshas been added to each arm, each with one thirdthe dimensions of the main arms. These secondarybranches are positioned with one end at the centreof the main arm, and oriented at an angle of 60◦ oneither side of it. Figure 10 also shows the distribu-tion of impacting walkers on this crystal type, withA
′ = 0.05.The capacitance of this model crystal was calcu-
lated for different arm thicknesses, and the data isshown alongside the results for the star shapes in fig-
0 0.1 0.2 0.3 0.4
Arm aspect ratio A’
0
0.05
0.1
0.15
0.2
0.25
0.3
0.35
0.4
0.45
0.5
0.55
0.6
0.65
Nor
mal
ised
cap
acita
nce
C/a
solid hexagonal plate
Fig. 11: Capacitance of stellar/dendrite crystal types. Di-amonds are for simple star shapes, crosses are for branchedtypes. The capacitance of a solid hexagonal plate of the sameoverall dimensions is indicated by the dotted line. Dashed andsolid lines are fitted curves for star and branched crystal datarespectively (see text).
ure 11. Adding the branches increases the capac-itance somewhat for dendrites with thin arms (forA
′ = 0.05 the branched dendrite has a capacitance∼ 15% larger than a star). As the branches becomethicker they approach the value for a solid plate. Thecurve:
C = 0.596(1 − 0.30e−5.8A′
)a, (8)
is a reasonable fit to the data, and this function ap-proaches the solid plate limit somewhat faster thanthe simple star crystal.
e. Aggregates
In this section we consider aggregates of the aboveice crystal types. Aggregates are often the domi-nant particle habit in deep non-precipitating cirrusclouds (Field and Heymsfield 2003, Westbrook et al
2006), as well as in snowstorms (Jiusto and Weick-mann 1973). A recent theoretical model of ice crys-tal aggregation (Westbrook et al 2004) has allowedus to produce large samples of realistic ‘synthetic’ice aggregates. We have calculated the capacitanceof these synthetic snowflakes in the expectation thatthe results ought to be a good approximation to thecapacitance of natural ice aggregates.
The random walker method was applied to ∼ 1000synthetic aggregates sampled from the simulations ofWestbrook et al (2004): a few examples are shownin figure 12. We have calculated the average capac-itance of the synthetic aggregates, using 103 walkers
8

Fig. 12: Examples of aggregates made up of 2,4,10 and 32hexagonal columns, sampled from the simulations of West-brook et al (2004). The aspect ratio of the columns is A = 4.
to sample each individual aggregate. We note thatthis is a smaller number of walkers than was usedfor the pristine ice crystal habits; however, the com-putational cost is increased for complex shapes, andwe are averaging the results over many realisations ofthe aggregate geometry (every aggregate snowflake isdifferent), so we expect that our eventual statisticsshould be accurate. In any case the results for theunit cube in section 2 indicate that the error in thecalculated values for each individual aggregate shouldbe less than 10%.
For each aggregate, the ratio of capacitance tomaximum dimension C/Dmax was calculated, and theresults binned and averaged as a function of the num-ber of crystals in the aggregate: this is shown in figure13. The ‘monomer’ crystals in this case were hexag-onal columns with an aspect ratio of A = 2. The ca-pacitance of the monomer columns is C/Dmax = 0.34(see section 3a), but for an aggregate of just twocolumns this is reduced to 0.21 ± 0.02, since twocolumns stuck together is a much more open geome-try than a single column. As more columns are aggre-gated the normalised capacitance rises to an asymp-totic limit of 0.25 ± 0.02. This value is in strongagreement with recent in-situ aircraft measurementsof aggregate snowflake sublimation made by Field et
al (2007) during a Lagrangian descent through a sub-saturated portion of an ice cloud, where a value ofC/Dmax = 0.26 was estimated.
The calculations described above were repeatedfor different monomer aspect ratios, and this is shownin figure 14. We find that for all the monomer shapesconsidered the normalised capacitance approaches
0 5 10 15 20 25 30
# monomers per aggregate
0
0.05
0.1
0.15
0.2
0.25
0.3
0.35
0.4
0.45
0.5
0.55
Nor
mal
ised
cap
acita
nce
C/D
max
sphere
disc
monomer
aggregates
Fig. 13: Capacitance of aggregate snowflakes as sampled fromthe simulations of Westbrook et al (2004). The monomer crys-tals were hexagonal columns with A = 2. The calculated val-ues of C/Dmax were binned and averaged as a function of thenumber of crystals per aggregate, as shown on the horizon-tal axis. Error bars are one standard deviation, points withno error bar indicate the value for a single aggregate. Thenormalised capacitance asymptotically approaches a value ofC/Dmax ≃ 0.25. Overlaid are theoretical values for a sphere(dashed line) and a thin disc (dotted line) with the same max-imum dimension.
an asymptotic value of between 0.25 (thin columnsA = 8) and 0.28 (squat columns A = 1). The arearatio of these aggregates (the ratio of the particle’sprojected area to the area of a circle of diameterDmax) was measured and was also found to approachan asymptotic value of between 0.1 (A = 8) and 0.35(A = 1).
Changing the monomer crystal type to bullet-rosettes rather than columns is found to have verylittle effect on the capacitance, again yielding asymp-totic values in the same range. This capacitanceis smaller than a disc or sphere of the same maxi-mum dimension, and the implication is that numer-ical models which assume these simple shapes areoverestimating the growth/evaporation rate, by a fac-tor of two in the case of the sphere.
It may perhaps appear counter-intuitive that thecapacitance of aggregates should approach a con-stant value relative to their maximum dimension(C/Dmax = constant). The structure of the aggre-gates approaches a fractal geometry (Westbrook et
al 2004) and as a result becomes increasingly openas the aggregates grow to contain more and moreice crystals. Because of this, the effective densitydecreases with size as (Dmax)−1 (in agreement withexperimental data: Brown and Francis 1995, Heyms-
9

0 5 10 15 20 25 30
# monomers per aggregate
0
0.05
0.1
0.15
0.2
0.25
0.3
0.35
0.4
0.45
0.5
0.55
Nor
mal
ised
cap
acita
nce
C/D
max
sphere
disc
A=1A=2A=4A=8
Fig. 14: The capacitance of aggregates with different monomerratios Abetween 1 and 8. All of the curves approach an asymp-totic value in the range 0.25–0.28.
field et al 2002). One might therefore anticipate thatC/Dmax would be reduced for large aggregates, sincethere is more empty space within a radius Dmax/2 ofthe particle centre, and therefore (one would imag-ine) more opportunity for a water molecule comingwithin that radius to escape. However, the resultsof Ball and Witten (1984) show that water moleculesfollowing a Brownian path are exceptionally efficientat exploring three dimensional space, and because ofthis the ice particle appears essentially opaque to theincident water molecules (i.e. a fixed fraction of thoseventuring within Dmax/2 will be absorbed). As a re-sult, C/Dmax = constant is in fact the physically sen-sible result for aggregates (see appendix B for furtherdetails).
4. Screening
Growth rates derived from laboratory experi-ments such as those of Bailey and Hallett (2004)are usually measured from crystals which grow notin isolation, but surrounded by other growing crys-tals. Screening of one ice crystal by another may bean important effect in light of the above discussionon aggregates, since the diffusing water molecules arevery efficient at exploring the space around the parti-cle, so neighbouring crystals may constrict the vaporsupply to one another. An understanding of suchscreening effects is important if laboratory data areto be accurately interpreted.
For our model setup we consider 8 identical hexag-onal columns with A = 5 in a ‘spiral staircase’ geom-
etry, growing with their longest axis in the horizontaldirection. Neighboring crystals are offset in the ver-tical direction by a column’s width and are rotatedaround the vertical axis by 45◦. This is shown in fig-ure 15 and is roughly modelled after photographs ofthe experimental setup in Bailey and Hallett (2004).The surface vapor density and temperature are as-sumed to be the same on each crystal, and 104 walkerswere used to sample the capacitance of the crystals.It was found that the vapor supply to the innermostcrystals is inhibited to such an extent that their ca-pacitance is reduced to approximately one third ofits value for a single column in isolation (C/a ≃ 0.75compared to 2.41 in isolation). This result demon-strates how sensitive the vapor field around a crys-tal is to other sources/sinks of vapor in the vicinity.It also shows that if the growth rates from experi-ments are to be compared to theoretical capacitances,the crysals must be grown in isolation, or separatedfrom one another as much as possible. Electrody-namic trapping techniques (eg. Swanson et al 1999)where ice particles are levitated in an electric fieldand allowed to grow in isolation may be useful in thisrespect, although to the authors’ knowledge the re-sults have so far been limited to small particles, lessthan 100µm in size.
5. Discussion
The capacitance for pristine ice crystals and ag-gregate snowflakes has been calculated using a newMonte Carlo method, and these new values should bean improvement on the traditional approximations ofsmooth spheroids or discs. Application of these ca-pacitances to estimate the actual growth/evaporationrates requires a prescription for the difference be-tween the surface and the far-field vapor densities(ρs − ρ∞). Using the Clausius-Clapeyron equation,an expression for dm/dt in terms of the supersatura-tion with respect to ice (S − 1) is obtained:
dm
dt= 4πC × S − 1
A + B(9)
where the parameters A(T ) and B(T, P ) are givenin Pruppacher and Klett (1997) and depend on theambient temperature T and pressure P . We believethat the results described in this paper may help toimprove the estimation of growth and evaporationrates calculated in numerical weather prediction andcloud resolving models, especially for spatially ex-tended particles such as bullet rosettes, dendrites andaggregates, where modelling the particle as a simplesphere of the same maximum dimension (eg. Liu et
al 2003, Khain and Sednev 1996) can overestimate|dm/dt| by a factor of 2. This work may be particu-larly valuable to new precipitation models which pre-
10

Fig. 15: Model ‘laboratory’ setup of 8 identical hexagonalcolumn crystals. Each is rotated by an angle of 45◦ about thevertical axis relative to its neighbours, and offset in the verticaldirection by a crystal’s width, in an attempt to model crystalsgrowing on a vertical filament (indicated by the dotted line).The growth rate of the innermost crystals is approximately onethird the growth rate of a column growing in isolation.
dict ice particle habit from the model temperatureand humidity (eg. Woods et al 2006), allowing anappropriate capacitance to be applied for each pre-dicted habit. We note that models which assume thecapacitance of an equivalent volume sphere can leadto errors in C which are size dependent, dependingon the mass-dimension relationship assumed. Usingequivalent volume spheres is an unphysical approachto estimating the capacitance, since C is determinedby the physical dimensions of the particle and notits volume2. Parameterising C in terms of Dmax is amore natural approach since it represents the overalldimension of the particle and is also the parameterusually estimated from aircraft observations.
The key limitation of the present study is thequestion of whether the growth and evaporation ratesof ice crystals are simply dominated by the rate atwhich vapor impinges on/diffuses away from the icecrystal surface, or whether surface effects plays asignificant role in limiting the growth/evaporationrates. For evaporation of ice particles, Nelson (1998)showed that the mass loss rate is controlled by (9)
2We note that the capacitance of an equal volume sphereis always an underestimate for the capacitance of any non-spherical shape (Polya and Szego 1951).
and that surface migration of water molecules canbe neglected, although molecular accomodation mayplay a role for very small, cold crystals (Magee et al
2006). This conclusion appears to be supported byin-situ and laboratory imaging of sublimating ice par-ticles (Korolev and Isaac 2004, Swanson 1999) whichindicate that the vapor flux away from the particlesis concentrated at the corners and edges. This inkeeping with the expectation for evaporation throughbulk diffusion of vapor as described by equation 1without any surface migration. We therefore expectthat equation 9 should be directly applicable to theproblem of calculating the evaporation rates of mostnatural ice particles using the estimates for C pre-sented here.
For deposition the situation is less clear cut: theappearance of the wide variety of different crystalhabits at different temperatures and supersaturationlevels indicates the influence of molecular accomoda-tion and surface migration on the growth. Despitethis, the evidence from a number of experiments isthat equation 9 is a reasonable approximation for thegrowth rate in many cases, although there is stillmuch uncertainty as to the influence of molecularaccomodation on growth rate at different tempera-tures and crystal sizes as summarised in Magee et
al (2006), Fukuta and Takahashi (1999) and Prup-pacher and Klett (1997); in particular, poor accomo-dation of impinging vapour may be rather importantfor small, cold crystals. For frozen drops, laboratorymeasurements (Korolev et al 2004) have shown goodagreement with (9). The new capacitance results pre-sented in this paper should allow a more accuratecomparison to be made between theory and experi-mental data than has previously been possible, andmay help experimentalists to estimate the ‘accomo-dation coefficient’ of complex ice crystals.
Bailey and Hallett (2004) compared the growthrates of laboratory-grown plate and column crystalsgrown over a temperature range of −20 to −70◦Cto the growth rate calculated using (9), modellingtheir lab crystals as spheroids (which our results indi-cate should be a reasonable approximation to within15%). Their results indicated that the predictedgrowth rates were only consistent with the measuredvalues for aspect ratios close to A ≃ 1: for moreextreme aspect ratios the theoretical values were asmuch as a factor of four too large for thin columns,and a factor of eight too large for thin plates. Thismay imply that the water molecules cannot be eas-ily accommodated at these low temperatures. Baileyand Hallett argue that because of the discrepancybetween predicted and measured growth rates, thewhole ‘electrostatic’ approach is unsuitable for cal-culating deposition rates at cold temperatures, and
11

they recommend that laboratory-measured growthrates should be used instead. However, the sensitiv-ity of (1) to screening as discussed in section 4 showthat their measured growth rates may be strongly af-fected by neighbouring crystals, restricting the vaporsupply, and reducing the measured capacitance sig-nificantly (a factor of 3 in our model setup). Thismay explain, at least in part, why their estimatedgrowth rates are so much lower than equation 9 pre-dicts. The supporting glass filament may also playa screening role, particularly for thin columns wherethe filament thickness (50–70µm) is the same size orlarger than the basal faces of the crystals. On theother hand, the thermal conductivity of this filamentis much higher than the surrounding air, enhancingheat conduction and increasing the growth rate, lead-ing to further uncertainties. The interpretation oflaboratory measured growth rates, and their use inevaluating the accuracy of theoretical models there-fore requires a great deal of care, and this is an issuewhere more experiments and theoretical work are ur-gently required to inform such comparisons.
A key limitation of capacitance theory is thatit is unable to make any prediction about particlehabit, and a particular shape must be assumed a
priori. Growth under equation 1 with the (moving)boundary condition ρ = constant at the surface is amuch studied problem in theoretical physics: if thewater molecules are simply deposited according tothe distribution of vapor flux over the particle sur-face (eg. figure 4) the growth is unstable (Langer1980, Mullins and Sekerka 1963) and fern-like frac-tal patterns emerge (eg. Witten and Sander 1981,Bowler and Ball 2005; for a general review see Sander2000). That ice crystals grow in a much more con-trolled way indicates the influence that surface dif-fusion and the anisotropic molecular accommodationof the impinging water vapor have on the particlegrowth. It seems likely that dendrite crystals are acase in point, with their fern-like structure indicativeof unstable growth, and the broad six-fold symmetryindicating the influence of the underlying crystallineanisotropy. This has recently been modelled usinga crude anisotropy parameter by Goold et al (2005)to produce fractal dendrites with hexagonal symme-try. Progress in producing theoretical models whichpredict habit may well follow this approach, usingquantitative data for the anisotropic molecular acco-modation coefficient and surface migration effects atdifferent temperatures and supersaturations.
The capacitance of realistic ice aggregates hasbeen calculated for the first time (to the authors’knowledge), and the results are in close agreementwith those estimated by Field et al (2007) from in-situ aircraft observations of evaporating ice aggre-
gates, again indicating that (9) is a good approxi-mation for sublimating ice particles. It should benoted that the correction for the enhancement of theevaporation due to ventilation was estimated usingformulas for idealised shapes (Hall and Pruppacher1976) and this introduces some uncertainty into thecomparison. However, since a more accurate estima-tion of the ventilation effect would require a detailedtreatment of the flow pattern around the aggregates,this value is at present the most accurate estimate ofC that it is currently possible to make from aircraftobservations.
The authors believe that the capacitances pre-sented here are, in any case, the best estimates cur-rently available for the growth and evaporation ofrealistic ice crystals and snowflakes within the frame-work of the electrostatic analogy.
Appendix A
Here we show that the capacitance of a hexago-nal column with width 2a and length L (see figure3) must be less than that of a circular cylinder ofdiameter 2a and length L.
Let the surface vapor density be ρs = 0 on thesurface of the hexagonal column. Consider the fluxof vapor through a cylindrical surface Scyl with theabove dimensions, just enclosing the column. Thenet flux of vapor Φnet through this surface must bethe same as that onto the surface of the column sincethere are no other sinks of vapor present within theenclosed volume.
As figure 16 illustrates, the flux can be split intotwo components: Φnet = Φcyl − Φescaped. The fluxof water molecules incident from the outer boundaryonto Scyl for the first time is simply given by the fluxonto a perfectly absorbing cylinder of the same di-mensions Φcyl = 4πDρ∞Ccyl (since this correspondsto every water molecule trajectory being terminatedat the point it first intersects Scyl). The value ofCcyl is given by equation 4. Subtracted from this isthe flux of water molecules which pass through Scyl
but are not absorbed by the hexagonal prism and es-cape to infinity = Φescaped. Since this latter flux isfinite, Φnet < Φcyl, and by Gauss’s law C < Ccyl,ie. the capacitance of a hexagonal prism is lowerthan that of an enclosing circular cylinder. By thesame argument it follows that a circular cylinder ofdiameter
√3a must have a lower capacitance than
the hexagonal prism which it inscribes. This allowsthe construction of upper and lower bounds on thecapacitance of a hexagonal prism using the results ofSmythe (1962). The violation of the upper bound byChiruta and Wang’s (2005) results shows that theirdata are overestimates.
12

Fig. 16: Cylindrical surface (dashed line) just enclosing ahexagonal prism (solid line), viewed in projection from oneend. A trajectory which passes through the cylindrical sur-face and is absorbed on the hexagonal prism is illustrated; alsoshown is a trajectory which passes through the cylindrical sur-face but escapes again and is not absorbed.
Appendix B
Here we show that C/Dmax is a function only ofthe shape of an ice aggregate, and not its size. Imag-ine that the particle is removed and it is replacedwith a ‘ghost’ particle which is completely transpar-ent to the diffusing water molecules. The averagewater molecule follows a Brownian trajectory, trac-ing a fractal path with dimension dw = 2 (Falconer2003). This means that whilst the water molecule iswithin a distance Dmax/2 of the ghost particle centre,the resulting path fills a volume ∝ (Dmax)dw . Theghost particle on the other hand, occupies a volume∝ (Dmax)di , with di ≃ 2 for our aggregates.
Since dw + di > 3, the points where the particleand the uninterrupted random walk intersect withone another occupy a volume ∝ (Dmax)3. Because ofthis, the aggregates appear essentially opaque to thediffusing water molecules, in the sense that for a givenmonomer type, a fixed fraction of the molecules whichventure within a radius Dmax/2 will come into con-tact with the ice particle. The ratio C/Dmax simplyrepresents this fraction, and is therefore independentof size.
Acknowledgements
This work was funded by the Naturaland Environmental Research Council (grantNER/Z/2003/00643). CDW acknowledges help-ful discussions with Mihai Chiruta, Paul Field
(NCAR) and Richard Forbes (Met Office).
REFERENCES
Bailey, M. and J. Hallett 2004: Growth rates and habits
of ice crystals between −20◦C and −70◦C. J. Atmos.
Sci., 61, 514–544
Ball, R. C. and T. A. Witten 1984: Causality bound on
the density of aggregates. Phys. Rev. A, 29, 2966–2967
Bowler, N. E. and R. C. Ball 2005: Off-lattice noise
reduced diffusion-limited aggregation in three dimen-
sions. Phys. Rev. E, 71, 011403
Brown, P. R. A. and P. N. Francis 1995: Improved mea-
surements of the ice water content of cirrus using an
evaporative technique. J. Atmos. & Ocean. Tech., 10,
579–590
Chiruta, M. and P. K. Wang 2003: The capacitance of
rosette ice crystals. J. Atmos. Sci., 60, 836–846
Chiruta, M. and P. K. Wang 2005: The capacitance of
solid and hollow hexagonal ice columns. Geophys. Res.
Lett., 32, L05803
Falconer, K. 2003, Fractal Geometry: Mathematical
Foundations and Applications, 2nd Edition, John Wi-
ley & sons, London.
Field, P. R. and A. J. Heymsfield 2003: Aggregation and
scaling of ice crystal size distributions. J. Atmos. Sci.,
60, 544–560
Field, P. R., A. J. Heymsfield and C. H. Twohy 2007:
Determination of the combined ventilation factor and
capacitance for ice crystal aggregates from airborne ob-
servations in a tropical anvil cloud. Submitted to J.
Atmos. Sci.
Forbes, R. M. and R. J. Hogan 2006: Observations of the
depth of ice particle evaporation beneath frontal cloud
to improve NWP modelling. Q. J. R. Meteorol. Soc.,
132, 865–883
Fukuta, N. and T. Takahashi 1999: The growth of atmo-
spheric ice crystals: a summary of findings in vertical
supercooled cloud tunnel studies. J. Atmos. Sci., 56,
1964–1979
Goold, N. R., E. Somfai and R. C. Ball 2005: Anisotropic
diffusion-limited aggregation in three dimensions: uni-
versality and nonuniversality. Phys. Rev. E, 72, 031403
Hall, W. D. and H. R. Pruppacher 1976: The survival of
ice particles falling from cirrus clouds in subsaturated
air. J. Atmos. Sci., 33, 1995–2006
Heymsfield, A. J. and J. Iaquinta 2000: Cirrus crystal
terminal velocities. J. Atmos. Sci., 57, 916–938
13
Heymsfield, A. J., S. Lewis, A. Bansemer, J. Iaquinta,
L. M. Miloshevich, M. Kajikawa, C. Twohy and M. R.
Poellot 2002: A general approach for deriving the prop-
erties of cirrus and stratiform ice particles. J. Atmos.
Sci., 60, 1795–1808.
Hwang, C.-O. and M. Mascagni 2004: Electrical capaci-
tance of the unit cube. J. Appl. Phys., 95, 3798–3802
Jiusto, J. E. and H. K. Weickmann 1973: Types of snow-
fall. Bull. Amer. Met. Soc., 54, 1148–1162
Khain, A. P. and I. Sednev 1996: Simulation of precipita-
tion formation in the Eastern Mediterranean coastal
zone using a spectral microphysics cloud ensemble
model Atmos. Res., 43, 77–110
Korolev, A. and G. A. Isaac 2004: Observations of subli-
mating ice particles in clouds. Proceedings of the 14th
International Conference on Clouds and Precipitation,
808–811
Korolev, A., M. P. Bailey, J. Hallett and G. A. Isaac
2004: Laboratory and in-situ observations of deposition
growth of frozen drops. J. Appl. Met., 43 612–622
Langer, J. S. 1980: Instabilities and pattern formation in
crystal growth. Rev. Mod. Phys., 52, 1–28
Liu, H.-C., P. K. Wang and R. E. Schlesinger 2003: A
numerical study of cirrus clouds. Part I: Model descrip-
tion. J. Atmos. Sci., 60, 1075–1084
Macke, A., J. Mueller and E. Raschke 1996: Single scat-
tering properties of atmospheric ice crystals. J. Atmos.
Sci., 53, 2813–2825
Magee, N., A. M. Moyle and D. Lamb 2006: Experimen-
tal determination of the deposition coefficient of small
cirrus-like ice crystals near −50◦C. Geophys. Res. Lett.,
33, L17813
Mascagni, M. and C.-O. Hwang 2003: ǫ-shell error analy-
sis for ‘walk on spheres’ algorithm. Math. & Comp. in
Simul., 63, 93–104
McDonald, J. E. 1963: Use of the electrostatic analogy in
studies of ice crystal growth. Z. Angew. Math. Phys.,
14, 610–620
Mullins, W. W. and R. F. Sekerka 1963: Morphological
stability of a particle growing by diffusion or heat flow.
J. Appl. Phys., 34, 323–329
Nelson, J. 1998: Sublimation of ice crystals. J. Atmos.
Sci., 55, 910–919
Podzimek, J. 1966: Experimental determination of the
capacity of ice crystals. Studia Geophys. Geodet., 10,
235–238
Polya and Szego 1951, Isoperimetric inequalities in math-
ematical physics: Annals of mathematical studies,
Princeton University Press, Princeton.
Pruppacher H. R. and J. D. Klett 1997, Microphysics of
clouds and precipitation, Springer, New York.
Sander, L. M. 2000: Diffusion-limited aggregation: a ki-
netic critical phenomenon. Contemporary Phys., 41,
203–218
Smythe, W. R. 1962: Charged right circular cylinder. J.
Appl. Phys., 33, 2966–2967
Swanson, B. D., N. J. Bacon, E. J. Davis and M. B. Baker
1999: Electrodynamic trapping and manipulation of ice
crystals. Q. J. R. Meteorol. Soc., 125, 1039–1058
Westbrook, C. D., R. C. Ball, P. R. Field and A. J.
Heymsfield 2004: Universality in snowflake aggrega-
tion. Geophys. Res. Lett., 31, L15104–15107
Westbrook, C. D., R. J. Hogan, A. J. Illingworth and E. J.
O’Connor 2006: Theory and observations of ice particle
evolution in cirrus using Doppler radar: evidence for
aggregation. Geophys. Res. Lett., 34, L02824
Wilson, D. R. and S. P. Ballard 1999: A microphysically
based precipitation scheme for the UK Meterological
Office Unified Model, Q. J. R. Meteorol. Soc., 125,
1607–1636
Wintle, H. J. 2004: The capacitance of the cube and
square plate by random walk methods, J. Electrostat-
ics, 62, 51–62
Witten, T. A. and L. M. Sander 1981: Diffusion limited
aggregation, a kinetic critical phenomenon, Phys. Rev.
Lett., 47, 1400–1403
Woods, C. P., M. T. Stoelinga, J. D. Locatelli and P. V.
Hobbs 2006: The IMPROVE-1 Storm of 1-2 February
2001. Part III: Sensitivity of a mesoscale model simu-
lation to the representation of snow particle types and
testing of a bulk microphysical scheme with snow habit
prediction. J. Atmos. Sci., in press.
Zhou, H.-X., A. Szabo, J. F. Douglas and J. B. Hubbard
1994: A Brownian dynamics algorithm for calculating
the hydrodynamic friction and the electrostatic capac-
itance of an arbitrarily shaped object, J. Chem. Phys,
100, 3821–3826
14