The Canadian Retail Real Estate Market
23
The Canadian Retail Real Estate Market Presented at: 2013 Land & Development Conference Presented by: John G. Crombie National Retail Director Cushman & Wakefield Ltd. [email protected] 416-756-5448
Transcript of The Canadian Retail Real Estate Market

The Canadian Retail Real Estate Market
Presented at:
2013 Land & Development Conference
Presented by:
John G. Crombie
National Retail Director Cushman & Wakefield Ltd.
[email protected] 416-756-5448
Retail Real Estate Canadian Retail Market – Basic Facts

RETAIL SERVICES
2 CUSHMAN & WAKEFIELD
In 2012, retailers sold an estimated
$467.5 billion worth of goods and services
RETAIL IN CANADA Basic Facts
RETAIL SALES IN CANADA Record high sales of food & beverage in 2012 with $104.3 billion EMPLOYMENT Retail sector is Canada’s largest employer. 12.5% of Canadian jobs RETAIL STORES IN CANADA • 220,000+ retail establishments • 2,773 shopping centres (74 super regional) – 513 million SF (average size Shopping Centre – 186,000 SF) • 522 power centres (3 or more Big Boxes clustered) - 169 million SF (average size Power centre – 323,000 SF) • 236 power node (Power Centres plus nearby Shopping Centres). Almost 40% located in Ontario TOP 100 RETAILERS IN CANADA CONTROL OVER 70% MARKET SHARE 50% of Canada’s leading retailers are foreign owned and operated (largely US) Top 5 Foreign Owned Retailers in Canada • Wal-Mart, Costco, Safeway, Hudson ‘s Bay & Home Depot controls 19% of total retail sales (1,423 stores)

Retail Real Estate Consumer Confidence, Retail Sales - Canada & US

RETAIL SERVICES
4 CUSHMAN & WAKEFIELD
Canadian Consumer Confidence Three Year Trend
Source: J.C. Williams
50
55
60
65
70
75
80
85
90
95
100
Mar
-10
Apr
-10
May
-10
Jun-
10
Jul-1
0 A
ug-1
0 S
ep-1
0 O
ct-1
0 N
ov-1
0 D
ec-1
0 Ja
n-11
Fe
b-11
M
ar-1
1 A
pr-1
1 M
ay-1
1 Ju
n-11
Ju
l-11
Aug
-11
Sep
-11
Oct
-11
Nov
-11
Dec
-11
Jan-
12
Feb-
12
Mar
-12
Apr
-12
May
-12
Jun-
12
Jul-1
2 A
ug-1
2 S
ep-1
2 O
ct-1
2 N
ov-1
2 D
ec-1
2 Ja
n-13
Fe
b-13
RETAIL SERVICES
5 CUSHMAN & WAKEFIELD
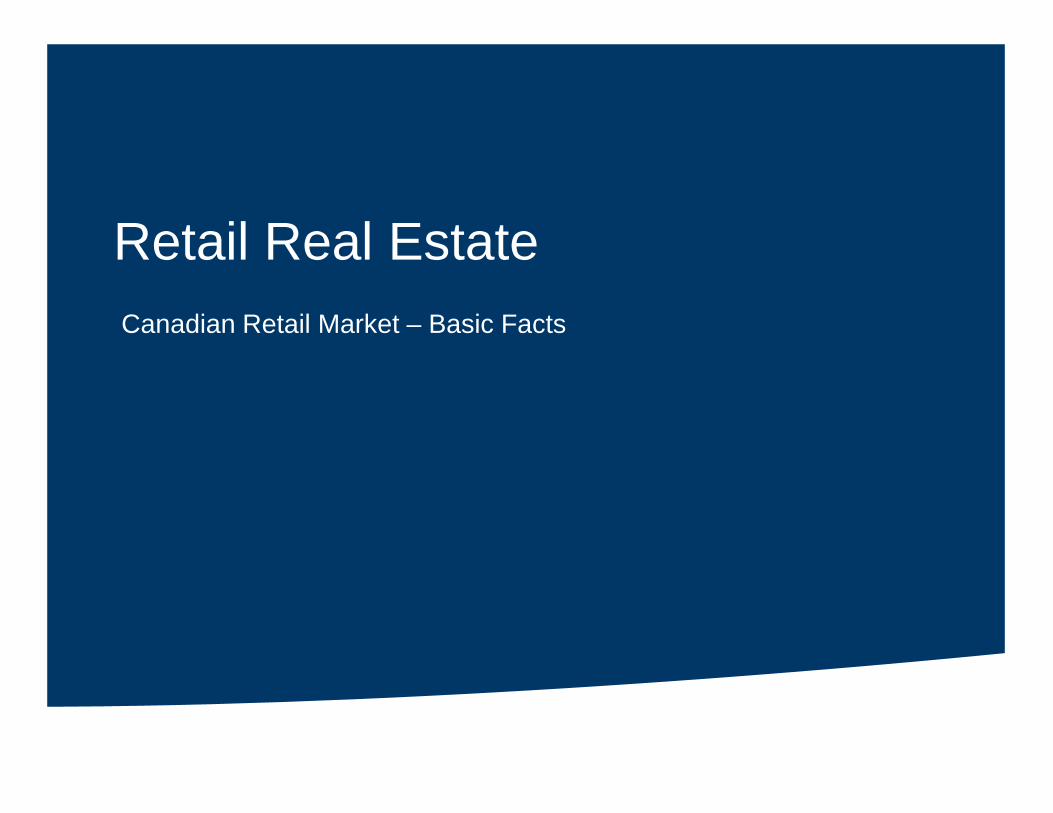
Canada vs. U.S. Consumer Confidence
Source: J.C. Williams/ICSC
0
20
40
60
80
100
120
0
20
40
60
80
100
120
Jan-
05
Apr
-05
Jul-0
5 O
ct. 0
5 Ja
n. 0
6 A
pr. 0
6 Ju
l. 06
O
ct. 0
6 Ja
n. 0
7 A
pr. 0
7 Ju
l. 07
O
ct. 0
7 Ja
n. 0
8 A
pr. 0
8 Ju
l. 08
O
ct. 0
8 Ja
n. 0
9 A
pr. 0
9 Ju
l. 09
O
ct. 0
9 Ja
n. 1
0 A
pr. 1
0 Ju
l. 10
O
ct. 1
0 Ja
n. 1
1 A
pr. 1
1 Ju
l. 11
O
ct. 1
1 Ja
n. 1
2 A
pr-1
2 Ju
l-12
Oct
-12
Nov
-12
Dec
-12
Jan-
13
Feb-
13
US
CC
I Ind
ex (1
985
=100
)
CD
N C
CI I
ndex
(200
2=10
0)
Canada
U.S.

RETAIL SERVICES
6 CUSHMAN & WAKEFIELD
Canadian Retail Sales Seasonally Adjusted
Source: Statistics Canada
$30
$32
$34
$36
$38
$40
$42
Jul-0
6
Jan-
07
Jul-0
7
Jan-
08
Jul-0
8
Jan-
09
Jul-0
9
Jan-
10
Jul-1
0
Jan-
11
Jul-1
1
Jan-
12
Jul-1
2
Jan-
13
(billi
ons)

RETAIL SERVICES
7 CUSHMAN & WAKEFIELD
Eastern Canada 7.4%
Quebec 22.1%
Ontario 35.1%
Western Canada 35.1%
Northern Canada 0.4%
Toronto CMA = 16.0%
Source: Statistic Canada
CANADIAN RETAIL SALES GEOGRAPHY - 2012 92.3% of Sales are in Western & Central Canada
Manitoba = 3.6% Saskatchewan = 3.7% Alberta = 14.7% British Columbia = 13.1%
Yukon = 0.1% Northwest Territories = 0.2% Nunavut = 0.1%
Nfld & Labrador = 1.8% PEI = 0.4% Nova Scotia = 2.8% New Brunswick = 2.4%

RETAIL SERVICES
8 CUSHMAN & WAKEFIELD
Canadian Retail Sales by Province 2013/2012 Year Over Year % Change (as of March 2013)
Source: J.C. Williams
0%
1%
2%
3%
4%
5%
6%
7%
British Columbia Alberta Prairies Ontario Quebec Atlantic Canada

RETAIL SERVICES
9 CUSHMAN & WAKEFIELD
Retail Sales Productivity – Canadian Malls
Source: ICSC Research
Approximately $605 PSF
$400
$450
$500
$550
$600
$650
1997
1998
1999
2000
2001
2002
2003
2004
2005
2006
2007
2008
2009
2010
2011
2012
2013

RETAIL SERVICES
10 CUSHMAN & WAKEFIELD
Retail Sales Productivity – U.S. Malls
$320
$340
$360
$380
$400
$420
$440
$460
$480
1997
1998
1999
2000
2001
2002
2003
2004
2005
2006
2007
2008
2009
2010
2011
2012
2013
Source: ICSC Research
Approximately $466 PSF
RETAIL SERVICES
11 CUSHMAN & WAKEFIELD
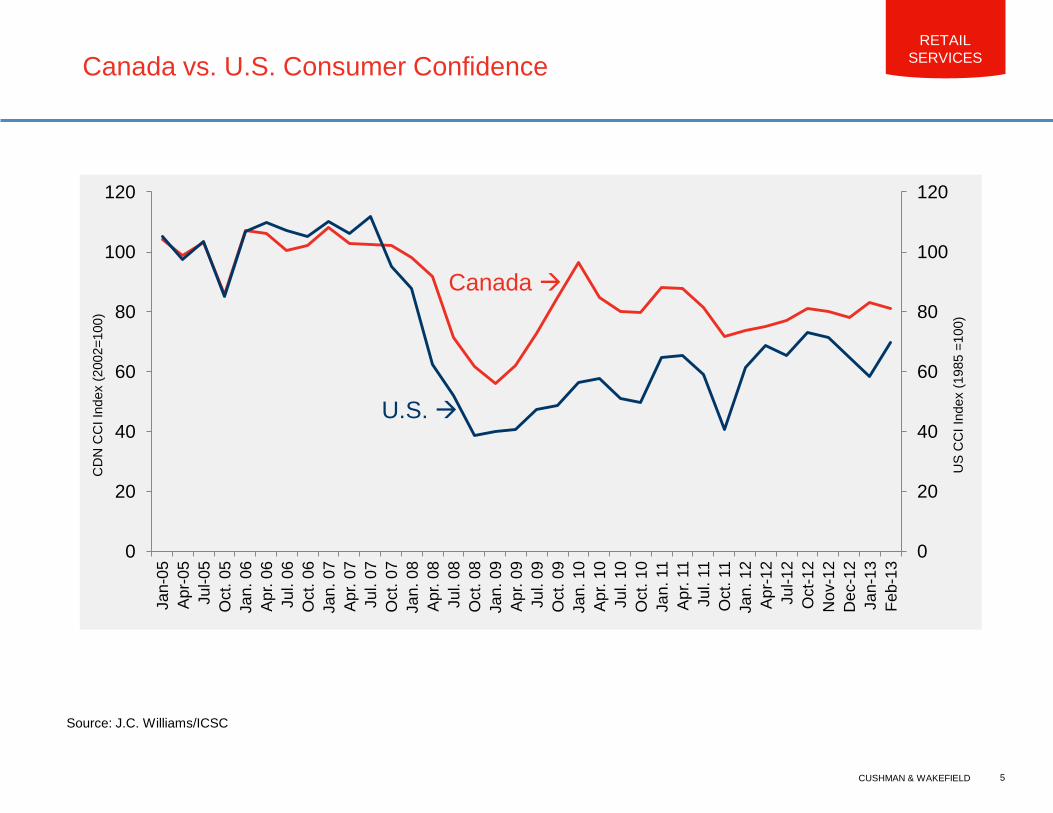
Recent Arrivals or Expressing Interest in Canada
American Retailers
European Retailers
Source: Cushman & Wakefield 2013
RETAIL SERVICES
12 CUSHMAN & WAKEFIELD
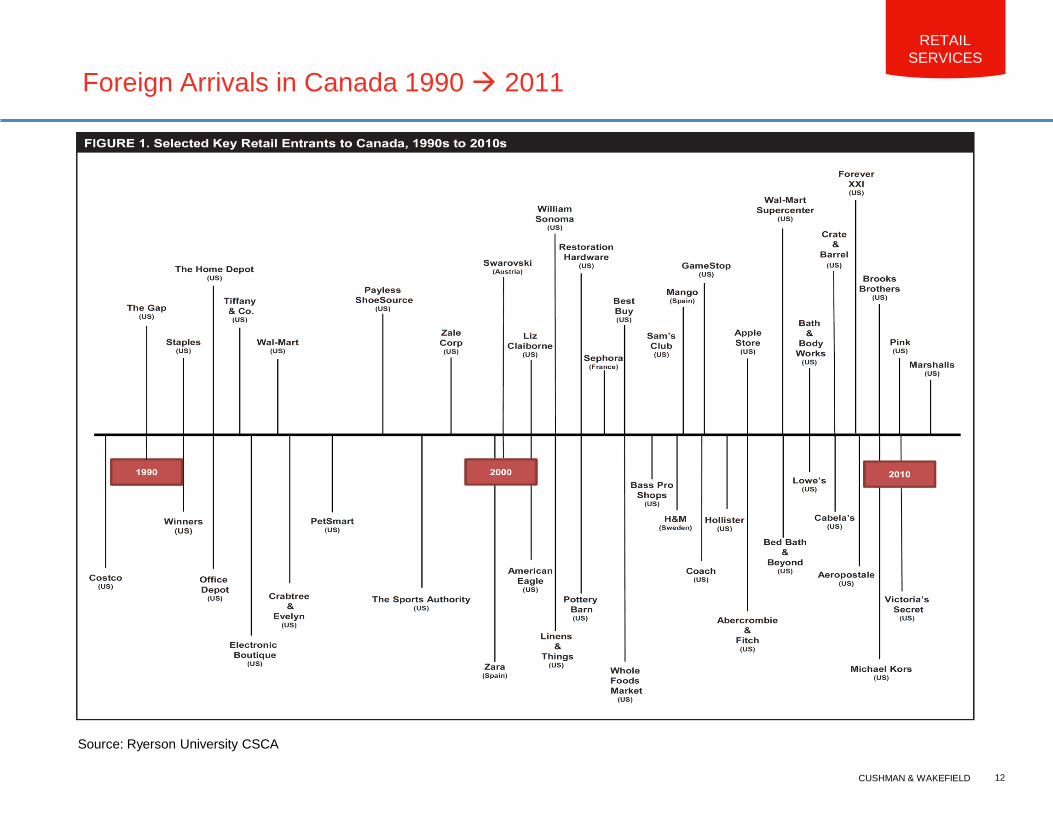
Foreign Arrivals in Canada 1990 2011
Source: Ryerson University CSCA

RETAIL SERVICES
13 CUSHMAN & WAKEFIELD
Canadian Retail Space – Square Feet Per Person
14.1
25.1
27.9
22.4
14.7
18
0
5
10
15
20
25
30
Vancouver Calgary Edmonton Toronto Montreal Canadian Average
Squa
re F
eet/C
apita
Source: Ryerson University CSCA
Shopping Centres & Big Box Stores (excludes street front)

RETAIL SERVICES
14 CUSHMAN & WAKEFIELD
Canadian Regional & Super-Regional Mall Ownership Regional and super-regional mall ownership in Canada is dominated by pension funds
0.0% 4.0% 8.0% 12.0% 16.0% 20.0%
2.4%
2.5%
4.7%
4.8%
5.6%
6.8%
7.0%
14.5%
16.6%
* KingSett Includes: KingSett CREIF and KingSett Growth LP No 5 Source: Ivanhoé Cambridge Market Research Department (based on 2012 Canadian Directory of Shopping Centres)
Pension Fund
Pension Fund
Pension Fund
Pension Fund
Pension Fund
Pension Fund

RETAIL SERVICES
15 CUSHMAN & WAKEFIELD
Recent Developer Entries into Canada

RETAIL SERVICES
16 CUSHMAN & WAKEFIELD
Retail Inventory by Age Toronto & Ontario
0%
5%
10%
15%
20%
25%
30%
1950s 1960s 1970s 1980s 1990s 2000s
Toronto Ontario
Almost 80% of retail inventory is more than 20 years old
Source: Cushman & Wakefield 2012

RETAIL SERVICES
17 CUSHMAN & WAKEFIELD
Technology Affecting Our Industry Omni-Channel Strategies
Evolving multi-channel dynamics increase the
importance of a cohesive omni-channel
strategy
QR CODE-DRIVEN VIRTUAL SUPERMARKETS
(South Korea Subway Stations)
BRICK & MORTAR MOBILE
AMAZON.COM STORE
BRICK & MORTAR
INTERNET
POP-UP STORE
BRICK & MORTAR
SOCIAL MEDIA

Retail Real Estate Rental Rates, Vacancy Rates

RETAIL SERVICES
19 CUSHMAN & WAKEFIELD
National Retail Rental Rates 2012
Retail Product 2012 Average Net Rent ($/sq.ft.)
CRU (New) $24-$30
Big Box (New) $16-$24
Pads (New) $32-$50
Street Front $30-$120
Source: Cushman & Wakefield 2012

RETAIL SERVICES
20 CUSHMAN & WAKEFIELD
High Street Rental Rates 2011 vs. 2012 (Street Level)
City Submarket 2011 Average Net Rent ($/sq.ft.)
2012 Average Net Rent ($/sq.ft.)
Vancouver Robson Street $240 $220
Calgary 17th Avenue SW $45 $50
Edmonton Whyte Avenue $40 $45
Montreal Saint-Catherine West (street level) $160 $180
Ottawa Sussex Drive $50 $50
Toronto Bloor Street $315 $320
Toronto Queen Street $100 $100
Source: Cushman & Wakefield 2012
RETAIL SERVICES
21 CUSHMAN & WAKEFIELD
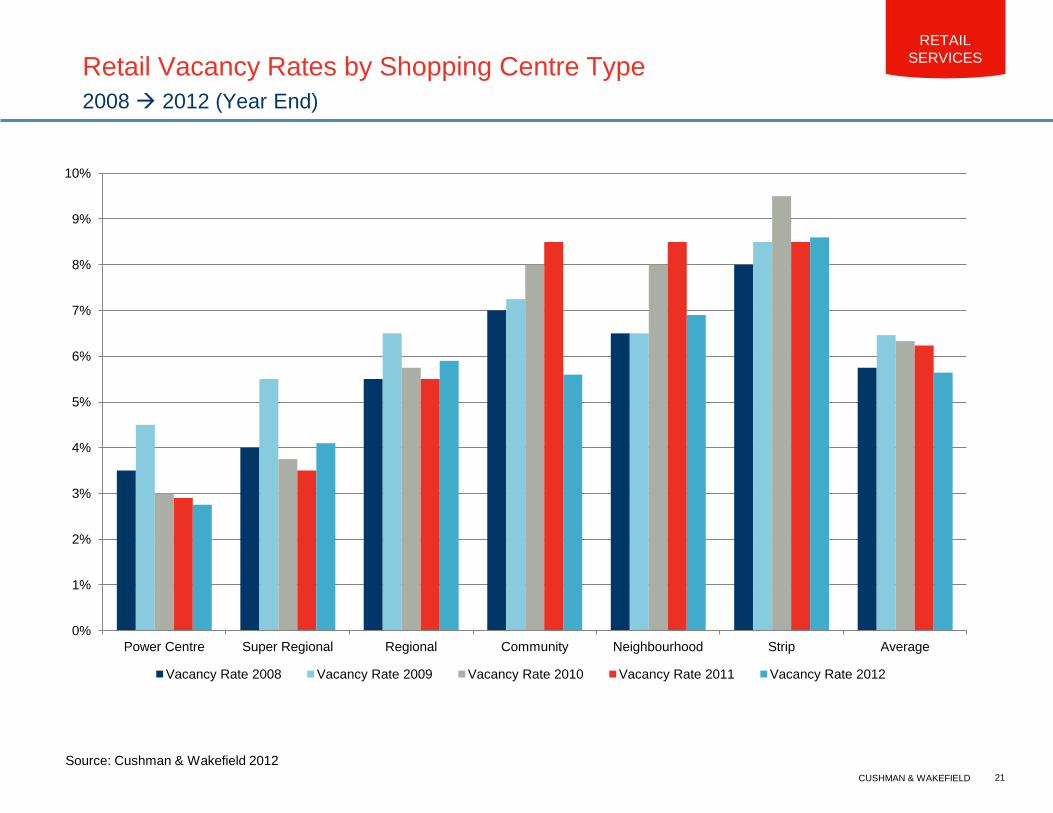
Retail Vacancy Rates by Shopping Centre Type 2008 2012 (Year End)
Source: Cushman & Wakefield 2012
0%
1%
2%
3%
4%
5%
6%
7%
8%
9%
10%
Power Centre Super Regional Regional Community Neighbourhood Strip Average
Vacancy Rate 2008 Vacancy Rate 2009 Vacancy Rate 2010 Vacancy Rate 2011 Vacancy Rate 2012

RETAIL SERVICES
22 CUSHMAN & WAKEFIELD
This report contains information available to the public and has been relied upon by Cushman & Wakefield on the basis that it is accurate and complete. Cushman & Wakefield accepts no responsibility if this should prove not to be the case. No warranty or representation, express or implied, is made to the accuracy or completeness of the information contained herein, and same is submitted subject to errors, omissions, change of price, rental or other conditions, withdrawal without notice, and to any special listing conditions imposed by our principals. Cushman & Wakefield Ltd. 2013