The California Harpoon Fishery for Swordfish, Xiphias gladius · The California Harpoon Fishery for...
14
The California Harpoon Fishery for Swordfish, Xiphias gladius ATILIO L. COANJR. Southwest Fisheries Science Center National Marine Fisheries Service, NOAA 8604 La Jolla Shores Drive LaJolla, California 92038 MARIJA VOJKOVICH Marine Resources Division California Department of Fish and Game 530 E. Montecito Street Santa Barbara, California 93103 DOUG PRESCOTT Southwest Fisheries Science Center National Mmine Fisheries Service, NOAA 8604 Lafolla Shores Drive LaJolla, California 92038 ABSTRACT We review and analyze fishery data collected from the California harpoon fishery for swordfish, which began in the early 1900's. Landings data for 1969-93, logbook data for 1974-93, and size composition data for swordfish landed in 1981-93 are analyzed. Swordfish landings peaked in 1978 (1,172,000 kg) and decreased to a record low (ll,OOO kg) in 1991. Landings were less than 200,000 kg in most years. Swordfish landed averaged 149 cm in length (c1eithrum to fork) or 85 kg dressed weight in 1981-93. The harpoon fishing season, typically May-December, usually concentrates in the Southern California Bight off San Diego early in the season and then shifts as far north as Oregon. Swordfish are usually sighted while basking at the surface in water of 12°-26°C. Fishing effort peaked in 1979 (12,700 days fished), decreased in 1991 (700 days), and rebounded slightly in 1993. Catch per day fished fluctuated between 0.14 and 0.93 during 1974-93, and peaked in 1974, 1978, 1985, and 1993, usually 1-2 yr after an El Nino event. Introduction In North America, harpoon fishing dates to the use of harpoons by Indians to catch swordfish, Xiphias gladius, off the California coast almost 3,000 yr ago (Kronman, 1988). Their vessels were 6.1-m (20-ft) driftwood ca- noes, and their gear consisted of a 1.8-m (6-ft) foreshaft tipped with a carved wooden harpoon which bore a stone point on one end and a curved barb of deer bone behind (Kronman, 1988). California's modern-day harpoon fishery for sword- fish developed in the early 1900's. The fishery was mod- eled after the East Coast harpoon fishery, which began almost 70 yr earlier. Vessels were small sail-powered sloops or schooners. The harpoon gear was 4.6-5.5 m (15-18 ft) in length, fashioned from hickory and tipped-with a bronze dart (Kronman, 1988). The bronze dart was backed by a tapered socket and a 0.6-m (2-ft) metal shank attached to the end of a wooden handle. The design of harpoon gear has remained unchanged except for minor modifications in the metal used in the shank. Harpoon fishing continued as the only commercial fishery that harvested swordfish within 200 mi of the California coast until 1980, when drift gill net fishing started in waters off California. The competition from the more-efficient drift gill nets proved too great for 37
Transcript of The California Harpoon Fishery for Swordfish, Xiphias gladius · The California Harpoon Fishery for...
The California Harpoon Fishery for Swordfish, Xiphias gladius
ATILIO L. COANJR.
Southwest Fisheries Science CenterNational Marine Fisheries Service, NOAA
8604 LaJolla Shores DriveLaJolla, California 92038
MARIJA VOJKOVICH
Marine Resources DivisionCalifornia Department ofFish and Game
530 E. Montecito StreetSanta Barbara, California 93103
DOUG PRESCOTT
Southwest Fisheries Science CenterNational Mmine Fisheries Service, NOAA
8604 Lafolla Shores DriveLaJolla, California 92038
ABSTRACT
We review and analyze fishery data collected from the California harpoon fishery forswordfish, which began in the early 1900's. Landings data for 1969-93, logbook data for1974-93, and size composition data for swordfish landed in 1981-93 are analyzed. Swordfishlandings peaked in 1978 (1,172,000 kg) and decreased to a record low (ll,OOO kg) in 1991.Landings were less than 200,000 kg in most years. Swordfish landed averaged 149 cm inlength (c1eithrum to fork) or 85 kg dressed weight in 1981-93.
The harpoon fishing season, typically May-December, usually concentrates in theSouthern California Bight off San Diego early in the season and then shifts as far north asOregon. Swordfish are usually sighted while basking at the surface in water of 12°-26°C.Fishing effort peaked in 1979 (12,700 days fished), decreased in 1991 (700 days), andrebounded slightly in 1993. Catch per day fished fluctuated between 0.14 and 0.93 during1974-93, and peaked in 1974, 1978, 1985, and 1993, usually 1-2 yr after an El Nino event.
Introduction
In North America, harpoon fishing dates to the use ofharpoons by Indians to catch swordfish, Xiphias gladius,off the California coast almost 3,000 yr ago (Kronman,1988). Their vessels were 6.1-m (20-ft) driftwood canoes, and their gear consisted of a 1.8-m (6-ft) foreshafttipped with a carved wooden harpoon which bore astone point on one end and a curved barb of deer bonebehind (Kronman, 1988).
California's modern-day harpoon fishery for swordfish developed in the early 1900's. The fishery was modeled after the East Coast harpoon fishery, which began
almost 70 yr earlier. Vessels were small sail-poweredsloops or schooners. The harpoon gear was 4.6-5.5 m(15-18 ft) in length, fashioned from hickory andtipped-with a bronze dart (Kronman, 1988). The bronzedart was backed by a tapered socket and a 0.6-m (2-ft)metal shank attached to the end of a wooden handle. Thedesign of harpoon gear has remained unchanged exceptfor minor modifications in the metal used in the shank.
Harpoon fishing continued as the only commercialfishery that harvested swordfish within 200 mi of theCalifornia coast until 1980, when drift gill net fishingstarted in waters off California. The competition fromthe more-efficient drift gill nets proved too great for
37
38 NOAA Technical Report NMFS 142 _
the harpoon fishery, and many vessels converted todrift gill net gear or obtained permits to use both typesof gear. Today, harpoon and drift gill net are the onlycommercial fishing gears operating on swordfish in thearea, and only a handful of vessels continue to participate in the harpoon fishery.
This paper reviews and analyzes data collected fromthe California harpoon fishery. Landings data are reviewed for 1969-93, logbook data for 1974-93, and sizecomposition of swordfish catches for 1981-93.
Data and Methods _
Landings, logbook, and size compositIOn data forCalifornia's harpoon fishery have historically been collected by California Department of Fish and Game(CDFG) biologists at landing ports as vessels returnedfrom fishing trips. Locations of landings, logbookcatches, and measured fish were recorded by CDFGblocks, which are usually lO-minute quadrangles. Thesewere converted to latitude and longitude and summedto I-degree quadrangles for the purposes of this report.
Landings
Swordfish landings data have been collected since theearly 1900's (Bedford and Hagerman, 1983). This studyincludes landings data for 1969-93, to match the existing logbook and size-composition data sets. This periodincludes all of the 1970's, a period of relatively highcatches and increased regulations that significantly impacted the harpoon fishery.
The landings data were compiled from CDFG landing receipts. Commercial fish buyers are required to fillout a landing receipt for each landing purchased inCalifornia (Hanan et aI., 1993) and submit these receipts to CDFG. Therefore, coverage is very close to100% for all landings sold commercially. Landings keptfor private consumption are not recorded in the landing totals. A small number of swordfish landings mayalso escape the landing receipt system. The landingreceipts contain information on species landed, weightlanded, price paid, and fishing gear used. Other information, such as area of catch, may be included but inmany circumstances is left blank.
Data for 1969-79 include landings reported as catchesby harpoon, spear, and unknown fishing gear (Table1). Data from 1980 to 1993 include only those landingsspecifically designated as caught with harpoon or speargear. Landings with unknown fishing gear were includedbefore 1980 because harpoon was the prevalent gear usedduring that time. After 1979, drift gill net gear accountedfor a significant number of swordfish landings, and un-
known gear could no longer be assumed to be harpoon.Landings other than sharks were not included as
harpoon incidental catches (Table 1). Albacore,Thunnus alalunga; yellowfin tuna, Thunnus albacares;mackerel, Scombridae; rockfishes, Sebastes spp.; andother species were often recorded as harpoon landings.These entries were considered errors in gear-type coding; the catches were most likely made with troll fishinggear while searching for swordfish.
Logbooks
CDFG implemented a mandatory permit and logbooksystem in 1974 (Bedford and Hagerman, 1983). Theoriginal logbook provided space for recording information about a single fishing day on each line. Requestedinformation included name ofskipper and boat; swordfish permit number and CDFG boat number; date(month and day) of each entry; CDFG block number;whether an aircraft was used; whether the fish was sightedunderwater, finning, or jumping; whether the fish washarpooned; whether it was landed; and estimateddressed weight in pounds. Space was also included forany other pertinent remarks.
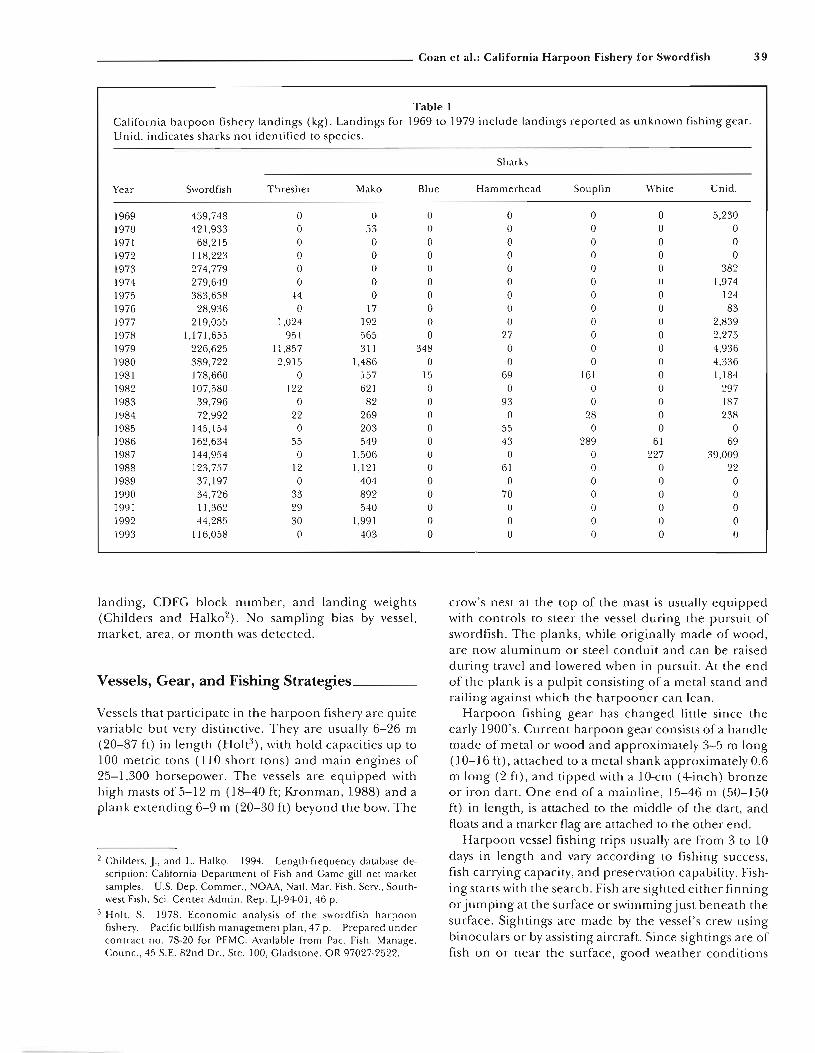
The original logbook was later modified so that eachpage represen ted a single day of fishing (Fig. 1). Fieldswere added to record starting and ending times offishing,time of each entry on the form, sea-surface temperature,whether sighted fish were pursued, other CDFG blockssearched, and weather conditions, sea state, and sea color.
Size Composition
Landings of swordfish have been sampled for lengthsince 1981 under a program originally designed to monitor gill net landings (Odemar1). Samples were taken byCDFG biologists as fish were unloaded at various fishmarkets throughout the state (Hanan et aI., 1993). Noformal constraints on sample size were established, andsamplers selected as many fish and vessels to sample astime permitted. Since swordfish were always landedgutted, headed, and with the dorsal fins and the posterior portions of the tail fins removed, samplers recordedthe cleithrum length (CL), the straight length from theanterior margin of the cleithrum to the fork of the tail.Lengths were recorded to the nearest millimeter. Thesamplers, whenever possible, recorded information onthe weight in pounds of each fish measured, date measured, boat name and number, port and market of
1 Odemar, M. 1982. 1nventol1' of California marine fisheries portsampling activities. Calif. Dep. Fish Game internal report, 157p. CDFG, 1416 Ninth St., Sacrament, CA 95814.
Coan et aI.: California Harpoon Fishery for Swordfish 39
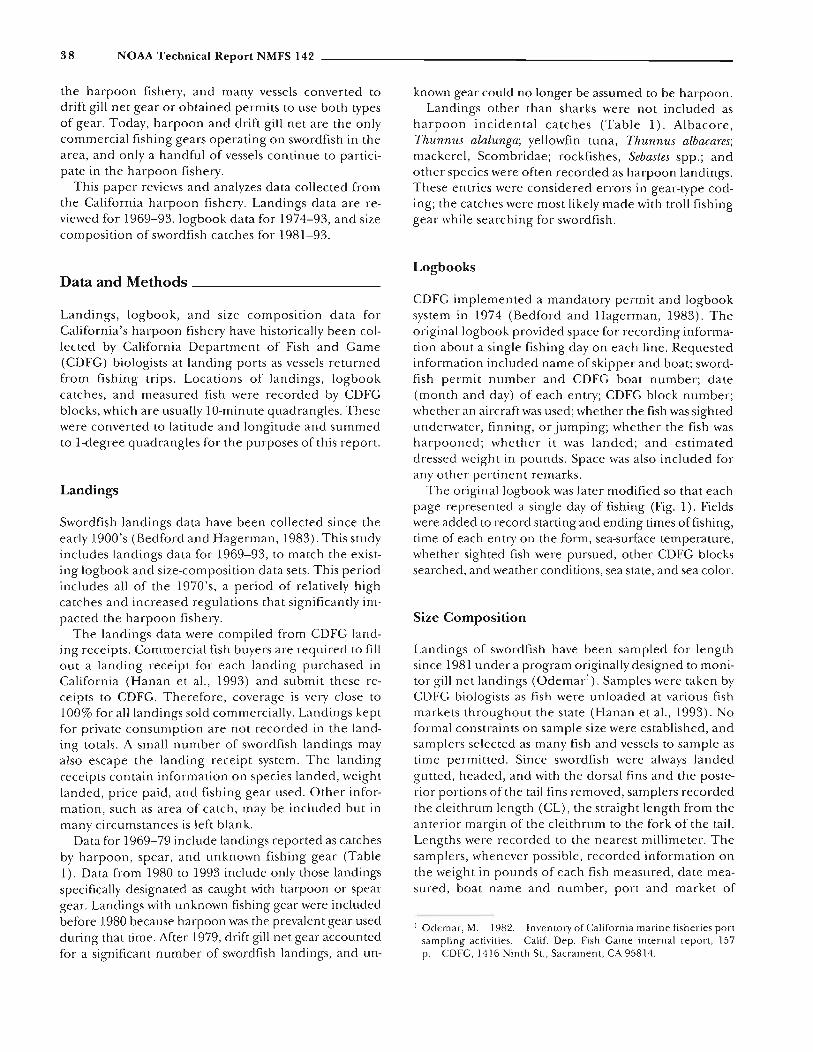
Table 1California harpoon fishery landings (kg). Landings for 1969 to 1979 include landings reponed as unknown fishing geaLVnid. indicates sharks not identified to species.
Sharks
Year Swordfish Thresher Mako Blue Hammerhead Soupfin White nid.
1969 459,748 0 0 0 0 0 0 5,2301970 421,933 0 53 0 0 0 0 01971 68,215 0 0 0 0 0 0 01972 118,223 0 0 0 0 0 0 01973 274,779 0 0 0 0 0 0 3821974 279,649 0 0 0 0 0 0 1,9741975 383,658 44 0 0 0 0 0 1241976 28,936 0 17 0 0 0 0 831977 219,055 1,024 192 0 0 0 0 2,8391978 1,171,655 951 565 0 27 0 0 2,2751979 226,625 II ,857 311 348 0 0 0 4,9361980 389,722 2,915 1,486 0 0 0 0 4,3361981 178,660 0 157 15 69 161 0 1,1841982 107,580 122 621 0 0 0 0 2971983 39,796 0 82 0 93 0 0 1871984 72,992 22 269 0 0 28 0 23R1985 145,154 0 203 0 55 0 0 01986 162,634 55 549 0 43 289 61 691987 144,954 0 1,506 0 0 0 227 39,0091988 123,757 12 1,121 0 61 0 0 221989 37,197 0 404 0 0 0 0 01990 34,726 33 892 0 70 0 0 01991 1l,362 29 540 0 0 0 0 01992 44,285 30 1,991 0 0 0 0 01993 116,058 0 403 0 0 0 0 0
landing, CDFG block number, and landing weights(Childers and Halk02). No sampling bias by vessel,market, area, or month was detected.
Vessels, Gear, and Fishing Strategies _
Vessels that participate in the harpoon fishery are quitevariable but very distinctive. They are usually 6-26 m(20-87 ft) in length (Holt3), with hold capacities up to100 metric tons (110 short tons) and main engines of25-1,300 horsepower. The vessels are equipped withhigh masts of 5-12 m (18-40 ft; Kronman, 1988) and aplank extending 6-9 m (20-30 ft) beyond the bow. The
2 Childers, J., and L. Halko. 1994. Length-frequency database description: California Department of Fish and Game gill net marketsamples. .S. Dep. Commer., NOAA, Nat!. Mar. Fish. Serv., Southwest Fish. Sci. Center Admin. Rep. LJ-94-01, 46 p.
3 Holt, S. 1978. Economic analysis of the swordfish harpoonfishery. Pacific billfish management plan, 47 p. Prepared undercontract no. 78-20 for PFMC. Available from Pac. Fish. Manage.Coune., 45 S.E. 82nd Dr., Ste. 100, Gladstone, OR 97027-2522.
crow's nest at the top of the mast is usually equippedwith controls to steer the vessel during the pursuit ofswordfish. The planks, while originally made of wood,are now aluminum or steel conduit and can be raisedduring travel and lowered when in pursuit. At the endof the plank is a pulpit consisting of a metal stand andrailing against which the harpooner can lean.
Harpoon fishing gear has changed little since theearly 1900's. Current harpoon gear consists of a handlemade of metal or wood and approximately 3-5 m long(10-16 ft), attached to a metal shank approximately 0.6m long (2 ft), and tipped with a lO-cm (4-inch) bronzeor iron dart. One end of a mainline, 15-46 m (50-150ft) in length, is attached to the middle of the dart, andfloats and a marker flag are attached to the other end.
Harpoon vessel fishing trips usually are from 3 to 10days in length and vary according to fishing success,fish carrying capacity, and preservation capability. Fishing starts with the search. Fish are sighted either finningor jumping at the surface or swimmingjust beneath thesurface. Sightings are made by the vessel's crew usingbinoculars or by assisting aircraft. Since sightings are offish on or near the surface, good weather conditions
40 NOAA Technical Report NMFS 142
Time Fishing Started This Day Aircraft Used to Scout Swordfish
lime Fishing Ended This Day This Day: Yes _ No_
1935 Swordfish may be taken with hook-and-line andharpoon gear.
1971 U.S. Food and Drug Administration (FDA) begins to enforce guideline of 0.5 ppm of mercuryin swordfish.
1973 A permit is required to take swordfish commercially. California Legislature gives regulative authority over the swordfish fishery to the StateFish and Game Commission (F&GC).
1974 F&GC adopts commercial swordfish regulationsincluding specific permit qualifications, a logbook requirement, and the notification that airplanes cannot be used to assist a vessel in capturing swordfish after 28June 1976.
1976 F&GC allows airplane use in locating swordfish,but not within an 8-km (5-mi) radius of a vesseloperated by a swordfish permittee.
1977 F&GC extends the airplane operating radius tobeyond 16 km (10 mi) of a vessel operated by aswordfish permittee.
1978 FDA changes limit of total mercury in swordfishto 1.0 ppm.
Regulations
Modern-day harpoon vessels have added new technology and fishing strategies as they became available,to increase fishing efficiency. Some vessels employ stateof-the-art navigation equipment, sea-surface-temperature recorders, and sounders to help locate fish. Somehave also been known to use satellite imagery to identify fishing areas. Harpoon vessel operators have alsoobtained multiple permits that allow them to fish bothgill net and harpoon fishing gears, and have also beenknown to troll jigs between sightings to increase catchesof swordfish and other commercial species of fish.
Over time, several regulations have been imposed thatdirectly or indirectly affect the California harpoon fishery (California Fish and Game Code and Title 14 Regulations; Squire and Muhlia-Mel04; Sakagawa5). The major regulations are:
No.__
Year__
Month __
Day__
Check One
Fish ISea Under- Fish Fish Fish Fish Fish Estimated
Time Block No. Temp. water Finning Jumping Pursued Harpooned Landed Weight
DAILY SWORDFISH LOG
Name of Skipper SW Permit No. _
Name of Boal Boat F&G No.
and calm seas favor fishing. Swordfish are found in seasurface temperatures of 12°-26°C (64°-72°F), and vessels usually start their search in areas where temperatures are within this range.
After a fish is sighted, the vessel's plank is maneuvered over the fish and the striker harpoons the fish.The handle is pulled free from the dart, the mainline,marker flag, and floats are thrown overboard, and thefish is left to tire itself. The vessel is then able to pursueother fish. After the fish has tired (approximately 2 hr)the vessel returns to retrieve it. The fish is dressed(headed, gutted, and fins removed) and stored in icefor transport to shore. During the early years of theharpoon fishery, the livers were sometimes kept for salebecause oftheirvitamin A and D content (CDFG, 1949);this practice is no longer followed as other sources ofvitamin A and D have been developed.
The use of airplanes to assist in the sighting andharpooning of swordfish started in the early 1970's.Airplanes both spot the fish and guide the vessels to thefish. Because conflicts arose between commercial fishermen who used airplanes and sportsmen and othercommercial fishermen who did not use airplanes, aseries of regulations was enacted to limit their use.
8'w1---+------1--+--+--+---+---+---+---+------1~~I--+-----1--+-+--+---+---+---+--+-----1
~I--+-----1--+-+--+---+---+---+--+---1
'E1---+------II---+-+--+---+---+---+--+-----1~001---+------11---+-+--+---+---+---+--+-----1
Figure 1A page from the current California harpoon fisherylogbook.
Weather _
Sea 8IaI8 _
Sea Color
Remarks _
4 Squire, J. L, and A. F. Muhlia-Melo. 1993. A review of stripedmarlin (Tetrapturus audax) , swordfish (Xiphias gladius) , and sailfish(lstiophorus platypterus) fisheries and resource management byMexico and the United States in the northeast Pacific Ocean. U.S.Dep. Commer., NOAA, Nat!. Mar. Fish. Serv., Southwest FisheriesScience Center Admin. Rep. LJ-93-06, 44 p. (in Eng!. and Span.).SWFSC, NMFS, NOAA, P.O. Box 271, La Jolla, CA 92038-0271.
'> Sakagawa, G. T. 1994. Supply of swordfish, Xiphias gladius, forthe United States consumer market. International Symposiumon Pacific Swordfish, 11-14 December 1994, Ensenada,Mexico. Available from G. T. Sakagawa, Southwest Fisheries Science Center, NMFS. NOAA, P.O. Box 271, La Jolla, CA 920380271.

_______________________ Coan et al.: California Harpoon Fishery for Swordfish 41
1980 F&GC prohibits swordfish harpoon permitteesfrom possessing a gill net on board except for setgill nets with mesh sizes of 20 cm (8") or less ifthey declare on their swordfish permit that theyintend to use such gear.
1984 F&GC allows unlimited airplane use to directlyassist a permittee in the taking of any species offish while operating under a swordfish harpoonpermit. FDA changes its regulation to limit methyl mercury content in swordfish to 1.0 ppm.
1985 F&GC allows swordfish harpoon permittees tohave set gill nets of any mesh size aboard if theydeclare on their swordfish harpoon permit application that they intend to use such gear.
1987 F&GC allows swordfish harpoon permittees tohave drift gill nets aboard in addition to set gillnets, if they also possess a valid permit to usedrift gill nets.
Numbers of Vessels and Landings
The number of California harpoon vessels landingswordfish increased from 63 in 1969, to 309 in 1978(Fig. 2), decreased to 32 in 1991, and then increasedslightly to 43 in 1993. A sharp decline in 1971 in thenumber of vessels participating in the fishery was probably due to the collapse of the swordfish market in thatyear as a result of the mercury scare-publicity aboutthe high levels of mercury in swordfish and healthproblems from ingestion of mercury, which discouraged consumers from buying swordfish-and the FDA'ssubsequent strict enforcement of the 0.5-ppm mercurylimit. The decline in 1976 was probably due to the banon aircraft use, and the general decline since 1980 hasbeen primarily due to increased competition from driftgill net operations.
The number of vessels landing swordfish is indicativeof the harpoon fishery fleet size. CPUE during this timewas relatively stable at 0.1-0.9 fish per day, and thenumber of harpoon permits showed a trend similar tothat in number of vessels landing swordfish: 164 permits in 1984, decreasing to 43 in 1993.
Harpoon fishery landings in California have beenrecorded since 1918 (CDFG, 1949). Records for 191837 combined striped marlin, Tetrapturus audax, andswordfish landings, since no requirements were in placeto separate the two species. Commercial landings ofstriped marlin in California have been prohibited sincethe late 1930's.
Records for 1938-68 con tained swordfish landingsonly and are assumed to be from harpoon gear, although small amounts of catch from other fishing gearsare probably included. Landings averaged approximately 330,000 kg in 1938-48 and declined to approxi-
300
260(f)--'~ 220(f)w~ 180offi 140en~
~ 100
60
1970 72 74 76 78 80 82 84 86 88 90 92YEAR
Figure 2Number of California harpoon fishing vessels landingswordfish during 1969-93.
mately 110,000 kg in 1949-68. Landings increased dramatically in 1968 to 460,000 kg, and reached a recordhigh of 1,172,000 kg in 1978 (Table 1). After 1978,landings decreased to a record low of 11,000 kg in 1991and rebounded slightly to 116,000 kg in 1993. In general, landings seem to be lower during El Nino events(1972-73,1976-77,1982-83,1991-92) and peak 1-2 yrthereafter. The same regulations that affected vesselparticipation in the harpoon fishery, mentioned above,also affected annual landings.
The most prevalent incidental landings of sharks identified to species were thresher, Alopias vulpinus, andshortfin mako, Isurus oxyrinchus (Table 1). The mostthresher sharks landed in a year was 12,000 kg in 1979;the most shortfin mako sharks landed was approximately 1,500 kg in 1980 and 1987. Other sharks landedby harpoon gear include blue, Prionace glauca; hammerhead, Sphyma spp.; soupfin, Galeorhinus zyopterus; andwhite, Carcharodon carcharias. The most reported landings of unidentified sharks occurred in 1987 when 39,000kg were landed.
Logbook Records
Coverage Rates
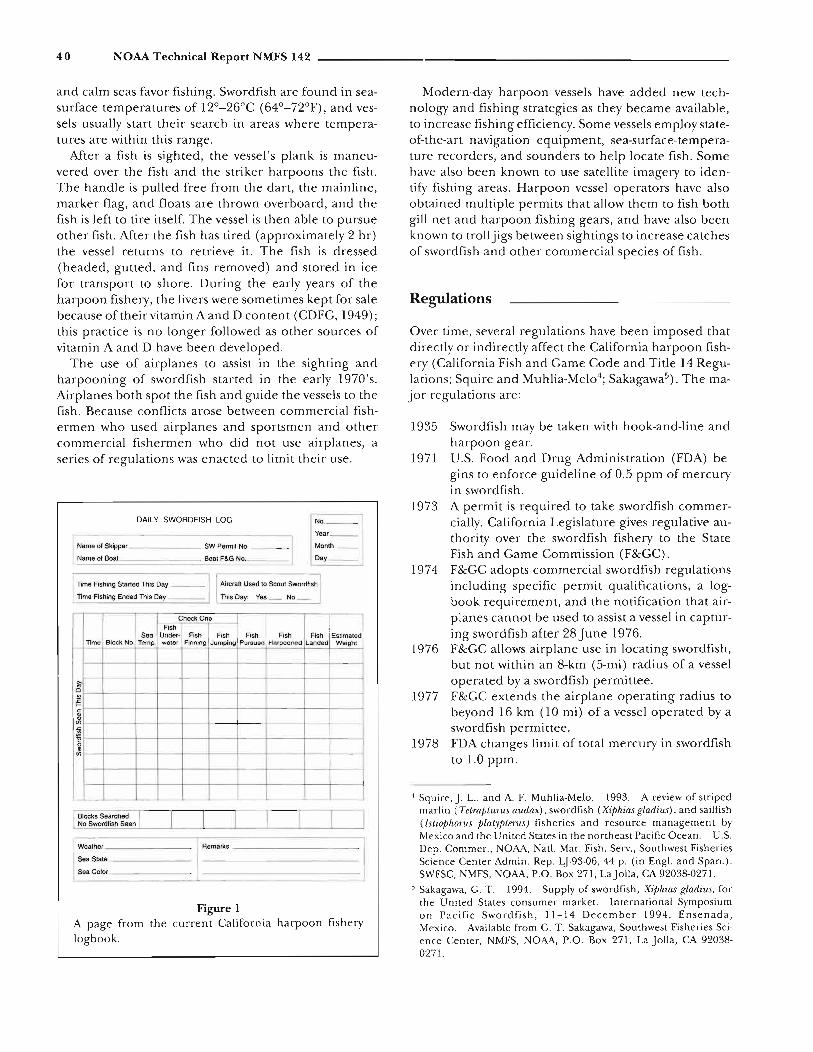
Annual logbook coverage rates were calculated as thetotal annual weight of swordfish reported in logbooks,divided by yearly swordfish landing weights as given inTable 1 (Fig. 3). Total annual swordfish weight reported in logbooks was calculated as the total numberof fish reported in logbooks, multiplied by the averageweight (85 kg) of fish recorded in market sampling ofharpoon catches during 1981-93. Annual average
• FINNING
• JUMPING
• UNDERWATER
42 NOAA Technical Report NMFS 142
160t='i:5 140()IT:w 120~
~ 1004:IT:w 80>o() 60~
o~ 40C)
9 20
1975 77 79 81 83 85 87 89 91 93YEAR
Figure 3California harpoon fishery logbook coverage rates (logbook catch in weight divided by landed weight) for1974-93.
weights were not used because of the low sample sizesin some years. Logbook-estimated weights were notused because they were missing for as many as 100landings per yr, combined processed and total weights,which were difficult to separate, and produced estimates significantly higher than those produced by using average weights from port sampling.
Coverage rates were greater than 120% in 1976, 1977,and 1984-86; between 80% and 120% in 1979-83 and1987-92; and less than 50% in 1978 (Fig. 3). Since thelogbook program was mandatory during this time, vessel coverage rates should have been 100%. Coveragerates not equal to 100% can be attributed to severalfactors: 1) use of an average weight to convert numbersof fish to catch in weight of fish may overestimate orunderestimate actual logbook catches; 2) landings underestimated due to some being classified as unknowngear; 3) fish kept for personal consumption; and 4)confusion at markets between gill net landings andharpoon landings, especially when a permittee had bothdrift gill net and harpoon permits. The extremely lowcoverage rate in 1978 is difficult to explain and may bedue to a deliberate misreporting of drift gill net catchesas harpoon landings, in an effort to circumvent the prohibition of drift gill net swordfish landings (Bedford, 1987).
Data on Sightings
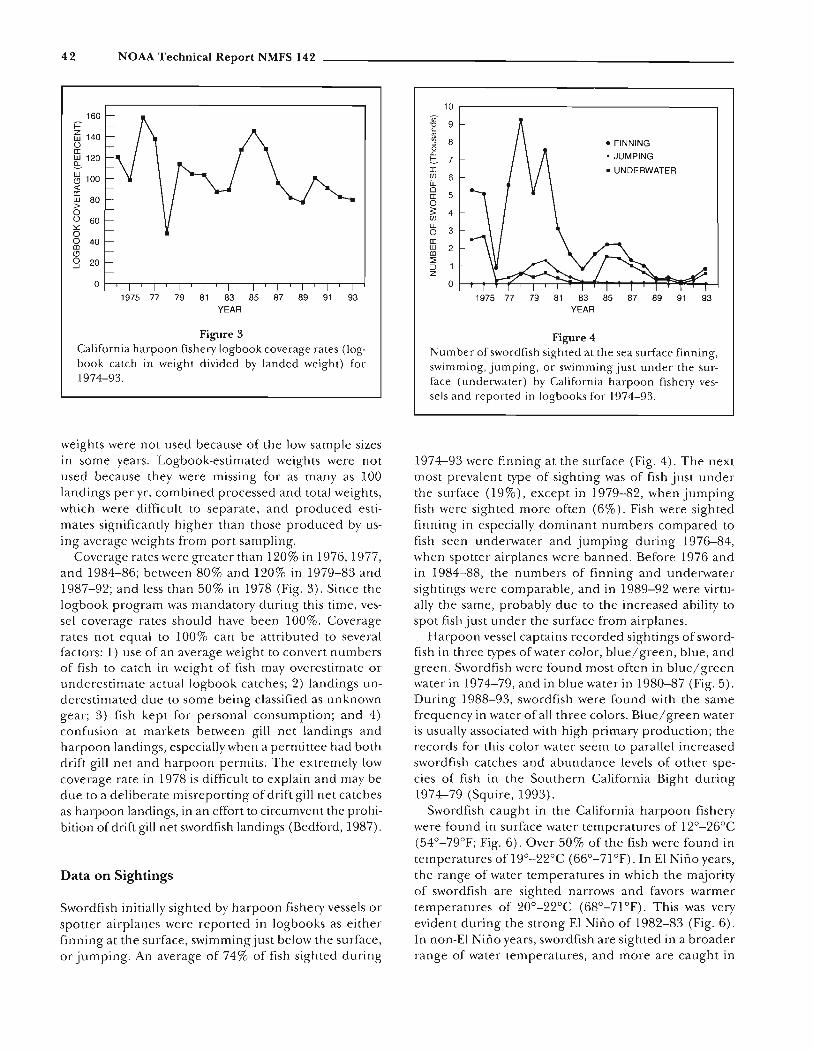
Swordfish initially sighted by harpoon fishery vessels orspotter airplanes were reported in logbooks as eitherfinning at the surface, swimmingjust below the surface,or jumping. An average of 74% of fish sighted during
10 ,....--------------------,
:jg 9c:
'"!g 8o
J::
C. 7I~ 6LL
@ 5o3: 4(/)
1) 3IT:~ 2::;::::JZ
1975 77 79 81 83 85 87 89 91 93YEAR
Figure 4Number of swordfish sighted at the sea surface finning,swimming, jumping, or swimming just under the surface (underwater) by California harpoon fishery vessels and reponed in logbooks for 1974-93.
1974-93 were finning at the surface (Fig. 4). The nextmost prevalent type of sighting was of fish just underthe surface (19%), except in 1979-82, when jumpingfish were sighted more often (6%). Fish were sightedfinning in especially dominant numbers compared tofish seen underwater and jumping during 1976-84,when spotter airplanes were banned. Before 1976 andin 1984-88, the numbers of finning and underwatersightings were comparable, and in 1989-92 were virtually the same, probably due to the increased ability tospot fish just under the surface from airplanes.
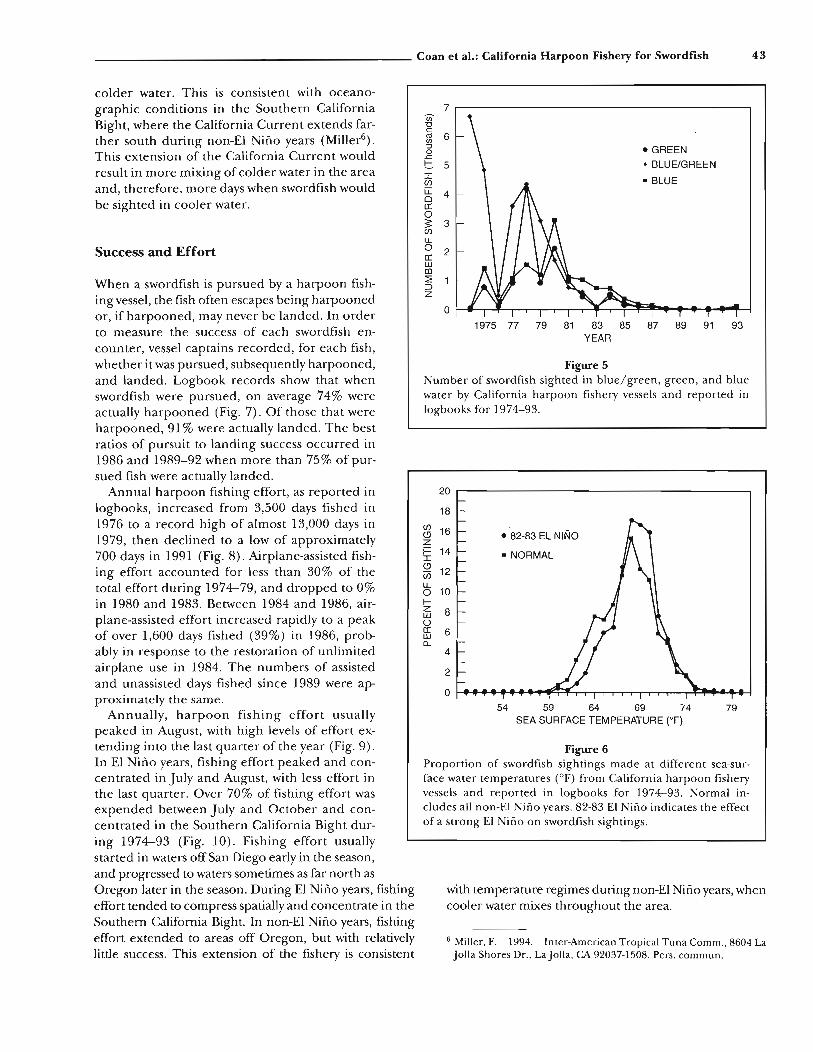
Harpoon vessel captains recorded sightings of swordfish in three types of water color, blue/green, blue, andgreen. Swordfish were found most often in blue/greenwater in 1974-79, and in blue water in 1980-87 (Fig. 5).During 1988-93, swordfish were found with the samefrequency in water of all three colors. Blue/green wateris usually associated with high primary production; therecords for this color water seem to parallel increasedswordfish catches and abundance levels of other species of fish in the Southern California Bight during1974-79 (Squire, 1993).
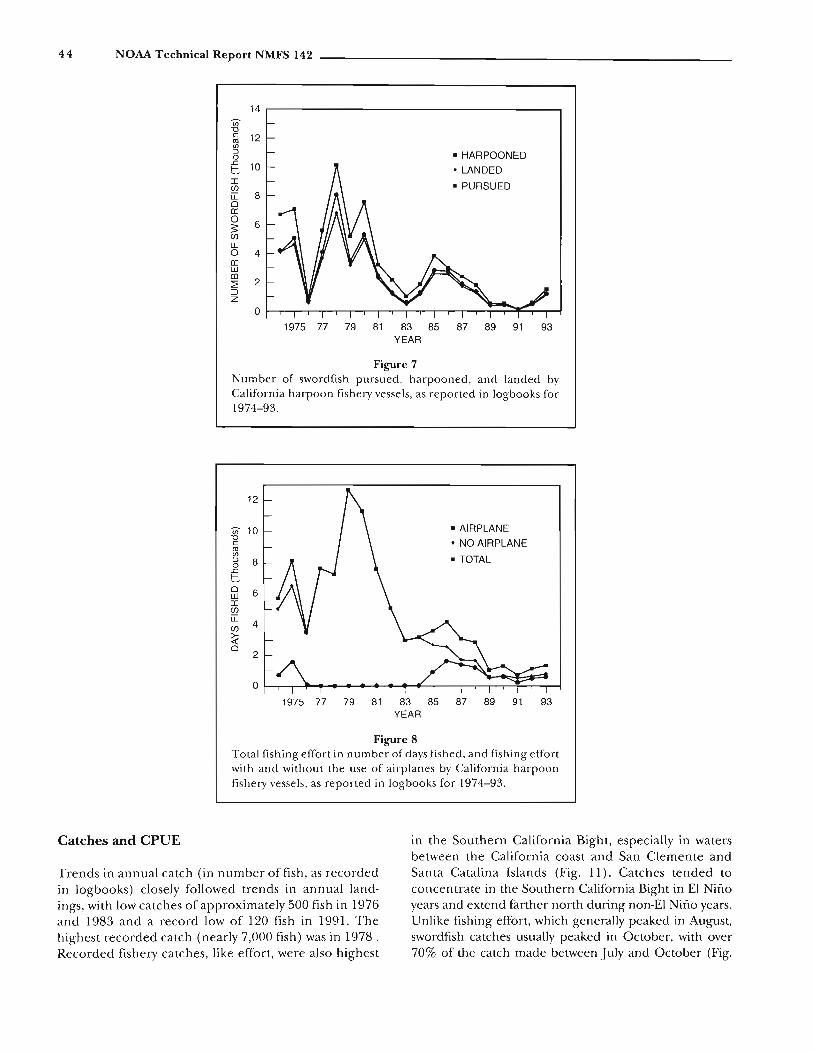
Swordfish caught in the California harpoon fisherywere found in surface water temperatures of 12°-26°C(54°-79°F; Fig. 6). Over 50% of the fish were found intemperatures of 19°-22°C (66°-71°F). In El Nino years,the range of water temperatures in which the majorityof swordfish are sighted narrows and favors warmertemperatures of 20°-22°C (68°-71°F). This was veryevident during the strong El Nino of 1982-83 (Fig. 6).In non-El Nino years, swordfish are sighted in a broaderrange of water temperatures, and more are caught in
_______________________ Coan et al.: California Harpoon Fishery for Swordfish 43
54 59 64 69 74 79SEA SURFACE TEMPERATURE (OF)
1975 77 79 81 83 85 87 89 91 93YEAR
with temperature regimes during non-El Nino years, whencooler water mixes throughout the area.
6 Miller, F. 1994. Inter-American Tropical Tuna Comm., 8604 LaJolla Shores Dr., La Jolla, CA 92037-1508. Pers. commun.
7U)"0cI1l 6enOJ
• GREEN0..c::C 5 • BLUE/GREENI
• BLUE(f)
u::: 40a:0~ 3(f)
LL0 2a:wCD::2:::JZ
Figure 5Number of swordfish sighted in blue/green, green, and bluewater by California harpoon fishery vessels and reported inlogbooks for 1974-93.
20
18
(f)16<.9 • 82-83 EL NINOz
f= 14 • NORMALI<.9
12(j)LL0 10I-Z 8wua: 6illa..
4
2
0
Figure 6Proportion of swordfish sightings made at different sea-surface water temperatures (OF) from California harpoon fisheryvessels and reported in logbooks for 1974-93. Normal includes all non-EI Nino years. 82-83 EI Nino indicates the effectof a strong EI Nino on swordfish sightings.
Success and Effort
colder water. This is consistent with oceano-graphic conditions in the Southern CaliforniaBight, where the California Current extends farther south during non-El Nino years (Miller6).
This extension of the California Current wouldresult in more mixing of colder water in the areaand, therefore, more days when swordfish wouldbe sighted in cooler water.
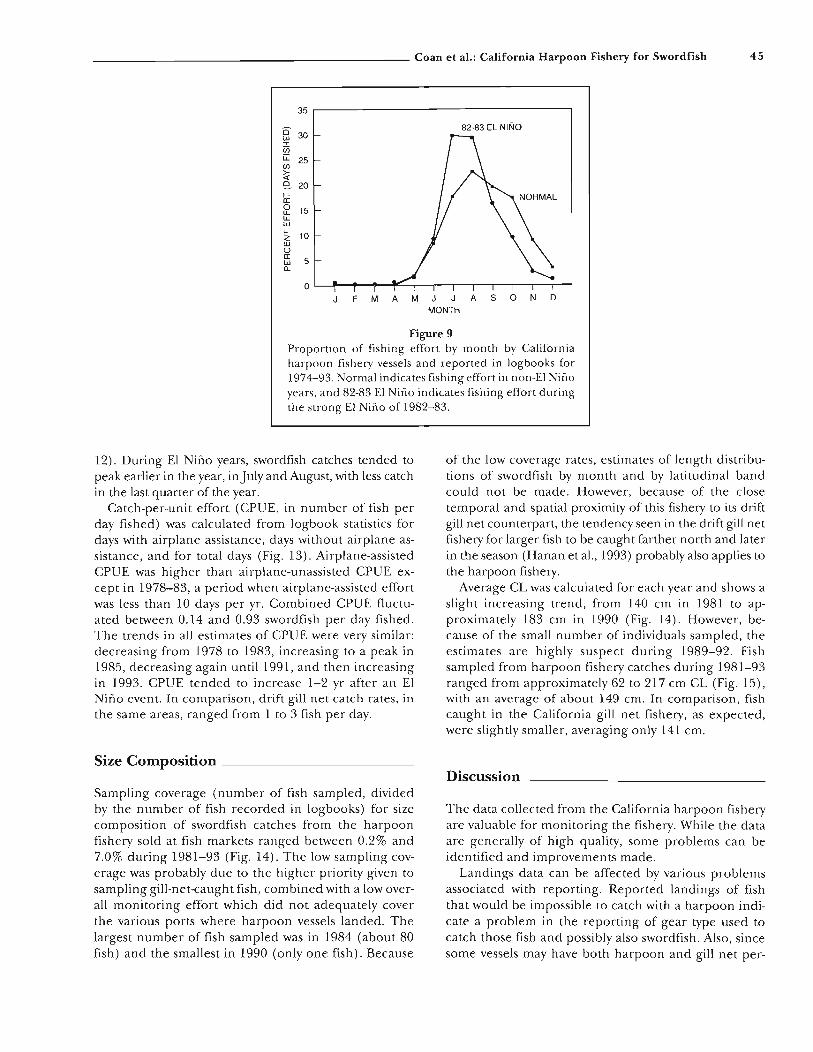
When a swordfish is pursued by a harpoon fishing vessel, the fish often escapes being harpoonedor, if harpooned, may never be landed. In orderto measure the success of each swordfish encounter, vessel captains recorded, for each fish,whether it was pursued, subsequently harpooned,and landed. Logbook records show that whenswordfish were pursued, on average 74% wereactually harpooned (Fig. 7). Of those that wereharpooned, 91 % were actually landed. The bestratios of pursuit to landing success occurred in1986 and 1989-92 when more than 75% of pursued fish were actually landed.
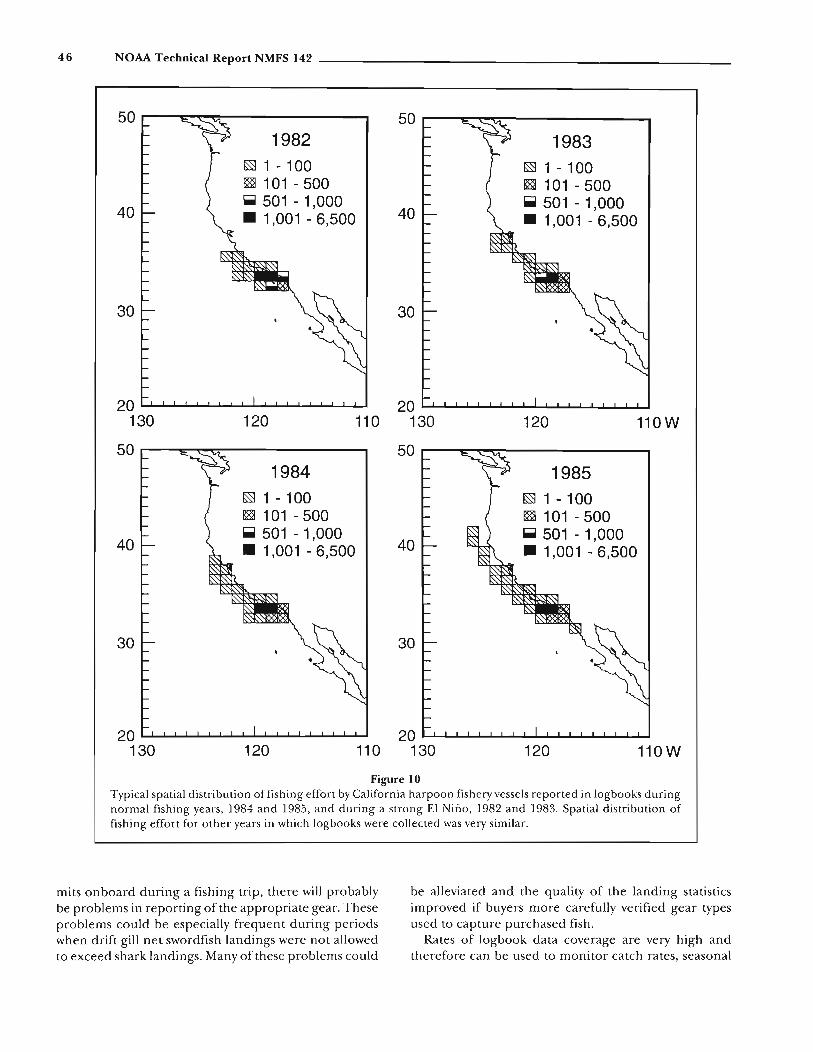
Annual harpoon fishing effort, as reported inlogbooks, increased from 3,500 days fished in1976 to a record high of almost 13,000 days in1979, then declined to a low of approximately700 days in 1991 (Fig. 8). Airplane-assisted fishing effort accounted for less than 30% of thetotal effort during 1974-79, and dropped to 0%in 1980 and 1983. Between 1984 and 1986, airplane-assisted effort increased rapidly to a peakof over 1,600 days fished (39%) in 1986, probably in response to the restoration of unlimitedairplane use in 1984. The numbers of assistedand unassisted days fished since 1989 were approximately the same.
Annually, harpoon fishing effort usuallypeaked in August, with high levels of effort extending into the last quarter of the year (Fig. 9).In El Nino years, fishing effort peaked and concentrated in July and August, with less effort inthe last quarter. Over 70% of fishing effort wasexpended between July and October and concentrated in the Southern California Bight dur-ing 1974-93 (Fig. 10). Fishing effort usuallystarted in waters off San Diego early in the season,and progressed to waters sometimes as far north asOregon later in the season. During El Nino years, fishingeffort tended to compress spatially and concentrate in theSouthern California Bight. In non-El Nino years, fishingeffort extended to areas off Oregon, but with relativelylittle success. This extension of the fishery is consistent
44 NOAA Technical Report NMFS 142
14Ul"0c 12Cll(/):::l
• HARPOONED0.s= 10!::: • LANDEDI
• PURSUED(j)
u::: 80a:0 6:s:(j)
LL0 4a:wm
2~::JZ
0
1975 77 79 81 83 85 87 89 91 93YEAR
Figure 7Number of swordfish pursued, harpooned, and landed byCalifornia harpoon fishery vessels, as reported in logbooks for1974-93.
12
Ul 10 • AIRPLANE"0
• NO AIRPLANEcCll(/)
• TOTAL:::l 80.s=!:::0 6wI(j)
u::: 4(j)
~0
2
0
1975 77 79 81 83 85 87 89 91 93YEAR
Figure 8Total fishing effort in number of days fished, and fishing effortwith and without the use of airplanes by California harpoonfishery vessels, as reported in logbooks for 1974-93.
Catches and CPUE
Trends in annual catch (in number of fish, as recordedin logbooks) closely followed trends in annual landings, with low catches of approximately 500 fish in 1976and 1983 and a record low of 120 fish in 1991. Thehighest recorded catch (nearly 7,000 fish) was in 1978.Recorded fishery catches, like effort, were also highest
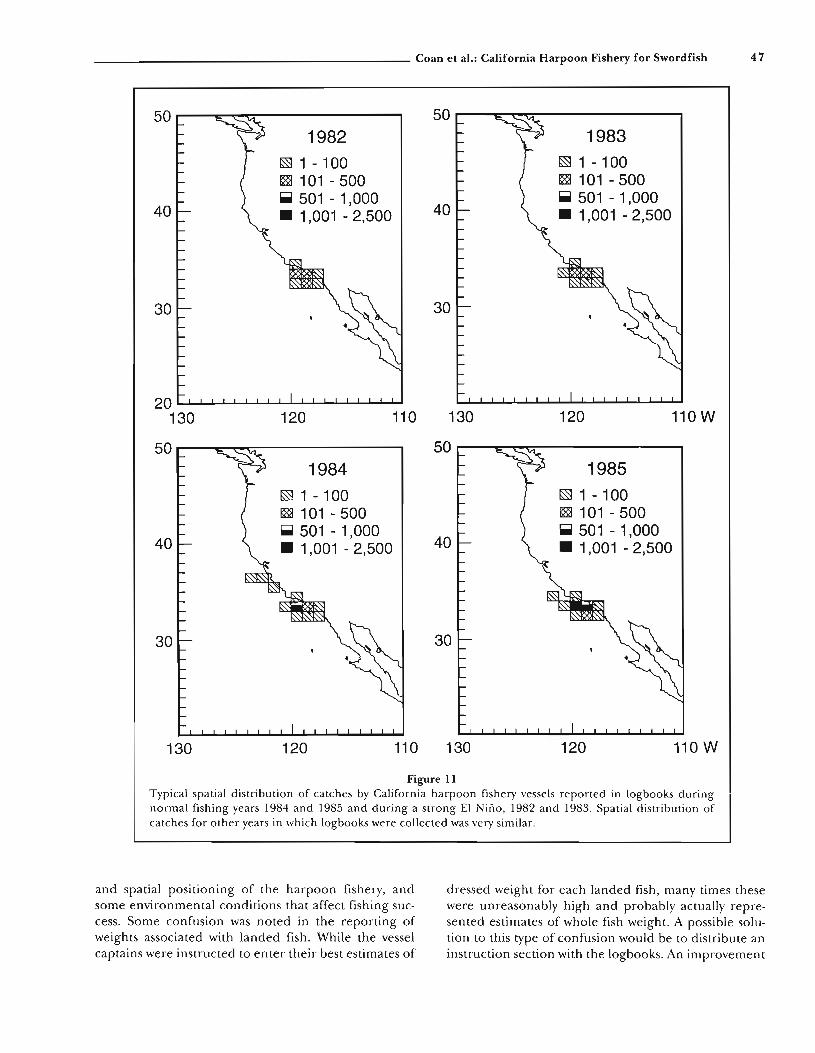
in the Southern California Bight, especially in watersbetween the California coast and San Clemente andSanta Catalina Islands (Fig. 11). Catches tended toconcen trate in the Southern California Bight in El Ninoyears and extend farther north during non-El Nino years.Unlike fishing effort, which generally peaked in August,swordfish catches usually peaked in October, with over70% of the catch made between July and October (Fig.
_______________________ Coan et al.: California Harpoon Fishery for Swordfish 45
35
0- 82-83 EL NINOU.J 30I(fJ
u:: 25(fJ
~e. 20f-a:0 15LLLLU.Jf- 10zU.Jua:
5U.JCL
J F M A M J J A SON DMONTH
Figure 9Proportion of fishing effort by month by Californiaharpoon fishery vessels and reported in logbooks for1974-93. Normal indicates fishing effort in non-El NiilOyears, and 82-83 EI Nino indicates fishing effort duringthe strong El Nino of 1982-83.
12). During EI Nino years, swordfish catches tended topeak earlier in the year, inJuly and August, with less catchin the last quarter of the year.
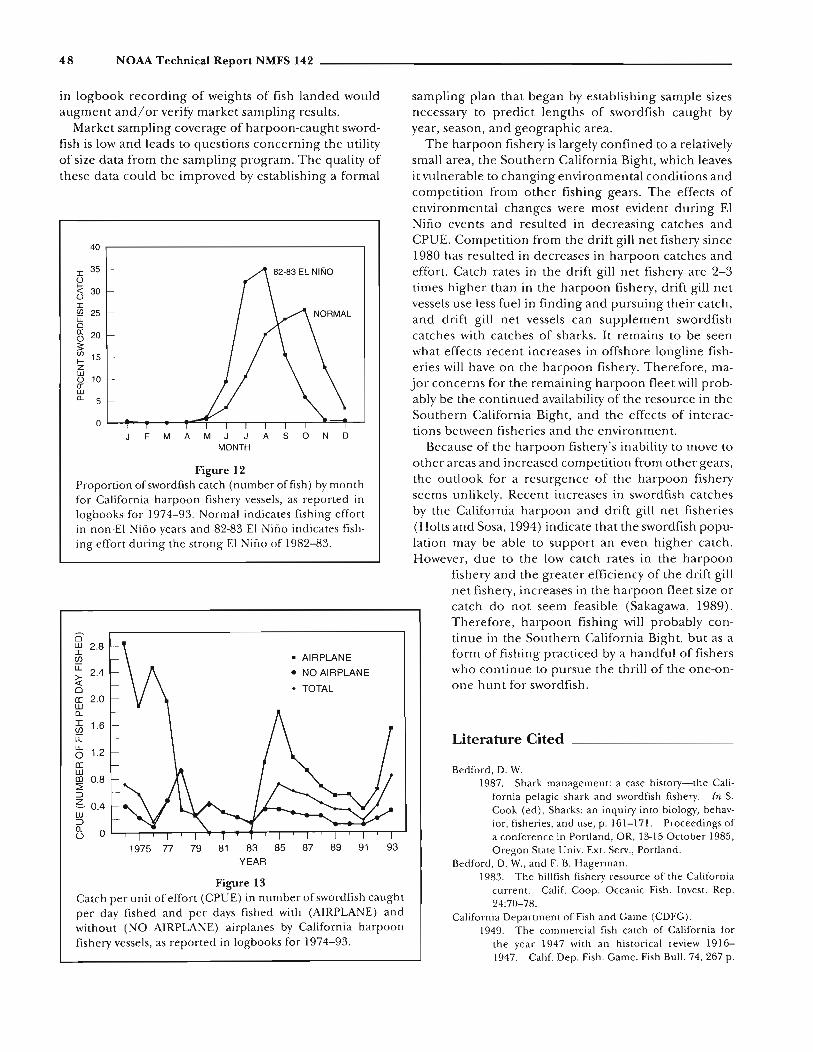
Catch-per-unit effort (CPUE, in number of fish perday fished) was calculated from logbook statistics fordays with airplane assistance, days without airplane assistance, and for total days (Fig. 13). Airplane-assistedCPUE was higher than airplane-unassisted CPUE except in 1978-83, a period when airplane-assisted effortwas less than 10 days per yr. Combined CPUE fluctuated between 0.14 and 0.93 swordfish per day fished.The trends in all estimates of CPUE were very similar:decreasing from 1978 to 1983, increasing to a peak in1985, decreasing again until 1991, and then increasingin 1993. CPUE tended to increase 1-2 yr after an EINiilO event. In comparison, drift gill net catch rates, inthe same areas, ranged from 1 to 3 fish per day.
Size Composition _
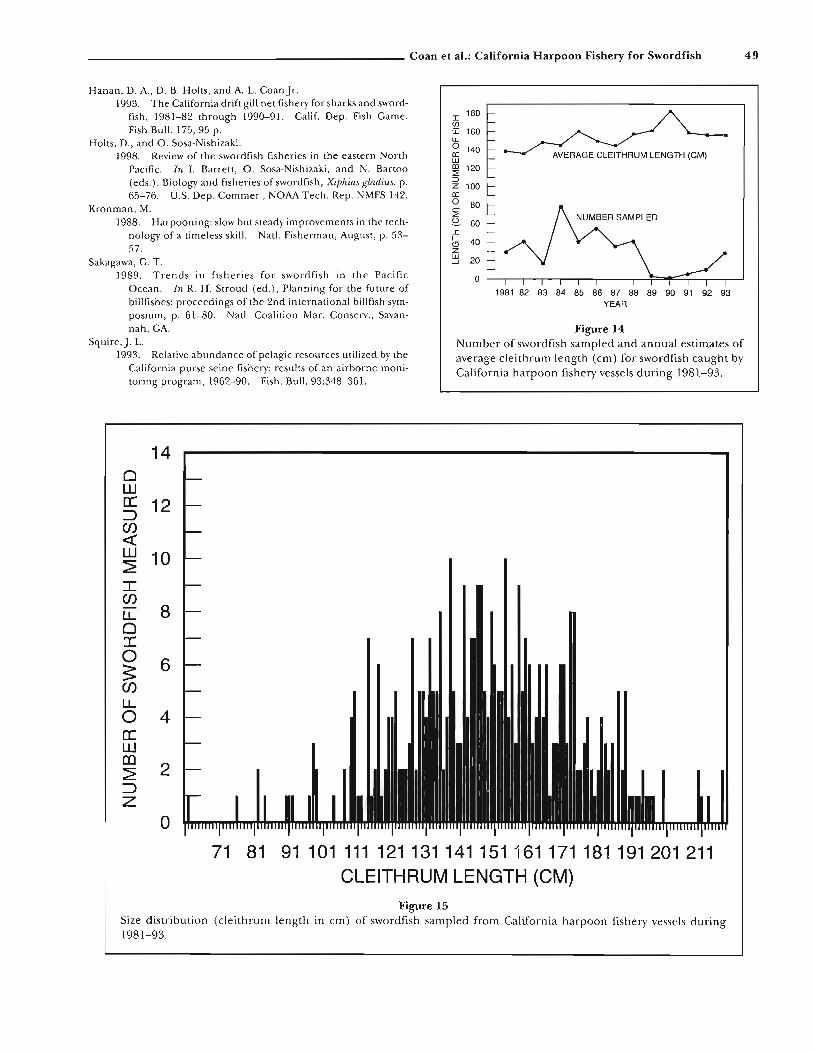
Sampling coverage (number of fish sampled, dividedby the number of fish recorded in logbooks) for sizecomposition of swordfish catches from the harpoonfishery sold at fish markets ranged between 0.2% and7.0% during 1981-93 (Fig. 14). The low sampling coverage was probably due to the higher priority given tosampling gill-net-caught fish, combined with a low overall monitoring effort which did not adequately coverthe various ports where harpoon vessels landed. Thelargest number of fish sampled was in 1984 (about 80fish) and the smallest in 1990 (only one fish). Because
of the low coverage rates, estimates of length distributions of swordfish by month and by latitudinal bandcould not be made. However, because of the closetemporal and spatial proximity of this fishery to its driftgilI net counterpart, the tendency seen in the drift gilI netfishery for larger fish to be caught farther north and laterin the season (Hanan et a\., 1993) probably also applies tothe harpoon fishery.
Average CL was calculated for each year and shows aslight increasing trend, from 140 cm in 1981 to approximately 183 cm in 1990 (Fig. 14). However, because of the small number of individuals sampled, theestimates are highly suspect during 1989-92. Fishsampled from harpoon fishery catches during 1981-93ranged from approximately 62 to 217 cm CL (Fig. 15),with an average of about 149 cm. In comparison, fishcaught in the California gill net fishery, as expected,were slightly smaller, averaging only 141 cm.
Discussion
The data collected from the California harpoon fisheryare valuable for monitoring the fishery. While the dataare generally of high quality, some problems can beidentified and improvements made.
Landings data can be affected by various problemsassociated with reporting. Reported landings of fishthat would be impossible to catch with a harpoon indicate a problem in the reporting of gear type used tocatch those fish and possibly also swordfish. Also, sincesome vessels may have both harpoon and gill net per-
46 NOAA Technical Report NMFS 142 _
30
50 501982 1983
[SS 1 - 100 [SS 1 - 100~ 101 - 500 ~ 101 - 500
40.. 501 - 1,000
40.. 501 -1,000
• 1,001 - 6,500 • 1,001 - 6,500
30
3030
20 20130 120 110 130 120 110W
50 501984 1985
[SS 1 - 100 [SS 1 - 100~ 101 - 500 ~ 101 - 500
40.. 501 - 1,000
40.. 501 - 1,000
• 1,001 - 6,500 • 1,001 - 6,500
110W12020 1...-I-..............l....l.....L...I....I.................l....l.....L...I....I.................l....l..... 20 '--'-..............l....l....l..-L.....l.....I.....l......l....l....l..-L....L....L...L.....l....I.....
130 120 11 0 130
Figure 10Typical spatial distribution of fishing effort by California harpoon fishery vessels reported in logbooks duringnormal fishing years, 1984 and 1985, and during a strong El Nino, 1982 and 1983. Spatial distribution offishing effort for other years in which logbooks were collected was very similar.
mits onboard during a fishing trip, there will probablybe problems in reporting of the appropriate gear. Theseproblems could be especially frequent during periodswhen drift gill net swordfish landings were not allowedto exceed shark landings. Many of these problems could
be alleviated and the quality of the landing statisticsimproved if buyers more carefully verified gear typesused to capture purchased fish.
Rates of logbook data coverage are very high andtherefore can be used to monitor catch rates, seasonal
____________________ Coan et al.: California Harpoon Fishery for Swordfish 47
30
30
20130 120 110 130 120 110W
50 50
1984 1985~ 1 - 100 ~ 1 - 100~ 101 - 500 ~ 101 - 500Iiiiiiil 501 - 1,000
40Iiiiiiil 501 - 1,000
40 • 1,001 - 2,500 • 1,001 - 2,500
30
50 50
1982 1983~ 1 - 100 ~ 1 - 100~ 101 - 500 ~ 101 - 500Iiiiiiil 501 - 1,000
40Iiiiiiil 501 - 1,000
40 • 1,001 - 2,500 • 1,001 - 2,500
30
130 120 110 130 120 110 W
Figure 11Typical spatial distribution of catches by California harpoon fishery vessels reported in logbooks duringnormal fishing years 1984 and 1985 and during a strong El NiilO, 1982 and 1983. Spatial distribution ofcatches for other years in which logbooks were collected was very similar.
and spatial positioning of the harpoon fishery, andsome environmental conditions that affect fishing success. Some confusion was noted in the reporting ofweights associated with landed fish. While the vesselcaptains were instructed to enter their best estimates of
dressed weight for each landed fish, many times thesewere unreasonably high and probably actually represented estimates of whole fish weight. A possible solution to this type of confusion would be to distribute aninstruction section with the logbooks. An improvement
48 NOAA Technical Report NMFS 142
J F M A M J J A SON 0MONTH
Figure 12Proportion ofswordfish catch (number offish) by monthfor California harpoon fishery vessels, as reported inlogbooks for 1974-93. Normal indicates fishing effortin non-EI Nino years and 82-83 EI ino indicates fishing effort during the strong EI Nino of 1982-83.
in logbook recording of weights of fish landed wouldaugment and/or verify market sampling results.
Market sampling coverage of harpoon-caught swordfish is low and leads to questions concerning the utilityof size data from the sampling program. The quality ofthese data could be improved by establishing a formal
Literature Cited
sampling plan that began by establishing sample sizesnecessary to predict lengths of swordfish caught byyear, season, and geographic area.
The harpoon fishery is largely confined to a relativelysmall area, the Southern California Bight, which leavesit vulnerable to changing environmental conditions andcompetition from other fishing gears. The effects ofenvironmental changes were most evident during ElNino events and resulted in decreasing catches andCPUE. Competition from the drift gill net fishery since1980 has resulted in decreases in harpoon catches andeffort. Catch rates in the drift gill net fishery are 2-3times higher than in the harpoon fishery, drift gill netvessels use less fuel in finding and pursuing their catch,and drift gill net vessels can supplement swordfishcatches with catches of sharks. It remains to be seenwhat effects recent increases in offshore longline fisheries will have on the harpoon fishery. Therefore, major concerns for the remaining harpoon fleet will probably be the continued availability of the resource in theSouthern California Bight, and the effects of interactions between fisheries and the environment.
Because of the harpoon fishery's inability to move toother areas and increased competition from other gears,the outlook for a resurgence of the harpoon fisheryseems unlikely. Recent increases in swordfish catchesby the California harpoon and drift gill net fisheries(Holts and Sosa, 1994) indicate that the swordfish population may be able to support an even higher catch.However, due to the low catch rates in the harpoon
fishery and the greater efficiency of the drift gillnet fishery, increases in the harpoon fleet size orcatch do not seem feasible (Sakagawa, 1989).Therefore, harpoon fishing will probably continue in the Southern California Bight, but as aform of fishing practiced by a handful of fisherswho continue to pursue the thrill of the one-onone hunt for swordfish.
Bedford, D. W.1987. Shark management: a case history-the Cali
fornia pelagic shark and swordfish fishery. In S.Cook (ed), Sharks: an inquiry into biology, behavior, fisheries, and use, p. 161-171. Proceedings ofa conference in Portland, OR, 13-15 October 1985,Oregon State Univ. Ext. Serv., Portland.
Bedford, D. W., and F. B. Hagerman.1983. The billfish fishery resource of the California
current. Calif. Coop. Oceanic Fish. Invest. Rep.24:70-78.
California Department ofFish and Game (CDFG).1949. The commercial fish catch of California for
the year 1947 with an historical review 19161947. Calif. Dep. Fish. Game. Fish Bull. 74, 267 p.
• AIRPLANE
• NO AIRPLANE
• TOTAL
40
I 35u~ 30uIUJ 25u:::0a:: 20as:UJ 15I-zwU 10a::wQ. 5
0
1975 77 79 81 83 85 87 89 91 93YEAR
Figure 13Catch per unit of effort (CPUE) in number of swordfish caughtper day fished and per days fished with (AIRPLA E) andwithout (NO AIRPLANE) airplanes by California harpoonfishery vessels, as reported in logbooks for 1974-93.
0'~ 2.8(f)
u::: 2.4~oa: 2.0UJD..
Vi 1.6u:::~ 1.2a:UJco 0.8::2;::J~ 0.4UJ::J13 0 L-.,...-.,...--r--r--r--r-~""""""-+--r"....,.......,...-.--r--r---r--,---,,....-r-'
_________________________ Coan et al.: California Harpoon Fishery for Swordfish 49
1981 82 83 84 85 86 87 88 89 90 91 92 93YEAR
Figure 14Number of swordfish sampled and annual estimates ofaverage cleithrum length (em) for swordfish caught byCalifornia harpoon fishery vessels during 1981-93.
I180
(f)
u::: 160LL0 140IT: AVERAGE CLEITHRUM LENGTH (CM)wlD 120::;::JZ 100IT:0 80~~ 60II- 40(9zw 20--'
0
Hanan, D. A., D. B. Holts, and A. L. CoanJr.1993. The California drift gill net fishery for sharks and sword
fish, 1981-82 through 1990-91. Calif. Dep. Fish Game.Fish Bull. 175,95 p.
Holts, D., and O. Sosa-Nishizaki.1998. Review of the swordfish fisheries in the eastern North
Pacific. In I. Barrett, O. Sosa- ishizaki, and N. Bartoo(eds.), Biology and fisheries of swordfish, Xiphias gladius, p.65-76. u.s. Dep. Commer., NOAA Tech. Rep. NMFS 142.
Kronman, M.1988. Harpooning: slow but steady improvements in the tech
nology of a timeless skill. Natl. Fisherman, August, p. 5357.
Sakagawa, G. T.1989. Trends in fisheries for swordfish in the Pacific
Ocean. In R. H. Stroud (ed.), Planning for the future ofbillfishes: proceedings of the 2nd international billfish symposium, p. 61-80. Natl. Coalition Mar. Consel-v., Savannah, GA.
Squire, J. L.1993. Relative abundance of pelagic resources utilized by the
California purse seine fishery: results of an airborne monitoring program, 1962-90. Fish. Bull. 93:348-361.
140WII: 12::::>Cf)«w 10~
ICf)
u.. 80II:0 63:Cf)
u..0 4II:WOJ
2~::::>z
0
71 81 91 101 111 121131141151161171181191201 211CLEITHRUM LENGTH (CM)
Figure 15Size distribution (cleithrum length in em) of swordfish sampled from California harpoon fishery vessels during1981-93.
NOAA Technical Report NMFS 142A Technical Report of the Fishery Bulletin
Biology and Fisheries of Swordfish,Xiphias gladius
Papers from the International Symposium onPacific Swordfish, Ensenada, Mexico,11-14 December 1994
Izadore BarrettOscar Sosa-NishizakiNorman Bartoo (editors)
Cover illustration by Katherine Zecca
December 1998
u.s. Department of CommerceSeattle, Washington