The Budget Squeeze C. Eugene Steuerle The Urban Institute September 10 Stanford Institute for...
38
The Budget Squeeze C. Eugene Steuerle C. Eugene Steuerle The Urban Institute The Urban Institute September 10 September 10 Stanford Institute for Economic Stanford Institute for Economic Policy Research Policy Research
-
Upload
barbra-richard -
Category
Documents
-
view
273 -
download
7
Transcript of The Budget Squeeze C. Eugene Steuerle The Urban Institute September 10 Stanford Institute for...

The Budget Squeeze
C. Eugene SteuerleC. Eugene Steuerle
The Urban InstituteThe Urban Institute
September 10September 10
Stanford Institute for Economic Policy ResearchStanford Institute for Economic Policy Research
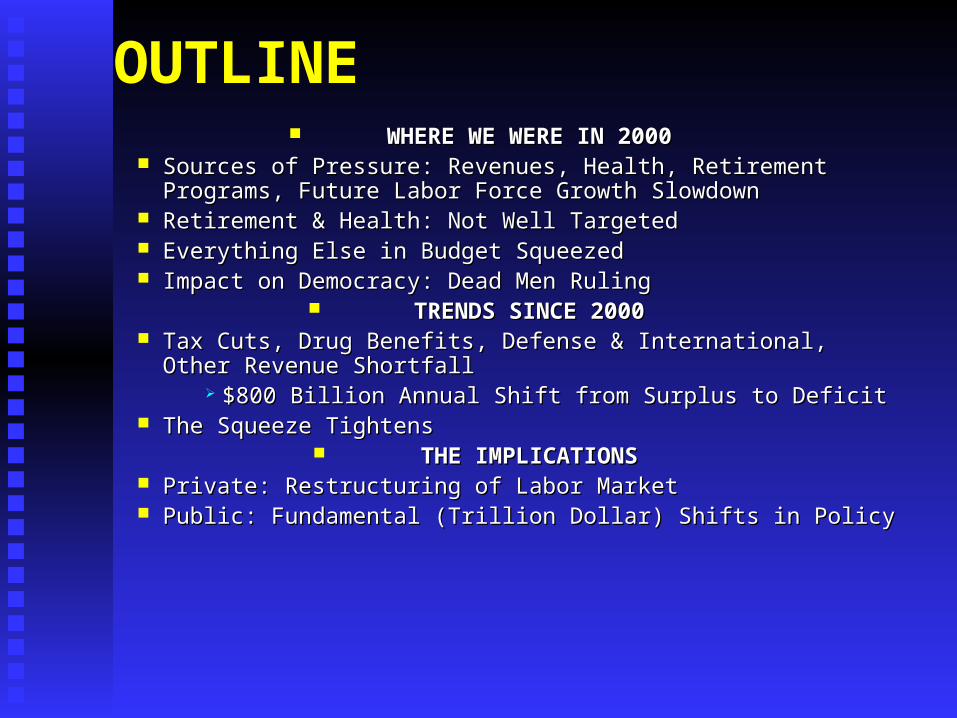
OUTLINE WHERE WE WERE IN 2000WHERE WE WERE IN 2000
Sources of Pressure: Revenues, Health, Retirement Programs, Future Sources of Pressure: Revenues, Health, Retirement Programs, Future Labor Force Growth SlowdownLabor Force Growth Slowdown
Retirement & Health: Not Well TargetedRetirement & Health: Not Well Targeted Everything Else in Budget SqueezedEverything Else in Budget Squeezed Impact on Democracy: Dead Men RulingImpact on Democracy: Dead Men Ruling
TRENDS SINCE 2000TRENDS SINCE 2000 Tax Cuts, Drug Benefits, Defense & International, Other Revenue Tax Cuts, Drug Benefits, Defense & International, Other Revenue
ShortfallShortfall $800 Billion Annual Shift from Surplus to Deficit $800 Billion Annual Shift from Surplus to Deficit
The Squeeze TightensThe Squeeze Tightens THE IMPLICATIONSTHE IMPLICATIONS
Private: Restructuring of Labor MarketPrivate: Restructuring of Labor Market Public: Fundamental (Trillion Dollar) Shifts in Policy Public: Fundamental (Trillion Dollar) Shifts in Policy

Federal Revenues by Source as a Percentage of GDP,1934-2008
Individual Income Taxes
Corporate Income Tax
Social Insurance and Retirement
Receipts
Excise Taxes* Other**
0.0%
3.0%
6.0%
9.0%
12.0%
15.0%
18.0%
21.0%
1934 1938 1942 1946 1950 1954 1958 1962 1966 1970 1974 1978 1982 1986 1990 1994 1998 2002 2006
* Includes receipts from highway, airport, telephone, alcohol, and tobacco.** Includes estate and gift taxes, customs duties, and miscellaneous receipts.Source: Eugene Steuerle and Adam Carasso, The Urban Institute, 2003. Historical data based on the Budget of the UnitedStates Government, FY 2004 and projections based on CBO's January 2003 budget projections.

Social Security
Medicare
Medicaid
0.0%
2.0%
4.0%
6.0%
8.0%
10.0%
12.0%
14.0%
16.0%
18.0%
20.0%
22.0%
24.0%
1950 1960 1970 1980 1990 2000 2010 2020 2030 2040 2050 2060 2070 2075
Social Security, Medicare, and Medicaid Outlays as a Percentage of GDP, Fiscal Years 1950-2075
Pressures from Elderly Programs People have been retiring earlierPeople have been retiring earlier People are living longerPeople are living longer Birth rates have fallenBirth rates have fallen Annual/lifetime benefits continue to riseAnnual/lifetime benefits continue to rise Health services grow & expand (quantity)Health services grow & expand (quantity) Healthcare insurance system reduces Healthcare insurance system reduces
downward price pressures normal for a downward price pressures normal for a growing industry (price)growing industry (price)

Social vs. Legal Pressures
Only the change in birth rates indicates a Only the change in birth rates indicates a growing growing need need in society.in society.
The other five are signs of increased well-The other five are signs of increased well-being or legal promises to pay out more.being or legal promises to pay out more.

68.7
64.1
50
55
60
65
70
1950 2000
INDIVIDUALS RETIRE EARLIER:AVERAGE AGE AT WHICH MALE WORKERS BEGIN RECEIVING
SOCIAL SECURITY BENEFITS
Source: Social Security Administration, Annual Statistical Supplement to the SocialSecurity Bulletin, 2001. Table 6.B5.

Life Expectancy at the Early Retirement Age
10
12
14
16
18
20
22
24
26
28
1940 1950 1960 1970 1980 1990 2000 2010 2020 2030 2040 2050 2060
Year of Retirement
Ave
rage
Num
ber o
f Yea
rs L
ived
in R
etire
men
t
Men Women
Source: Adam Carasso and C. Eugene Steuerle, The Urban Institute, 2003. Based on mortality data from the Social Security Administration, Office of the Chief Actuary.

OASI Benefit for a One-Earner Couple in First Year of Retirement
$0
$5,000
$10,000
$15,000
$20,000
$25,000
$30,000
$35,000
$40,000
$45,000
$50,000
1940 1950 1960 1970 1980 1990 2000 2010 2020 2030 2040 2050 2060
Year Cohort Turns 65
Co
nsta
nt 2
00
2 D
olla
rs
High Wage (160%)
Average Wage (100%)
Low Wage (45%)
Source: Adam Carasso and C. Eugene Steuerle. The Urban Institute, 2003. Update of C. Eugene Steuerleand Jon M. Bakija, Retooling Social Security for the 21st Century, Washington, DC: The Urban Institute, 1994.
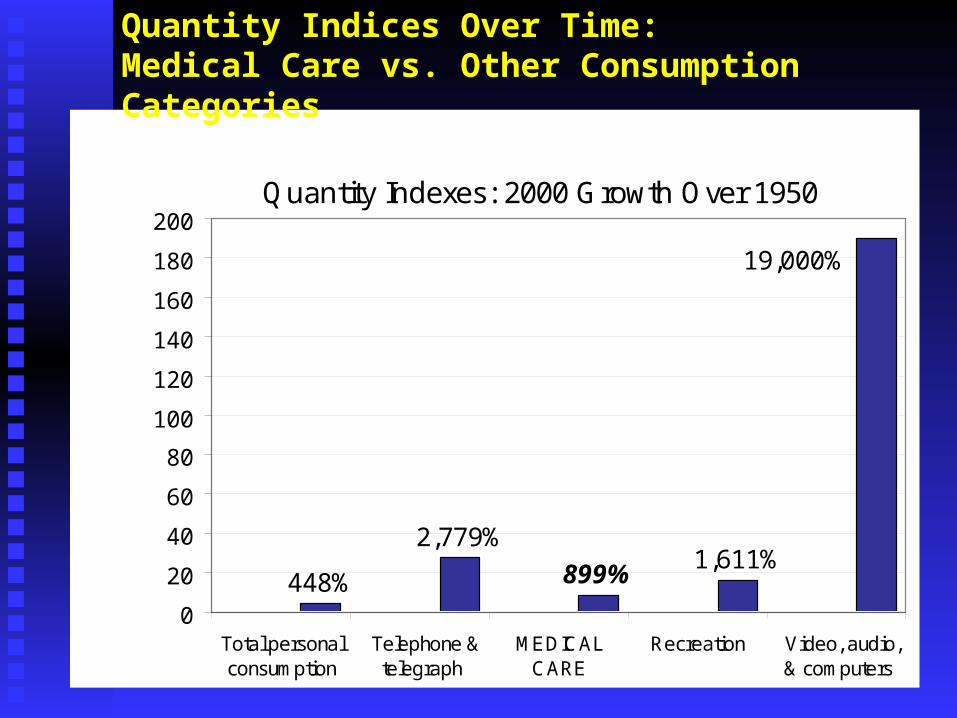
Quantity Indexes: 2000 Growth Over 1950
448%
2,779%1,611%
899%
19,000%
0
20
40
60
80
100
120
140
160
180
200
Total personalconsumption
Telephone &telegraph
MEDICALCARE
Recreation Video, audio,& computers
Quantity Indices Over Time: Medical Care vs. Other Consumption Categories

Price Indexes: 2000 Growth Over 1950
494%
118%180%
-79%
1,074%
-200%
0%
200%
400%
600%
800%
1000%
1200%
Total personalconsumption
Telephone &telegraph
MEDICALCARE
Recreation Video, audio,& computers
Pe
rce
nt
Gro
wth
Be
twe
en
20
00
an
d 1
95
0
Price Indices Over Time: Medical Care vs. Other Consumption Categories

—Real 2002 Dollars—
* Expected rather than realized benefits. Notes: The “average” wage profile is a hypothetical profile routinely employed by the Social Security Administration in its analyses. Data are discounted to present value at age 65 using a 2 percent real interest rate. Table assumes survival to age 65. Projections based on intermediate assumptions of the 2002 OASDI and HI/SMI Trustees Reports. Source: C. Eugene Steuerle and Adam Carasso, The Urban Institute, 2002.
$23,000$0$23,000$160,000$0$160,000$15,0001960
$530,000
$360,000
$250,000
Soc. Security Lifetime Benefits
$490,000
$240,000
$80,000
Medicare Lifetime Benefits
$1,020,000
$600,000
$330,000
Total
Lifetime Benefits
$640,000
$345,000
$63,000
Total Lifetime
Taxes
$500,000
$290,000
$61,000
Soc. Security Lifetime
Taxes
$140,000
$55,000
$2,000
Medicare Lifetime
Taxes
$18,0001970
$38,0002030
$25,0002000
Soc. Security Annual Benefits
Year Cohort
Turns 65
Social Security and Expected* Medicare Benefits for Average-Wage, Two-Earner Couple

Number of Workers Available to Support Each Social Security Beneficiary
3.7 workers per beneficiary in 1970
3.3 workers per beneficiary in 2003
1.8 workers per beneficiary in 2080
0.0
0.5
1.0
1.5
2.0
2.5
3.0
3.5
4.0
1970 1980 1990 2000 2010 2020 2030 2040 2050 2060 2070 2080
Wo
rke
rs p
er
be
ne
ficia
ry
Source: Table IV.B2, "Covered Workers and Beneficiaries," from the 2002 and 2003 OASDI Trustees Report.
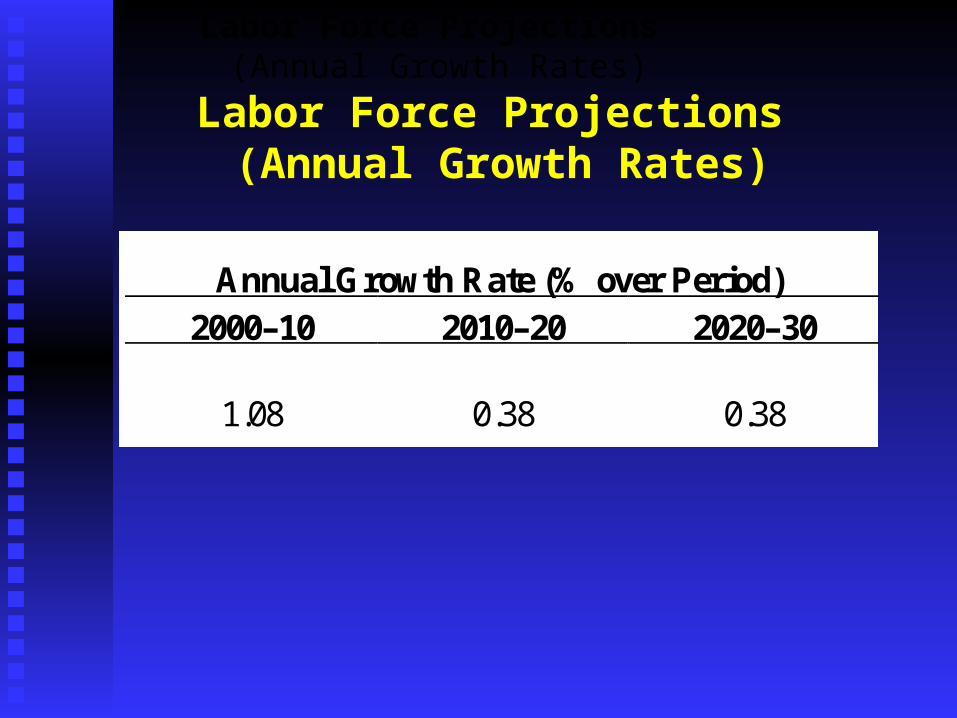
Annual Growth Rate (% over Period) 2000–10 2010–20 2020–30
1.08 0.38 0.38
Labor Force Projections (Annual Growth Rates)
Labor Force Projections (Annual Growth Rates)

Adult Employment Rate (Absent Changes in Retirement Patterns), 1950-2040
40%
45%
50%
55%
60%
65%
70%
1950 1960 1970 1980 1990 2000 2010 2020 2030 2040
Note: Projections show what happens if there is a change in age-specific employment rates as the population ages.Source: C. Eugene Steuerle and Adam Carasso, The Urban Institute, 2002. Based on data from the U.S. Bureaus of Censusand Labor Statistics.
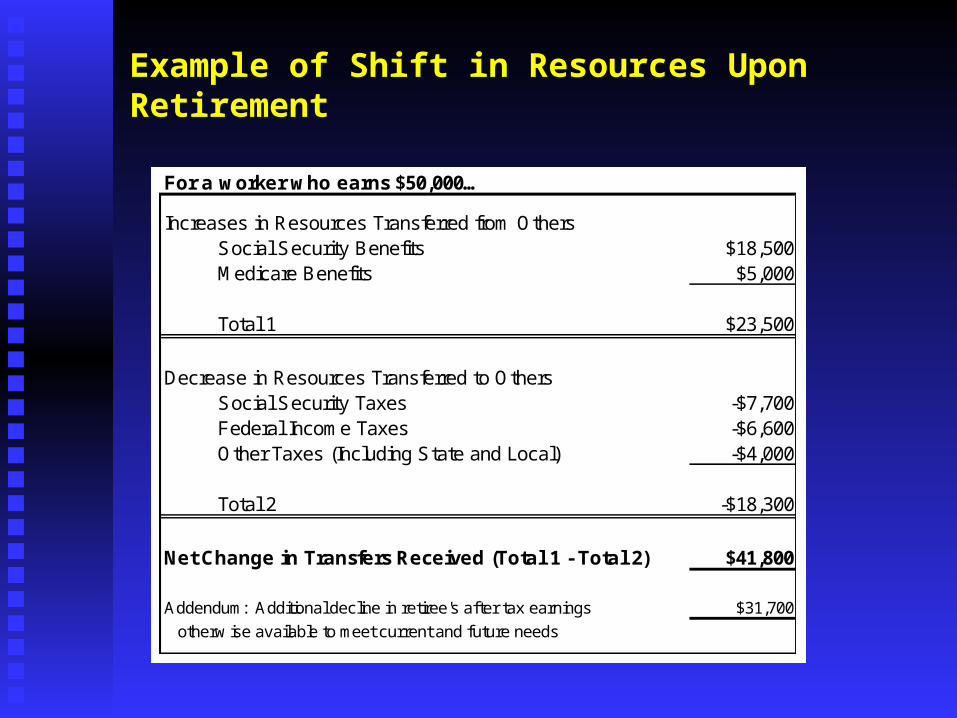
Example of Shift in Resources Upon Retirement
For a worker who earns $50,000…
Increases in Resources Transferred from OthersSocial Security Benefits $18,500Medicare Benefits $5,000
Total 1 $23,500
Decrease in Resources Transferred to OthersSocial Security Taxes -$7,700Federal Income Taxes -$6,600Other Taxes (Including State and Local) -$4,000
Total 2 -$18,300
Net Change in Transfers Received (Total 1 - Total 2) $41,800
Addendum: Additional decline in retiree's after tax earnings $31,700
otherw ise available to meet current and future needs
One Possible Reprieve
Despite debates over capital (individual Despite debates over capital (individual accounts), the main problem is laboraccounts), the main problem is labor
Many so-called elderly are middle-agedMany so-called elderly are middle-aged They still want to be productiveThey still want to be productive Government estimates may seriously Government estimates may seriously
understate potential labor demand for these understate potential labor demand for these workersworkers

30%
35%
40%
45%
50%
55%
60%
65%
70%
75%
1948 1953 1958 1963 1968 1973 1978 1983 1988 1993 1998
All 20+ Males 55+
Labor Force Participation: Males Aged 55 and Older vs. the Adult Population,1948-99

Multiple Gains if Work Expands
Fewer beneficiariesFewer beneficiaries More national output, divided into:More national output, divided into:
More taxes for elderly programsMore taxes for elderly programs More taxes for children’s and other More taxes for children’s and other
programsprograms More private wealth & income to be More private wealth & income to be
spread over fewer retirement years.spread over fewer retirement years.
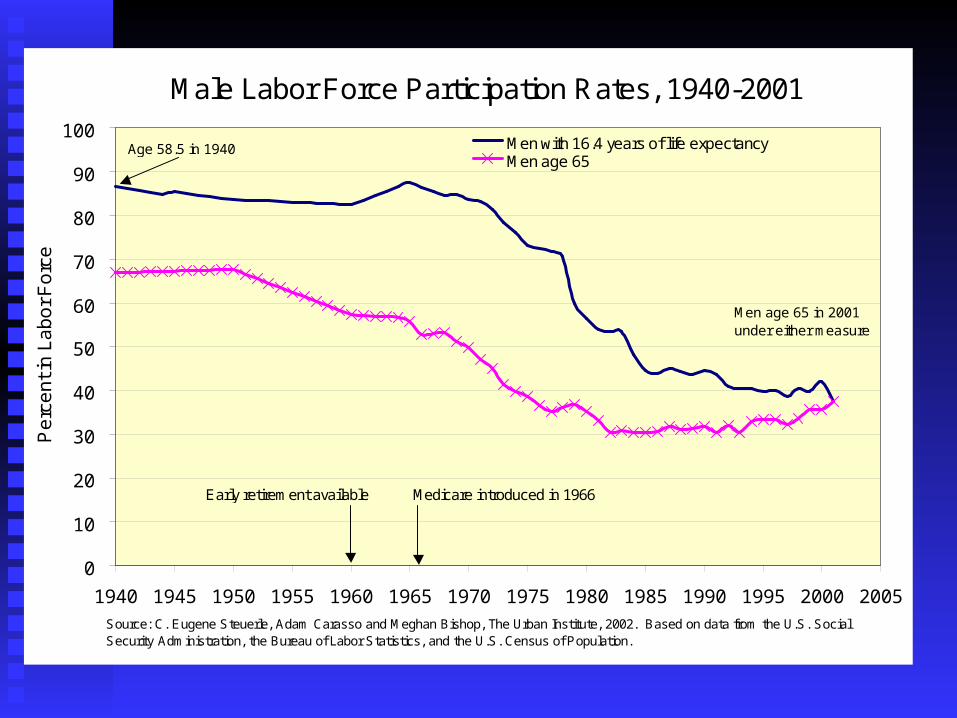
Male Labor Force Participation Rates, 1940-2001
0
10
20
30
40
50
60
70
80
90
100
1940 1945 1950 1955 1960 1965 1970 1975 1980 1985 1990 1995 2000 2005
Pe
rce
nt i
n L
ab
or
Fo
rce
Men with 16.4 years of life expectancyMen age 65
Source: C. Eugene Steuerle, Adam Carasso and Meghan Bishop, The Urban Institute, 2002. Based on data from the U.S. Social Security Administration, the Bureau of Labor Statistics, and the U.S. Census of Population.
Men age 65 in 2001 under either measure
Age 58.5 in 1940
Medicare introduced in 1966Early retirement available

Constricted Choices Among Elderly Programs Locked-in guarantees and growth rates Locked-in guarantees and growth rates
preventprevent taking better care of truly oldtaking better care of truly old removing inequities among beneficiariesremoving inequities among beneficiaries switching money toward long-term careswitching money toward long-term care removing elderly from povertyremoving elderly from poverty
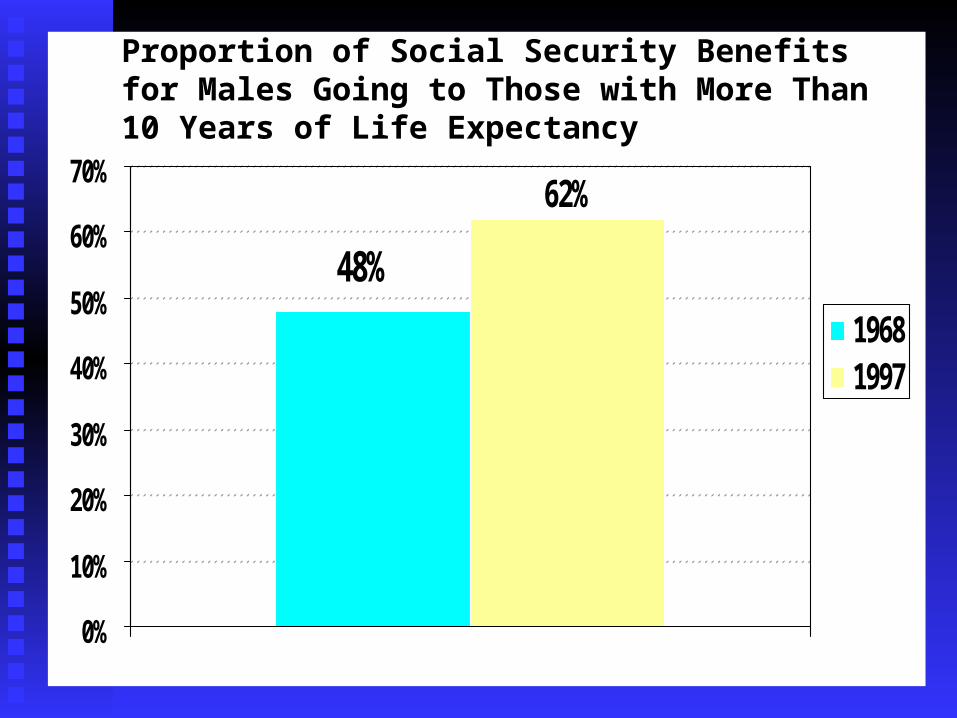
48%
62%
0%
10%
20%
30%
40%
50%
60%
70%
19681997
Proportion of Social Security Benefits for Males Going to Those with More Than 10 Years of Life Expectancy

Some Inequities
Current system discriminates:Current system discriminates: single heads of householdsingle heads of household
• receive less than married persons who receive less than married persons who contribute no more to systemcontribute no more to system
two-earner couplestwo-earner couples • receive fewer benefits for the same levels of receive fewer benefits for the same levels of
contribution when their earnings are split contribution when their earnings are split some divorced personssome divorced persons
• receive no share of their spouses’ benefits if receive no share of their spouses’ benefits if married fewer than 10 yearsmarried fewer than 10 years

Long-term “Long-term” Care
There does remain a serious long-term care There does remain a serious long-term care issue for the very oldissue for the very old
By providing increasing amounts to those By providing increasing amounts to those relatively younger, current system actually relatively younger, current system actually makes problem harder to solvemakes problem harder to solve

Comparison of Average Benefits, Poverty Level, and Elderly Poverty Rate
$8,917
$11,140
$8,628$8,6287.8%
4.2%
0
2,000
4,000
6,000
8,000
10,000
12,000
Early 1990s 2020
In C
onst
ant 2
002
Dol
lars
0.0%
2.0%
4.0%
6.0%
8.0%
10.0%
Pov
erty
Rat
e
Avg. Benefit Poverty Level Poverty Rate
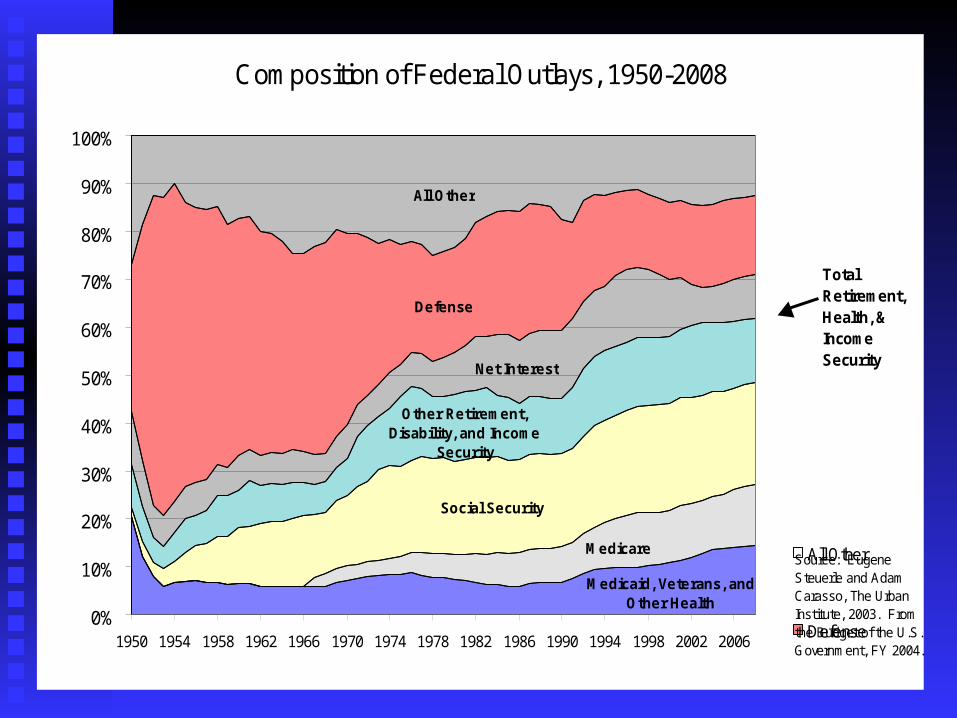
Composition of Federal Outlays, 1950-2008
Medicaid, Veterans, and Other Health
Medicare
Social Security
Other Retirement, Disability, and Income
Security
Net Interest
Defense
All Other
0%
10%
20%
30%
40%
50%
60%
70%
80%
90%
100%
1950 1954 1958 1962 1966 1970 1974 1978 1982 1986 1990 1994 1998 2002 2006
All Other
Defense
Net Interest
OtherRetirement,Disability, andIncome SecuritySocial Security
Medicare
Medicaid,Veterans, andOther Health
Total Retirement, Health, & Income Security
Source: Eugene Steuerle and Adam Carasso, The Urban Institute, 2003. From the Budget of the U.S. Government, FY 2004.

Federal Outlays as a Percentage of GDP, 1962-2002
Defense and International
0.0
2.0
4.0
6.0
8.0
10.0
12.0
1962 1967 1972 1977 1982 1987 1992 1997 2002
Social Security, Medicare, and Medicaid
0.0
2.0
4.0
6.0
8.0
10.0
12.0
1962 1967 1972 1977 1982 1987 1992 1997 2002
Net Interest
0.0
2.0
4.0
6.0
8.0
10.0
12.0
1962 1967 1972 1977 1982 1987 1992 1997 2002
Other Domestic
0.0
2.0
4.0
6.0
8.0
10.0
12.0
1962 1967 1972 1977 1982 1987 1992 1997 2002
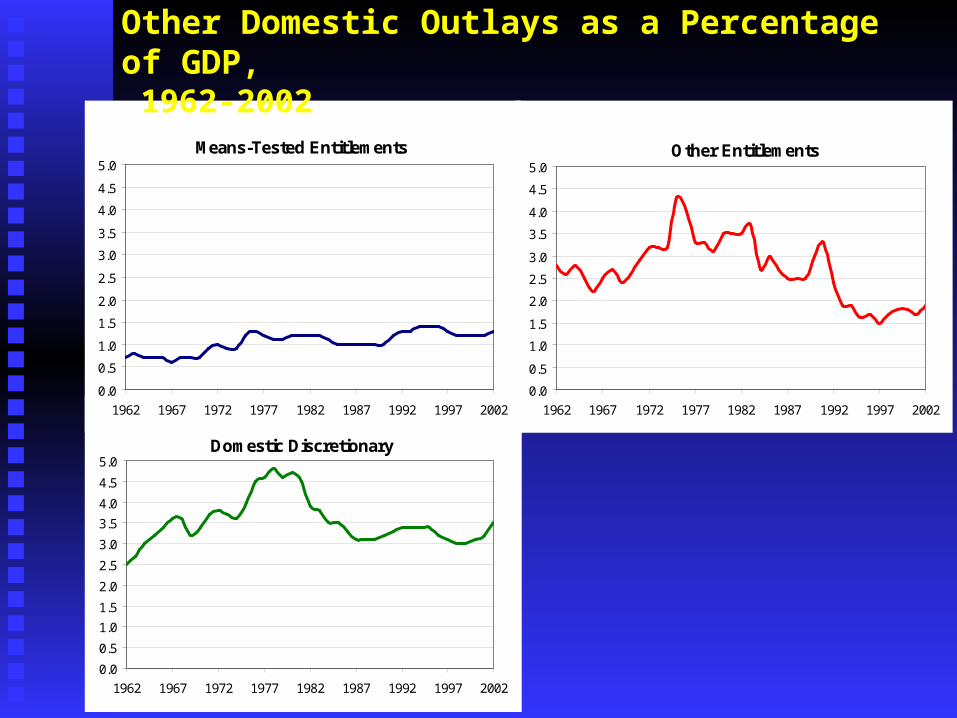
Domestic Discretionary
0.0
0.5
1.0
1.5
2.0
2.5
3.0
3.5
4.0
4.5
5.0
1962 1967 1972 1977 1982 1987 1992 1997 2002
Means-Tested Entitlements
0.0
0.5
1.0
1.5
2.0
2.5
3.0
3.5
4.0
4.5
5.0
1962 1967 1972 1977 1982 1987 1992 1997 2002
Other Entitlements
0.0
0.5
1.0
1.5
2.0
2.5
3.0
3.5
4.0
4.5
5.0
1962 1967 1972 1977 1982 1987 1992 1997 2002
Other Domestic Outlays as a Percentage of GDP, 1962-2002
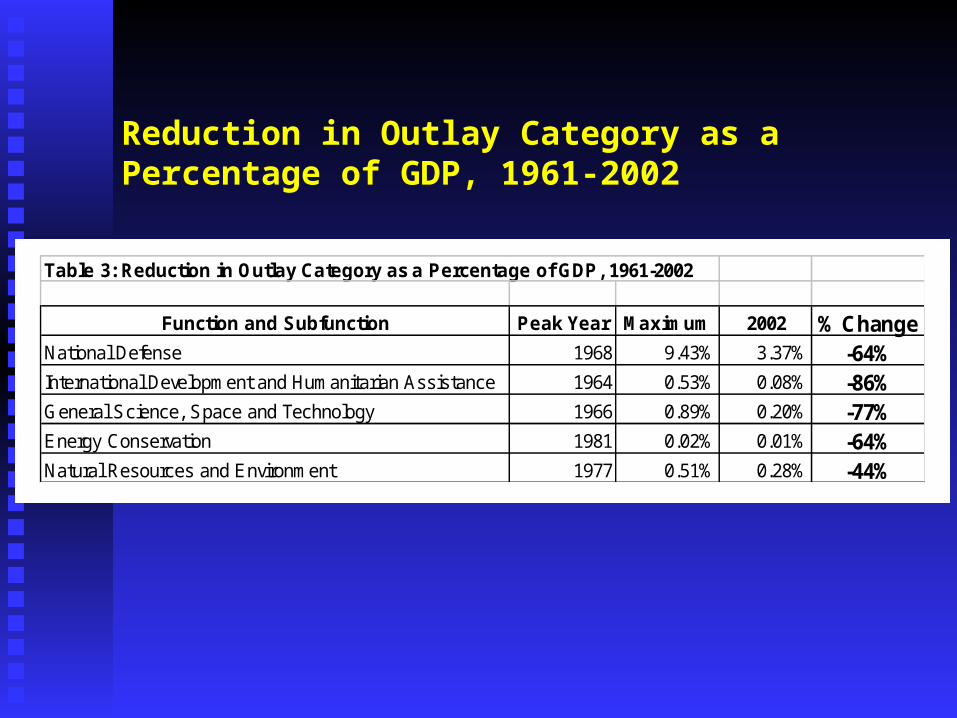
Reduction in Outlay Category as a Percentage of GDP, 1961-2002
Table 3: Reduction in Outlay Category as a Percentage of GDP, 1961-2002
Function and Subfunction Peak Year Maximum 2002 % ChangeNational Defense 1968 9.43% 3.37% -64%International Development and Humanitarian Assistance 1964 0.53% 0.08% -86%General Science, Space and Technology 1966 0.89% 0.20% -77%Energy Conservation 1981 0.02% 0.01% -64%Natural Resources and Environment 1977 0.51% 0.28% -44%
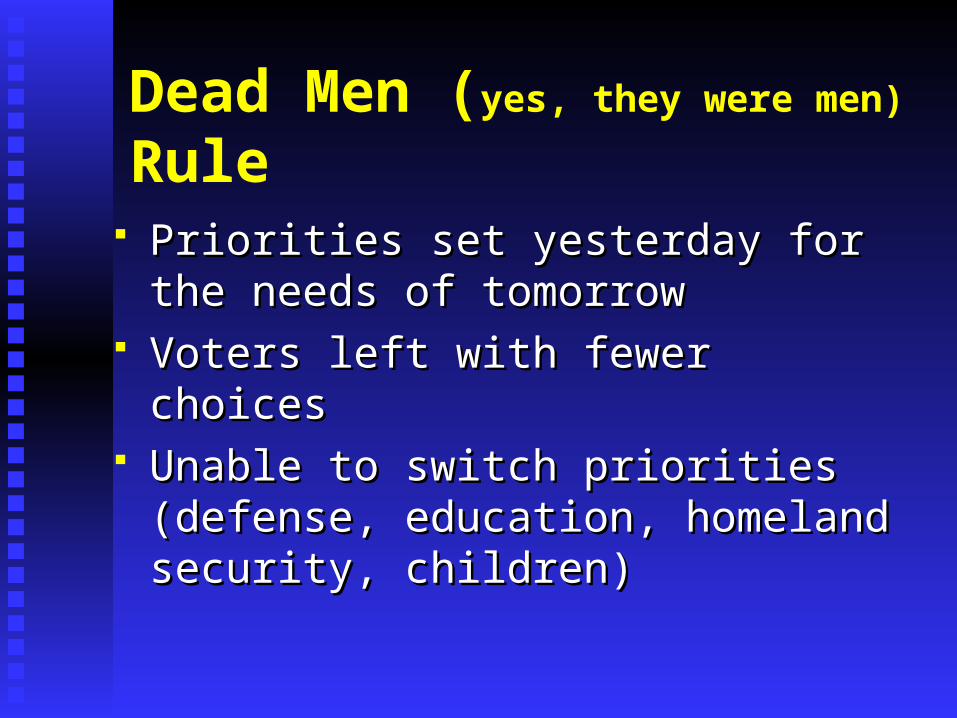
Dead Men (yes, they were men) Rule
Priorities set yesterday for the needs of Priorities set yesterday for the needs of tomorrowtomorrow
Voters left with fewer choicesVoters left with fewer choices Unable to switch priorities (defense, Unable to switch priorities (defense,
education, homeland security, children)education, homeland security, children)

"Which Federal Baseline Do We Use?"
Baseline Receipts
2001 Tax Law Extended
2002 Tax Law Extended
2003 Tax Law Extended
Other Tax Laws Extended
Alternative Minimum Tax Growth Halted
16%
17%
18%
19%
20%
21%
1970 1977 1984 1991 1998 2005 2012 2019 2026 2033 2040 2047 2054 2061 2068 2075
% o
f G
DP
Source: Steuerle, Carasso, Bishop, based on data from Gale, Orszag, and the Tax Policy Center..

The Assumption "Gap"
Old Baseline
Baseline with All Tax Law Changes
16%
17%
18%
19%
20%
21%
1970 1977 1984 1991 1998 2005 2012 2019 2026 2033 2040 2047 2054 2061 2068 2075
% o
f G
DP 3.3%
Source: Steuerle, Carasso, Bishop, based on data from Gale, Orszag, and the Tax Policy Center..

Baseline Receipts Meet Major Spending Initiatives
Adjusted Baseline Receipts
Baseline SS, M'Care, & M'Caid
Includes Rx Bill and M'Care Fix
Includes Baseline Defense, Internat'l
Interest
Includes new Defense estimate
Adjusted Baseline Spending (includes
new Interest estimate)
0%
5%
10%
15%
20%
25%
30%
35%
1970 1977 1984 1991 1998 2005 2012 2019 2026 2033 2040 2047 2054 2061 2068 2075
% o
f GD
P
Source: Steuerle, Carasso, Bishop based on data from Reischauer, OMB, CBO.
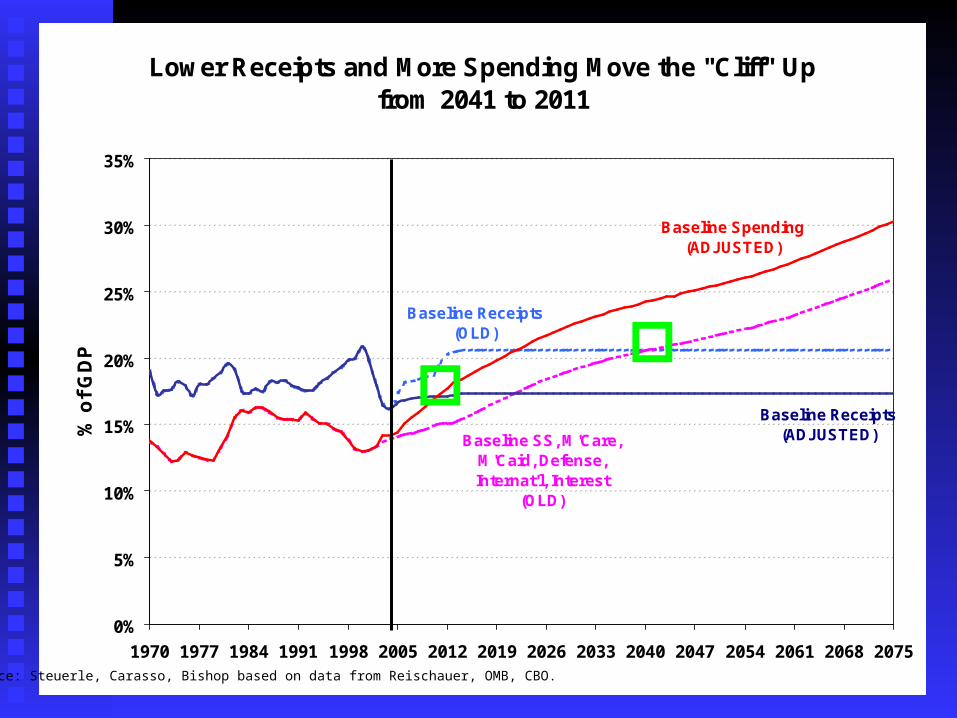
Lower Receipts and More Spending Move the "Cliff" Up from 2041 to 2011
Baseline Receipts (OLD)
Baseline SS, M'Care, M'Caid, Defense, Internat'l, Interest
(OLD)
Baseline Receipts
(ADJUSTED)
Baseline Spending (ADJUSTED)
0%
5%
10%
15%
20%
25%
30%
35%
1970 1977 1984 1991 1998 2005 2012 2019 2026 2033 2040 2047 2054 2061 2068 2075
% o
f G
DP
Source: Steuerle, Carasso, Bishop based on data from Reischauer, OMB, CBO.

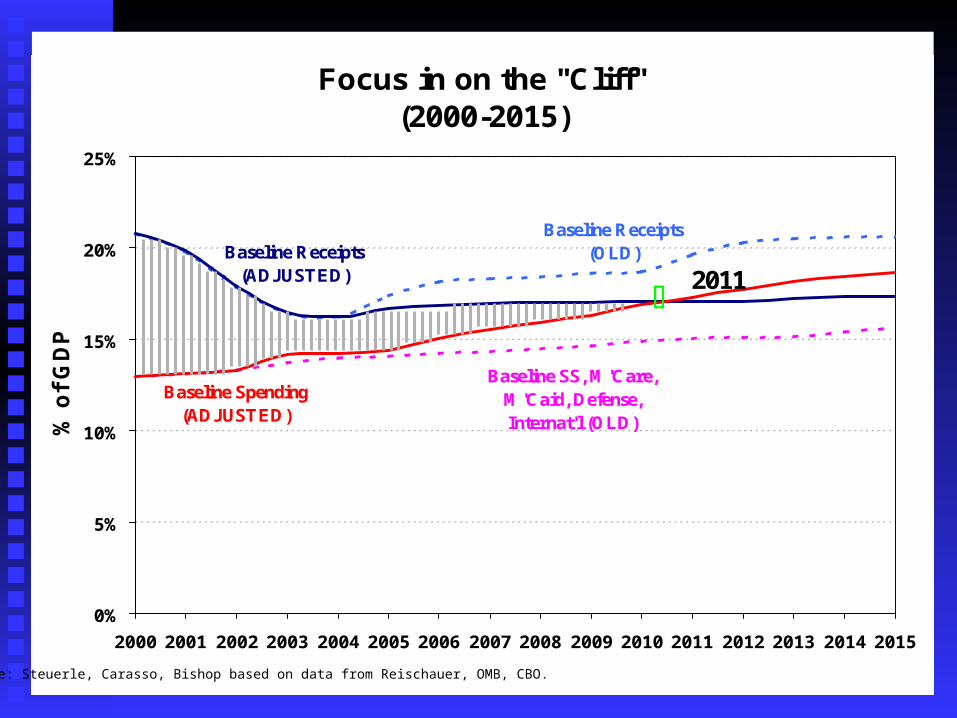
Focus in on the "Cliff" (2000-2015)
Baseline Receipts (OLD)
Baseline SS, M'Care, M'Caid, Defense, Internat'l (OLD)
Baseline Receipts (ADJUSTED) 2011
Baseline Spending (ADJUSTED)
0%
5%
10%
15%
20%
25%
2000 2001 2002 2003 2004 2005 2006 2007 2008 2009 2010 2011 2012 2013 2014 2015
% o
f G
DP
Source: Steuerle, Carasso, Bishop based on data from Reischauer, OMB, CBO.

SOON…VERY SOON
ANYANY spending spending
on education, environment, welfare, community on education, environment, welfare, community development and most domestic programs development and most domestic programs
must be paid for out of:must be paid for out of: Deficits (but this can only be temporary)Deficits (but this can only be temporary) Rescinding of tax cuts or tax Rescinding of tax cuts or tax increasesincreases Pared growth in retirement and health spending Pared growth in retirement and health spending A very small international and defense presenceA very small international and defense presence

CONCLUSION Dead Men Rule by locking in future changes Dead Men Rule by locking in future changes Rest of government squeezed between lower taxes and higher Rest of government squeezed between lower taxes and higher
retirement/health spendingretirement/health spending Education/environment/discretionary programs get leftovers, Education/environment/discretionary programs get leftovers,
if anyif any Automatic government (spending tomorrow’s money today) Automatic government (spending tomorrow’s money today)
restricts choices amongrestricts choices among programs in generalprograms in general elderly programs as wellelderly programs as well
Fundamental restructuring of public budgets and private labor Fundamental restructuring of public budgets and private labor markets almost inevitablemarkets almost inevitable Will it be done well? Will it be done well?