THE BRUNEL LECTURE - Global Commons Institute · 2 THE BRUNEL LECTURE 2008: By Peter HEAD OBE FREng...
83
-
Upload
nguyencong -
Category
Documents
-
view
221 -
download
0
Transcript of THE BRUNEL LECTURE - Global Commons Institute · 2 THE BRUNEL LECTURE 2008: By Peter HEAD OBE FREng...


THE BRUNEL LECTURE 2008: By Peter HEAD OBE FREng FRSA2
THE BRUNEL LECTURE 2008By Peter HEAD OBE FREng FRSA
Entering the Ecological Age:THE ENGINEER’S ROLE
CONTENTS:
EXECUTIVE SUMMARY 5
ACKNOWLEDGEMENTS: 9
1. INTRODUCTION 11
2. START OF A JOURNEY 15
3. BACKGROUND 17 Economics of the Ecological Age 17
The Cultural Disconnect 19 General 19 Urban and Rural Disconnect 20 Impacts 21
Resource Effi ciency 22 Land and Urban Areas 22 Land and Food 25 Water and food security and health 29 Energy and Raw Materials 32 Manufacturing and Waste 37
Adaptation to climate change impacts 38
4. A FRAMEWORK FOR TRANSFORMATION 41 Biomimicry Principles 41
Objectives for 2050 42
5. A MODEL FOR EACH COUNTRY 43
6. THE HIGH INCOME COUNTRY CHALLENGEUK REGION OF EUROPE 45
3ENTERING THE ECOLOGICAL AGE: The Engineers Role
7. THE LOW AND MIDDLE INCOME COUNTRIES’ CHALLENGE- CHINA 47
8. STRATEGIES AND TECHNOLOGIES FOR ENTERING AN ECOLOGICAL AGE 49 Biomimicry Principles: Use waste as a resource, use materials sparingly and do not draw down resources 49
Biomimicry Principle: Diversify and cooperate 52
Biomimicry Principle: Gathering and using energy effi ciently 52 General 52 Industry, commercial demand 53 Household demand 54 Transport-ground based in towns and cities 56 Transport-ground based between towns and cities 57 Air travel 58 Power and energy supply 58
Biomimicry Principles: Optimise not Maximise and run on information 61
Biomimicry Principle: Clean up not pollute 61
Biomimicry Principle: Remain in balance with the biosphere 63 Shortened Integrated Carbon Cycle (SICC) 63
Biomimicry Principle: Use local resources 65 Summary 66
9. ECONOMICS AND POLICY 67 Introduction 67
Policy framework 67 Reaching a sustainable economic scale 67 Just Distribution 68 International Policies 70
I0. DELIVERY MODELS 71
11. THE ROLE OF ENGINEERS 73
12. CONCLUSION 75
13. REFERENCES 77

THE BRUNEL LECTURE 2008: By Peter HEAD OBE FREng FRSA4

5ENTERING THE ECOLOGICAL AGE: The Engineers Role
In recent decades it has dawned on many of us that there can be no viable future for humanity without a healthy planet. Earth, water and air support the existence of an immensely complex living system, powered by the sun. We are part of this web of life. But within a few generations, we are using up most of the earth’s stored fossil fuel resources and their transfer from the earth to the atmosphere is signifi cantly altering its composition. Our globalising economic system is destabilising the planet’s life-support systems- the very systems that support us and the future of our children. The direct impacts of this on human development, plus rising food and resource costs mean that current economic growth is rapidly becoming unsustainable and a global transition is underway to the ecological age of human civilisation.
This paper carefully analyses current global knowledge in an attempt to see if and how we can reach a sustainable future. The conclusion is that we could move to a sustainable way of living within environmental limits over the next few decades, allowing for continued human development and population growth, whilst adapting to climate change impacts.
An Ecological Age by 2050 will have:
CO• 2 Emissions Reduction of 80%
Ecological Footprint of 1.44 gha/capita•
Human Development Index increase•
It acknowledges different socio-economic levels for countries and aims to provide concrete solutions which will release human development potential with much lower use of non-renewable resources. In high income countries, such as the UK, the following infrastructure investments and approaches are needed to retrofi t existing urban and rural developments. In low and middle income countries, such as China, these are the systems with which to develop new urban-rural developments:
TRANSPORT:
Efficient, comfortable zero emissions mass transport•
Walking and cycling routes•
Intercity high speed rail passing through international • airports
Green logistics services from freight hubs•
WATER AND WASTE:
Water capture, storage, recycling and separate • potable and grey water mains.
Waste collection, recycling and anaerobic digestion. •
Fitting of separating toilets and vacuum collection of • solid waste
Mining of construction materials from cities•
ENERGY:
Large scale renewable energy, including desert solar • power
City combined heat and power and local heat and • power grids
Carbon capture at power stations•
Use of secondary biomass for energy and products•
FOOD AND COMMUNICATION:
Intensive food production in cities •
Broad band communications and tailored • information
All of these systems are connected and form virtuous cycles that integrate the environmental, economic and social performance of different components of built environment so that change in the design of one can lead to benefi ts in another.
EXECUTIVE SUMMARY

THE BRUNEL LECTURE 2008: By Peter HEAD OBE FREng FRSA6
The following urban design principles are also important in making places sustainable:
Adopting Smart, responsive simplicity rather than • rigid complexity. This means dismantling the layered complexity of fossil fuel powered systems of the industrial age and using clean, flexible. adaptable and renewable systems to support life
Setting Sustainable development framework • objectives and targets at a regional and local level to drive investments to meet ecological age principles
Using Biomimicry principles as a framework to • guide design and implementation and support the virtuous cycles of benefit
Creating regional and local Land use plans. There • are many advantages in this of compact mixed use development with high density, especially around public transport nodes.
Closing the resource flow loops for water, energy, • waste and minerals between rural and urban systems.
Using waste as a resource for future products. • Products are designed to be returned to the manufacturers for disassembly and re-use. Secondary biomass and smart materials are used as raw materials.
Providing products with performance labels.•
Combining adaptation and mitigation to climate • change
Sustainable urban design principles need to be supported with smart and available developing technologies such as:
LED lighting•
Electric and hydrogen fuelled transport.•
Short carbon cycling using algae bioreactors to • collect CO2 at power stations and coal gasification.
Anaerobic digestion of waste.•
Intensive food production using hydroponics and • nutrient feed.
Secondary biomass fuels for air travel•
The paper addresses the policies that will be helpful in delivering the goals. In the ecological economic model there needs to be a continuous adaption of the global economy to match the size of the supporting ecosystem. If the circulating resource use remains within the natural capacity of the ecosystem to absorb wastes and to regenerate resources then the economy is sustainable and human development can continue. Indeed many examples are given of the way human development can be released from the shackles of industrial age problems in cities.

7ENTERING THE ECOLOGICAL AGE: The Engineers Role
The paper sets out three policy areas.
First, policies which drive towards the sustainable or optimal scale need to address the limiting of scale and the fact that previously free natural resources and services have to be declared scarce economic goods. For example:
Energy feed-in legislation•
Polluter pays taxes introduced progressively, with • proceeds used to drive public sector investments which help the private sector.
Tradable permits with quotas set so that the • marginal social and business costs are equal to the societal benefits.
Second as sustainability is the criterion for scale, justice is the criterion for distribution to ensure that there is fairness across society and globally, for example:
National and regional land use plans.•
Land value taxation to redistribute value to the • community
Bartering of human development benefits against • environmental clean up benefits.
Contract and Convergence for carbon and Shrink • and Share for ecological footprint
Thirdly, policy needs to ensure that allocation of resources is as effi cient and cost effective as possible, for example:
National resource efficiency targets and circular • economy laws to incentivise symbiotic manufacture.
National policy to manage the rebound effect of • improved resource efficiency.
Radical transformation of the infrastructure that supports life on the planet is needed if we are to attain a sustainable future. This requires strong partnerships between public, private, NGO and community groups within national communities and global cooperation, but with existing technology.
Engineers have global experience, are adept at multidisciplinary team working, which will be essential for success and can design and deliver these new infrastructure systems. However we recognise that resource levels are limited to undertake such an unprecedented challenge in a very urgent timescale of no more than 50 years and so we need to train and motivate young people to join this challenge and be the Brunels of the 21st Century. A global network of sustainability institutes is being created to help speed up knowledge sharing and delivery capacity and a delivery model of using public, private partnerships with NGO’s and community groups is proposed for retrofi tting.
This is a fi rst glimpse of a way forward and a credible vision of the future but it is only a modest start for a long journey. The aim is that the Copenhagen Climate Summit in December 2009 will be the moment the world gets together and agrees that we really know enough and are prepared about the direction that we need to take.
It is hoped that presenting this paper will enable the global community of engineers to come together too and inspire young people to join us in this challenge, almost certainly the greatest humankind has ever faced.

THE BRUNEL LECTURE 2008: By Peter HEAD OBE FREng FRSA8

9ENTERING THE ECOLOGICAL AGE: The Engineers Role
Special Thanks to Our Peer Reviewers:
ACKNOWLEDGEMENTS:

THE BRUNEL LECTURE 2008: By Peter HEAD OBE FREng FRSA10
Thanks also to Debra Lam at Arup for her project management and research for the Brunel Lecture series.
11ENTERING THE ECOLOGICAL AGE: The Engineers Role
1. INTRODUCTION
Civil engineers are proud of the legacy of their profession’s contribution to the rapid development of human civilisation in the period 1700 to 1900. We stand on the shoulders of the great Victorian engineers like Isambard Kingdom Brunel, who created so much of the revolutionary infrastructure that supported the economic growth of Britain, which experienced an explosive population rise from 5 to 30 million, migration of people to towns, and cities and industrial output growth peaking at 3.5% per year.1 In a short period, the Industrial Revolution launched much of Western civilisation from the Agricultural Age to the Industrial Age and with it a way of urban living that exploited the planet’s abundant resources for the benefi t of people in those countries who led it. Even then, there were voices of concern, like economist Thomas Malthus2 who argued that increases of population would at some point overwhelm our ability to feed ourselves. But many of these predictions were proven wrong by our extraordinary ability to increase the productivity of land to grow food using machines, higher yield wheat and rice plants and fertilisers and yet more fossil fuels. The population is now seven times greater than when Malthus made his prediction but we still have just about enough food if it were distributed better.3
Industrial development and urbanisation have continued unabated without much concern for global consequences and have spread all over the world as a model for economic growth and for raising quality of life, with civil engineers at the heart of the design and delivery of the essential infrastructure for energy, water, waste, communications, transport and fl ood protection. Fossil fuel energy consumption is central to this model of human development and in designing and building these systems we have created the hard wiring of a non-renewable resource consuming society.
Dependence on using fossil fuels made millions of years ago can only ever be a fi nite model that will end with the fuel running out. High income countries, in particular, are guilty of profl igate waste of these natural resources. Current economic models plus the apparent affl uence of the high income world seems to promote the ineffi cient use of fi nite natural resources. We are now facing the need for a rapid change of direction.
1 Floud, Roderick and D.N. McCloskey eds. The Economic History of Britain since 1700 Cambridge: Cambridge University Press. 1994
2 Malthus, Thomas R., Ratios of the increase of population and food, An Essay on the Principle of Population, Book 1, Chapter I, pp 13-21, (1992).
3 Population Reference Bureau, (2007) World Population Data Sheet, pp 1-16, provided by http://www.scribd.com/doc/326077/World-Population-Datasheet-2007.
The high income nations’ pattern of growth was based on a model of urbanisation which became a benchmark for low and middle income countries to follow and drove up resource consumption dramatically. The accelerating economic development of China, with over 800 million people living in cities by 20204 – 60% of its population – has given further impetus and total global resource consumption has gone up substantially, with nearly all of it from non-renewable sources.
After the fi rst oil price rise in the 1970s, concerns about the limits to this growth model started to be raised again, but were swept away during the Reagan-Thatcher years. It was not until the publication of the Brundtland Commission Report ‘Our Common Future’ in 1987 that limits to growth came back into international discourse.5 The ecological footprint concept and calculation method was developed as the PhD dissertation of Mathis Wackernagel,6 supervised by William Rees at the University of British Columbia in Vancouver, Canada, from 1990-1994.7 In 1998 WWF started publishing a biennial Planet Report, which in 2006 showed that we are now living in severe ecological overshoot. Worldwide they said that we are consuming 25% more resources than the planet can replace and are drawing down the stock of natural capital that supports our lives.8
4 Peoples’ Daily Online, Chinas urban population to reach 800 to 900 million by 2020, provided by, http://english.people.com.cn/200409/16/eng20040916_157275.html, (2004).
5 United Nations General Assembly Report A/42/427, Our Common Future, Report of the World Commission on Environment and Development, sourced from http://www.worldinbalance.net/pdf/1987-brundtland.pdf, (1987)
6 Wackernagel, M, How Big Is Our Ecological Footprint? – Using the Concept of Appropriated Carrying Capacity for Measuring Sustainability, Taskforce on Planning Healthy and Sustainable Communities, University of British Columbia, (1993).
7 Wackernagel, M, Ecological footprint and appropriated carrying capacity: a tool for planning towards sustainability, University of British Columbia., PhD thesis (1994). Wackernagel, M. & Rees, W.E, Our Ecological Footprint—Reducing Human Impact on the Earth, Gabriola Island, B.C., Canada: New Society Publishers, (1996).
8 World Wildlife Fund, Living Planet Report, sourced from http://assets.panda.org/downloads/living_planet_report.pdf, (2006).
THE BRUNEL LECTURE 2008: By Peter HEAD OBE FREng FRSA12
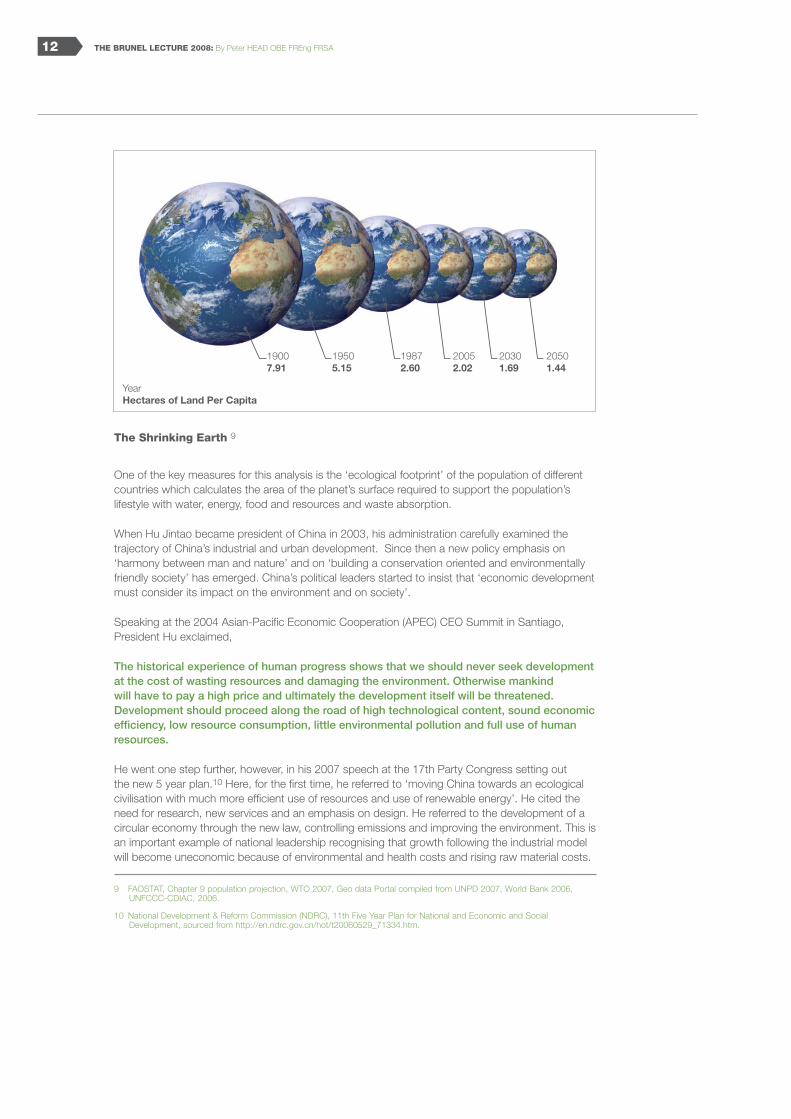
The Shrinking Earth 9
One of the key measures for this analysis is the ‘ecological footprint’ of the population of different countries which calculates the area of the planet’s surface required to support the population’s lifestyle with water, energy, food and resources and waste absorption.
When Hu Jintao became president of China in 2003, his administration carefully examined the trajectory of China’s industrial and urban development. Since then a new policy emphasis on ‘harmony between man and nature’ and on ‘building a conservation oriented and environmentally friendly society’ has emerged. China’s political leaders started to insist that ‘economic development must consider its impact on the environment and on society’.
Speaking at the 2004 Asian-Pacifi c Economic Cooperation (APEC) CEO Summit in Santiago, President Hu exclaimed,
The historical experience of human progress shows that we should never seek development at the cost of wasting resources and damaging the environment. Otherwise mankind will have to pay a high price and ultimately the development itself will be threatened. Development should proceed along the road of high technological content, sound economic effi ciency, low resource consumption, little environmental pollution and full use of human resources.
He went one step further, however, in his 2007 speech at the 17th Party Congress setting out the new 5 year plan.10 Here, for the fi rst time, he referred to ‘moving China towards an ecological civilisation with much more effi cient use of resources and use of renewable energy’. He cited the need for research, new services and an emphasis on design. He referred to the development of a circular economy through the new law, controlling emissions and improving the environment. This is an important example of national leadership recognising that growth following the industrial model will become uneconomic because of environmental and health costs and rising raw material costs.
9 FAOSTAT, Chapter 9 population projection, WTO 2007, Geo data Portal compiled from UNPD 2007, World Bank 2006, UNFCCC-CDIAC, 2006.
10 National Development & Reform Commission (NDRC), 11th Five Year Plan for National and Economic and Social Development, sourced from http://en.ndrc.gov.cn/hot/t20060529_71334.htm.
19007.91
19505.15
19872.60
20052.02
20301.69
20501.44
YearHectares of Land Per Capita

13ENTERING THE ECOLOGICAL AGE: The Engineers Role
In parallel, the discipline of ecological economics has emerged in which the Earth is seen as a ship and the gross material production of the economy as its cargo. In this model the economists say we do not yet know how heavy a load is safe but we know, in principle, that too heavy a load will cause the ship to sink.11 This discipline has been emerging in the academic world for 20 years and is clear that economic growth must eventually be replaced by sustainable development in which human development continues without continual increase use of resources.
12
This massive change towards sustainable development and an ecological civilisation is now being driven in China by setting environmental clean up, energy effi ciency and social targets for regional government in addition to the traditional GDP growth targets. Laws have also been changed, for example to severely restrict the terms under which arable land can be released for development, encouraging the private production of renewable energy and circular use of resources in manufacture. Also planning of demonstration eco-city projects has begun with the aim of moving development onto a new path in which economic growth is unhitched from resource consumption for the fi rst time, starting a transition to the ecological age.
11 Daly, Herman E. & Farley, Joshua, Ecological Economics: Principles and Applications, Part III, Microeconomics, chapter 9, Supply and Demand, pp 141-157, (2004).
12 © Doug Sephton in Drivers of Change: Demographics, Arup 2008
Arup’s work to support this rapid change, through the planning of Dongtan and other eco-cities in China for visionary clients like SIIC (Shanghai Industrial Investment Corporation)13 and our work on similar emerging projects worldwide, has led to the following:
Deepening understanding of the levels of resource • efficiency that can be achieved compared to the current “industrial age” systems and the impacts on ecological footprint;
Knowledge of the infrastructure and technologies • necessary to deliver them;
Insights into what technology gaps exist that need • to be plugged;
Economic attractiveness of the new direction. •
Enough work has been done on retrofi tting these ideas into existing high income countries to begin to understand how all countries in the world can move to avert a catastrophe in which the planet buckles under the weight of demands being placed on it. All this learning has included the need to adapt to the impacts of climate change as well as dealing with mitigation that has been recommended by the recent IPCC’s Fourth Assessment Report.14 It is clear we must do something if population growth and resource consumption are not to destroy the system of consumption that allows the human race to function.
13 Arup Integrated Urbanism, Chongming Dongtan Eco-City China, http://www.arup.com/integratedurbanism/project.cfm?pageid=8020, (2008).
14 Intergovernmental Panel on Climate Change Report, Working Group III Report Mitigation of Climate Change, sourced from http://www.ipcc.ch/ipccreports/assessments-reports.htm, (2008).

THE BRUNEL LECTURE 2008: By Peter HEAD OBE FREng FRSA14

15ENTERING THE ECOLOGICAL AGE: The Engineers Role
We are at the start of a new and vital journey in which we will be striving to prevent a downward human development spiral driven by over consumption of fi nite resources. All is not lost as much of the knowledge we need to solve the problems already exists. The challenge is to understand our situation better and to apply that knowledge more effectively.
This paper brings this knowledge together and builds on disciplines such as sustainable systems engineering, life-cycle analysis, industrial ecology and earth systems engineering. It is an attempt to present information in an understandable and logical form and is primarily aimed at highlighting the role of engineers in dealing with these problems for an engineering, business and government audience. We can all recognise that this is the start of a journey in a radically new direction and establishing clear objectives and a vision of the goal to drive towards are as important as the way to get there. Frameworks and models are presented for the rapid change of direction of global economic development which is sustainable and could lead to living within environmental limits by 2050. This corresponds to the ‘rapid reduction scenario’ in the Living Planet Report.
Clear objectives are set out for 2050, using three metrics:
CO• 2 Reduction: 80% to 1990 levels by 2050
Ecological Footprint Decrease: A transition of • Ecological Footprint to the global earth share in all countries, 1.44gha/person, based on a projected global population in 2050
Human Development Index Improvement: Raise • overall wellbeing in GDP/capita, life expectancy, and education.
Decreased carbon emissions are not enough to transition towards an Ecological Age. We need to ensure that we continue to grow and develop, but within our resource constraints. Ecological Footprint measures the earth’s biocapacity in productive land area - cropland, pastures, forest, and fi sheries - to meet human needs.15 The UN Human Development Index measures overall well-being in three basic dimensions
15 Word Wildlife Fund, Living Planet Report, sourced from http://assets.panda.org/downloads/living_planet_report.pdf, (2006).
2. START OF A JOURNEY

THE BRUNEL LECTURE 2008: By Peter HEAD OBE FREng FRSA16
BioproductiveLand
BioproductiveSea
Energy Land
Built Land
Biodiversity
Ecological Footprint Land Type Uses
of human development: a long life, formal education, and average per capita income of GDP.16 Together these three objectives serve as our guide in entering an Ecological Age. Living with decreased carbon emissions, within our ecological footprint, and having a high human development are rights that every citizen should have. The three keep us in balance with nature while continuing to promote our growth and development. There is an assumption that additional investment in education and healthcare proceeds in parallel with the infrastructure investments covered by this paper, in order to reach the targets. It has been estimated that this could cost an additional USD$77 billion/year.17
Recognizing the different human development, carbon emissions, and ecological footprint in each country – along with local conditions and policies – we aim to set recommendations that are relevant to each context while promoting an overall transition towards an Ecological Age. Our recommended technologies and systems will be applied differently in our high, middle and low income country sub-sets.
There is an inherent ethical assumption in the approach, with a real concern for the rising inequality across all parts of the world. A growing number are living in abject poverty, subject to the impacts of overconsumption and lacking the resources to combat it. Additionally, in looking towards the future, there is a strong need to respect intergenerational equity and future generations.
16 United Nations Development Programme, Human Development Report, sourced from http://hdr.undp.org/en/media/hdr_20072008_en_complete.pdf, (2007-2008).
17 Brown, Lester, Plan B 3.0, New York: W.W. Norton & Company. 2008.
The main purpose of the approach is to provide some visionary answers to key questions such as:
Can we move towards a sustainable way of living?•
What policies and investments are needed in low, • middle and high income countries?
What is the role of the engineer in leading this • transition to an Ecological Age?
The evidence base has been derived from Arup’s research programmes into the Drivers of Change including Climate Change18, new research into carbon capture, development project experience worldwide, and the evidence base prepared to support cities like London with their climate change mitigation action plans.19 References have been selected on the basis of their authority and this paper has been peer reviewed by global experts.
18 Arup Global Foresight and Innovation, Arup Drivers of Change, http://www.arup.com/landing.cfm?pageid=8870, (2007-2008).
19 Greater London Authority, Action Today to Protect Tomorrow: Mayor’s Climate Change Action Plan, sourced from http://www.london.gov.uk/mayor/environment/climate-change/docs/ccap_fullreport.pdf, (2008).

17ENTERING THE ECOLOGICAL AGE: The Engineers Role
In this section, I analyse the increasingly urgent problems we are facing with our industrial development model and highlight some of the key opportunities that are available to make radical improvements that defi ne the Ecological Age model of living much more lightly on the planet.
Economics of the Ecological Age
Economics is concerned with the allocation of limited or scarce resources among competing ends. Neoclassical economics has focussed on the markets being able to drive increased effi ciency out of this allocation process with an underlying assumption at the global macro-economic scale that supply of resources is largely unlimited.
Ecological economics recognises that the earth is a closed system, which imports energy from the sun and exports heat only. All other matter within the system circulates inside and does not fl ow through. Our economic growth model is living inside the Earth eco-system which supports our life and as the global economy grows bigger some of the natural system is being sacrifi ced. We have now realised that our global economy has become so big that the impact of the loss of the eco-system at each growth increment may cost us more than it is worth. Hence future growth on the old model may be uneconomic and we may have to begin the search for an optimal scale in which marginal costs equal marginal benefi ts. On the road to reaching this goal the market is forcing us to search for ways of reducing impact on the eco-system, using resources more effi ciently in order to free up more growth and fi nding new ways of accelerating human development. In particular the way urban centres are laid out must be re-evaluated to improve the opportunities for a human development with far fewer resources. These involve improving access to clean water, nutritious food, work, sanitation, education, healthcare and bio and human diversity – future factors that should be at the core of urban design alongside aesthetics.
In order to drive change we need to value natural capital such as solar energy, land, minerals and fossil fuels, water, living organisms and the services they provide and in order to safeguard our future we need to protect these and engage them to positively support human development. This is an essential underlying paradigm shift that is required for the transition. The very long term objective is to reach a sustainable lifestyle that uses the energy from the sun gathered through organisms, wind, wave, currents and direct solar collectors. We need to fi nd a soft transition over the longest possible period, so we can use fossil fuels and nuclear power as long as resources are available but with much less environmental pollution.
20
Ecological economics recognises an important measure of effi ciency in the conversion and use of man-made capital by recognising that any sacrifi ce of natural capital must be considered as part of the equation.
The term used is comprehensive effi ciency and has the following components:
Service efficiency which combines technical design, • allocation and distribution of resources;
Maintenance and durability performance efficiency;•
Growth efficiency of natural capital and harvest • efficiency;
Creating more natural capital stock or sacrificing • fewer ecosystem services per stock usage.
20 © Jupiter Images UK Ltd, in Drivers of Change: Demographics, Arup (2008).
3. BACKGROUND
THE BRUNEL LECTURE 2008: By Peter HEAD OBE FREng FRSA18
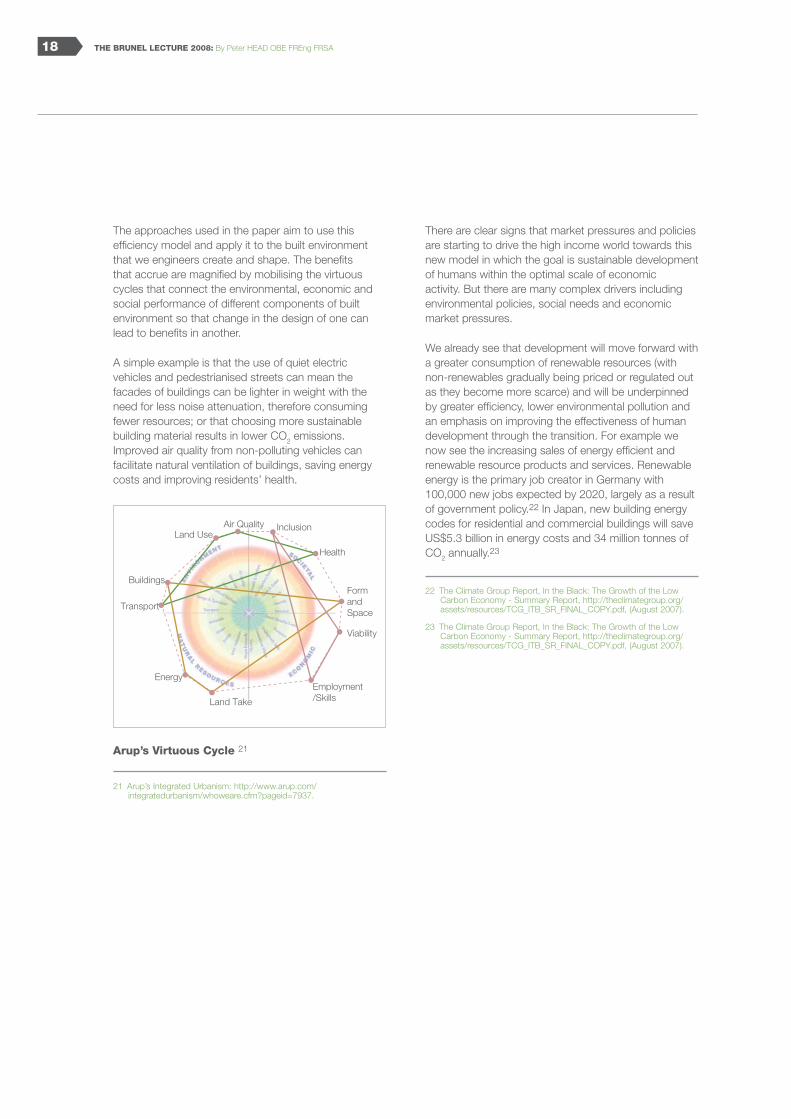
The approaches used in the paper aim to use this effi ciency model and apply it to the built environment that we engineers create and shape. The benefi ts that accrue are magnifi ed by mobilising the virtuous cycles that connect the environmental, economic and social performance of different components of built environment so that change in the design of one can lead to benefi ts in another.
A simple example is that the use of quiet electric vehicles and pedestrianised streets can mean the facades of buildings can be lighter in weight with the need for less noise attenuation, therefore consuming fewer resources; or that choosing more sustainable building material results in lower CO2 emissions. Improved air quality from non-polluting vehicles can facilitate natural ventilation of buildings, saving energy costs and improving residents’ health.
Arup’s Virtuous Cycle 21
21 Arup’s Integrated Urbanism: http://www.arup.com/integratedurbanism/whoweare.cfm?pageid=7937.
There are clear signs that market pressures and policies are starting to drive the high income world towards this new model in which the goal is sustainable development of humans within the optimal scale of economic activity. But there are many complex drivers including environmental policies, social needs and economic market pressures.
We already see that development will move forward with a greater consumption of renewable resources (with non-renewables gradually being priced or regulated out as they become more scarce) and will be underpinned by greater effi ciency, lower environmental pollution and an emphasis on improving the effectiveness of human development through the transition. For example we now see the increasing sales of energy effi cient and renewable resource products and services. Renewable energy is the primary job creator in Germany with 100,000 new jobs expected by 2020, largely as a result of government policy.22 In Japan, new building energy codes for residential and commercial buildings will save US$5.3 billion in energy costs and 34 million tonnes of CO2 annually.23
22 The Climate Group Report, In the Black: The Growth of the Low Carbon Economy - Summary Report, http://theclimategroup.org/assets/resources/TCG_ITB_SR_FINAL_COPY.pdf, (August 2007).
23 The Climate Group Report, In the Black: The Growth of the Low Carbon Economy - Summary Report, http://theclimategroup.org/assets/resources/TCG_ITB_SR_FINAL_COPY.pdf, (August 2007).
Air Quality Inclusion
Health
Form and Space
Viability
Employment/SkillsLand Take
Energy
Transport
Buildings
Land Use

19ENTERING THE ECOLOGICAL AGE: The Engineers Role
CO2 Emissions for Different Wall Constructions 24
The opportunity for low and middle income countries is to combine this new economic thinking with the use of technology, without the need for the wasteful steps the high income world has gone through. Most detailed carbon emissions reduction studies like the Stern Review25 and a major report from McKinsey26 say that the transition costs are within our means and will not hurt economic growth. The McKinsey report says that the United States can reduce greenhouse gas emissions by one-third to a half by 2030 at manageable costs to the economy. In reality if the broader canvas of resource effi ciency was adopted, as suggested here, then the economic drivers would be even clearer.
Following the Stern conclusions, the UK Confederation of British Industry (CBI) said that failure to act now will mean that the costs of tackling climate change in the future will be much higher, and the UK will miss out on the commercial opportunities that will emerge on the pathway to a low carbon economy. Slowing of average annual GDP growth with carbon mitigation through investment is only predicted to be 0.12%.27
The economics of scale are bringing down the costs of low carbon technologies. Already in the United States, studies of energy effi cient buildings designed and built to LEED standards have shown that initial increases in costs have disappeared as the numbers have increased and substantial energy performance improvements compared to non-LEED buildings.28 A combination of top down policy and individual action is needed to enable the direction of development to change. A major obstacle is the fact that culturally, we have convinced ourselves that human development cannot occur without resource consumption.
24 World Business Council for Sustainable Development, Policy Directions to 2050, http://www.wbcsd.org/DocRoot/bdA09BFxjVkjEeXJKjle/int_low_res.pdf, (2007).
25 UK Chancellor of the Exchequer, Stern Review: The Economics of Climate Change, http://www.hm-treasury.gov.uk/independent_reviews/stern_review_economics_climate_change/stern_review_report.cfm, (2007).
26 Mckinsey & Company, Reducing Greenhouse Gas Emissions: How much at what costs?, US Greenhouse Gas Abatement Mapping Initiative Executive Report, http://www.mckinsey.com/clientservice/ccsi/pdf/US_ghg_final_report.pdf, (December 2007).
27 Climate Change: Everyone’s Business. CBI Climate Change Taskforce. November 2007 http://www.avtclient.co.uk/climatereport/docs/climatereport2007full.pdf
28 Turner, Cathy and Mark Frankel, Energy Performance of LEED for New Construction Buildings, US Green Building Council, https://www.usgbc.org/ShowFile.aspx?DocumentID=3930, (4 March 2008).
The Cultural Disconnect
GENERAL
Continued global economic growth is already beginning to be constrained by our profl igate waste of resources and pollution of the planet in the last 150 years, driven by a culture in which nature was to be tamed and disconnected from everyday life as part of the development process. We believed that increasing our material wealth or consumption would increase our happiness and satisfy our needs and that economic growth could go on forever. The dual goals of taming nature and increasing our wealth actually led us to a cultural disconnect and environmental devastation. The resources we are using up are fi nite and cannot last for ever.
An opportunity right now is to draw on the deep roots of different cultures, established over thousands of years before industrialisation, which espouse the principles of sustainable development and to use the teachings from these philosophies to help to accelerate change. The industrial development model drives growing social inequality because of the market driven scramble for increasingly limited resources including land. Not only have we widened our social inequality, our increased material wealth has not made us happier.29
29 Layard, Richard. Happiness: Lessons from a New Science, pp 110-217, Penguin Publishing Press, (2004).
Tons CO2/50m2 Wall Source: www.roadmap2010.eu/wisd/pdfs/42.pdf
Brick and Dense Block
Brick and Timber Frame
Rendered Dense Block and
Timber Frame
Brick and Aerated Block
Rendered Aerated Block and
Timber Frame
Softwood Cladding and Timber Frame
0 1 2 3 4 5

THE BRUNEL LECTURE 2008: By Peter HEAD OBE FREng FRSA20
There is some good news: as we are so wasteful, there are many opportunities for rapid improvement. Each problem we have created in our development model tends to be addressed by another fossil fuel dependent fi x and we have therefore created a stack of interdependent resource consuming technologies. We have found that by resolving each of them in an appropriate way, the social, economic and environmental benefi ts achieved can be surprisingly large through virtuous cycles of benefi t.
The stacking of problems has led to a complexity of infrastructure with high maintenance costs. A clear vision is now emerging that the way forward is one of smart responsive simplicity rather than rigid complexity. For example, in a new compact mixed use development, people can easily go to work, school, shops and leisure facilities by walking, cycling or by public transport; the residents save money and travel creates less pollution from car exhausts. This leads to better health, lower social care costs and creates a more desirable place to live in and a higher return for the developer. The most liveable cities in the world, like Vancouver, have only 10% of the motorways in less attractive US cities and do not have the burden of high maintenance costs.30 Recent surveys in many countries have shown that people are prepared to live differently and willing to make lifestyle changes.31
One of the fi rst big opportunities to make a fast transition is to provide real time information on effi cient existing public and local services that will enable people to live more lightly and effi ciently and then back this up with consistent quality assured information to inform long term choices and investments.
We need a rapid paradigm shift in which we greatly reduce demand for non-renewable resources and at the same time fi nd a more effi cient and diverse basket of renewable sources of supply. A logical starting point for conditioning the direction of change of resource effi ciency is to aim to live within our global earth-share ecological footprint, exemplifi ed by WWF’s One Planet Living. The vision of “One Planet Living” is: “a world in which people everywhere lead happy, healthy lives within their fair share of the Earth’s resources, with space for wildlife and wilderness”32 Happiness will not be attained with material accumulation, but rather in a change in our living conditions. An essential need and opportunity is to develop teaching and training programmes at all levels in society on Ecological Age living, business, investments and policy.
30 U.S. Department of Transportation, FHWA’s Highway Performance Monitoring System and the Canadian Equivalent or Gordon Price?,Highway Performance Monitoring System Report, http://www.fhwa.dot.gov/policy/ohpi/hpms/, (3 April 2008).
31 BBC News, (2007), Most people ready for Green Sacrifices, (9 November) http://news.bbc.co.uk/1/hi/world/7075759.stm http://news.bbc.co.uk/1/shared/bsp/hi/pdfs/09_11_2007bbcpollclimate.pdf
32 Word Wildlife Fund, Living Planet Report 2006, http://assets.panda.org/downloads/living_planet_report.pdf
URBAN AND RURAL DISCONNECT
A signifi cant proportion of fossil fuel use is in agriculture through a combination of the use of energy intensive artifi cial fertilisers and transport to urban consumers, as well as fossil fuel powered electricity generation to power irrigation. Also soil depletion is leading to a loss of minerals in our food which has knock-on health impacts. We need to reconnect urban and rural development and look to close resource loops to achieve a sustainable future. This will mean radical changes to agricultural, manufacturing and urban systems and the choices we make in the way we live. There will need to be a fundamental re-evaluation of our ideas and defi nition of green space, landscape and farmland as we make the transition.
Arup’s Foresight and Innovation research team have analysed the drivers of change through interviews all over the world. Their fi ndings show a clear balance among land use, food production and energy, which are the drivers most directly connected to the inevitable impacts of resource depletion on people. This is not an unexpected result when you consider that the basic human needs are a home, food, water and cool/warmth. Mineral resource extraction will also be discussed as well as the critical issue of availability of water resources.
33
33 © Tuca Vieira in Drivers of Change: Urbanisation, Arup (2008).
21ENTERING THE ECOLOGICAL AGE: The Engineers Role
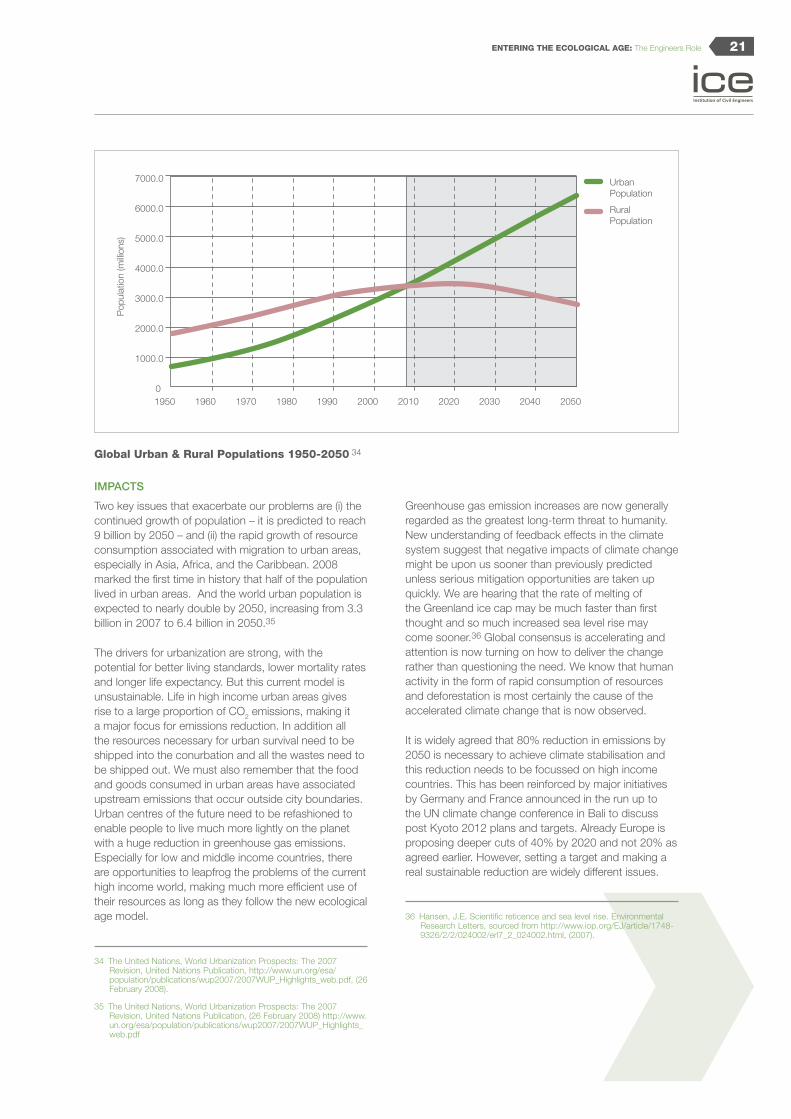
Global Urban & Rural Populations 1950-2050 34
IMPACTS
Two key issues that exacerbate our problems are (i) the continued growth of population – it is predicted to reach 9 billion by 2050 – and (ii) the rapid growth of resource consumption associated with migration to urban areas, especially in Asia, Africa, and the Caribbean. 2008 marked the fi rst time in history that half of the population lived in urban areas. And the world urban population is expected to nearly double by 2050, increasing from 3.3 billion in 2007 to 6.4 billion in 2050.35
The drivers for urbanization are strong, with the potential for better living standards, lower mortality rates and longer life expectancy. But this current model is unsustainable. Life in high income urban areas gives rise to a large proportion of CO2 emissions, making it a major focus for emissions reduction. In addition all the resources necessary for urban survival need to be shipped into the conurbation and all the wastes need to be shipped out. We must also remember that the food and goods consumed in urban areas have associated upstream emissions that occur outside city boundaries. Urban centres of the future need to be refashioned to enable people to live much more lightly on the planet with a huge reduction in greenhouse gas emissions. Especially for low and middle income countries, there are opportunities to leapfrog the problems of the current high income world, making much more effi cient use of their resources as long as they follow the new ecological age model.
34 The United Nations, World Urbanization Prospects: The 2007 Revision, United Nations Publication, http://www.un.org/esa/population/publications/wup2007/2007WUP_Highlights_web.pdf, (26 February 2008).
35 The United Nations, World Urbanization Prospects: The 2007 Revision, United Nations Publication, (26 February 2008) http://www.un.org/esa/population/publications/wup2007/2007WUP_Highlights_web.pdf
Greenhouse gas emission increases are now generally regarded as the greatest long-term threat to humanity. New understanding of feedback effects in the climate system suggest that negative impacts of climate change might be upon us sooner than previously predicted unless serious mitigation opportunities are taken up quickly. We are hearing that the rate of melting of the Greenland ice cap may be much faster than fi rst thought and so much increased sea level rise may come sooner.36 Global consensus is accelerating and attention is now turning on how to deliver the change rather than questioning the need. We know that human activity in the form of rapid consumption of resources and deforestation is most certainly the cause of the accelerated climate change that is now observed.
It is widely agreed that 80% reduction in emissions by 2050 is necessary to achieve climate stabilisation and this reduction needs to be focussed on high income countries. This has been reinforced by major initiatives by Germany and France announced in the run up to the UN climate change conference in Bali to discuss post Kyoto 2012 plans and targets. Already Europe is proposing deeper cuts of 40% by 2020 and not 20% as agreed earlier. However, setting a target and making a real sustainable reduction are widely different issues.
36 Hansen, J.E, Scientific reticence and sea level rise. Environmental Research Letters, sourced from http://www.iop.org/EJ/article/1748-9326/2/2/024002/erl7_2_024002.html, (2007).
Urban Population
Rural Population
7000.0
6000.0
5000.0
4000.0
3000.0
2000.0
1000.0
01950 1960 1970 1980 1990 2000 2010 2020 2030 2040 2050
Pop
ulat
ion
(milli
ons)

THE BRUNEL LECTURE 2008: By Peter HEAD OBE FREng FRSA22
Slum Populations in Low and Middle Income Countries 37
Resource Effi ciency
LAND AND URBAN AREAS
As population has exploded and pollution has increased, the area of productive land available to support each person’s life has fallen in the last century from eight hectares to around two hectares and as population growth continues, productive land will reduce further.38 While technology has increased the productivity of the land, we are living as though this reduction is not happening and have not recognised that there is an urgent need to change. A critical component of making the planet habitable for future generations is to use land and resources much more effi ciently. Let us look at urban areas fi rst.
Competition for land in most urban areas is driving up the land part of house prices. This means that rising land value can be used to underpin investments in improved effi ciency. Inequalities are widening however, especially between homeowners and renters. In London, the shortage of affordable housing is most acutely refl ected in the number of homeless households in temporary accommodation (60,000) - two thirds of England’s total. Rising land prices have resulted in a shortage of social housing. The number of social housing units built in the UK has dropped from around 42,700 per year between 1994-95 to around 21,000 between 2002-03.39
37 Figures given for slum populations are percentages of the urban population as a whole BBC News, Report reveals global slum crisis, http://news.bbc.co.uk/1/hi/world/5078654.stm#slums, (16 June 2006).
38 GEO-4, United Nations Environmental Programme Figure 8.1. http://www.unep.org/geo/geo4/media/, (2007).
39 Barker, Kate, Review of Housing Supply: Delivering Stability: Securing our Future Housing Needs, HM Treasury http://www.hm-treasury.gov.uk/media/E/3/barker_review_report_494.pdf, (2004).
For most, the ambitions of those moving to urban centres globally are not being realised. As the Executive Director of UN Habitat, Anna Tibaijuka, notes, “People move to the cities not because they will be better off but because they expect to be better off”.40 These members of the population fi nd it hard to fi nd the economic opportunities they envisioned. Their dire fi nancial situation and lack of affordable housing, exacerbated by rising fuel and food costs, is leading to homelessness and slum housing. The slum population is forecast to reach 1.4 billion by 2020, with Africa most affected.41
The approach to city living needs to change radically to a much more effi cient use of land if we are to live within the carrying capacity of the planet. Ecological footprint is changed fundamentally by the level of urban density, food and goods selection and energy supply effi ciency and fuel choice. Food and goods are consumer choices while urban density, supply effi ciency, and fuel choice are largely planning decisions.
Good urban design and planning is therefore a key to a successful change of direction and clarity of legal structure for land use planning is critical.
40 BBC News 16 June, Report reveals global slum crisis, http://news.bbc.co.uk/1/hi/world/5078654.stm#slums, (2006).
41 UN Habitat characterizes slum housing as lack of durable housing, insufficient living area, and lack of access to clean water, inadequate sanitation, and insecure tenure.
Latin AmericaUrban 75.8% Slum 31.9%
Northern AfricaUrban 52.0% Slum 28.2%
Sub-Saharan AfricaUrban 34.6% Slum 79.1%
Southern AsiaUrban 29.6% Slum 59.0%
Eastern AsiaUrban 39.1% Slum 36.4%
Western AsiaUrban 65.7% Slum 25.7%
South Eastern AsiaOceania

23ENTERING THE ECOLOGICAL AGE: The Engineers Role
Increasing biodiversity with green roofs, urban parks and tree planting along streets will reduce the heat island effect and give benefi ts of improved health through lowering heat stress and improving mental health.45 The link between biodiversity and health can be illustrated by Singapore’s visionary approach to bio-diversity management in parks. Dragonfl y habitats are being introduced to try to help control mosquitoes and the problem of Dengue Fever in the city. Melbourne also uses species planting to create an eco-system in which mosquitoes do not proliferate.
There is a virtuous cycle between the biodiversity of a city, and therefore living in harmony with nature, and the energy consumption and quality of life. There is strong evidence that access to green space increases demand for developments and opens the door for funding through land value uplift. It will also benefi t the natural systems that maintain life. Trees and vegetation also help with water-management, slow down water run-off and improve air quality. There is also a need to restore rural and aquatic bio-diversity outside urban areas and this needs to be considered as part of the overall transition process. Future urban centres can be transformed to refl ect places where we live in harmony with nature in all its forms.
45 Mind Organisation, Ecotherapy: The Green Agenda for Mental Health, http://www.mind.org.uk/mindweek2007/report/, (May 2007).
Space and Transport 42
One of the largest differentiators in the ecological footprint of cities is the relationship between urban density and transport energy use. An average urban dweller in the United States consumes about 24 times more energy annually in private transport than a Chinese urban resident.43
There is a sweet spot of urban density of 75 persons/hectare in which transport energy use is reduced through the economic provision of public transport and there is still ample room for urban parks and gardens.44
Higher urban density combined with good public transport and a switch to use of fuel effi cient and renewable energy powered vehicles can decrease transport-related energy use and improve liveability.
Hard city landscapes and anthropogenic heat emissions lead to heat island effects with associated higher energy consumption for cooling in summer months. As global temperatures rise, these effects will lead to health dangers. Evening temperatures in urban areas with little green space and little surrounding water bodies can be two or three degrees higher, leading to longer periods of high summer temperatures.
42 Press Office City of Müenster, Germany
43 Kenworthy, J.R, Transport Energy Use and Greenhouse Gases in Urban Passenger Transport Systems: A Study of 84 Global Cities, Presented to the International Third Conference of the Regional Government Network for Sustainable Development, Notre Dame University, Fremantle, Western Australia, http://cst.uwinnipeg.ca/documents/Transport_Greenhouse.pdf, (September 17-19 2003).
44 Newman, Peter and Jeffrey Kenworthy, Urban Design to Reduce Automobile Dependence, Opolis: An International Journal of Suburban and Metropolitan Studies: Vol. 2: No. 1, Article 3. http://repositories.cdlib.org/cssd/opolis/vol2/iss1/art3, (2006).

THE BRUNEL LECTURE 2008: By Peter HEAD OBE FREng FRSA24
Per Capita Emissions of CO2 from Passenger Transport in 84 Cities (Private and Public Transport) 46
Transport and Urban Density 47
Urban Heat Island Profi le 48
46 Kenworthy, J.R, Transport Energy Use and Greenhouse Gases in Urban Passenger Transport Systems: A Study of 84 Global Cities, Presented to the International Third Conference of the Regional Government Network for Sustainable Development, Notre Dame University, Fremantle, Western Australia, http://cst.uwinnipeg.ca/documents/Transport_Greenhouse.pdf, (September 17-19 2003).
47 Newman, Peter and Jeffrey Kenworthy, Urban Design to Reduce Automobile Dependence, Opolis: An International Journal of Suburban and Metropolitan Studies: Vol. 2: No. 1, Article 3. http://repositories.cdlib.org/cssd/opolis/vol2/iss1/art3, (2006).
48 Pon, B., and Diagram: Sketch of an Urban Heat-Island Profile, sourced from http://heatisland.lbl.gov/HighTemps/, (2007).
70.000
60.000
50.000
40.000
30.000
20.000
10.000
250 50
Houston
Denver
New York
Montreal
London
Stockholm
Singapore
Hong KongTokyo
Copenhagen
75 100 125 150 175 200 225 250 275 300
Priv
ate
tran
spor
t Ene
rgy
Use
per
Cap
ita (M
J)
Manila
Urban Density (person/ha)
X2
X4
Compact City: Low rise & high density - 3 to 8 storeys / 1.45 average plot ratio / 75 dwelling per hectares 80,000 people
Ann
ual K
G P
er C
apita
Of C
O2
0
1000
2000
3000
4000
5000
6000
7000
8000A
tlant
aH
oust
onS
an F
ranc
isco
Den
ver
San
Die
goLo
s A
ngel
esP
hoen
ixW
ashi
ngto
nC
hica
goN
ew Y
ork
Cal
gary
Toro
nto
Mel
bour
neP
erth
Bris
bane
Van
couv
erS
ydne
yO
ttaw
aM
ontr
eal
Riy
adh
Bru
ssel
sW
ellin
gton
Fran
kfur
tG
enev
aR
ome
Ham
burg
Mun
ich
Stu
ttgar
tO
slo
Sto
ckho
lmB
angk
okN
ante
sM
arse
illeR
uhr
Gla
sgow
Lyon
Zuric
hV
ienn
aD
usse
ldor
fC
open
hage
nLo
ndon
New
cast
leM
adrid
Par
isB
erlin
Gra
zB
erne
Mila
nB
olog
naTe
l Avi
vA
mst
erda
mJo
hann
esbu
rgA
then
sM
anch
este
rS
appo
roTo
kyo
Hel
sink
iS
inga
pore
Osa
kaK
uala
Pra
gue
Sao
Pau
loS
eoul
Taip
eiB
udap
est
Cur
itiba
Bar
celo
naC
ape
Tow
nH
arar
eB
ogot
aC
raco
wH
ong
Kon
gTe
hran
Tuni
sJa
kart
aM
anila
Bei
jing
Dak
arG
uang
zhou
Cai
roC
henn
aiS
hang
hai
Mum
bai
Ho
Chi
Min
h
Cities
OF92
85
Rural Commercial Urban
ResidentialSuburban Residential
Suburban Residential Downtown Park
Rural Farmland
OC
33
32
31
30
25ENTERING THE ECOLOGICAL AGE: The Engineers Role
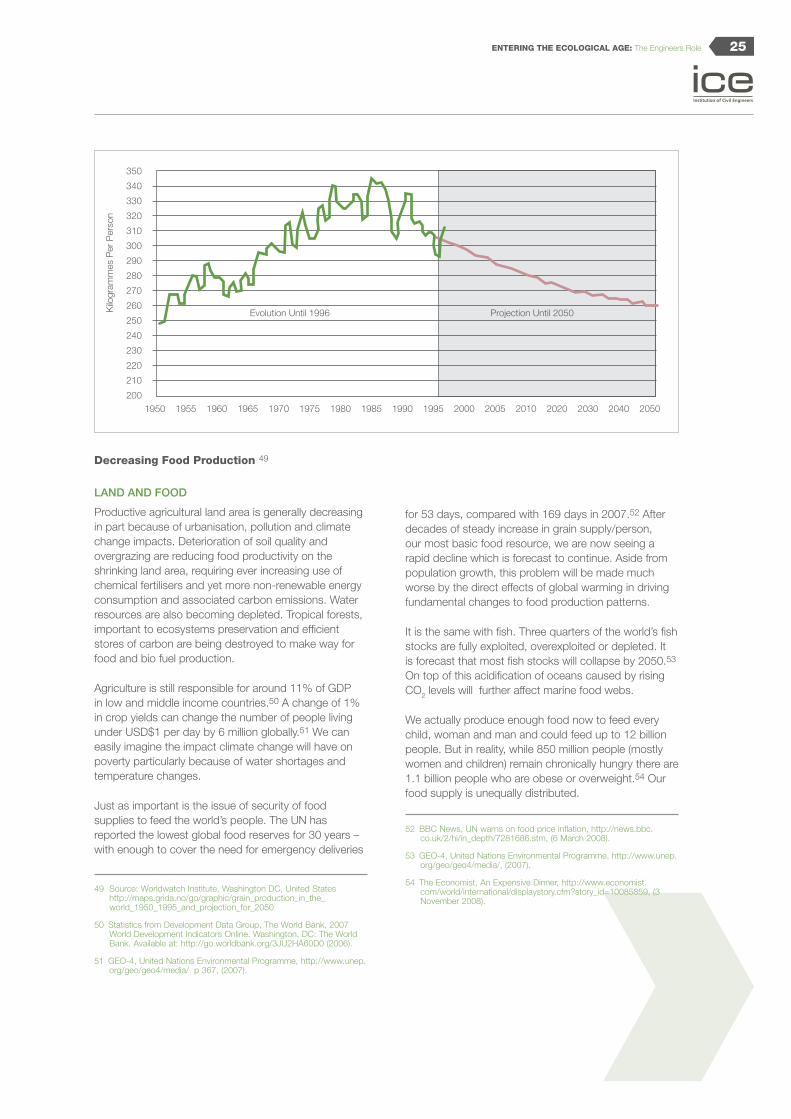
Decreasing Food Production 49
LAND AND FOOD
Productive agricultural land area is generally decreasing in part because of urbanisation, pollution and climate change impacts. Deterioration of soil quality and overgrazing are reducing food productivity on the shrinking land area, requiring ever increasing use of chemical fertilisers and yet more non-renewable energy consumption and associated carbon emissions. Water resources are also becoming depleted. Tropical forests, important to ecosystems preservation and effi cient stores of carbon are being destroyed to make way for food and bio fuel production.
Agriculture is still responsible for around 11% of GDP in low and middle income countries.50 A change of 1% in crop yields can change the number of people living under USD$1 per day by 6 million globally.51 We can easily imagine the impact climate change will have on poverty particularly because of water shortages and temperature changes.
Just as important is the issue of security of food supplies to feed the world’s people. The UN has reported the lowest global food reserves for 30 years – with enough to cover the need for emergency deliveries
49 Source: Worldwatch Institute, Washington DC, United States http://maps.grida.no/go/graphic/grain_production_in_the_world_1950_1995_and_projection_for_2050
50 Statistics from Development Data Group, The World Bank, 2007 World Development Indicators Online. Washington, DC: The World Bank. Available at: http://go.worldbank.org/3JU2HA60D0 (2006).
51 GEO-4, United Nations Environmental Programme, http://www.unep.org/geo/geo4/media/ p 367, (2007).
for 53 days, compared with 169 days in 2007.52 After decades of steady increase in grain supply/person, our most basic food resource, we are now seeing a rapid decline which is forecast to continue. Aside from population growth, this problem will be made much worse by the direct effects of global warming in driving fundamental changes to food production patterns.
It is the same with fi sh. Three quarters of the world’s fi sh stocks are fully exploited, overexploited or depleted. It is forecast that most fi sh stocks will collapse by 2050.53 On top of this acidifi cation of oceans caused by rising CO2 levels will further affect marine food webs.
We actually produce enough food now to feed every child, woman and man and could feed up to 12 billion people. But in reality, while 850 million people (mostly women and children) remain chronically hungry there are 1.1 billion people who are obese or overweight.54 Our food supply is unequally distributed.
52 BBC News, UN warns on food price inflation, http://news.bbc.co.uk/2/hi/in_depth/7281686.stm, (6 March 2008).
53 GEO-4, United Nations Environmental Programme, http://www.unep.org/geo/geo4/media/, (2007).
54 The Economist, An Expensive Dinner, http://www.economist.com/world/international/displaystory.cfm?story_id=10085859, (3 November 2008).
Kilo
gram
mes
Per
Per
son
350
340
330
320
310
300
290
280
270
260
250
240
230
220
210
200 1950 1955 1960
Evolution Until 1996 Projection Until 2050
1965 1970 1990 2020 1975 1995 2030 1980 2000 2040 1985 2010 2005 2050

THE BRUNEL LECTURE 2008: By Peter HEAD OBE FREng FRSA26
Rising Meat Consumption in China Per Capita 58
Amount of Water Used for Food Type 59
58 FAO/OECD, The BBC News, The Cost of Food: Facts & Figures, World Food Commodity Prices, http://news.bbc.co.uk/1/hi/world/7284196.stm, (1971-2017).
59 Food and Agriculture Organisation, 1997 in Drivers of Change: Water, Arup (2008).
Another worrying trend is in dietary changes. As living standards rise we are consuming more resource intensive foods. For example, moving from cereals to meat results in 2.5 to 3.5 times more land use required food production.55 This is most acutely seen in China as their increased living standards has resulted in a 2.5 times increase in meat consumption in less than 30 years.
UK’s chief scientifi c advisor, John Beddington, notes,
‘Once you move to [an income of] between £1 a day and £5 a day you get an increase in demand for meat and dairy products ... and that generates a demand for additional grain. Above £5 a day, people begin to demand processed and packaged food, which entails greater energy use.”56
The mineral fertility and balance of farmlands and entire catchment landscapes is the critical issue for food productivity and economic output. Fertilisers have been used to create these conditions but these require large energy inputs and drive further imbalances and consequent pollution.57
55 GEO-4, United Nations Environmental Programme, http://www.unep.org/geo/geo4/media/ p 142, (2007).
56 Randerson, James, Food crisis will take hold before climate change, warns chief scientist, The Guardian, http://www.guardian.co.uk/science/2008/mar/07/scienceofclimatechange.food, (7 March 2008).
57 Holmgren, David, Permaculture: Principles & Pathways Beyond Sustainability, Holmgren Design Services (2002).
1980
2007
20kg50kg
Cub
ic m
eter
s
5
10
15
0 Bovine
Meat
Sheep
Meat
Poultry
Meat
Cereals
Citrus
Fruit
Palm
Oil
Pulses,
Roots
& Tubers
27ENTERING THE ECOLOGICAL AGE: The Engineers Role
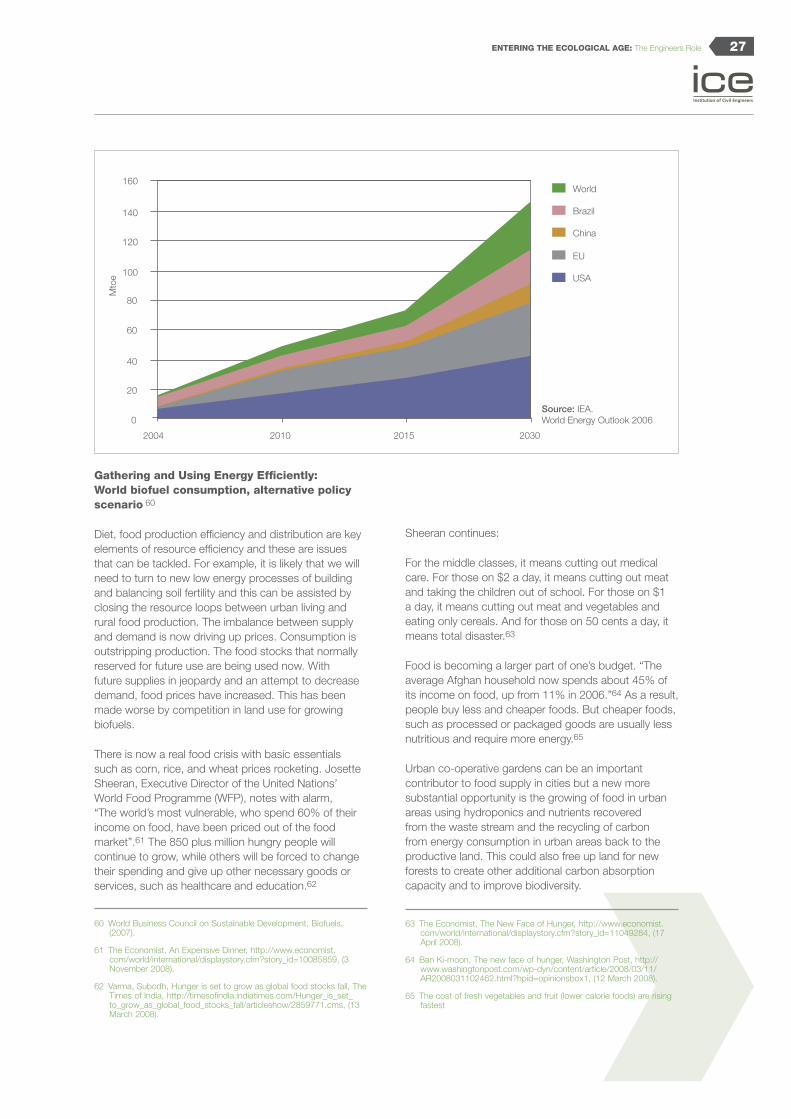
Gathering and Using Energy Effi ciently:World biofuel consumption, alternative policy scenario 60
Diet, food production effi ciency and distribution are key elements of resource effi ciency and these are issues that can be tackled. For example, it is likely that we will need to turn to new low energy processes of building and balancing soil fertility and this can be assisted by closing the resource loops between urban living and rural food production. The imbalance between supply and demand is now driving up prices. Consumption is outstripping production. The food stocks that normally reserved for future use are being used now. With future supplies in jeopardy and an attempt to decrease demand, food prices have increased. This has been made worse by competition in land use for growing biofuels.
There is now a real food crisis with basic essentials such as corn, rice, and wheat prices rocketing. Josette Sheeran, Executive Director of the United Nations’ World Food Programme (WFP), notes with alarm, “The world’s most vulnerable, who spend 60% of their income on food, have been priced out of the food market”.61 The 850 plus million hungry people will continue to grow, while others will be forced to change their spending and give up other necessary goods or services, such as healthcare and education.62
60 World Business Council on Sustainable Development, Biofuels, (2007).
61 The Economist, An Expensive Dinner, http://www.economist.com/world/international/displaystory.cfm?story_id=10085859, (3 November 2008).
62 Varma, Subodh, Hunger is set to grow as global food stocks fall, The Times of India, http://timesofindia.indiatimes.com/Hunger_is_set_to_grow_as_global_food_stocks_fall/articleshow/2859771.cms, (13 March 2008).
Sheeran continues:
For the middle classes, it means cutting out medical care. For those on $2 a day, it means cutting out meat and taking the children out of school. For those on $1 a day, it means cutting out meat and vegetables and eating only cereals. And for those on 50 cents a day, it means total disaster.63
Food is becoming a larger part of one’s budget. “The average Afghan household now spends about 45% of its income on food, up from 11% in 2006.”64 As a result, people buy less and cheaper foods. But cheaper foods, such as processed or packaged goods are usually less nutritious and require more energy.65
Urban co-operative gardens can be an important contributor to food supply in cities but a new more substantial opportunity is the growing of food in urban areas using hydroponics and nutrients recovered from the waste stream and the recycling of carbon from energy consumption in urban areas back to the productive land. This could also free up land for new forests to create other additional carbon absorption capacity and to improve biodiversity.
63 The Economist, The New Face of Hunger, http://www.economist.com/world/international/displaystory.cfm?story_id=11049284, (17 April 2008).
64 Ban Ki-moon, The new face of hunger, Washington Post, http://www.washingtonpost.com/wp-dyn/content/article/2008/03/11/AR2008031102462.html?hpid=opinionsbox1, (12 March 2008).
65 The cost of fresh vegetables and fruit (lower calorie foods) are rising fastest
160
140
120
100
80
60
40
20
0
2004 2010 2015 2030
Source: IEA. World Energy Outlook 2006
World
Brazil
China
EU
USA
Mto
e
THE BRUNEL LECTURE 2008: By Peter HEAD OBE FREng FRSA28
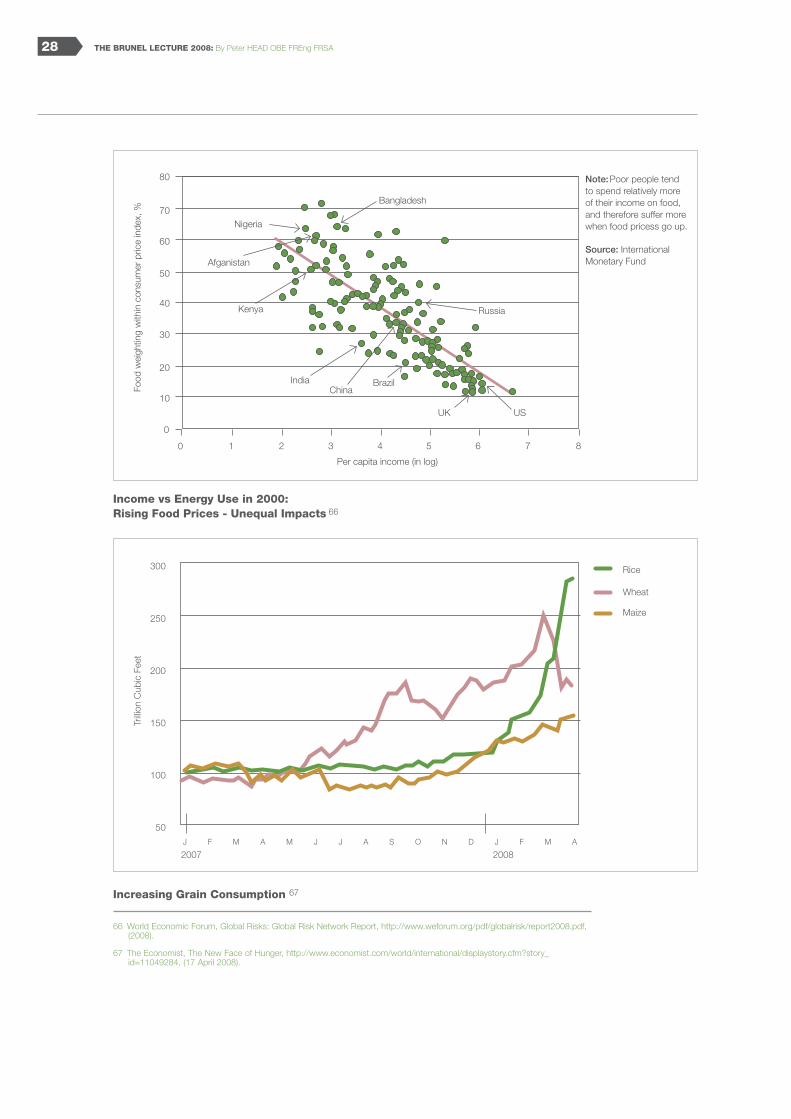
Income vs Energy Use in 2000:Rising Food Prices - Unequal Impacts 66
Increasing Grain Consumption 67
66 World Economic Forum, Global Risks: Global Risk Network Report, http://www.weforum.org/pdf/globalrisk/report2008.pdf, (2008).
67 The Economist, The New Face of Hunger, http://www.economist.com/world/international/displaystory.cfm?story_id=11049284, (17 April 2008).
300
250
200
150
100
50
Trilli
on C
ubic
Fee
t
2007 2008
Rice
Wheat
Maize
80
70
60
50
40
30
20
10
0
0 1 2 3 4 5 6 7 8
Food
wei
ghtin
g w
ithin
con
sum
er p
rice
inde
x, %
Per capita income (in log)
Note: Poor people tend to spend relatively more of their income on food,and therefore suffer more when food pricess go up.
Source: International Monetary Fund
Russia
US UK
BrazilChina
India
Kenya
Afganistan
Nigeria
Bangladesh

29ENTERING THE ECOLOGICAL AGE: The Engineers Role
Global Water Availability
WATER AND FOOD SECURITY AND HEALTH
Freshwater resources are fundamental to agriculture, food production and human development. The UN Environmental Programme reports that “if present trends continue, 1.8 billion people will be living in countries or regions with absolute water scarcity by 2025, and two thirds of the world population could be subject to water stress.”68 This is caused primarily by over-abstraction, ineffi cient/inequitable use, man made pollution and damage to the eco-system by deforestation. There is also an overconsumption by the agricultural sector and draw-down of most aquifers, largely from ineffi cient water pricing.69
In the UK we are not free from many of these problems. Even before the impacts of climate change and the increased demands, there is increasingly critical water scarcity in the southeast of England.70 For water bodies, the responsibility lies within our own neglectful and wasteful practices. 500 water bodies are at risk from excessive water withdrawals and still the wastewater from 1.3 million properties goes straight into rivers. As a result of agricultural, human and industrial waste, 70% of our rivers still fail to support a salmon population.71
68 GEO-4, United Nations Environmental Programme, http://www.unep.org/geo/geo4/media/ p 148, (2007).
69 Timmins, C., Environmental Resource Economics, Volume 26, Number 1, sourced from, http://www.springerlink.com/content/rp22580246p40t34, (2004).
70 Department for Environmental, Food and Foreign Affairs, Future Water; The Governments Strategy for water in England, sourced from http://www.defra.gov.uk/environment/water/strategy/pdf/future-water.pdf (February 2008).
71 Blueprint for Water, 10 steps to sustainable water by 2015, Blueprint for Water, http://www.blueprintforwater.org.uk/Blueprint_A4.pdf (November 2006).
On the other hand we do not recycle vast quantities of wastewater which have been treated in the fi rst place, we do not collect and use local rainwater and we allow vast quantities of treated water to leak away. Much energy is wasted treating the water which goes to waste too.
There are major opportunities to use recycled water. This can be from urban development to give effi cient irrigation of surrounding farmland and to collect and store water run-off in cities and use it as grey water for secondary uses. These lead to a reduction in the demand for potable water and the associated energy needed for treatment. It can also help mitigate climate change impacts of increased storm rainfall intensity on fl ooding
All the technology that would allow us to do this is on the market and is not excessively expensive. As a profession, we must question our attitude to planning and implementation to work out why this simple technology is not implemented. It is quite likely due to a culture that reusing resources is somehow inappropriate in a high income country.
Water Scarcity
Approaching Water Scarity
Source: International Water Management Institute
THE BRUNEL LECTURE 2008: By Peter HEAD OBE FREng FRSA30
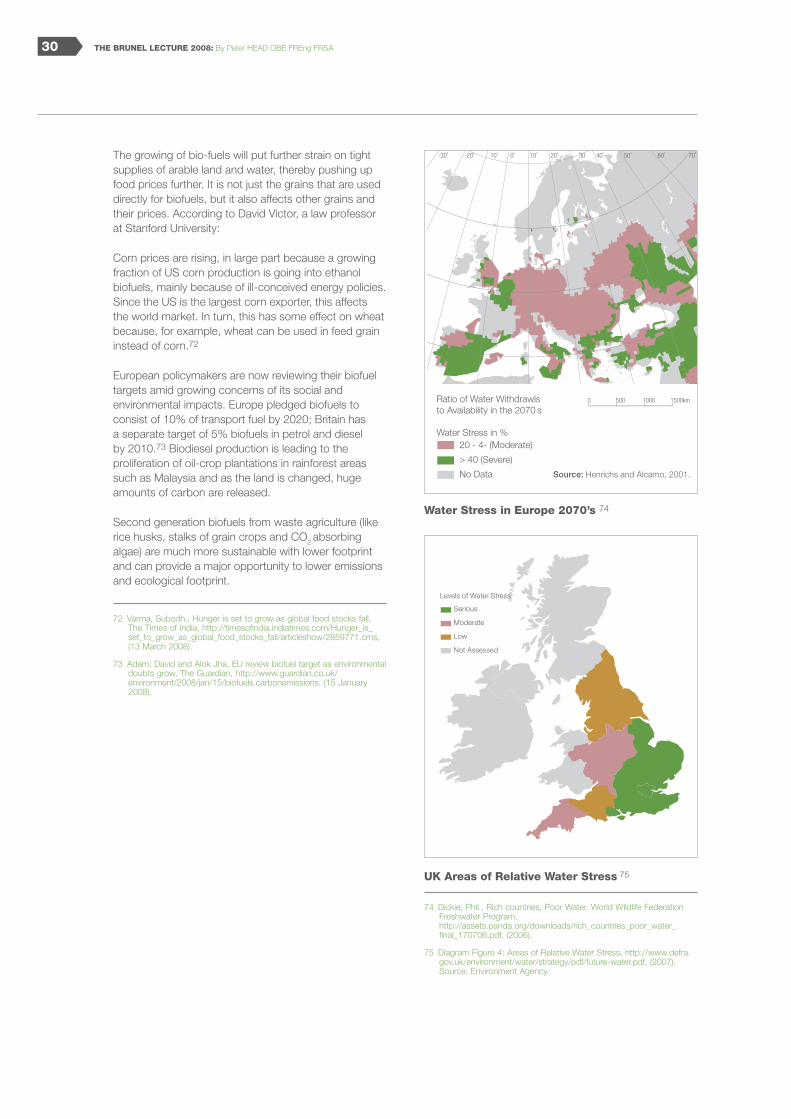
Water Stress in Europe 2070’s 74
UK Areas of Relative Water Stress 75
74 Dickie, Phil., Rich countries, Poor Water, World Wildlife Federation Freshwater Program, http://assets.panda.org/downloads/rich_countries_poor_water_final_170706.pdf, (2006).
75 Diagram Figure 4: Areas of Relative Water Stress, http://www.defra.gov.uk/environment/water/strategy/pdf/future-water.pdf, (2007). Source: Environment Agency
The growing of bio-fuels will put further strain on tight supplies of arable land and water, thereby pushing up food prices further. It is not just the grains that are used directly for biofuels, but it also affects other grains and their prices. According to David Victor, a law professor at Stanford University:
Corn prices are rising, in large part because a growing fraction of US corn production is going into ethanol biofuels, mainly because of ill-conceived energy policies. Since the US is the largest corn exporter, this affects the world market. In turn, this has some effect on wheat because, for example, wheat can be used in feed grain instead of corn.72
European policymakers are now reviewing their biofuel targets amid growing concerns of its social and environmental impacts. Europe pledged biofuels to consist of 10% of transport fuel by 2020; Britain has a separate target of 5% biofuels in petrol and diesel by 2010.73 Biodiesel production is leading to the proliferation of oil-crop plantations in rainforest areas such as Malaysia and as the land is changed, huge amounts of carbon are released.
Second generation biofuels from waste agriculture (like rice husks, stalks of grain crops and CO2 absorbing algae) are much more sustainable with lower footprint and can provide a major opportunity to lower emissions and ecological footprint.
72 Varma, Subodh., Hunger is set to grow as global food stocks fall, The Times of India, http://timesofindia.indiatimes.com/Hunger_is_set_to_grow_as_global_food_stocks_fall/articleshow/2859771.cms, (13 March 2008).
73 Adam, David and Alok Jha, EU review biofuel target as environmental doubts grow, The Guardian, http://www.guardian.co.uk/environment/2008/jan/15/biofuels.carbonemissions, (15 January 2008).
Serious
Moderate
Low
Not Assessed
Levels of Water Stress
20 - 4- (Moderate)
> 40 (Severe)
No Data
Ratio of Water Withdrawlsto Availability in the 2070 s
Water Stress in %
31ENTERING THE ECOLOGICAL AGE: The Engineers Role
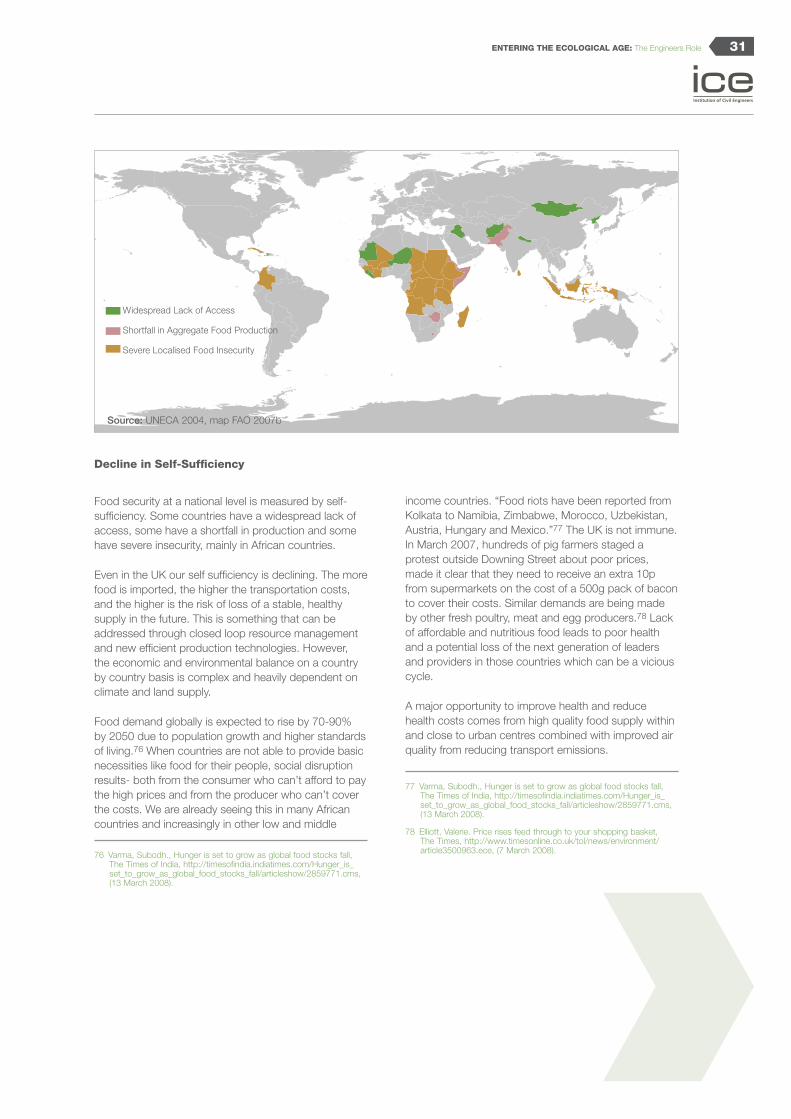
Decline in Self-Suffi ciency
Food security at a national level is measured by self-suffi ciency. Some countries have a widespread lack of access, some have a shortfall in production and some have severe insecurity, mainly in African countries.
Even in the UK our self suffi ciency is declining. The more food is imported, the higher the transportation costs, and the higher is the risk of loss of a stable, healthy supply in the future. This is something that can be addressed through closed loop resource management and new effi cient production technologies. However, the economic and environmental balance on a country by country basis is complex and heavily dependent on climate and land supply.
Food demand globally is expected to rise by 70-90% by 2050 due to population growth and higher standards of living.76 When countries are not able to provide basic necessities like food for their people, social disruption results- both from the consumer who can’t afford to pay the high prices and from the producer who can’t cover the costs. We are already seeing this in many African countries and increasingly in other low and middle
76 Varma, Subodh., Hunger is set to grow as global food stocks fall, The Times of India, http://timesofindia.indiatimes.com/Hunger_is_set_to_grow_as_global_food_stocks_fall/articleshow/2859771.cms, (13 March 2008).
income countries. “Food riots have been reported from Kolkata to Namibia, Zimbabwe, Morocco, Uzbekistan, Austria, Hungary and Mexico.”77 The UK is not immune. In March 2007, hundreds of pig farmers staged a protest outside Downing Street about poor prices, made it clear that they need to receive an extra 10p from supermarkets on the cost of a 500g pack of bacon to cover their costs. Similar demands are being made by other fresh poultry, meat and egg producers.78 Lack of affordable and nutritious food leads to poor health and a potential loss of the next generation of leaders and providers in those countries which can be a vicious cycle.
A major opportunity to improve health and reduce health costs comes from high quality food supply within and close to urban centres combined with improved air quality from reducing transport emissions.
77 Varma, Subodh., Hunger is set to grow as global food stocks fall, The Times of India, http://timesofindia.indiatimes.com/Hunger_is_set_to_grow_as_global_food_stocks_fall/articleshow/2859771.cms, (13 March 2008).
78 Elliott, Valerie. Price rises feed through to your shopping basket, The Times, http://www.timesonline.co.uk/tol/news/environment/article3500963.ece, (7 March 2008).
Widespread Lack of Access
Shortfall in Aggregate Food Production
Severe Localised Food Insecurity
Source: UNECA 2004, map FAO 2007b

THE BRUNEL LECTURE 2008: By Peter HEAD OBE FREng FRSA32
UK’s Falling Food Self-Suffi ciency 79
ENERGY AND RAW MATERIALS
If current trends continue the world’s primary energy demand will more than double by 2030; almost half of that will be accounted for by energy demand in India and China alone.80
In the UK, 90% of the energy we use comes from fossil fuels. In the Industrial Age model, as GDP goes up from low levels, energy demand and emissions rise proportionately. This is what has happened recently in Spain and Ireland.81 As high income economies then move manufacturing to other countries, however, their energy consumption and emissions tend to stabilise.
Energy Consumption
79 Simms, Andrew, Dan Moran and Peter Chowla, UK Interdependence Report, New Economics Foundation, http://www.neweconomics.org/gen/uploads/f2abwpumbr1wp055y2l10s5514042006174517.pdf, (2006).
80 International Energy Agency, World Energy Outlook 2007- China and India Insights, http://www.worldenergyoutlook.org/, (7 November 2007).
81 Energy and emissions increase in Ireland, Environment Protection Agency, (December 2007).
Orig
inal
Met
hodo
logy
(%)
Rev
ised
l Met
hodo
logy
(%)
Source: Defra 2005. 59
85807570656055504540353025201510
50
Food (OM)Indgenous Food (OM)
95
90
85
80
75
70
65
60
1956 1972 1976 1980 1984 1988 1992 1996 2000 2004
All Food (RM)Indgenous Food (RM)
350
300
250
200
150
100
50
0
0 5 10 15 20 25 30 35
GJ/
capi
ta
GDP/Capita ( 000 1997$ PPP)
Australia
EU
India Brazil
Korea
USA
Thailand
Mexico
Japan
China
Source: IMF, BP
33ENTERING THE ECOLOGICAL AGE: The Engineers Role
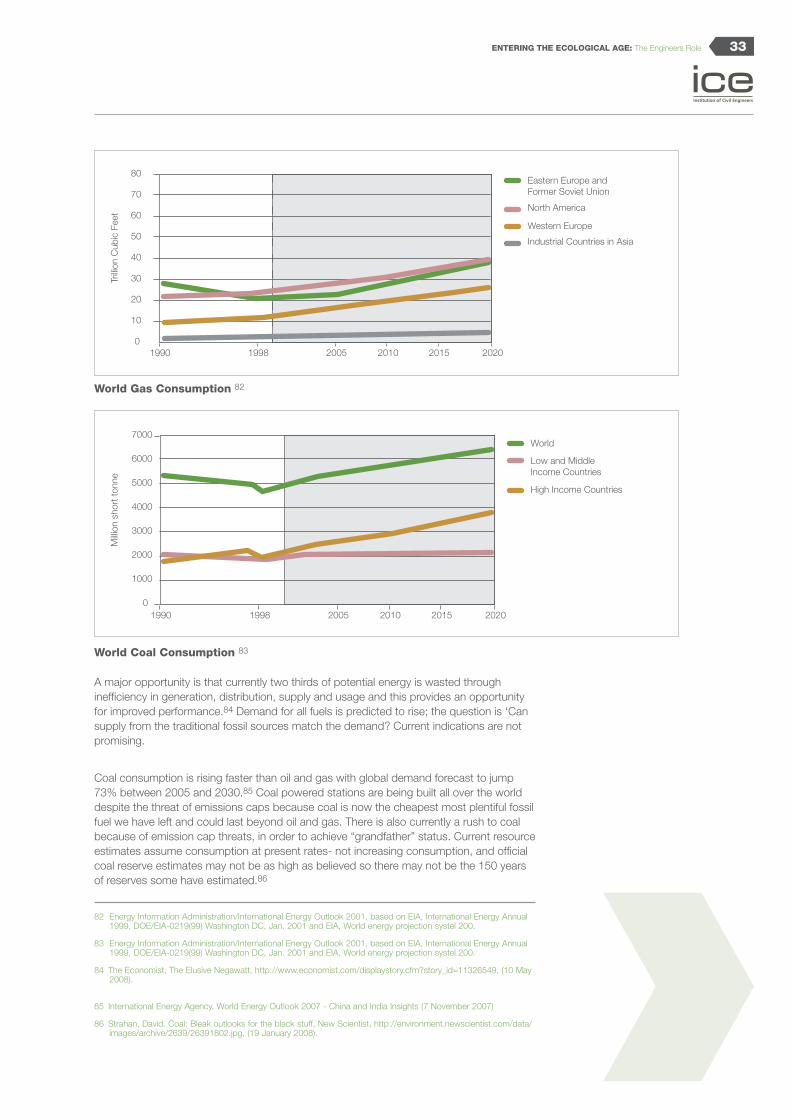
World Gas Consumption 82
World Coal Consumption 83
A major opportunity is that currently two thirds of potential energy is wasted through ineffi ciency in generation, distribution, supply and usage and this provides an opportunity for improved performance.84 Demand for all fuels is predicted to rise; the question is ‘Can supply from the traditional fossil sources match the demand? Current indications are not promising.
Coal consumption is rising faster than oil and gas with global demand forecast to jump 73% between 2005 and 2030.85 Coal powered stations are being built all over the world despite the threat of emissions caps because coal is now the cheapest most plentiful fossil fuel we have left and could last beyond oil and gas. There is also currently a rush to coal because of emission cap threats, in order to achieve “grandfather” status. Current resource estimates assume consumption at present rates- not increasing consumption, and offi cial coal reserve estimates may not be as high as believed so there may not be the 150 years of reserves some have estimated.86
82 Energy Information Administration/International Energy Outlook 2001, based on EIA, International Energy Annual 1999, DOE/EIA-0219(99) Washington DC, Jan. 2001 and EIA, World energy projection systel 200.
83 Energy Information Administration/International Energy Outlook 2001, based on EIA, International Energy Annual 1999, DOE/EIA-0219(99) Washington DC, Jan. 2001 and EIA, World energy projection systel 200.
84 The Economist, The Elusive Negawatt, http://www.economist.com/displaystory.cfm?story_id=11326549, (10 May 2008).
85 International Energy Agency, World Energy Outlook 2007 - China and India Insights (7 November 2007)
86 Strahan, David. Coal: Bleak outlooks for the black stuff, New Scientist, http://environment.newscientist.com/data/images/archive/2639/26391802.jpg, (19 January 2008).
80
70
60
50
40
30
20
10
01990 1998 2005 2010 2015 2020
Trilli
on C
ubic
Fee
t
Eastern Europe and Former Soviet Union
North America
Western Europe
Industrial Countries in Asia
7000
6000
5000
4000
3000
2000
1000
01990 1998 2005 2010 2015 2020
Milli
on s
hort
tonn
e
World
High Income Countries
Low and Middle Income Countries

THE BRUNEL LECTURE 2008: By Peter HEAD OBE FREng FRSA34
Coal Production Top 10 Countries (2007) 87
Rising Cost of Coal 88
Carbon capture and storage, plus new coal gasifi cation technologies offer the opportunity to reduce emissions from coal power stations. The costs are high, however, because of the need to liquefy and store the carbon dioxide gas. Other new technologies are in sight for creating short carbon cycles in urban areas by absorbing carbon dioxide at local power stations into different algae forms and using the algae and by-products as a local fuel with the carbon being returned to the land.
Energy from renewable energy sources such as solar, wind, tidal stream and wave power are greatly underutilised. Yet with the exception of solar, all of these require signifi cant amount of steel in their production. Manufacturing steel needs coke from coal. This again illustrates the links between the multitude of interlinked cycles. Photovoltaic solar energy production currently needs silicon. The manufacture of silicon for PV applications is a highly energy intensive process.
87 Strahan, David. Coal: Bleak outlooks for the black stuff, New Scientist, http://environment.newscientist.com/data/images/archive/2639/26391802.jpg, (19 January 2008).
88 Strahan, David. Coal: Bleak outlooks for the black stuff, New Scientist, http://environment.newscientist.com/data/images/archive/2639/26391802.jpg, (19 January 2008).
0 500 1000 1500 2000 2500
China
US
India
Australia
Russia
South Africa
Germany
Poland
Indonesia
Kazakhstan
Rest of world
Million tonnes
1998
140
120
100
80
60
40
20
0
$ pe
r to
nne
2000 2002 2004 2006 2008

35ENTERING THE ECOLOGICAL AGE: The Engineers Role
1920 1930 1940 1950 1960 1970 1980 1990 2000 2010
5
10
15
20
25
30
35
40
[Mb
pe
r d
ay
]
Forecast
Indonesia 1977
India 1995
Gabon 1997
Argentina 1998
Malaysia 1997
Colombia 1999
China
UK 1999
Ecuador 1999
Germany 1967Austria 1955
Romania 1976
BrazilAngola
Mexico 2004
Neutral Zone
VietnamThailandEq. GuineaSudan, Chad
Egypt 1993
Syria 1995
Canada (conv.) 1974
Lower 48, USA 1971
Texas, USA 1971
Alaska 1989
GoM
NGL, USA 2002
Norway 2001
Venezuela 1998/1968
- 3% p.a.Oman 2001
Australia 2000
Denmark 2004
Yemen 2001
Peaking of Global Oil Reserves 89
There is much more solar energy available in the desert regions of the world than we are currently generating from fossil fuels. According to the 2006 United Nations Environment Report, an area of 640,000 square kilometres could provide the world with all of its electricity needs (the Sahara is more than 9 million square kilometres in size).90 But climate change could also turn valuable deserts and their solar resource uninhabitable with unbearable rising temperatures and water scarcity. We have to be willing to build the infrastructure to transfer the desert power into our urban areas. This is one of the greatest opportunities for new technology to help solve our problems.
Nuclear power and gas power will have a continued important role to play in the energy supply mix. There are limits to sources of supply and prices of raw materials will inevitably rise.
And fi nally on energy we move to oil where there is a future prospect the supply becoming unable to keep up with demand. The only thing that can happen is an increasing trend in price which at the moment has heightened volatility caused by speculation and the integration of material options and futures into fi nancial
89 Energy Watch Group. “Crude Oil: The Supply Outlook”. EWG-Series No3/2007 October 2007.
90 United Nations Environment Report (2006)
markets. Price has increased fourfold in seven years.91 The cost of traditional production has changed little but deeper wells and a transition to more inaccessible sources is having an impact. Most of the increase in prices is down to the classic economic model of supply unable to meet demand. The inelasticity of oil demand means that the price must get high before demand is “killed”. ‘Peak Oil’ is a controversial prediction that total oil supplies will soon start to decline as the quantity of new sources is less than the depletion of old ones.92 An increase in oil prices not only affects our energy costs, but trickles through to the costs of other goods that have increased transport costs. When the price of other goods increases, particularly necessities, those who are less able to afford it will feel the largest impact. We know that current supplies of oil will not last forever and it may become an uneconomic growth model to move to new sources of oil, such as tar sands, which have high environmental burdens associated with them.
Raw material consumption is rising very fast. In the 20 years to 1994 population grew by 40% and the consumption of cement grew by 80% and plastics by 200%.93 The extraction of minerals comes at an environmental price with mining stripping more of the
91 The Economist, Shock Treatment, http://www.economist.com/finance/displaystory.cfm?story_id=10130655, (15 November 2007).
92 Roberts, Simon. Email to author. 1 April 2008.
93 U.S Geological Society, Materials Flow & Sustainability, USGS Fact Sheet FS-068-98, http://pubs.usgs.gov/fs/fs-0068-98/fs-0068-98.pdf, (June 1998).

THE BRUNEL LECTURE 2008: By Peter HEAD OBE FREng FRSA36
Raw Material Consumption 94
earth’s surface each year than natural erosion. At a typical copper mine 125 tonnes of ore are excavated to produce just one tonne of copper.95 The largest potential copper mines in the world, however, are now in the buildings, products, and infrastructure of cities like New York and Tokyo. It is becoming more attractive to recover copper from old buildings than to mine virgin copper from the ground. The decreasing ore grade of many natural ore deposits means that we need ever more high-quality energy to extract and process metal ore to serve our modern needs.96
We need to think more about how to mine and then recycle what we have already locked into city fabric both for new construction and for new products. For example, materials in sprawling single use suburbs could be recycled to form higher density mixed use communities in city centres where this way of living becomes more attractive due to high fuel and resource costs.
94 University of Minnesota
95 United Nations Environment Programme/ GRID-Arendal, Vital Waste Graphics, http://maps.grida.no/go/graphic/how-long-does-it-take-for-some-commonly-used-products-to-biodegrade, (2004).
96 Department of Treasury & Finance, DTF Research Note, The World Iron market in 2005, sourced from http://www.dtf.wa.gov.au/cms/uploadedFiles/iron_research_note_may2005.pdf (2005).
Mining and Recycling 97
97 EAA C. Sperlinger, Nachhaltige Stadtentwicklung beginnt im Quartier OeKoinstiut e.V (Ed) Freiburg, 1999 in Drivers of Change: Waste, Arup 2008
Aluminium Bauxite Red Mud
In order to produce one tonne of aluminium
4 to 5 tonnes of bauxite have to be extracted
Waste RockThe mining processgenerates 10 tonnes of waste rock
and 3 tonnes of toxicred mud
1t 1t
1t
Iron
Copper
10 2 3 4 5 6 7 8 9 10 11 12 13 14 15 16 17 18 19 20 21 22 23 24 25 26 27
Gold
Zinc
Lead
Aluminium
Manganese
Nickel
Tin
Tungstene Ore
Waste Rock
Millions of Tons
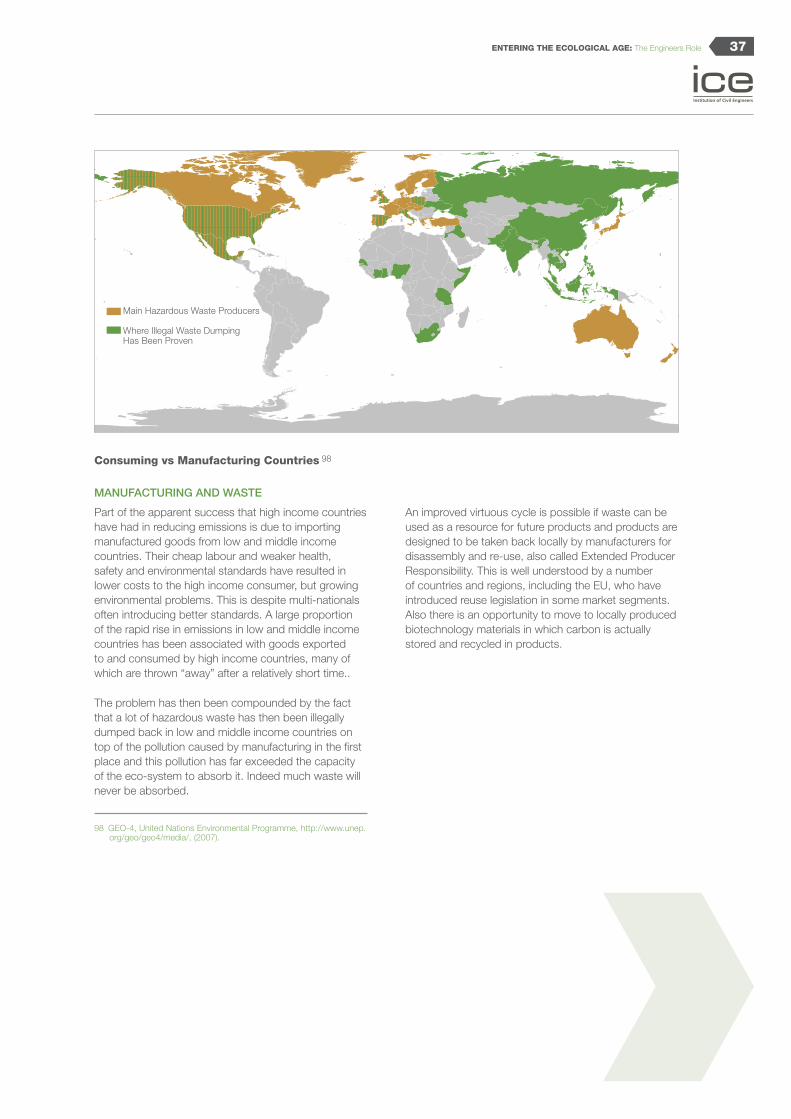
37ENTERING THE ECOLOGICAL AGE: The Engineers Role
Consuming vs Manufacturing Countries 98
MANUFACTURING AND WASTE
Part of the apparent success that high income countries have had in reducing emissions is due to importing manufactured goods from low and middle income countries. Their cheap labour and weaker health, safety and environmental standards have resulted in lower costs to the high income consumer, but growing environmental problems. This is despite multi-nationals often introducing better standards. A large proportion of the rapid rise in emissions in low and middle income countries has been associated with goods exported to and consumed by high income countries, many of which are thrown “away” after a relatively short time..
The problem has then been compounded by the fact that a lot of hazardous waste has then been illegally dumped back in low and middle income countries on top of the pollution caused by manufacturing in the fi rst place and this pollution has far exceeded the capacity of the eco-system to absorb it. Indeed much waste will never be absorbed.
98 GEO-4, United Nations Environmental Programme, http://www.unep.org/geo/geo4/media/, (2007).
An improved virtuous cycle is possible if waste can be used as a resource for future products and products are designed to be taken back locally by manufacturers for disassembly and re-use, also called Extended Producer Responsibility. This is well understood by a number of countries and regions, including the EU, who have introduced reuse legislation in some market segments. Also there is an opportunity to move to locally produced biotechnology materials in which carbon is actually stored and recycled in products.
Main Hazardous Waste Producers
Where Illegal Waste Dumping Has Been Proven

THE BRUNEL LECTURE 2008: By Peter HEAD OBE FREng FRSA38
Regional Distribution of Disasters 99
Adaptation to climate change impacts
There are an increasing number of natural disasters caused by climate change. The growing populations – particularly in coastal areas have increasing exposure to fl oods and cyclones, droughts and fl oods – are affecting food production and prices and higher summer temperatures are creating dangerous conditions for the elderly and infi rm. This is caused by the higher intensity of storms. Fires are also becoming more frequent. Many of the nations and regions most at risk from the impacts of climate change are low and middle income nations that have contributed very little to greenhouse gases. These nations are not the best equipped with the skills and resources to combat climate change impacts or to prevent its occurrence. The number of deaths in certain countries is decreasing thanks to early warning systems that trigger mass evacuations to shelters, but the social and economic impacts are terrible. Overall the impacts are already becoming very serious.
Low and Middle Income Countries Most Affected by Climate Change, Fewest Resources to Combat it
99 EM-DAT: The OFDA/CRED International Disaster Database. http: //www.em-dat.net, UCL - Brussels, BelgiumBase Map: UNEP/DEWA/GRID-Europe, June 2005
Oceania
Asia
Europe
Americas & Caribbean
Africa
73%
35%
35%
83%
53%
36%
6%11%
12%2%
77%
2%
1%
1%
1%
1%
8%
8%
2%
2%2%
2%
9% 3%
3%5%
1%9%1%4%
4%
4%
4%
Droughts Epidemics FaminesFloods Slides Wind StromsEarthquakes Wave & Surge Extreme Temperature
1970s
500
1500
Num
ber
of P
eopl
e A
ffect
ed (M
illion
s)
2500
3500
1980s 1990s 2000s
High Income CountriesLow and Middle Income Countries
Compiled from EM-DAT

39ENTERING THE ECOLOGICAL AGE: The Engineers Role
Premature Deaths from Urban Ozone Exposure for 2000 and 2030 100
We have a huge responsibility to act now to reduce our emissions and ecological footprint. In making these changes we need to make sure that strategies and investments to protect vulnerable communities are put in place at the same time.
Adaptation must be a priority and should go hand in hand with mitigation in high income countries across the planet. Costs can be reduced by combining infrastructure investments to serve both purposes. For example, we can plan urban areas to take advantage of natural cooling through green roofs and parks, combining lower greenhouse gas emissions and hence lower heat stress for residents. Urban development in low and middle income countries needs to address adaptation within the sustainable development objectives.
100 OECD Environmental Outlook to 2030, www.oecd.org/environment/outlookto2030, (5 March 2008).
World
Rest of the world
China
South Asia(including India)
Russia
Brazil
Asia
North America
Europe
0 10 20 30 40 50 60 70 80 90 100
Premature deaths per million inhabitants
2030
2000

THE BRUNEL LECTURE 2008: By Peter HEAD OBE FREng FRSA40

41ENTERING THE ECOLOGICAL AGE: The Engineers Role
4. A FRAMEWORK FOR TRANSFORMATION
We can conclude that the very system that underpins our planet’s economic growth is threatened. We are being profl igate in our use of mineral and energy resources, our agricultural ineffi ciency is threatening our ability to feed our ever growing population. As a result our social fabric is under pressure and the closed system that is our planet is changing in ways that threaten the lives of increasing numbers of its inhabitants.
As all of us share this planet, we must fi nd a way to live more harmoniously with the natural world. It is therefore important that we have a framework for driving change from the Agricultural and Industrial Ages towards the Ecological Age so we can meet our three objectives: C02 emissions reduction; ecological footprint reduction; and human development improvement.
A very logical approach is to adopt principles that mimic the biological system that we are a part of. It is an extension of the sustainability principles where we balance economic, environmental and social impacts.
Biomimicry Principles
The successful organisms on the planet are those that have lived competitively for millions of years within eco-systems without consuming their ecological capital.
In her brilliant work Biomimicry, Janine Benyus writes:
[I]n the end what makes us different from other creatures is our ability to collectively act on our understanding. This is the moment we can decide as a culture to listen to life, to echo what we hear and make the conscious choice to follow nature’s lead.101
I fi rmly believe that using the principles of biomimcry and working with nature’s effi cient organisms is the lowest risk way of moving quickly to the Ecological Age. Eco-systems have an amazing capacity to recycle materials and use the sun’s energy to sustain development and withstand shocks and we should learn from them and get them to help us.
The eventual aim has to be to move to an optimal economic scale rather than continue to maximise scale and to force our own system relationships onto other organisms. We need to rebalance our systems and rediscover that our world is powered by the sun. This vision of the future is at a time well beyond 2050, but by 2050 we need to be well on the way in the transition.
Benyus set out 10 principles which can guide us on this path and at Arup we are using them to guide many projects all over the world. These principles will be used to show how urban areas, manufacturing, food production and energy and water supplies can be transformed and to explore the possibility of using the support of known and developing technologies, often working in partnership with optimised natural organisms like bacteria and algae, to reach our new goals.
101 Benyus, Janine. Biomimicry: Innovations that Inspired by Nature. Harper Collins: New York, (1997).

THE BRUNEL LECTURE 2008: By Peter HEAD OBE FREng FRSA42
The principles, listed below, have been used to guide the visioning of economic growth trajectories for high, middle, and low income countries towards the new goals:
Use waste as a resource•
Diversify and cooperate•
Gather and use energy efficiently•
Optimise not maximise•
Use materials sparingly•
Clean up not pollute•
Do not draw down resources•
Remain in balance with the biosphere•
Run on information•
Use local resources•
It is worth a quick reminder that this must be accompanied by programmes for health and education mentioned earlier.
Objectives for 2050
It is important for low and middle income countries to develop in a way that improves quality of life and creates jobs and opportunities within the emerging ecological age global economy in which resource effi ciency underpins development. The planning, design and investment model will be a new one following the long term lessons from cities like Curitiba, Brazil and our current work, such as Dongtan Eco-city in Shanghai, China. For these low and middle income countries this approach can be thought of as a way of leapfrogging from the Agricultural Age to the Ecological Age.
At the same time high-income countries need to rebase their paradigms around city living, rural food production, water management, energy supply and manufacturing to take advantage of the ecological age economy. They need to avoid the ravages of infl ation and political risks of shortages of basic needs that result from a continued focus in industrial production. This will require investment to transform existing cities along the lines of the London Climate Change Action Plan and various One Planet Living studies by WWF. We call this retrofi tting and envisage this will be carried out at a regional scale of communities of at least 50,000 to 100,000 people.
As noted in the introduction, the Key Objectives for 2050 Ecological Age are:
CO• 2 Reduction: 80% back to 1990-levels by 2050
Ecological Footprint Decrease: a transition of • Ecological Footprint to the global earth share in all countries, 1.44gha/person, based on projected global population in 2050
Human Development Index Improvement: raise • overall wellbeing in GDP/capita, life expectancy, and education.
These are theoretical goals for the purpose of examining if there is a way of achieving the outcomes using current knowledge and with the Biomimicry Principles driving the direction. A key underlying assumption globally is that as overall effi ciency improves there will be a redistribution to ensure that those on low incomes benefi t and do not become more deprived.

43ENTERING THE ECOLOGICAL AGE: The Engineers Role
This is an extremely complex subject and some simplifying assumptions are necessary in order to achieve some useful fi ndings which are easy to understand.
Existing urban centres are divided into three basic models:
The fi rst type focuses on the expansion or creation of urban areas, while the fi nal two look into retrofi tting existing areas. The emerging economy’s goal is to avoid an increase in ecological footprint as it continues to grow and improve its human development index. The European and USA model aims to decrease its ecological footprint while maintaining a high human development index.
Infrastructure confi gurations for the ecological age are then examined. Is it possible to take countries from their existing ecological footprint, resource consumption and emissions levels to the human development goals? Can it be done by improving overall land use effi ciency, reducing resource intensity, a transition to renewable resources and controlling emissions? In doing this the impacts of climate change will be estimated where possible with respect to changes in land area and productivity after reasonable adaptation measures are adopted.
Urban Centre Models
Main Characteristics
Ecological Footprint
Human Development
Index
Example Locations
Emerging Economy
Dense Living, growing population
1 to 2 .4-.8 Africa, Latin America, Eastern Europe, China, India
European High Density, low car use
4 to 8 >.08 Western Europe, Japan, Korea, Singapore
USA Sprawl, high car use
8 to 15 >.08 North America, Australia
5. A MODEL FOR EACH COUNTRY

THE BRUNEL LECTURE 2008: By Peter HEAD OBE FREng FRSA44
Ecological Footprint and Human Development Index 102
The Ecological Footprint is very good at answering a question that other indicators don’t: “Are we living within the biological capacity of the planet?” It helps us understand the limits of the environment and its ability to give. The idea of requiring three planets to provide all our resources, if we were to live like the average person in the UK, is a powerful metaphor and can be used for educational purposes and to raise awareness. In conjunction with a sustainability appraisal the Footprint can help to identify both unsustainable trends that create opportunities for more sustainable management of resources and the challenges we face in the future.
Ecological Footprint’s main unit of measurement, global hectares (gha), are hectares (ha) with world-average productivity for all productive land and water areas in a given year.103 The results are globally comparable, just as fi nancial assessments use one currency, such as dollars or Euros, to compare transactions and fi nancial fl ows throughout the world. This means that because different land types have different productivity, a global hectare of, for example, cropland, would occupy a smaller physical area than the much less biologically productive pasture land, as more pasture would be needed to provide the same biocapacity as one hectare of cropland. Because world bioproductivity varies slightly from year to year, the value of a gha may change slightly from year to year.
102 Global Footprint Network: http://www.footprintnetwork.org/
103 Global Footprints Network, Footprint Standards, http://www.footprintstandards.org/, (2003-2007).
The Footprint only addresses Ecological sustainability. It is a quantitative measure, and does not evaluate the quality of the environment. It does not account for the impact of pollutants, the quality of soil management or other external factors that may have an effect on natural resources such as nuclear power.104 A comparison between Footprints and Biocapacity accounts on a global scale tells us whether we consume within ecological limits. Comparisons of a local population’s Footprint to the local or regional biocapacity, however, does not necessarily predict whether that Footprint could be sustained on a global scale. Additionally, the Ecological Footprint indicator should be supported with local data and should also consider economic and social indicators in order to give the whole picture of sustainable development. Nonetheless, accounting for these limitations and including our two other metrics, UN’s Human Development Index and overall CO2 emissions helped us utilize the strengths of ecological footprint, and fully prepare our transition towards an ecological age.
It is argued that if we have a realistic and well founded vision of a way of living in 2050 that is within the carrying capacity of the planet, then there is much more chance through leadership and partnerships that we can get there.
104 Currently, an international working group of experts is examining how nuclear power generation can be expressed adequately.
10
8
6
4
2
0
Human Development Index
Eco
logi
cal F
ootp
rint (
Glo
bal H
ecta
res
Per
Per
son)
0 0.2 0.4 0.6 0.8 1.0
Threshold for HighHuman Development
Sustainable Development
Quadrant
Global Average Available Biocapacity Per Person With No Area Set Aside For Wild Species
AfricaAsia PacificEuropeLatin AmericaMiddle East and Central AsiaNorth America
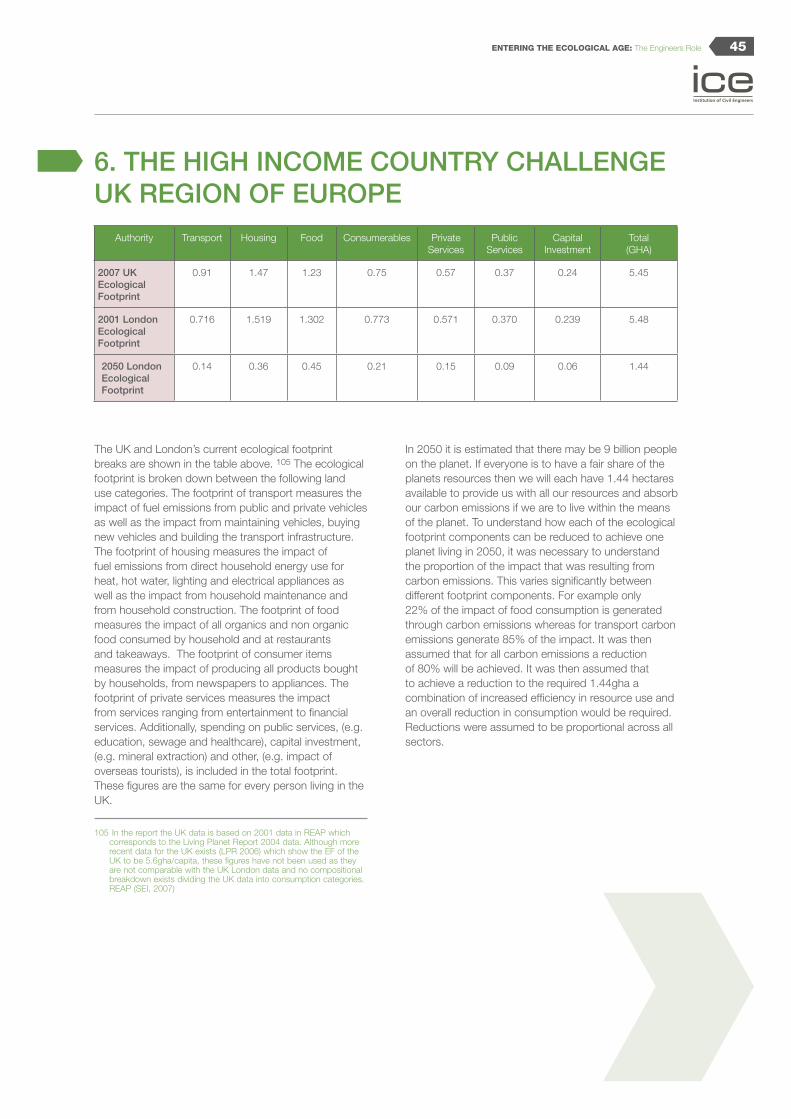
45ENTERING THE ECOLOGICAL AGE: The Engineers Role
6. THE HIGH INCOME COUNTRY CHALLENGEUK REGION OF EUROPE
The UK and London’s current ecological footprint breaks are shown in the table above. 105 The ecological footprint is broken down between the following land use categories. The footprint of transport measures the impact of fuel emissions from public and private vehicles as well as the impact from maintaining vehicles, buying new vehicles and building the transport infrastructure. The footprint of housing measures the impact of fuel emissions from direct household energy use for heat, hot water, lighting and electrical appliances as well as the impact from household maintenance and from household construction. The footprint of food measures the impact of all organics and non organic food consumed by household and at restaurants and takeaways. The footprint of consumer items measures the impact of producing all products bought by households, from newspapers to appliances. The footprint of private services measures the impact from services ranging from entertainment to fi nancial services. Additionally, spending on public services, (e.g. education, sewage and healthcare), capital investment, (e.g. mineral extraction) and other, (e.g. impact of overseas tourists), is included in the total footprint. These fi gures are the same for every person living in the UK.
105 In the report the UK data is based on 2001 data in REAP which corresponds to the Living Planet Report 2004 data. Although more recent data for the UK exists (LPR 2006) which show the EF of the UK to be 5.6gha/capita, these figures have not been used as they are not comparable with the UK London data and no compositional breakdown exists dividing the UK data into consumption categories.REAP (SEI, 2007)
In 2050 it is estimated that there may be 9 billion people on the planet. If everyone is to have a fair share of the planets resources then we will each have 1.44 hectares available to provide us with all our resources and absorb our carbon emissions if we are to live within the means of the planet. To understand how each of the ecological footprint components can be reduced to achieve one planet living in 2050, it was necessary to understand the proportion of the impact that was resulting from carbon emissions. This varies signifi cantly between different footprint components. For example only 22% of the impact of food consumption is generated through carbon emissions whereas for transport carbon emissions generate 85% of the impact. It was then assumed that for all carbon emissions a reduction of 80% will be achieved. It was then assumed that to achieve a reduction to the required 1.44gha a combination of increased effi ciency in resource use and an overall reduction in consumption would be required. Reductions were assumed to be proportional across all sectors.
Authority Transport Housing Food Consumerables Private Services
Public Services
Capital Investment
Total(GHA)
2007 UK Ecological Footprint
0.91 1.47 1.23 0.75 0.57 0.37 0.24 5.45
2001 London EcologicalFootprint
0.716 1.519 1.302 0.773 0.571 0.370 0.239 5.48
2050 London Ecological Footprint
0.14 0.36 0.45 0.21 0.15 0.09 0.06 1.44

THE BRUNEL LECTURE 2008: By Peter HEAD OBE FREng FRSA46
London Ecological Footprint 2001
London Ecological Footprint 2050
City living has a slightly higher footprint caused by higher resource consumption and food footprints, but are offset by lower transport energy because of public transport use. With a target of 1.44gha per person in 2050, the reduction in footprint needed is around 74% for London. This is similar to the reduction in carbon emissions target of 80%.
The UK footprint is currently rising at about 1.17% per annum.106 Particular drivers for this increase are transport energy for rising global travel, and food and consumables with increasingly mechanised, global and resource hungry supply chains. Economic pressures caused by infl ation in energy and materials prices are bound to cool this growth without intervention, but nevertheless the upward trajectory has got to be turned downwards quickly or the 74% reduction needed will be even higher.
106 World Wildlife Fund, Living Planet Report sourced from http://assets.panda.org/downloads/living_planet_report.pdf (2006). It states that the UK EF has increased by 33% between 1975 and 2003.
24%
28%13%
14%
10%
7%4%
Food
HousingTransport
Consumables
Privateservices
Publicservices
Capitalinvestment
20501.44
GHA/Capita
10%
25%
22%
14%
13%
6%10%
Transport
Housing
Food
Consumables
Privateservices
Publicservices
Capitalinvestment
20015.48
GHA/Capita

47ENTERING THE ECOLOGICAL AGE: The Engineers Role
7. THE LOW AND MIDDLE INCOME COUNTRIES’ CHALLENGE- CHINA
China’s current ecological footprint is 1.6 gha/person, close to the global earth share.107 However, it is rising by quickly with a growing and wealthier population. Shanghai already has a footprint of 4.7 gha/capita. 108 However, increasing levels of car ownership levels and urbanisation is fuelling the pressure on resources. This is why China has recognised that this path is unsustainable and a new paradigm of urban development is needed coupled with the development of a closed loop economy in which resources are recycled and reused much more. Already the price increases of food and oil are creating a serious infl ationary pressure on the economy and the costs of environmental management are conservatively estimated at 8-13% of total GDP.109
Shanghai Ecological Footprint 2002
107 Word Wildlife Fund, Living Planet Report 2006, http://assets.panda.org/downloads/living_planet_report.pdf
108 SEI and Arup Eco footprint research
109 The Economist, A large black cloud, (21 March 2008).
Authority Food Infrastructure Mobility Consumerables and Waste
Private Services
Public Services
Energy Consumption
Government Other Total(GHA)
Current Shanghai Ecological Footprint
0.950 0.531 0.114 0.357 0.690 0.396 0.343 0.739 0.546 4.67
2050 Shanghai Ecological Footprint
0.4464 0.1584 0.144 0.1152 0.1728 0.1152 0.0432 0.216 0.1584 1.44
Plans for Dongtan Eco-city in Shanghai have shown that there are ways that urbanisation could be taken onto a trajectory which would enable people to move to urban areas and live a modern lifestyle of 2.6 gha/person footprint. Further reductions can occur in a similar fashion London to achieve 1.44 gha/capita. 110 Overall, combined with improvements to existing urban centres which are outlined elsewhere, this would enable China as a whole to move close to the global earth share fi gure by 2050.
Shanghai Ecological Footprint 2050
110 All consumption in China was assumed to have the same impact as commodities produced in China therefore discounting any reduction in impact that may have been generated through purchasing imported goods that will have been produced in factories supplied by electricity not generated by coal fired power stations (as is the case in China). We have therefore reduced the results accordingly.
21%
8%
2%
21%
8%
16%
12%
7%
15%
Food
Consumables
Mobility
Infrastructure
Privateservices
Government
Other
Energy
Publicservices
20024.67
GHA/Capita
31%15%
8%1%
11%
11%
8%
3%
12%
Food
Consumables
Mobility
Infrastructure
Other
Privateservices
Government
Energy
Publicservices
20501.44
GHA/Capita

THE BRUNEL LECTURE 2008: By Peter HEAD OBE FREng FRSA48

49ENTERING THE ECOLOGICAL AGE: The Engineers Role
8. STRATEGIES AND TECHNOLOGIES FOR ENTERING AN ECOLOGICAL AGE
Sustainability in Practice 111
Biomimicry Principles: Use waste as a resource, use materials sparingly and do not draw down resources
We are now beginning to get a good understanding of the anthropogenic cycles of the major non-renewable resource fl ows in the world through detailed research.112 As time goes by, this information will inform substantial opportunities for re-use and recycling. Today’s technologies depend on utilising a very broad spectrum of resources, and it will require at least as much excellent engineering to recover and re-employ these resources after use as it took to put them into specialized uses in the fi rst place.
The approach now needed across all manufacturing industry is to reduce primary non-renewable resource
111 Hillier, Graham. “Construction Products for a Sustainable Society”Sustainability - Steel and the Environment Conference. 2 November 2004
112 Graedel, T.E., et al., Multilevel cycle of anthropogenic copper, Environmental Science & Technology, 38, 1242-1252, (2004)B. Reck, et al. Anthropogenic nickel cycle: Insights into use, trade, and recycling, Environmental Science & Technology, 42, 3394-3400, (2008).
consumption, reuse as much of existing resources in their current form and if this is not possible then either remanufacture back into a new generation product or recycle the resource back into useable feedstock. In low and middle income countries, which own a good deal of the available resources left, there is a great opportunity to develop completely new products and materials that do not mimic industrial age systems using a part of the growing inward resource purchase monetary fl ows to invest in R&D. For example the technology exists for making high quality commercially competitive fi re retardant building walls from wheat and rice straw and for using sheep wool as building insulation.
All products need to be designed for an extended life cycle in which they can be re-used through demand side exchange and eventually remanufactured through supply side ecological clusters. Packaging will also need to be addressed with increased use of returnable packages which can be reused, recycled, or composted.
Raw Material
Recycle
Flexible & Adaptable Design
Componemt
Recondition
System
Re-use
Building
Refurbish
End of Life
End of Life

THE BRUNEL LECTURE 2008: By Peter HEAD OBE FREng FRSA50
Materials and Waste 113
Mechanisms such as deposit return, product take-back, eco-labelling and direct regulation of high impact product like batteries can help create the transition. The WEEE Directive114 and the End of Life Vehicles Directive115 are two European legal drivers for this approach. However, there are direct commercial models in other industries which have a proven track record, such as Xerox’s program of converting end-of-life equipment into new products and parts.116
In the UK we import 70% of the pulp and paper we consume.117 97% of graphics paper for magazines and other high quality uses is imported and needs over 1 million hectares of forest around the world to supply it.118 The Bioregional sustainable local paper cycle focuses on the recycling of offi ce paper with upgrading using 20% virgin fi bre from locally produced wood or other biocrops. It is estimated that the ecological footprint of locally recycled paper is 86% lower than the imported paper and there are enough sources of wood and other suitable fi bres in the UK to support this approach.119
113 Arup, Drivers of Change: Waste, http://www.zerowaste.org/case.htm, (2008).
114 Environment Agency, Waste, Electrical and Electronic Equipment, http://www.environment-agency.gov.uk/business/1745440/444663/1106248/, (2007).
115 European Environment Commission, Waste: End of Life Vehicles, http://ec.europa.eu/environment/waste/elv_index.htm, (2008).
116 Linstead, C. and C. Gervais, and P. Elkins, Mass Balance: An Essential Tool for Understanding Resource Flows, London: Forum for the Future, (2007).
117 Environment Agency, landfill and waste regulation studies, sourced from: http://www.environment-agency.gov.uk/subjects/waste/?lang.
118 Environment Agency, landfill and waste regulation studies, sourced from: http://www.environment-agency.gov.uk/subjects/waste/?lang.
119 BioRegional Solutions for Sustainability, Local Paper for London, http://www.bioregional.com/programme_projects/pap_fibres_prog/lp4london/lpaper_facts.htm, 2008.
Rethink, Redesign, Reduce, Repair, Waste Prevention
Compost Recovery
Recovered Materials & Energy
Manufacture
Raw Materials
Use End of Life
Reuse Recycle

51ENTERING THE ECOLOGICAL AGE: The Engineers Role
This leads to the concept in high income countries of mining metals and other minerals from existing products and infrastructure which would in turn lead to a dramatic reduction in ecological footprint and primary resource consumption. There would also be a reduction in mining and transport of primary raw materials. It has been estimated that overall consumption of primary materials in the UK could be drastically reduced by following these principles.124
In 2050 all products will need to come from 80-100% sustainable sourcing, with regulated accreditation and eco-labelling to show environmental impacts over the product lifecycle.125
Manufacturers need to be clustered using industrial symbiosis principles together with integrated supply chain management. This combined with the sustainable design of products to increase their lifespan and demand side management to decrease overall consumption can lead to a 75% overall reduction in the ecological footprint of products in the UK.126
124 Word Wildlife Fund, One Planet Wales, (2007).
125 Word Wildlife Fund, One Planet Wales, (2007).
126 Word Wildlife Fund, One Planet Wales, (2007).
Lifecycle of Paper 120
Metals recycling is a £4.5billion UK industry, with the UK representing one of the fi ve largest metal scrap exporting countries in the world. The industry employs over 8,000 people and makes a net contribution to UK balance of trade. 121 Aside from the economic benefi ts, the environmental ones are extraordinary. Out of the 13.9 million tonnes of steel made in the UK in 2006, 4.8 million was with recycled metal.122 Using recycled steel to make new steel enables reductions such as:
200 million tonnes CO• 2 emission reduction every year.
86% in air pollution•
40% in water use•
76% in water pollution•
15 million tonnes pa of landfill reduction• 123
120 BioRegional Solutions for Sustainability, Local Paper for London, http://www.bioregional.com/programme_projects/pap_fibres_prog/lp4london/lpaper_facts.htm, 2008.
121 British Metal Recycling Agency (BMRA), What is Metals Recycling, http://www.recyclemetals.org/whatis.php, (2008).
122 British Metal Recycling Agency (BMRA), What is Metals Recycling, http://www.recyclemetals.org/whatis.php, (2008).
123 British Metal Recycling Agency (BMRA), What is Metals Recycling, http://www.recyclemetals.org/whatis.php, (2008).
Paper Merchant
Paper Mill
Paper Collector
Local Virgin Pulp
Landfill
Compost
Energy FromWaste
Office Paper Use WithReduced Consumption
Farm
Local ResourcesE.g. Straw/Hemp/Wood
De-linking Pulp Mill
Mini Pulp Mill

THE BRUNEL LECTURE 2008: By Peter HEAD OBE FREng FRSA52
Biomimicry Principle: Diversify and cooperate
Land use planning of towns and cities needs to be reconsidered and regional spatial strategies and local development frameworks in 2050 should be focussed particularly on low carbon living, within the environmental limits of the planet.
This means moving away from the single use, land use model towards greater mix of uses so that people can live, work, learn and play in much closer proximity. Also having higher density of land use in urban areas, particularly around public transport interchanges and having a much larger range of different transport modes. Moving away from car dependency for trips inside urban centres will reduce energy consumption and increase quality of life. Orbital public transport routes in outer suburbs can be introduced to create new interchanges with the radial routes and these locations can have higher density mixed use development as well.
This approach will encourage walking and cycling locally. Increasing mixed use density in existing towns and cities, rather than low density sprawl spreading out into the countryside, will allow energy effi cient and renewable energy powered public transport systems like guided buses and trams to be viable, particularly when they interconnect new and existing rail routes.
When this is combined with low particulate emissions from vehicles, health problems that have affected high income country citizens can be reduced and avoided and economic benefi ts will accrue from lower health costs.
Local utility systems for energy, water and waste management should be integrated to allow cooperation, shared land use and shared resources. Retrofi tting of new sustainable systems need to follow this model too. Typical examples are energy from waste anaerobic digestion plants for both municipal waste and sludge from sewage treatment
Diversity of cultures, ages and family groups in local accommodation can greatly assist human development through mutual support systems which are ‘bartered’ within communities. All of these points to high quality urban design for compact mixed use which includes access to education, leisure and parks as well as work to help human development.
All of these concepts can also be designed into urban retrofi t programmes in high and middle income countries, and can be a major contributor to lowering ecological footprint.
Biomimicry Principle: Gathering and using energy effi ciently
GENERAL
There are substantial opportunities for development with low ecological footprint by controlling demand through systems and appliance effi ciency and managing the supply mix for infrastructure between centralised and decentralised supply. In particular a transition on the supply side is recommended from dependence on fossil fuels to the use of renewable energy.
For low and middle income countries, the rapid uptake of the use of micro-fi nance to install photovoltaic panels, local energy from waste facilities and solar powered irrigation pumps shows that, at current oil prices, the use of local renewable sources of energy is much more attractive for human development in remote inaccessible areas than expensive centralised power supply. There is no reason to suppose that this trend will not extend into transport once economic electric vehicles are available, and can already be seen in the use of electric bicycles. In this we can see a new ecological age model emerging.
In all cases where renewable energy from sun, wind, wave and tidal stream is gathered there will be a need to invest in energy storage infrastructure such as batteries or pumped water and this is less developed. One opportunity is to convert and store energy in a carrier like hydrogen but this is a relatively ineffi cient process as yet.
In high income countries, a progressive investment transition to 2050 is needed, combined with an early investment in carbon capture technologies to accelerate carbon emissions reduction. It is recognised that demand for energy dependent goods and services will continue to rise with economic development but that effi ciency gains in supply, usage, infrastructure and equipment can give rise to a paradigm shift in overall energy demand. Sources used for these conclusions for high income countries are the London Climate Change Action Plan127 and University of Oxford’s Environmental Change Institute ’s low carbon home strategy.128 All assume a major infrastructure retrofi t programme for all existing buildings and infrastructure in line with the London Plan.
127 Greater London Authority, Action Today to Protect Tomorrow: Mayor’s Climate Change Action Plan, http://www.london.gov.uk/mayor/environment/climate-change/docs/ccap_fullreport.pdf, (February 2006).
128 Boardman, Brenda, Home Truths: A Low Carbon Strategy to Reduce UK Housing Emissions by 80% by 2050, University of Oxford’s Environmental Change Institute, http://www.foe.co.uk/resource/reports/home_truths_summary.pdfCo-o, (November 2007).
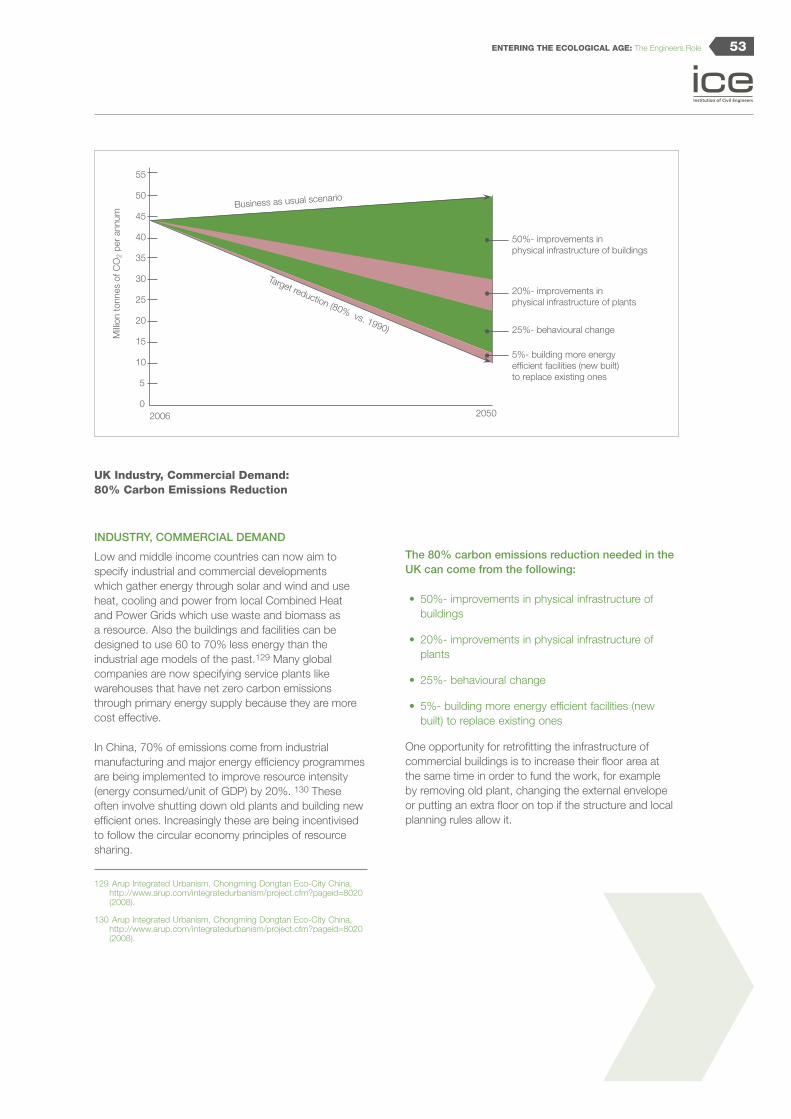
53ENTERING THE ECOLOGICAL AGE: The Engineers Role
UK Industry, Commercial Demand: 80% Carbon Emissions Reduction
INDUSTRY, COMMERCIAL DEMAND
Low and middle income countries can now aim to specify industrial and commercial developments which gather energy through solar and wind and use heat, cooling and power from local Combined Heat and Power Grids which use waste and biomass as a resource. Also the buildings and facilities can be designed to use 60 to 70% less energy than the industrial age models of the past.129 Many global companies are now specifying service plants like warehouses that have net zero carbon emissions through primary energy supply because they are more cost effective.
In China, 70% of emissions come from industrial manufacturing and major energy effi ciency programmes are being implemented to improve resource intensity (energy consumed/unit of GDP) by 20%. 130 These often involve shutting down old plants and building new effi cient ones. Increasingly these are being incentivised to follow the circular economy principles of resource sharing.
129 Arup Integrated Urbanism, Chongming Dongtan Eco-City China, http://www.arup.com/integratedurbanism/project.cfm?pageid=8020 (2008).
130 Arup Integrated Urbanism, Chongming Dongtan Eco-City China, http://www.arup.com/integratedurbanism/project.cfm?pageid=8020 (2008).
The 80% carbon emissions reduction needed in the UK can come from the following:
50%- improvements in physical infrastructure of • buildings
20%- improvements in physical infrastructure of • plants
25%- behavioural change•
5%- building more energy efficient facilities (new • built) to replace existing ones
One opportunity for retrofi tting the infrastructure of commercial buildings is to increase their fl oor area at the same time in order to fund the work, for example by removing old plant, changing the external envelope or putting an extra fl oor on top if the structure and local planning rules allow it.
Milli
on to
nnes
of C
O2
per
annu
m
55
50
45
40
35
30
25
20
15
10
5
02006 2050
50%- improvements in physical infrastructure of buildings
20%- improvements in physical infrastructure of plants
25%- behavioural change
5%- building more energy efficient facilities (new built) to replace existing ones
Business as usual scenario
Target reduction (80% vs. 1990)

THE BRUNEL LECTURE 2008: By Peter HEAD OBE FREng FRSA54
UK Household Demand: 80% Carbon Emissions Reduction
HOUSEHOLD DEMAND
We are now crossing the threshold in terms of available technology for local power collection and generation and oil price levels that make it attractive for low and middle income countries without subsidised power grids to have housing infrastructure that generates rather than consumes energy. The only missing component is the ability to store energy as a back up cheaply within the community but this is likely to be solved soon with battery developments. Energy from waste facilities and small plants using secondary biomass will also be part of this infrastructure.
Energy Savings From Appliance Standards 131
131 Design to Win: Philanthropy’s role in the fight against Climate Change,California Environmental Associates (August 2007).
80% carbon emissions reduction in the UK can come from the following:
50%: combination of improving thermal efficiency of • household stock
20%: behaviour change•
25%: energy efficient lighting and appliances•
5%: zero carbon new builds starting in 2016•
In China where there is a power grid, the energy feed-in legislation makes it attractive now to install local CHP, PV, and energy from waste and large scale wind power in large residential developments. These houses can be designed to reduce demand and will be able to be built at attractive prices once economies of scale kick in. Chinese appliance standards will cut the nation’s residential demand for electricity by 10% and obviate the need to build 36 large (1,000 MW) coal fi red power plants.132
132 China White Paper on Energy: China Energy Conditions and Policies, (2007) sourced from http://www.10thnpc.org.cn/english/environment/236955.htm#0.
55
50
45
40
35
30
25
20
15
10
5
02006 2050
Milli
on to
nnes
of C
O2
per
annu
m
50%- combination of improving thermal efficiency of household stock
20%- behaviour change
25%- energy efficient lighting and appliances5%- zero carbon new builds starting in 2016
Business as usual scenario
Target reduction (80% vs. 1990)
Foss
il Fu
el E
mis
sion
s (G
tC/y
)
2005 2010 2020
140
120
100
80
60
40
20
0
Refridgerators
Source: Energy Foundation
Lamps Air Conditioners
TVs Washing Machines

55ENTERING THE ECOLOGICAL AGE: The Engineers Role
Living Room Study
Bedroom
Light coloured roof materials and insulation
Louvered vent
Winter blinds
Seasonal shading to north wall galzing
Pergola
Courtyard
Winter sun 34 o
19 July - 26 May
Sum
mer sun 65 o
17 October - 26 February
Summer cooling breezes
Decidious planting Maximum glazing to north walls Thermal mass flooring Screen planting against winter winds
Houses designed to minimizeovershaddowing
oom
Ventilation
Green Homes 133
Improving existing housing stock is a huge challenge in high income countries because of scattered ownership and varying quality and can only really be tackled quickly through regional programmes of street by street retrofi t where many other infrastructure issues such as energy, water management, communications, accessibility and green space are dealt with at the same time. This will then bring economies of scale to individual homes. Work has shown that improvements such as insulation, effi cient water heating and use of energy effi cient appliance and lighting can reap rapid cost benefi ts to most householders. Other supply side improvements need to optimise local resources and existing supply effi ciency and will vary from place to place.
133 World Business Council for Sustainable Development, Policy Directions to 2050, http://www.wbcsd.org/DocRoot/bdA09BFxjVkjEeXJKjle/int_low_res.pdf, (2007).

THE BRUNEL LECTURE 2008: By Peter HEAD OBE FREng FRSA56
Public transport investment, aided by increases in urban density, in rail, metro, bus and tram and better information systems will enable more journeys to be taken by effi cient public transport. Relatively low cost bus systems in dedicated lanes have been very successful in places like Curitiba.137 Selected road closures will provide more direct walking and cycling access to work, schools, shops and public services.
Gathering and Using Energy Effi ciently 138
137 Modes for Rapid Transport, Race, Poverty & the Environment; Curitiba’s Bus System, sourced from http://www.urbanhabitat.org/node/344 (2007).
138 World Business Council for Sustainable Development, Facts and Trends to 2050: Energy and Climate Change, http://www.wbcsd.org/DocRoot/FjSOTYajhk3cIRxCbijT/Basic-Facts-Trends-2050.pdf, (2004).
Transportation Activity by Region 136
136 Design to Win: Philanthropy’s role in the fight against Climate Change,California Environmental Associates (August 2007).
TRANSPORT-GROUND BASED IN TOWNS AND CITIES
A substantial reduction in petrol and diesel use in private vehicles in urban areas will be a key driver of change, partly incentivised by the health benefi ts of improved air quality. Battery and hydrogen fuel cell powered vehicles for private, public and goods delivery use will be part of the mix with hydrogen sourced from natural gas or other sources.
134
Car clubs will enable people to hire vehicles when they need them and many of vehicles will become low or zero emissions vehicles. Car club use is growing quickly in many cities like London. Research has shown that users drive 64% less distance after joining a club and that each club vehicle replaces, on average, 20 privately owned cars.135 Use of consolidation centres around the city perimeter for goods delivery will also improve delivery and energy effi ciency.
134 © Daisuke Tofuku in Drivers of Change: Urbanisation, Arup (2008).
135 Transport for London information on motor vehicle usage and ownership, http://www.tfl.gov.uk/tfl/search/?keywords=car%20drivers%20research&direction=next&filter=1&restrict=&lastResult=10, accessed (2008).
2500
2000
1500
1000
500
0 2000 2010 2020 2030 2040 2050
Total vehicles, millions
Total alternative
vehicles
Total traditional
vehicles
Annual total vehicle growth of 2% per year.Annual vehicle production growth of 2% per year.Large scale alternative vehicle manufacture starts in 2010 with 200,000 units per year and grows at 20% per year thereafter.
80
70
60
50
40
30
20
10
0
2000 2010 2020 2030 2040 2050
TotalAfricaLatin AmericaMiddle EastIndiaOther AsiaChinaEastern EuropeFormer Soviet UnionOECD PacificOECD EuropeOECD North America
Passenger - K
ilometers P
er Year (Trillions)

57ENTERING THE ECOLOGICAL AGE: The Engineers Role
Energy consumed in goods distribution in urban areas can be minimised by the use of consolidation centres around the city perimeter which are accessed by intercity rail and road links. Distribution from these centres can be made using a fl eet of zero emissions vehicles on an organised basis to minimise travel distances and congestion. Studies have shown energy reductions of 70% compared with current high income country city models.140 Delivery reliability can also be improved.
TRANSPORT –GROUND BASED BETWEEN TOWNS AND CITIES
The energy effi ciency of inter-city travel is likely to be achieved through a combination of investment in a high speed rail passenger network (eventually running on renewable energy), using bus and car share priority on motorways, improved information and traffi c management systems and improved vehicle and fuel technology. In Europe now we have a viable high speed rail network we understand that rail is a more attractive option where available than regional air travel for distances up to 600km.When high speed rail was introduced rail user numbers doubled and on some routes such as the 300 km Paris-Brussels route air travel dropped to a negligible level. This experience has also been confi rmed in Japan. High speed railway investment needs to include the capacity for rail freight movement with links built directly to city edge consolidation centres. This is the area of ecological footprint reduction that will be diffi cult until renewable fuel supply powered road vehicles are available at competitive prices for long distance passenger and freight use. However this may be the case by 2050.
140 Arup Integrated Urbanism, Chongming Dongtan Eco-City China, http://www.arup.com/integratedurbanism/project.cfm?pageid=8020 (2008).
Average Fuel Effi ciency and Occupancy by Mode in 32 Cities, 1990
Mode Average Fuel Effi ciencyMegajoules per passenger-kilometer
Measured Average Vehicle Occupancy Number of Occupants
Car 2.91 1.52
Bus 1.56 13.83
Heavy Rail (Electric)
0.44 30.96
Heavy Rail (Diesel)
0.44 27.97
Light Rail/Tram
0.79 29.73
Average Fuel Effi ciency and Occupancy by Mode in 32 Cities, 1990 139
The above table shows the fuel/energy effi ciency for different modes of transport with average occupancy rates, and it shows that urban electric metro systems are seven times more energy effi cient than the average car with 1.5 occupants.
The buses in Curitiba are equally good and they could all run on renewable energy fuel sources in the future.
This combination would enable ecological footprint to be at appropriate levels but would require substantial changes to existing city transport infrastructure in high income countries including roads and vehicle fuelling systems. This is a very big challenge in the United States where car dependency and transport energy are so high with very spread out suburban development. Los Angeles is trialling the replacement of low density single use city blocks with high density mixed use and this is proving commercially successful. Removing major freeway infrastructure from urban areas would free up valuable development land, remove the huge maintenance cost burden and provide the funding source for public transport. The City of Vancouver demonstrates how well a city works with no freeways. It comes high up the list of the most liveable cities in the world and has relatively low carbon emissions. Higher density developments are now being built to a high quality in the city centre rather than extending the suburbs.
139 Newman, Peter and Jeff Kenworthy, Greening Urban Transportation: State of the World 2007, Worldwatch Institute (Eds.) New York, W.W. Norton & Company, (2007).

THE BRUNEL LECTURE 2008: By Peter HEAD OBE FREng FRSA58
AIR TRAVEL
Growth in air travel from UK airports is still accelerating because of the demand for leisure fl ights has increased. If this level of usage continues, without any technology changes, then emissions from air travel will become the single biggest source of greenhouse gas emissions by 2050.141
This is the most challenging ecological footprint reduction issue of all. Construction of a comprehensive Europe high speed rail network connected to all UK regions and airports like Heathrow and Charles De Gaulle will be important, as discussed above, as will fi nding a renewable source of aircraft fuel by 2050.
The lesson from this is that in low and middle income countries any new airports should be focussed on international/ regional travel over approximately 600 km and they should be located on high speed rail routes and connected into local urban areas with mass transit systems. Also high speed rail investment should have equal priority with roads. The major challenge in USA is to follow these principles and consider putting in place a high speed rail network that serves urban centres within 600km of each other and passes through the airports.
141 Hickman, Martin, Cheap Flights threaten UK target for carbon emissions, The Independent, http://www.independent.co.uk/environment/cheap-flights-threaten-uk-targets-for-carbon-emissions-524879.html, (28 January 2006).
POWER AND ENERGY SUPPLY
The priority for low and middle income countries will be to use their own fossil fuels, uranium and natural renewable resources as the primary source of energy. The introduction of carbon capture and recycling technologies outlined later will enable this to be done, particularly with coal, without increasing carbon emissions if the recommendations of this paper are followed. The priority then moves to effi cient distribution of these resources using a combination of local grids of heat and power, national grids of power supply and the moving around of energy storage carriers like hydrogen. We now know that effi ciency can be improved dramatically in all aspects of this system and that low ecological footprint targets are realistic.
142
Many renewable power sources are now available at attractive prices compared with local fossil fuels where grids are not in place. Solar power gathered in desert regions can provide a major sustainable power source in many countries as demonstrated by recent projects in Spain and Arizona and these may justify investment in their own distribution grid. A single contract for a 900MW of solar thermal generation from 4 plants has recently been signed by PG&E in California in the US.143The US is endowed with a vast solar resource with 250,000 square miles of land in the southwest alone. It is estimated that installation of solar power plants over an area of just 46.000 square miles, combined with wind, biomass and geothermal power, would end US dependence on foreign oil imports with an investment of $400 billion.144 This would also slash greenhouse gas emissions.
142 Source: Shot in the Dark
143 TMC Net, eSolar and Southern California Edison to Produce 245MW of Solar Power, http://callcenterinfo.tmcnet.com/news/2008/06/03/3477818.htm, (3 June 2008).
144 Zweibel, Ken; and James Mason; and Vasilis Fthenakis, A Solar Grand Plan, Scientific American, (16 December 2007).

59ENTERING THE ECOLOGICAL AGE: The Engineers Role
Where fossil fuel and nuclear powered grids are in place we will see an increasing transition to combining central power generation with local heat and power grids, powered by locally available fuels, and gradual substitution of renewables for fossil fuels. The speed of the transition will be infl uenced by national and regional policies. This can be illustrated by the UK.
Supply for infrastructure in the UK comes from the power grid which uses the following mix: 145
38% gas•
35% oil•
16% coal•
9% nuclear•
2% renewables•
Heating comes mainly from gas.•
The UK Energy Bill envisages a transition to 20% renewables by 2020 with a large proportion coming from offshore wind, the replacement of the nuclear power stations and a transition to clean coal power use. UK self suffi ciency in oil and gas is at an end so energy supply security is also a major issue.
It is likely that nuclear power will be maintained to supply at least the current share of power supply as long as fuel is available at an economic price.
145 UK Energy Research Centre: Energy Infrastructure and Supply, sourced from, http://www.ukerc.ac.uk/ResearchProgrammes/EnergyInfrastructureandSupply/EnergyInfrastructureAndSupply.aspx.
Centralised power generation and distribution is ineffi cient with only 10% of power generated actually delivered to users. A programme of improving the effi ciency of power stations is underway combined with the introduction of decentralised heat and power facilities into towns and cities. These can take the form of combined heat and power plants running on gas, waste materials and biomass from local sources, combined with the use of ground source heat pumps. It is estimated that 50% of the reduction in emissions from energy supply could come from these sources in urban areas.146
Beyond 2020 and up to 2050 it is possible that oil and gas supplies will be running short and prices will rise substantially. Therefore UK is looking beyond these sources for a sustainable future supply of fuel for main heat and power.
146 Greater London Authority, Action Today to Protect Tomorrow: Mayor’s Climate Change Action Plan, http://www.london.gov.uk/mayor/environment/climate-change/docs/ccap_fullreport.pdf, (February 2007).
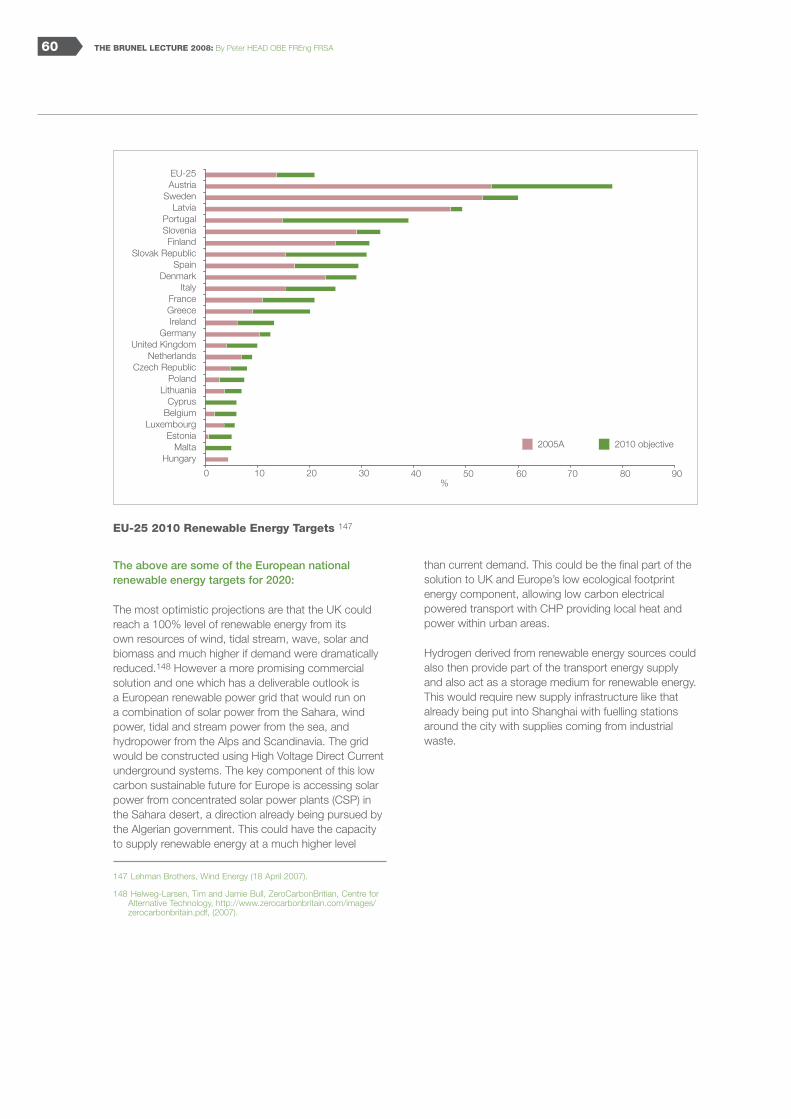
THE BRUNEL LECTURE 2008: By Peter HEAD OBE FREng FRSA60
EU-25 2010 Renewable Energy Targets 147
The above are some of the European national renewable energy targets for 2020:
The most optimistic projections are that the UK could reach a 100% level of renewable energy from its own resources of wind, tidal stream, wave, solar and biomass and much higher if demand were dramatically reduced.148 However a more promising commercial solution and one which has a deliverable outlook is a European renewable power grid that would run on a combination of solar power from the Sahara, wind power, tidal and stream power from the sea, and hydropower from the Alps and Scandinavia. The grid would be constructed using High Voltage Direct Current underground systems. The key component of this low carbon sustainable future for Europe is accessing solar power from concentrated solar power plants (CSP) in the Sahara desert, a direction already being pursued by the Algerian government. This could have the capacity to supply renewable energy at a much higher level
147 Lehman Brothers, Wind Energy (18 April 2007).
148 Helweg-Larsen, Tim and Jamie Bull, ZeroCarbonBritian, Centre for Alternative Technology, http://www.zerocarbonbritain.com/images/zerocarbonbritain.pdf, (2007).
than current demand. This could be the fi nal part of the solution to UK and Europe’s low ecological footprint energy component, allowing low carbon electrical powered transport with CHP providing local heat and power within urban areas.
Hydrogen derived from renewable energy sources could also then provide part of the transport energy supply and also act as a storage medium for renewable energy. This would require new supply infrastructure like that already being put into Shanghai with fuelling stations around the city with supplies coming from industrial waste.
Hungary
2005A 2010 objective
0 10 20 30 40 50 60 70 80 90
MaltaEstonia
LuxembourgBelgiumCyprus
LithuaniaPoland
Czech RepublicNetherlands
United KingdomGermany
IrelandGreeceFrance
ItalyDenmark
SpainSlovak Republic
FinlandSloveniaPortugal
LatviaSweden
AustriaEU-25
%

61ENTERING THE ECOLOGICAL AGE: The Engineers Role
Biomimicry Principles: Optimise not Maximise and run on information
Many of the strategies and technologies presented in this section result from an integrated analysis of the complex systems we depend on. In general, the current suite of personal incentives is geared to maximise consumption of resources rather than use the minimum to give the desired outcome.
An early and quick win to accelerate ecological footprint reduction is the provision of information to customers in a form that enables them to optimise their daily lives to be as comfortable while maintaining a lower ecological footprint.
It seems likely in low and middle income countries that the installation of a high bandwidth communication network may be one of the most powerful ways of driving rapid sustainable development. The whole system could be powered by solar energy including the handsets of the users.
The technology exists to do this and yet very few local services exist and this is where major investment is now needed. For example optimised real time journey planning for public transport in which someone could ask to go to a point in a city within a given time and be given a plan based on where buses and trains would be in real time would transform safety and ease of public transport use. Operators would have the advantage of having passengers guided around breakdown points and feedback would enable service interchange to be improved. Information would be available over hand held devices and at kiosks within all service locations.
There is evidence that feedback on energy and water use that compares a consumer’s behaviour with the surrounding region, or simply displays metered usage is another good way to achieve behavioural change.
Another example is accreditation and eco-labelling of products to enable customers to make rapid decisions about the quality and impact of them on their footprint. Local service intranets would enable people to fi nd goods and services locally and this likely to accelerate human development at much lower cost.
Feedback and interactions between companies is another important area particularly for resource sharing. Waste exchange systems are growing rapidly worldwide where waste in one company is sourced by another.
Wide bandwidth information systems infrastructure is therefore essential for a low ecological footprint future.
Biomimicry Principle: Clean up not pollute
There is a virtuous cycle between using waste as a resource and not polluting the air, water and soil. The ecological economics approach shows that the depletion of eco-system services due to pollution is a major economic threat and is tipping us into an uneconomic model of development. European Legislation has been effective in driving change in this respect but the one area that is lagging behind is in the recycling of sewage and waste water which still pollutes water in the UK. Waste can be digested in anaerobic digesters to provide energy and useful compost can be produced, as long as secondary processing is used to treat metal contamination and to kill pathogens.
Low and middle income countries who are building systems for the fi rst time- separating toilets should be used which enable solid waste to be taken in vacuum tubes for anaerobic digestion and liquid waste goes for treatment and nutrient extraction. In this way treatment costs and water management costs can be greatly reduced. Storm water should not be mixed with black waste because this makes handling of increased storm water run-off from climate change diffi cult to handle without pollution releases.
Water can be recycled locally for irrigation and secondary uses. Assuming it is produced to be safe, the compost could also reduce the amount of fertilisers needed for food production. This is a key area for infrastructure investment for all countries.
Fitting water capture and grey water recycling systems into homes can save 30% of household potable water consumption149 reduce storm run-off and reduce energy consumption so this is another virtuous cycle. Hard paved areas can be made porous to help refi ll aquifers and to slow down run-off.
149 Arup Integrated Urbanism, Chongming Dongtan Eco-City China, http://www.arup.com/integratedurbanism/project.cfm?pageid=8020 (2008).

THE BRUNEL LECTURE 2008: By Peter HEAD OBE FREng FRSA62
Future Water Home
Clean Up Not Pollute 150
150 Department for Environment, Food and Foreign Affairs, Future Water; The Governments Strategy for water in England, sourced from http://www.defra.gov.uk/environment/water/strategy/pdf/future-water.pdf.
350
300
250
200
150
100
50
0
per
capi
ta c
onsu
mpt
ion
(pcc
)
Rom
ania
Spa
in
Ir ela
nd Italy
Sw
eede
n
Por
tuga
l
Hun
gary
Finl
and
Fran
ce UK
Luxe
mbo
urg
Slo
veni
a
Ger
man
y
Aus
tria
Den
mar
k
Pol
and
Net
herla
nds
Bul
garia
Slo
vaki
a
Bel
gium
Cze
ch R
epub
lic
Source: Waterwise data, 2006

63ENTERING THE ECOLOGICAL AGE: The Engineers Role
Key Elements of a Short Carbon Cycle System
Biomimicry Principle: Remain in balance with the biosphere
The one issue that the above does not deal with is the reduction of carbon emissions at coal power stations over the period until they are phased out by the introduction of the full renewable energy grid. Two proven technologies can help with this transition: Shortened Integrated Carbon Cycle (SICC) and Rapid Algal or Plant Growth.
SHORTENED INTEGRATED CARBON CYCLE (SICC)
Carbon capture and storage is one option which is being developed with underground storage the preferred option. However fi nding the storage on the scale needed is diffi cult. A more sustainable option which is still in the early stages of development is to close the carbon cycle in a Shortened Integrated Carbon Cycle (SICC). This could provide a soft transition over a longer time period of fossil fuel use before we need to live entirely on current energy sources derived from day to day supplies from the sun and so some more detailed description is given, based on research commissioned by Arup.
Carbon dioxide is cleaned and separated from the fl ue gas and passed through a collection of bio-reactors in which light, nutrients and seawater allow different algae types to grow quickly and absorb the carbon, releasing oxygen and in some cases hydrogen. Small pilot plants have been created to demonstrate the viability. The fi rst installation was on MIT’s 20-megawatt cogeneration plant.151 On top of the plant are thirty three-meter-high triangles of clear pipe containing a mixture of algae and water. Bubbling the plant’s fl ue gases through the mixture reduced CO2 emissions by 82% on sunny days and 50% on cloudy days (during daytime) and cut nitrogen oxides by 85% (on a 24-hour basis). Managed algal growth takes place in a photo bioreactor. Current demonstration units have large area or use light pipes to capture enough sunlight to get good algal yields. However light penetration decreases as the algae grow. Theoretical algal densities can be as high as 84g/l, but currently 3g/l to 15g/l is more common because of poor light penetration as algae grow.152 Reactor design is the core to the success of the algal grower. Confi gurations are required to ensure light of the right frequency is economically delivered to create the maximum algal density.
151 Stauffer, Nancy, Algae system transforms greenhouse emissions into green fuel, The MIT Energy Research Council http://web.mit.edu/erc/spotlights/alg-all.html, (2006).
152 Hillier, Graham, Centre for Process Innovation, Sustainability in Practice, http://www.uk-cpi.com/, (2008).
Oils
Food
Pharmaceuticals
Sewage
Power Generation
Fossil Fuel Gas Production�
UnitPlant Grower
Heat Production
Fossil Carbon Light Oxygen
Bio Processing Neutraceuticals
Food Waste
Vehicles
Extraction
Hydrogen
Bio Diesel and Bio Ethanol Waste Land
Anaerobic Digestion Unit
Alkane, Alkene or Alkyne
Brewing & Distillery Waste
Carbon Dioxide
Depleted Plant Matter
Carbon Dioxide and Nutrients
Fertilizer
Methane
Methane
Hydrogen or Methane
Source: Hiller, Graham. CPI / Arup Joint Study 2007.

THE BRUNEL LECTURE 2008: By Peter HEAD OBE FREng FRSA64
CO2
Cement/Steel/refineries
Electricity generation
Gas todomestic supply
Biomass
Coal
Oil
Industrial uses
Mineral carbonation
Natural gas + CO2 capture
Petrochemical plants
+CO2 capture
CO222CO2
CO2 geological Storage
CO2 geological Storage
Ocean storage(ship or pipeline)
Naturac
NNNN
Future H2 use
ture
F
Gas
In fall 2005, the algae system was installed at a 1000-MW power plant in the Southwest US. Initial fi eld trials at the plant were successful, and testing is now moving into a pilot phase. The algae can then be sold and used as a fuel for energy production in anaerobic digesters in local cities, as a pharmaceutical product, for oil production or to produce hydrogen for transport. In carbon capture the gas has to be liquefi ed, transported and pumped into underground storage all of which adds to the cost. In this process the by-product has a value so we believe it has a good possibility of having a good commercial future.
The complete Shortened Integrated Carbon Cycle is based on using coal gasifi cation as the most effi cient process for what is still a plentiful fuel source and then absorbing the carbon dioxide in the bioreactors. We propose the use of process intensifi ers, which are mechanical and chemical units that can increase the available energy within bio residues. Biomass can then be transferred to anaerobic digesters which are well established production units and can take bio wastes and generate energy from them while reducing the solids content
In principle the SICC process can work and absorb the CO2 production of most conurbations. However, there are major technological challenges to be solved. The photobioreactors do not exist on an industrial scale, the bio refi ning and processing technology is only in its infancy and anaerobic digestion is yet to be optimised for gas output and intensity. However, there are indications that these problems can be overcome through concerted development work.
Schematic Diagram of Possible CCS Systems 153
153 Intergovernmental Panel on Climate Change; The Future of Coal: Options for a Carbon-Constrained World (MIT, 2007).

65ENTERING THE ECOLOGICAL AGE: The Engineers Role
Biomimicry Principle: Use local resources
Food production, processing, distribution, retail and catering are key elements in ecological footprint. Consumption of local food is growing rapidly in high income countries like UK and is becoming mainstream. A move towards a sustainable food distribution system to supermarkets based on national networks of regional and local farms dramatically reduces footprint.
In much of the high income world the prolonged use of oil based fertilizers has denuded the soil of essential nutrients and minerals essential to healthy life as well as polluting water courses with nitrates. This usage can be reduced by and carbon dioxide emissions reduced by using organic waste, laden with minerals and carbon, from farming and city sources. This would require substantial investment in the treatment and waste management systems linking urban and rural areas.
Improved water capture and grey water management in urban areas would provide reliable water supplies for irrigating farmland during drought conditions and help to maintain food productivity in climate change induced swings in climate. Water can be stored in lakes in urban parks as has been done in Curitiba and water can be cleaned using natural reed bed systems has been done in Freiburg.
Land in urban areas could also be used for intensive food production. Research is being carried out into food production in buildings in which artifi cial light is used together with hydroponics culture and nutrient recycling form city waste streams to grow green vegetables and fruit. This takes advantage of new LED lighting technologies and plant science and recognises that plants only need a proportion of the white light spectrum to grow healthily. It is likely that by 2050 a proportion of food can be grown commercially by supermarkets within their existing facilities in towns and cities and sold directly to customers with low ecological footprint as long as a supply of renewable energy is available. Control of nutrient supply to plants grown in this way will also enable the mineral balance in the food chain to be improved.
154
Climate change adaptation investment will be needed to manage fl ood risks and their impact on rural food production as well as impact on urban settlements For example the sea level rise fl ood risks and associated back up of land sourced fl ood water in the Fens in the UK will need to be considered with respect to the huge proportion of UK vegetables grown there. These are major issues that need national policies and investment plans City centre food production may be needed just to offset some of these potential losses caused by climate change.
154 Linsley, Benjamin and Ted Caplow, Sustainable Urban Agriculture, Urban Land Green, (Spring 2008). Kiss + Cathcart, Architects
THE BRUNEL LECTURE 2008: By Peter HEAD OBE FREng FRSA66
Summary
In broad summary it is clear that the following strategies are key to a sustainable future:
Reduce consumption of non-renewable resources•
Reuse where possible •
Recycle •
Integrate technologies– link elements together in low • emission and waste systems through early stage design.
Use land in cities efficiently through good planning•
Plan and design along biomimicry principles.•
It is concluded that there is a way to massively reduce ineffi ciency and environmental damage as the human race continues to grow and this could help maintain human development. But we must organise ourselves differently if we are to take advantage of the opportunity and so it is necessary to look at approaches that can drive and facilitate the changes which are vital and urgent.
67ENTERING THE ECOLOGICAL AGE: The Engineers Role
9. ECONOMICS AND POLICY
Introduction
In the ecological economic model there needs to be a continuous adaption of the global economy to match the size of the supporting ecosystem. If the circulating resource use remains within the natural capacity of the ecosystem to absorb wastes and to regenerate resources then the economy is sustainable and human development can continue.
Policies which drive towards this sustainable or optimal scale need to address the limiting of scale and the fact that previously free natural resources and services have to be declared scarce economic goods. Once they are scarce they become valuable assets and the question of who owns them arises and therefore the issue of distribution must be addressed. As sustainability is the criterion for scale, justice is the criterion for distribution. Policy fi nally needs to ensure that allocation of resources is as effi cient and cost effective as possible and this is where comprehensive effi ciency comes in.
These three interacting objectives are used to create a policy framework and then the delivery models and the roles of public, private, NGO’s and communities are examined. The main political dilemma in implementing these economic reforms in one part of the world is the maintenance of international competitiveness and so policy development on a global scale is also critical. Without this, polluting activity will just move from one country to another. Policy therefore needs to be implemented at national and global scale.
Policy framework
REACHING A SUSTAINABLE ECONOMIC SCALE
The dominant forms of policy affecting scale are the command and control regulations which either ban certain activities or limit the amount of pollutant that can be released into the eco-system. For example, lead additives for petrol (tetraethyl lead) or DDT have been banned and factories have limits set on the amount of waste they can discharge and vehicles have a limit set on the amount of emissions they can release.
The advantages of this approach are that regulations can be applied to everyone equally or tailored to meet distribution goals. Regulations can be easily understood and can be fairly cheap to monitor and enforce.
The disadvantage is that generally regulations fail to deal with the economic objective of effi cient allocation and are not therefore the most cost effective way to achieve optimal scale. They fail to incentivise going beyond the minimum regulation and at a local level can often turn off innovative approaches within the market.
There are three more sophisticated forms of policy which aim to overcome these problems:
Fiscal measures e.g. Taxes•
Subsidies•
Tradable Permits•
The fi rst is imposing taxes in which the tax is equal to the marginal extra cost including the damage from their pollution-the polluter pays principle. The whole diffi culty is measuring and allocating these costs within a legal framework. The only practical way to impose such taxes is to impose a progressive increase of tax up to full level over a period of years as has been done with landfi ll tax. It is also valuable for the taxes raised to be made available drive public sector and linked investments which make the benefi ts greater for the private sector over time. Also examples that change behaviour for the better are landfi ll tax, climate change levy, waste disposal regulations etc. By taxing or regulating the emission or pollution the market has to change to remain competitive.

THE BRUNEL LECTURE 2008: By Peter HEAD OBE FREng FRSA68
The second policy is to provide subsidies to companies that reduce their environmental costs where the subsidy equals the benefi t of avoiding pollution. Instead of the polluter paying, the government pays the fi rm not to pollute. A typical example is the energy feed-in legislation which provides subsidies to renewable energy companies to set up production when the commercial benefi ts are not there otherwise. This has now been introduced in 50 countries worldwide.155
One potential problem with subsidies is that they distort markets and if the levels are set too high the accelerating business activity can lead to more total pollution and there needs to be some fl exibility in the subsidy system over time.
The third form of policy to restrict scale is the introduction of tradable permits in which, rather than increasing prices through tax, a quota is set at the maximum level of pollution that will be allowed. Ideally this quota should be set so that the marginal social and business costs are equal to the societal benefi ts but this is hard to achieve. Once established the quota is distributed amongst polluters and resource users in the form of permits or individual quotas. Some quota systems are tradable and this incentivises effi ciency and cost effectiveness.
155 Seager, Ashley, Experts call for ‘feed-in tariffs’ to encourage renewable energy use, The Guardian, http://www.guardian.co.uk/environment/2008/apr/29/renewableenergy.energyefficiency, (29 April 2008).
JUST DISTRIBUTION
Distribution brings in the ethical dimensions of how increasingly limited resources are made available to poor people now and for generations in the future and is therefore a contentious area that has to be addressed. Several policy approaches have been devised both within and between nations around the world:
Maximum and minimum levels for income and • wealth
Distributing the returns to capital•
Distributing the returns to natural capital•
Maximum and minimum levels for income and wealth: Policy measures proposed include a highly progressive income tax on individuals that aims to limit individual wealth and minimum income levels that ensure lowest paid workers have access to suffi cient minimum resources. These are seen by many economists as measures that will disincentivise entrepreneurs who are needed to drive change and seem unworkable.
Distributing the returns to capital: A more productive area of policy is the distribution of returns from capital. A broader distribution of capital ownership can enhance the effi ciencies of the market economy and could lead to improved returns on natural capital. For example Employee Share Ownership schemes can enable a much broader infl uence on business decisions towards those that achieve a more balanced distribution. These ideas can be extended to community interest utility and service companies that provide lower carbon services.
The disclosure requirements for pension fund investments for social and environmental outcomes from investment are also a potential powerful force for improved distribution and associated allocation effi ciency. As pension funds are looking longer term for their returns they are likely to be a critical source of capital for the infrastructure for the ecological age.
69ENTERING THE ECOLOGICAL AGE: The Engineers Role
Distributing the returns to natural capital: Ownership of land and natural capital does not currently refl ect the costs infl icted. In ecological economics terms there is an effective hidden subsidy because of pollution to soil, water and air. Where the state owns the resource a royalty is paid and raising the level of royalty is one route to ending these subsidies.
Land is a key resource which is fi xed and limited. Land value increases come from society activity and accrue to both public and private sector. With supply of land fi xed and demand increasing, the price of land and the rent from it will increase leading to an increasing concentration of wealth and income. The current economic cycles are intimately linked to cycles of land speculation. In the USA the richest 10% own 60-65% of the land by value and in Brazil the richest 1% own 50% of the rural land.156 A policy widely discussed is the use of land taxes to redistribute a portion of rental income.
The construction of infrastructure and associated higher density development in urban areas lifts land value and taxes should therefore be considered on land and infrastructure. Land taxes are seen by some economists as a means to stabilise the economy as they reduce land value.
The relationship between land use density and value is critical to help drive future more sustainable use of land. Well designed higher density development in urban areas can increase value and reduce ecosystem pollution compared to sprawling suburbs. On the other hand public sector road investment in infrastructure in low density suburbs is a subsidy for people to live there. There are examples of cities, such as Melbourne and Pittsburgh that have combined high land taxes with free infrastructure to incentivise regeneration of inner urban centres and curb sprawl.
Since land is usually owned by the public and private sector in a region of a city, it makes sense to create public-private partnerships for regeneration in which the land value benefi ts are shared and used to drive the transition to an urban density and form which gives a higher quality of life. All of the above demonstrates that land use and infrastructure planning within city governance structures is critical to achieve the objectives.
156 Daly, Herman E. & Farley, Joshua, Ecological Economics: Principles and Applications, Part III, Microeconomics, chapter 9 supply and demand, pp 141-157, (2004).
Internal bartering: Resource sharing can be assisted by using bartering in which human development benefi ts are given in return for waste recycling and avoiding of pollution. A successful example is in Curitiba where poor people were encouraged to recycle their waste by giving them free bus tickets to get to work. In this way social benefi ts and eco-system benefi ts were developed hand in hand. The scheme was very popular and lifted human development quickly. Infrastructure operating systems need to take account of these internal mechanisms as we move to sustainable development models.
Much of the focus of the paper is on how to achieve increased effi ciency in the allocation of resources and this will be one of the prime areas of activity for planners and engineers to work in partnership. Effi cient allocation is not happening in the current market because natural capital and eco-system services are not valued. Allocation is therefore tipped toward goods that are potentially damaging our long term well-being. The comprehensive effi ciency approach is one that addresses this and provides a framework for a paradigm shift in allocation. Allocation using this method requires a valuation of eco-system services. Environmental economics is tackling this subject.157
157 King, D.M & Mazotta, M.J, Ecosystem Valuation, sourced from; www.ecosystemvaluation.org.

THE BRUNEL LECTURE 2008: By Peter HEAD OBE FREng FRSA70
UN Contraction and Convergence 158
INTERNATIONAL POLICIES
All nations in the world benefi t from healthy eco-systems in other countries but they do little to help pay for their preservation. There is a desperate need to create an effective policy for preserving healthy ecosystems by providing incentives and the resources to do so. The Kyoto protocol and what may follow from it is the fi rst attempt to tackle this for the earth’s atmosphere to which no one has been able to claim ownership. The Contract and Convergence approach promoted by UN is a well thought through and potentially powerful approach which also addresses fair distribution. The logic of this underpins this paper’s model of convergence to living within environmental limits and the two are mutually supportive.
158 Meyer, Aubrey, The fair choice for climate change, BBC News, http://news.bbc.co.uk/1/hi/sci/tech/4994296.stm, (May 18 2006).
Rest of World
10
8
4
0
1860 2000
Gig
aton
nes
carb
on (g
ross
)
2140
India China Annex 1 (non-OECD) OECD minus USA United States

71ENTERING THE ECOLOGICAL AGE: The Engineers Role
Now turning to the governance and operations phase and examining whether improvements in footprint will last. The paper has focussed on solutions that provide plentiful and effi cient renewable energy sources rather than relying simply on energy reduction to lower footprint and carbon emissions. The reason for this is concern over the ‘rebound effect.160 Rebound can be seen as having three components.
Direct Rebound- when a more effi cient car or home heating technology lowers the cost of the energy service (transport miles, a warm house) and thus allows more miles to be driven or the house to be heated for a longer period.
Indirect Rebound- when the monetary savings from the ‘direct’ effect allows a greater range of consumption activities, e.g. a second car, more energy using appliances at home, an overseas trip.
Equilibrium Rebound- when a wide range of more effi cient energy services cascades through the economy, stimulating a component of economic growth which in turn drives more consumption. The global policy area is important in this respect to ensure that effi ciency in one economic zone does not release further expansion of consumption in another.
Economy-Wide Rebound Effect 161
160 Crane, D., Foran, B., Powerful choices: options for Australia’s transition to a low-carbon economy, Advances in Energy Studies: Perspectives on Energy Futures, (2006).
161 UK Energy Research Center, The Rebound Effect: An Assessment of the Effect for economy-wide energy savings from improved energy efficiency, http://www.ukerc.ac.uk/Downloads/PDF/07/0710ReboundEffect/0710ReboundEffectReport.pdf, (October 2007).
I0. DELIVERY MODELS
The fi rst step for transition in any country, region or urban area needs to be the establishment of a clear sustainable development framework with long term objectives for social, environmental and economic performance. Leadership at national and local level has been shown to be absolutely critical to enable clear objectives to be agreed and for driving consistent delivery.
High quality planning and design can then begin using modelling tools, such as Integrated Resource Modelling, to plan the infrastructure and land use changes necessary to deliver the outcomes. An understanding of virtuous cycles outlined in the paper is necessary to get convergent design. The next stage is to establish the partnership and funding arrangements for delivery.
There is clear evidence that fi rst movers in this transition are gaining benefi t both at a regional economic level and at a business level. The C40 Clinton Climate Initiative is an example of a global partnership to move urban areas in higher income countries in the direction set out in this paper by establishing global buying-clubs to create the market size for new technologies to make implementation attractive.159
The fi nancing solutions will require long term infrastructure partnerships between public and private sectors and community groups and NGO’s and we can expect to see these emerging at a regional level and to include mitigation and adaptation. Partnerships are necessary because often land ownership will be in both public and private sector hands. Pension funds have a signifi cant interest in this area of investment. Risks of losses of value will be mitigated and so partnerships with insurance companies are also likely to be productive as will partnerships with mortgage lenders for the upgrading of homes and surrounding infrastructure to enable occupiers to see cost reductions quickly. Microfi nance and micro-insurance schemes that deal with both adaptation and mitigation are emerging quickly and these can operate at a local community or regional scale in low and middle income countries to manage and share risks over the long term.
159 Clinton Climate Initiative C40 Cities. http://www.c40cities.org/.
Economy-Wide Rebound Effect
Estimate of EnergySavings
ActualEnergySavings
IndirectReboundEffect
DirectReboundEffect

THE BRUNEL LECTURE 2008: By Peter HEAD OBE FREng FRSA72
While we should acknowledge the rebound effect, it should not discourage us from continuing our efforts towards energy effi cient policies and technologies. Rather, as noted by UK Energy Research Centre’ report on rebound effects, we should, “build headroom into policy targets to allow for rebound effects, raising energy prices in line with energy effi ciency improvements or imposing absolute caps on emissions”.162 The key is to develop policies that are resilient and have strong governance operations to ensure a permanent transition to the ecological age.
This is only the start of the journey and so learning, research feedback and capacity building are essential. Arup is supporting the creation of a network of Institutes for Sustainability initially in UK in Thames Gateway, China in Dongtan and Africa in Kampala to help this process forward.
Rebound Effects - Consumers 163
Rebound Effects - Producers 164
162 UK Energy Research Center, The Rebound Effect: An Assessment of the Effect for economy-wide energy savings from improved energy efficiency, http://www.ukerc.ac.uk/Downloads/PDF/07/0710ReboundEffect/0710ReboundEffectReport.pdf, (October 2007).
163 UK Energy Research Center, The Rebound Effect: An Assessment of the Effect for economy-wide energy savings from improved energy efficiency, http://www.ukerc.ac.uk/Downloads/PDF/07/0710ReboundEffect/0710ReboundEffectReport.pdf, (October 2007).
164 UK Energy Research Center, The Rebound Effect: An Assessment of the Effect for economy-wide energy savings from improved energy efficiency, http://www.ukerc.ac.uk/Downloads/PDF/07/0710ReboundEffect/0710ReboundEffectReport.pdf, (October 2007).
IndirectLower Petrol Bills
Holiday in Spain
Less Energy
Lower Running Costs
Driver Furtheror More Often
More Energy
More EnergyEmbodiedEnergy
IndirectLower Cost Cars
MoreCar Travel
Less Energy
Lower CostSteel
More SteelProduction
More Energy
More EnergyEmbodiedEnergy
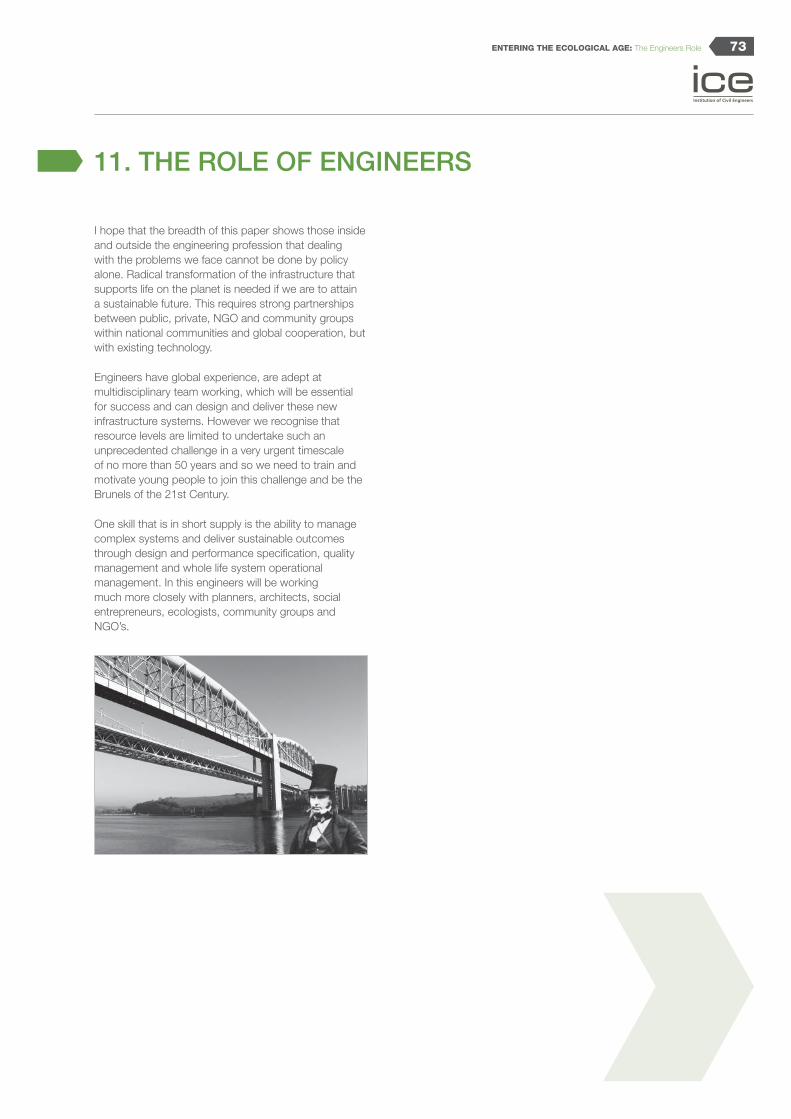
73ENTERING THE ECOLOGICAL AGE: The Engineers Role
11. THE ROLE OF ENGINEERS
I hope that the breadth of this paper shows those inside and outside the engineering profession that dealing with the problems we face cannot be done by policy alone. Radical transformation of the infrastructure that supports life on the planet is needed if we are to attain a sustainable future. This requires strong partnerships between public, private, NGO and community groups within national communities and global cooperation, but with existing technology.
Engineers have global experience, are adept at multidisciplinary team working, which will be essential for success and can design and deliver these new infrastructure systems. However we recognise that resource levels are limited to undertake such an unprecedented challenge in a very urgent timescale of no more than 50 years and so we need to train and motivate young people to join this challenge and be the Brunels of the 21st Century.
One skill that is in short supply is the ability to manage complex systems and deliver sustainable outcomes through design and performance specifi cation, quality management and whole life system operational management. In this engineers will be working much more closely with planners, architects, social entrepreneurs, ecologists, community groups and NGO’s.

THE BRUNEL LECTURE 2008: By Peter HEAD OBE FREng FRSA74

75ENTERING THE ECOLOGICAL AGE: The Engineers Role
12. CONCLUSION
A comprehensive review has been made of the technologies, infrastructure systems, planning approaches, policies and delivery mechanisms needed across the world to move all human development onto a sustainable pathway which attempts to stop and reverse destruction of the eco-system on which we depend for life. This is a challenge that engineers are ready to tackle in partnership with all other disciplines. I have highlighted which technologies are lacking and need to be developed very quickly but most of them exist.
I have shown a fi rst glimpse of a way forward and a credible vision of the future but it is only a modest start for a long journey. My hope is that the Copenhagen Climate Summit in December 2009 will be the moment the world gets together and agrees that we really know enough and are prepared about the direction that we need to take. Therefore, this will be the moment when we quickly start moving down this path with the global and national government policies and private sector and NGO partnerships.
I hope presenting this paper will enable the global community of engineers to come together too and inspire young people to join us in this challenge, almost certainly the greatest humankind has ever faced.

THE BRUNEL LECTURE 2008: By Peter HEAD OBE FREng FRSA76

77ENTERING THE ECOLOGICAL AGE: The Engineers Role
Images provided by:
© Doug Sephton in Drivers of Change: Demographics, Arup 2008
© Jupiter Images UK Ltd, in Drivers of Change: Demographics, Arup (2008).
© Tuca Vieira in Drivers of Change: Urbanisation, Arup (2008).
© Daisuke Tofuku in Drivers of Change: Urbanisation, Arup (2008).
Websites:
Arup Global Foresight and Innovation, Arup Drivers of Change,
http://www.arup.com/landing.cfm?pageid=8870, (2008).
Arup’s Integrated Urbanism: http://www.arup.com/integratedurbanism/whoweare.cfm?pageid=7937.
Arup Integrated Urbanism, Chongming Dongtan Eco-City China, http://www.arup.com/integratedurbanism/project.cfm?pageid=8020 (2008).
Clinton Climate Initiative, C40 Cities, http://www.c40cities.org/ (2008).
Global Footprint Network: http://www.footprintnetwork.org/
13. REFERENCES

THE BRUNEL LECTURE 2008: By Peter HEAD OBE FREng FRSA78
A.
Adam, David and Alok Jha, EU review bio fuel target as environmental doubts grow, The Guardian, http://www.guardian.co.uk/environment/2008/jan/15/biofuels.carbonemissions, (15 January 2008).
Areas of Relative Water Stress, http://www.defra.gov.uk/environment/water/strategy/pdf/future-water.pdf, (2007).
Arup, Drivers of Change: Waste, http://www.zerowaste.org/case.htm, (2008).
B.
Ban Ki-moon, The new face of hunger Washington Post, (12 March 2008).
Barker, Kate, Review of Housing Supply: Delivering Stability: Securing our Future Housing Needs, HM Treasury, http://www.hm-treasury.gov.uk/media/E/3/barker_review_report_494.pdf, (March 2004).
BBC News, Most people ready for Green Sacrifi ces, BBC News, http://news.bbc.co.uk/1/hi/world/7075759.stm, (9 November 2007).
BBC News, Report Reveals Global Slum Crisis, http://news.bbc.co.uk/1/hi/world/5078654.stm#slums, (2007).
BBC News, UN warns on food price infl ation, http://news.bbc.co.uk/2/hi/in_depth/7281686.stm, (6 March 2008).
Benyus, Janine, Biomimicry: Innovations that Inspired by Nature, Harper Collins: New York (1997).
British Metal Recycling Agency (BMRA), What is Metals Recycling, http://www.recyclemetals.org/whatis.php, (2008).
BioRegional Solutions for Sustainability, Local Paper for London, http://www.bioregional.com/programme_projects/pap_fi bres_prog/lp4london/lpaper_facts.htm, (2008).
Blueprint for Water Organisation Publication, 10 steps to sustainable water by 2015, http://www.blueprintforwater.org.uk/Blueprint_A4.pdf, (November 2006).
Boardman, Brenda, Home Truths: A Low Carbon Strategy to Reduce UK Housing Emissions by 80% by 2050, University of Oxford’s Environmental Change Institute, (November 2007).
Bradsher, Keith, A Drought in Australia, a Global Shortage of Rice, The New York Times, World Business Report, http://www.nytimes.com/2008/04/17/business/worldbusiness/17warm.html?_r=3&hp&oref=slogin&oref=slogin&oref=slogin, (17 April 2008).
Brown, Lester, Plan B 3.0, New York: W.W. Norton & Company, (2008).
79ENTERING THE ECOLOGICAL AGE: The Engineers Role
C.
CBI Climate Change Taskforce, Climate Change: Everyone’s Business,
http://www.avtclient.co.uk/climatereport/docs/climatereport2007full.pdf, (November 2007).
China: White Paper on Energy: China Energy Conditions and Policies, sourced from http://www.10thnpc.org.cn/english/environment/236955.htm#0, (2007).
The Climate Group Report, In the Black: The Growth of the Low Carbon Economy - Summary Report, The Climate Group http://theclimategroup.org/assets/resources/TCG_ITB_SR_FINAL_COPY.pdf
(August 2007).
Crane, D., Foran, B., Powerful choices: options for Australia’s transition to a low-carbon economy, Advances in Energy Studies: Perspectives on Energy Futures, (2006).
D.
Daly, Herman E. & Farley, Joshua, Ecological Economics: Principles and Applications Part III, Microeconomics, chapter 9 supply and demand, pp 141-157 (2007).
Department for Environmental, Food and Foreign Affairs, Future Water; The Governments Strategy for water in England, sourced from http://www.defra.gov.uk/environment/water/strategy/pdf/future-water.pdf (February 2008).
Department of Treasury & Finance DTF Research Note The World Iron market in 2005, sourced from http://www.dtf.wa.gov.au/cms/uploadedFiles/iron_research_note_may2005.pdf, (2005).
Design to Win: Philanthropy’s role in the fi ght against Climate Change,
California Environmental Associates (August 2007).
Dickie, Phil., Rich countries, Poor Water, World Wildlife Federation Freshwater Program,
http://assets.panda.org/downloads/rich_countries_poor_water_fi nal_170706.pdf, (2006).
E.
EAA C. Sperlinger, Nachhaltige Stadtentwicklung beginnt im Quartier OeKoinstiut e.V (Ed) Freiburg, 1999 in Drivers of Change: Waste, Arup 2008
The Economist, A Large Black Cloud, (21 March 2008).
The Economist, An Expensive Dinner, http://www.economist.com/world/international/displaystory.cfm?story_id=10085859, (3 November 2007).
The Economist, Shock Treatment,
http://www.economist.com/fi nance/displaystory.cfm?story_id=10130655, (15 November 2007).
The Economist, The Elusive Negawatt, http://www.economist.com/displaystory.cfm?story_id=11326549, (2008).
The Economist, The New Face of Hunger,
http://www.economist.com/world/international/displaystory.cfm?story_id=11049284, (17 April 2008).
Elliott, Valerie, Price rises feed through to your shopping basket, The Times,
http://www.timesonline.co.uk/tol/news/environment/article3500963.ece, (7 March 2008).
EM-DAT: The OFDA/CRED International Disaster Database. http: //www.em-dat.net, UCL - Brussels, Belgium Base Map: UNEP/DEWA/GRID-Europe, June 2005
Energy and emissions increase in Ireland, Environment Protection Agency, (December 2007).
Energy Watch Group. “Crude Oil: The Supply Outlook”. EWG-Series No 3/2007 October 2007. http://www.energywatchgroup.org/fi leadmin/global/pdf/EWG_Oilreport_10-2007.pdf
Environment Agency, Landfi ll and waste regulation studies, sourced from http://www.environment-agency.gov.uk/subjects/waste/?lang.
Environment Agency, Waste, Electrical and Electronic Equipment, http://www.environment-agency.gov.uk/business/1745440/444663/1106248/, (2007).
European Environment Commission, Waste: End of Life Vehicles, http://ec.europa.eu/environment/waste/elv_index.htm, (2008).
European Law Monitor, Commission to promote clean and Energy Effi cient vehicles, sourced from http://www.europeanlawmonitor.org/latest-eu-news/commission-to-promote-clean-and-energy-effi cient-vehicles.html, (2008).

THE BRUNEL LECTURE 2008: By Peter HEAD OBE FREng FRSA80
F.
FAO/OECD, The BBC News, The Cost of Food: Facts & Figures, World Food Commodity Prices, http://news.bbc.co.uk/1/hi/world/7284196.stm, (1971-2017).
FAOSTAT, Chapter 9 population projection, WTO 2007, Geo data Portal compiled from UNPD 2007, World Bank 2006, UNFCCC-CDIAC, (2006).
Floud, Roderick and D.N. McCloskey eds, The Economic History of Britain since 1700, Cambridge University Press, (1994).
Food and Agriculture Organisation, 1997 in Drivers of Change: Water, Arup (2008).
G.
GEO-4, United Nations Environmental Programme, http://www.unep.org/geo/geo4/media/ (2007).
Global Footprints Network, Footprint Standards, http://www.footprintstandards.org/, (2003-2007).
Graedel, T.E., et al., Multilevel cycle of anthropogenic copper, Environmental Science & Technology, 38, 1242-1252, (2004); B. Reck, et al. Anthropogenic nickel cycle: Insights into use, trade, and recycling, Environmental Science & Technology, 42, 3394-3400, (2008).
Greater London Authority, Action Today to Protect Tomorrow: Mayor’s Climate Change Action Plan, sourced from Greater London Authority, http://www.london.gov.uk/mayor/environment/climate-change/docs/ccap_fullreport.pdf, (February 2007).
H.
Hansen, J.E, Scientifi c reticence and sea level rise, Environmental Research Letters, sourced from http://www.iop.org/EJ/article/1748-9326/2/2/024002/erl7_2_024002.html, (2007).
Helweg-Larsen, Tim and Jamie Bull, ZeroCarbonBritian, Centre for Alternative Technology, http://www.zerocarbonbritain.com/images/zerocarbonbritain.pdf (2007).
Hickman, Martin, Cheap Flights threaten UK target for carbon emissions, The Independent, http://www.independent.co.uk/environment/cheap-fl ights-threaten-uk-targets-for-carbon-emissions-524879.html, (28 January 2006).
Hiller, Graham. CPI / Arup Joint Study (2007).
Hillier, Graham. “Construction Products for a Sustainable Society” Sustainability - Steel and the Environment Conference. 2 November 2004
Holmgren, David, Permaculture: Principles & Pathways Beyond Sustainability, Holmgren Design Services (2002).
I.
Intergovernmental Panel on Climate Change Report, Working Group III Report Mitigation of Climate Change, sourced from http://www.ipcc.ch/ipccreports/assessments-reports.htm, (2007).
International Energy Agency Publication, World Energy Outlook, sourced from http://www.worldenergyoutlook.org/, (2008).
K.
Kenworthy, J.R, Transport Energy Use and Greenhouse Gases in Urban Passenger Transport Systems: A Study of 84 Global Cities, Presented to the international Third Conference of the Regional, (2003).
King, D.M & Mazotta, M.J, Ecosystem Valuation, sourced from, www.ecosystemvaluation.org.

81ENTERING THE ECOLOGICAL AGE: The Engineers Role
L.
Layard, Richard. Happiness: Lessons from a New Science, pp 110-217, Penguin Publishing Press (2004).
Lehman Brothers, Wind Energy (18 April 2007).
Linstead, C, and C. Gervais, and P. Elkins, Mass Balance: An Essential Tool for Understanding Resource Flows, London: Forum for the Future, (2007).
Linsley, Benjamin & Ted Caplow, Sustainable Urban Agriculture, Urban Land Green, (2008).
M.
Malthus, Thomas R, Ratios of the increase of population and food, An Essay on the Principle of Population, Book 1, Chapter I, pp 13-21, (2007).
Marin, Cecile. UNEP/GRID-Arendal, 2006 in Drivers of Change: Waste, Arup (2008)
McKinsey & Company Reducing Greenhouse Gas Emissions: How much at what costs?, US Greenhouse Gas Abatement Mapping Initiative Executive Report, (2007).
Modes for Rapid Transport, Race, Poverty & the Environment; Curitiba’s Bus System, sourced from http://www.urbanhabitat.org/node/344 (2007).
N.
National Development & Reform Commission (NDRC), 11th Five Year Plan for National and Economic and Social Development, sourced from http://en.ndrc.gov.cn/hot/t20060529_71334.htm.
Newman, Peter and Jeff Kenworthy, Greening Urban Transportation: State of the World, Worldwatch Institute (Eds.) New York, W.W. Norton & Company, (2007).
Newman, Peter and Jeffrey Kenworthy, Urban Design to Reduce Automobile Dependence, Opolis: An International Journal of Suburban and Metropolitan
Studies: Vol. 2: No. 1, Article 3, http://repositories.cdlib.org/cssd/opolis/vol2/iss1/art3, (2006).
O.
OECD Environmental Outlook to 2030, www.oecd.org/environment/outlookto2030, (5 March 2008).
P.
Peoples’ Daily Online, China’s Urban Population to reach 800 to 900 Million by 2020, provided by, http://english.people.com.cn/200409/16/eng20040916_157275.html, (2007).
Population Reference Bureau, World Population Data Sheet, pp 1-16, provided by http://www.scribd.com/doc/326077/World-Population-Datasheet-2007.
Pon, B., Diagram: Sketch of an Urban Heat-Island Profi le sourced from http://heatisland.lbl.gov/HighTemps/ (2007).
R.
Randerson, James, Food crisis will take hold before climate change, warns chief scientist, The Guardian, http://www.guardian.co.uk/science/2008/mar/07/scienceofclimatechange.food, (7 March 2008).
Roberts, Simon. Email to author. 1 April 2008.
S.
Seager, Ashley, Experts call for ‘feed-in tariffs’ to encourage renewable energy use, The Guardian, http://www.guardian.co.uk/environment/2008/apr/29/renewableenergy.energyeffi ciency, (29 April 2008).
Simms, Andrew, Dan Moran and Peter Chowla, UK Interdependence Report, New Economics Foundation (2006).
Statistics from Development Data Group, The World Bank, World Development Indicators Online. Washington, DC: The World Bank. Available at: http://go.worldbank.org/3JU2HA60D0.
Stauffer, Nancy, Algae system transforms greenhouse emissions into green fuel, The MIT Energy Research Council http://web.mit.edu/erc/spotlights/alg-all.html, (2006).
Strahan, David, Coal: Bleak outlooks for the black stuff, New Scientist,
http://environment.newscientist.com/data/images/archive/2639/26391802.jpg, (19 January 2008).

THE BRUNEL LECTURE 2008: By Peter HEAD OBE FREng FRSA82
T.
Timmins, C, Environmental Resource Economics, Volume 26, Number 1, sourced from
http://www.springerlink.com/content/rp22580246p40t34/ Yale (2004).
TMC Net, eSolar and Southern California Edison to Produce 245MW of Solar Power, http://callcenterinfo.tmcnet.com/news/2008/06/03/3477818.htm, (3 June 2008).
Transport for London information on motor vehicle usage and ownership, http://www.tfl .gov.uk/tfl /search/?keywords=car%20drivers%20research&direction=next&fi lter=1&restrict=&lastResult=10, date accessed (2008).
Turner, Cathy and Mark Frankel, Energy Performance of LEED for New Construction Buildings, US Green Building Council, https://www.usgbc.org/ShowFile.aspx?DocumentID=3930, (4 March 2008).
U.
United Nations General Assembly Report A/42/427, Our Common Future, Report of the World Commission on Environment and Development, sourced from http://www.worldinbalance.net/pdf/1987-brundtland.pdf (1987).
UK Chancellor of the Exchequer, Stern Review: The Economics of Climate Change, UK Chancellor of the Exchequer, http://www.hm-treasury.gov.uk/independent_reviews/stern_review_economics_climate_change/stern_review_report.cfm, (2006).
UK Energy Research Centre, Energy Infrastructure and Supply, sourced from, http://www.ukerc.ac.uk/ResearchProgrammes/EnergyInfrastructureandSupply/EnergyInfrastructureAndSupply.aspx
UK Energy Research Centre, The Rebound Effect: An Assessment of the Effect for economy-wide energy savings from improved energy effi ciency, http://www.ukerc.ac.uk/Downloads/PDF/07/0710ReboundEffect/0710ReboundEffectReport.pdf, (October 2007).
United Nations Development Programme, Human Development Report, sourced from http://hdr.undp.org/en/media/hdr_20072008_en_complete.pdf (2007-2008).
United Nations Environment Report (2006).
United Nations Environment Programme/ GRID-Arendal, Vital Waste Graphics, http://maps.grida.no/go/graphic/how-long-does-it-take-for-some-commonly-used-products-to-biodegrade, (2004).
United Nations, World Urbanization Prospects: The 2007 Revision, http://www.un.org/esa/population/publications/wup2007/2007WUP_Highlights_web.pdf(19 January 2008).
U.S. Department of Transportation, FHWA’s Highway Performance Monitoring System and the Canadian Equivalent or Gordon Price?,Highway Performance Monitoring System Report, http://www.fhwa.dot.gov/policy/ohpi/hpms/, (3 April 2008).
U.S Geological Society, Materials Flow & Sustainability, USGS Fact Sheet FS-068-98, http://pubs.usgs.gov/fs/fs-0068-98/fs-0068-98.pdf, (June 1998).
V.
Varma, Subodh, Hunger is set to grow as global food stocks fall, The Times of India, http://timesofi ndia.indiatimes.com/Hunger_is_set_to_grow_as_global_food_stocks_fall/articleshow/2859771.cms, (13 March 2008).

83ENTERING THE ECOLOGICAL AGE: The Engineers Role
W.
World Business Council on Sustainable Development, Biofuels, (2007).
World Business Council for Sustainable Development, Facts and Trends to 2050: Energy and Climate Change, http://www.wbcsd.org/DocRoot/FjSOTYajhk3cIRxCbijT/Basic-Facts-Trends-2050.pdf, (2004).
World Business Council for Sustainable Development, Policy Directions to 2050, http://www.wbcsd.org/DocRoot/bdA09BFxjVkjEeXJKjle/int_low_res.pdf, (2007).
World Economic Forum, Global Risks: Global Risk Network Report, http://www.weforum.org/pdf/globalrisk/report2008.pdf, (2008).
Word Wildlife Fund, One Planet Wales, (2007).
World Wildlife Fund, Living Planet Report sourced from http://assets.panda.org/downloads/living_planet_report.pdf (2006).
Wackernagel, M, Ecological footprint and appropriated carrying capacity: a tool for planning towards sustainability, University of British Columbia., PhD thesis (1994).
Wackernagel, M, How Big Is Our Ecological Footprint? – Using the Concept of Appropriated Carrying Capacity for Measuring Sustainability, Taskforce on Planning Healthy and Sustainable Communities, University of British Columbia (1993).
Wackernagel, M. & Rees, W.E, Our Ecological Footprint—Reducing Human Impact on the Earth, Gabriola Island, B.C., Canada: New Society Publishers, (1996).
Z.
Zweibel, Ken; and James Mason; and Vasilis Fthenakis, A Solar Grand Plan, Scientifi c American, (16 December 2007).