The British University in Dubai Master of Science in ... · Master of Science in Project ......
121
The British University in Dubai Master of Science in Project Management Dissertation Emotional Intelligence in Leaders: A Case study of its effect on Team performance in the construction industry of Dubai, U.A.E Submitted in partial fulfilment of the requirements for The degree of Master of Science in Project Management at The British University in Dubai (BUiD), Dubai, UAE Supervisor: Prof. Ashly Pinnington By: Ahmed Ali Al-Mahmoud ID Number: 20050003 Date: 21 st March 2009
Transcript of The British University in Dubai Master of Science in ... · Master of Science in Project ......
The British University in Dubai
Master of Science in Project Management
Dissertation
Emotional Intelligence in Leaders: A Case study of
its effect on Team performance in the construction
industry of Dubai, U.A.E
Submitted in partial fulfilment of the requirements for
The degree of Master of Science in Project Management
at The British University in Dubai (BUiD), Dubai, UAE
Supervisor: Prof. Ashly Pinnington By: Ahmed Ali Al-Mahmoud ID Number: 20050003 Date: 21st March 2009

ABSTRACT
The purpose of this study is to qualitatively examine the relationship between
emotional intelligence of leaders on team performance, based on the Emotional
Intelligence Inventory test (ECI) of Hay Group.
The population of this research is leaders of the construction industry of Dubai, UAE.
This includes leaders from Government Organisations, Private Developers and
Project Management Companies. The study sample consisted of 16 leaders/
potential leaders and 27 peers who completed a leadership styles questionnaire and
an ECI-Hay group questionnaire.
Four main objectives were set at the early stage of the research. First, explore the
theory of Emotional Intelligence and its relation to leadership abilities. Secondly,
examine inter-relationship of Emotional Intelligence among leaders and their teams’
performance. Thirdly, investigate the components of Emotional Intelligence present
among Construction Leaders in Dubai. Finally, illustrate the effects of Emotional
Intelligence on team performance in Dubai’s construction industry.
The Findings showed that team performance is significantly related to emotional
intelligence of the leader. A positive relationship found between emotional
intelligence, leadership styles and team performance, with leaders who rated
themselves as more democratic in their leadership style, also reporting themselves
as being able to identify their own feelings and emotional states, to express those
inner feelings to others; to identify and understand the emotions of others; mange
positive and negative emotions both within oneself and others; effectively control
strong emotional state experienced at work such as anger, stress, anxiety and
frustration.
In the light of the analysis and the findings of the study, it is highly recommended. to
invest in developing leaders and teams’ emotional intelligence through behaviour
modelling, emotional intelligence mentoring and certification. In addition
benchmarking with emotionally intelligent organisations is important. Lastly
Emotional Intelligence should be incorporated in Leadership Development Program
as a basic requirement.
DEDICATION
I dedicate this dissertation to H.H Highness Sheikh Mohammed bin Rashid Al-
Maktoum; one of my role models in life. His quotes, actions, vision were a great
encouragement for me to continue my Master Degree.
I also dedicate this work to my wonderful family. Especially to my parents whose
continuous words of motivation ring in my ears, and my understanding and patient
wife for her unconditional support throughout my Master program.
Finally, I dedicate this dissertation to each person helped me throughout this project
either by an idea, an advice or an opinion.

ACKNOWLEDGEMENTS
This dissertation could not have been written without God’s help, and many people’s
efforts. I wish to thank all of those people who assisted me in making this
dissertation possible.
Special thanks to Prof. Ashly Pinnington, Dean Faculty of Business, British
University in Dubai, for all his guidance, support, motivation, and patience.
I also would like to express my sincere thanks to Ms. Barbara Darling, Associate
Director of Hay Group Dubai for her support and cooperation.
Additionally, I would like to express gratitude to Mr. Abdul Ghaffar A. H. Chaudhry
and Mr. Yousef Al Ali who provided me with golden advices and recommendations.
My Special thanks to Mr. Aftab Ahmed, English Language Instructor, American
University of Sharjah, for his editing and fine tuning.
I wish to express my deep appreciation to Eng. Adel Ghafan, Executive Director of
Engineering Department (Dubai Airport) Free Zone Authority for his invaluable
support and patience throughout this project.
Finally, I am grateful for my lovely family continues support, encouragement and
patience.

TABLE OF CONTENTS
11 IINNTTRROODDUUCCTTIIOONN .................................................................................................................................................. 11
1.1 OVERVIEW .......................................................................................................................... 1
1.2 PROBLEM STATEMENT ............................................................................................................ 2
1.3 AIM & OBJECTIVES ................................................................................................................ 3
1.4 RESEARCH QUESTIONS ........................................................................................................... 3
1.5 RESEARCH OUTLINE ............................................................................................................... 4
22 LLIITTEERRAATTUURREE RREEVVIIEEWW .................................................................................................................................... 66
2.1 EMOTIONAL INTELLIGENCE (EI) ................................................................................................. 6
2.1.1 ORIGIN & HISTORY ..................................................................................................................... 6
2.1.2 DEFINITIONS .............................................................................................................................. 7
2.1.3 EMOTIONAL INTELLIGENCE (EI) AND INTELLIGENCE QUOTIENT (IQ) - DIFFERENCE ................................ 7
2.1.4 MODELS OF EMOTIONAL INTELLIGENCE ......................................................................................... 8
2.1.5 EMOTIONAL COMPETENCIES ...................................................................................................... 10
2.1.5.1 Self-Awareness ....................................................................................................... 12
2.1.5.2 Self-Management ................................................................................................... 12
2.1.5.3 Social-Awareness .................................................................................................... 13
2.1.5.4 Relationship Management ..................................................................................... 13
2.2 LEADERSHIP ....................................................................................................................... 14
2.2.1 LEADERSHIP TRAITS .................................................................................................................. 14
2.2.2 LEADERSHIP STYLES & EI COMPETENCIES ..................................................................................... 15
2.2.3 EMOTIONAL INTELLIGENCE & LEADERSHIP .................................................................................... 17
2.3 SIGNIFICANCE OF EI IN ORGANISATION ..................................................................................... 20
2.4 IMPACT OF LEADER’S EI ON THEIR TEAMS ................................................................................. 23
2.4.1 LEADER'S EMOTIONAL EXPRESSIONS TO THEIR TEAMS .................................................................... 24
2.4.2 EMOTIONAL INTELLIGENCE AMONG TEAM-MEMBERS ..................................................................... 26
33 MMEETTHHOODDOOLLOOGGYY ............................................................................................................................................ 2288
3.1 REVIEW OF POSSIBLE RESEARCH METHODOLOGIES: ..................................................................... 28
3.1.1 THE QUALITATIVE AND THE QUANTITATIVE APPROACHES ................................................................. 29
3.1.2 DATA COLLECTION METHODS: ................................................................................................... 31
3.1.2.1 Questionnaires ....................................................................................................... 31
3.1.2.2 Interviews: .............................................................................................................. 32
3.1.2.3 Diaries ..................................................................................................................... 32
3.1.3 OPTIMUM DATA COLLECTION METHOD TO MEET STUDY................................................................ 33
OBJECTIVES: ............................................................................................................................................. 33
3.2 MEASUREMENT TOOLS FOR EI................................................................................................ 34

TABLE OF CONTENTS
3.2.1 EMOTIONAL QUOTIENT INVENTORY: BAR-ON ............................................................................... 34
3.2.2 EMOTIONAL INTELLIGENCE QUESTIONNAIRE ................................................................................. 35
3.2.3 MAYER-SALOVEY-CARUSO EMOTIONAL INTELLIGENCE TEST (MSCEIT) ............................................ 36
3.2.4 EMOTIONAL COMPETENCY INVENTORY ........................................................................................ 38
3.3 SELECTION OF MEASUREMENT TOOL ........................................................................................ 39
3.4 EVALUATION OF EI TEST TOOLS .............................................................................................. 40
3.5 ELEMENTS TO MEASURE ....................................................................................................... 41
3.6 QUESTIONNAIRES ................................................................................................................ 42
3.6.1 GENERAL SECTION .................................................................................................................... 43
3.6.2 LEADERSHIP STYLES ................................................................................................................... 43
3.6.3 EMOTIONAL COMPETENCY INVENTORY (HAY GROUP) .................................................................... 44
3.6.4 PERFORMANCE DUE TO LEADERSHIP STYLE .................................................................................... 46
3.6.5 PERFORMANCE DUE TO EMOTIONAL INTELLIGENCE COMPETENCIES ................................................... 47
3.7 SURVEY SAMPLE ................................................................................................................. 48
3.8 RESPONSE RATE .................................................................................................................. 48
3.9 GENERAL CHARACTERISTICS OF SURVEY .................................................................................... 49
44 DDAATTAA AANNAALLYYSSIISS AANNDD RREESSUULLTTSS .......................................................................................................... 5500
4.1 PREVALENT LEADERSHIP STYLES .............................................................................................. 51
4.1.1 PREVALENT LEADERSHIP STYLES IN PRIVATE DEVELOPERS ............................................................... 54
4.1.2 PREVALENT LEADERSHIP STYLES IN GOVERNMENT ORGANISATIONS .................................................. 55
4.1.3 PREVALENT LEADERSHIP STYLES IN PROJECT MANAGEMENT COMPANIES .......................................... 57
4.2 EMOTIONAL COMPETENCY INVENTORY (ECI) ............................................................................. 59
4.2.1 ECI IN PRIVATE DEVELOPERS ...................................................................................................... 60
4.2.2 ECI IN GOVERNMENT ORGANISATIONS ........................................................................................ 62
4.2.3 ECI IN PROJECT MANAGEMENT COMPANIES ................................................................................ 64
4.3 EFFECT OF LEADERSHIP STYLES ON TEAMS ................................................................................. 66
4.3.1 EFFECT OF LEADERSHIP STYLES IN PRIVATE DEVELOPERS ................................................................. 68
4.3.2 EFFECT OF LEADERSHIP STYLES IN GOVERNMENT ORGANISATIONS .................................................... 69
4.3.3 EFFECT OF LEADERSHIP STYLES IN PROJECT MANAGEMENT COMPANIES ............................................ 70
4.4 EFFECT OF EMOTIONAL INTELLIGENCE COMPETENCIES ON TEAMS PERFORMANCE ............................... 71
4.4.1 EFFECT OF ECI COMPETENCIES IN PRIVATE DEVELOPERS ................................................................. 74
4.4.2 EFFECT OF ECI COMPETENCIES IN GOVERNMENT ORGANISATIONS ................................................... 76
4.4.3 EFFECT OF ECI COMPETENCIES IN PROJECT MANAGEMENT COMPANIES ........................................... 78
4.5 CORRELATION OF EMOTIONAL INTELLIGENCE COMPETENCIES ......................................................... 80
4.5.1 CORRELATION TEST .................................................................................................................. 81
4.5.2 T-TEST .................................................................................................................................... 85
4.5.3 CRONBACH-ALPHA RELIABILITY TEST ........................................................................................... 85

TABLE OF CONTENTS
4.5.4 CHI-SQUARE TEST .................................................................................................................... 87
55 FFIINNDDIINNGGSS && DDIISSCCUUSSSSIIOONN ........................................................................................................................ 9911
5.1 FINDINGS .......................................................................................................................... 91
5.2 DISCUSSION ....................................................................................................................... 93
66 CCOONNCCLLUUSSIIOONNSS && RREECCOOMMMMEENNDDAATTIIOONNSS ......................................................................................110011
6.1 CONCLUSIONS .................................................................................................................. 101
6.2 LIMITATIONS .................................................................................................................... 102
6.3 RECOMMENDATIONS ......................................................................................................... 102
6.4 FUTURE RESEARCHES ......................................................................................................... 103
77 RREEFFEERREENNCCEESS ..................................................................................................................................................110055

LIST OF FIGURES
igure 2.1: Emotional Intelligence Competences (Goleman, Boyatzis, & McKee, 2002) ....... 11
igure 2.2: Developing Emotional Intelligence in Organisations: The optimal process
(Goleman, 1998) ............................................................................................................. 22
igure 2.3: Expression of emotion and the circumplex model of affect ..................................... 26
igure 3.1: General Information for the questionnaire .................................................................. 43
igure 3.2: Leadership styles (Goleman, 2002) ............................................................................ 44
igure 3.3: An extract from ECI questionnaire (Haygroup, 2008) .............................................. 45
igure 3.4: Team performance due to leadership style (Goleman, 2002) ................................. 46
igure 3.5: Team performance due to emotional intelligence competencies ........................... 47
igure 4.1: Leadership styles in three categories of organisations – leaders’ view ................. 53
igure 4.2: Leadership styles in three categories of organisations – peers’ view .................... 53
igure 4.3: ECI in Private Developers – Leaders & Peers comparison ..................................... 60
igure 4.4: ECI in Government Organisations – Leaders & Peers comparison ....................... 62
igure 4.5: ECI in Project Management Companies – Leaders & Peers comparison ............ 64
igure 4.6: Effect of Leadership styles on teams in different organisations.............................. 67
igure 4.7: Effect of Emotional Intelligence competencies on teams in different organisations
........................................................................................................................................... 72
igure 4.8: Cronbach-Alpha Values for 18 EI Competencies ..................................................... 86

LIST OF TABLES
Table 2.1: History of Emotional Intelligence ..................................................................................... 6
Table 2.2: Leadership styles and EI Competencies (Goleman, et al., 2002) ........................... 16
Table 3.1: Differences between the quantitative and qualitative research paradigms ............ 29
Table 3.2: Differences between the quantitiave and qualitative research approaches ........... 30
Table 3.3: Advantages & Disadvantages of Questionnaires ....................................................... 31
Table 3.4: Advantages & Disadvantages of Interviews ................................................................ 32
Table 3.5: Advantages & Disadvantages of Diaries ..................................................................... 32
Table 3.6: Bar-On EQ-I measures summary ................................................................................. 35
Table 3.7: EIQ measurement summary .......................................................................................... 36
Table 3.8: Structure and levels of feedback from the MSCEIT ................................................... 37
Table 3.9: Evaluation of EI Test Tools ............................................................................................ 40
Table 3.10: Classification of participating organisations in the survey. ..................................... 48
Table 3.11: General characteristics of the survey ......................................................................... 49
Table 4.1: Leadership styles in general by leaders – frequency and percentage .................... 51
Table 4.2: Leadership styles in general by peers – frequency and percentage ....................... 51
Table 4.3: Leadership styles in general – descriptive analysis ................................................... 52
Table 4.4: Leadership styles in private developers by leaders – frequency and percentage 54
Table 4.5: Leadership styles in private developers by peers – frequency and percentage.... 54
Table 4.6: Leadership styles in private developers – descriptive analysis ................................ 55
Table 4.7: Leadership styles in government organisations by leaders – frequency and
percentage ....................................................................................................................... 55
Table 4.8: Leadership styles in government organisations by peers – frequency and
percentage ....................................................................................................................... 56
Table 4.9: Leadership styles in government organisations – descriptive analysis .................. 56
Table 4.10: Leadership styles in project management companies by leaders – frequency and
percentage ....................................................................................................................... 57
Table 4.11: Leadership styles in project management companies by peers – frequency and
percentage ....................................................................................................................... 57
Table 4.12: Leadership styles in project management companies – descriptive analysis ..... 58
Table 4.13: ECI in general – descriptive analysis ......................................................................... 59
Table 4.14: ECI in Private Developers – descriptive analysis ..................................................... 61
Table 4.15: ECI in Government Organisations – descriptive analysis ....................................... 63
Table 4.16: ECI in Project Management Companies – descriptive analysis ............................ 65
Table 4.17: Effect of Leadership styles in general – frequency & percentage ......................... 67
Table 4.18: Effect of Leadership styles in general – descriptive analysis ................................. 68
Table 4.19: Effect of Leadership styles in Private Developers – frequency & percentage ..... 68
Table 4.20: Effect of Leadership styles in Private Developers – descriptive analysis ............. 69
Table 4.21: Effect of Leadership styles in Government Organisations – frequency &
percentage ....................................................................................................................... 69
Table 4.22: Effect of Leadership styles in Government Organisations – descriptive analysis
........................................................................................................................................... 70
Table 4.23: Effect of Leadership styles in Project Management Companies – frequency &
percentage ....................................................................................................................... 70
LIST OF TABLES
Table 4.24: Effect of Leadership styles in Project Management Companies – descriptive
analysis ............................................................................................................................. 71
Table 4.25: Effect of ECI competencies in general – frequency & percentage ........................ 72
Table 4.26: Effect of ECI competencies in general – descriptive analysis ................................ 73
Table 4.27: Effect of ECI competencies in private developers – frequency & percentage ..... 75
Table 4.28: Effect of ECI competencies in private developers – descriptive analysis ............ 76
Table 4.29: Effect of ECI competencies in government organisations – frequency &
percentage ....................................................................................................................... 76
Table 4.30: Effect of ECI competencies in private developers – descriptive analysis ............ 77
Table 4.31: Effect of ECI competencies in project management companies – frequency &
percentage ....................................................................................................................... 79
Table 4.32: Effect of ECI competencies in project management companies – descriptive
analysis ............................................................................................................................. 79
Table 4.33: Effect Emotional Competencies from the Responses of Leaders & Peers .......... 81
Table 4.34: Prominent EI competencies present in the Leaders ................................................ 82
Table 4.35: Prominent EI competencies present in the Leaders ................................................ 82
Table 4.36: EI Clusters and Mean of Leader and Peer responses ............................................ 84
Table 4.37: Cronbach-Alpha Values for EI Competencies .......................................................... 86
Table 4.38: Chi-square test for EI Competencies ......................................................................... 87
Table 4.39: Cross-tabulation for ECI 61 & ECI 62 ........................................................................ 88
Table 4.40: Chi-Square Tests for ECI 61 & ECI 62 ...................................................................... 88
Table 4.41: Cross-tabulation for ECI 25 & ECI 26 ........................................................................ 89
Table 4.42: Chi-Square Tests for ECI 25 & ECI 26 ...................................................................... 89
Table 4.43: Cross-tabulation for ECI 29 & ECI 27 ........................................................................ 90
Table 4.44: Chi-Square Tests for ECI 29 & ECI 27 ...................................................................... 90

1 | P a g e Introduction
11 IINNTTRROODDUUCCTTIIOONN
1.1 Overview
Dubai is undoubtedly the leading emirate of the United Arab Emirates (UAE) in terms
of developments and striving for the highest living standards for its residents and
visitors. The remaining six emirates of UAE; Abu Dhabi (Capital), Ajman, Fujairah,
Ras-Al-Khaimah, Sharjah and Umm-Al-Quwain are following Dubai’s economic
model for their growth too.
The UAE is primarily an oil producing country with a total population of 3.1 million,
out of which approximately 85% are expatriates. Dubai is succeeding in shifting its
economic dependence on oil revenue to tourism, real estate and banking. The lack
of infrastructure has given tremendous boost to the growth of the construction
industry, which currently stands at an approximate value of $221 billion (about AED
811.73 billion) - the highest in the region.
Dubai in recent years has initiated a number of landmark construction projects in the
world, such as Palm developments (world’s first biggest man-made islands), Burj
Dubai (world’s tallest tower), Dubai Shopping Mall (world biggest mall) and world’s
biggest increase in the waterfront area from 65km to 1500km (RTA Marine Agency,
2008). Definitely these developments cannot be initiated without a clear vision for a
nation.
The success is due to the visionary leadership of His Highness Sheikh Muhammad
bin Rashid Al Maktoum. One of the vital leadership traits is to convey his vision and
goals to his followers and the nation. He has remarkably achieved this by generating
a pool of young leaders in Dubai’s various industries. The construction industry being
one of the leading industries in the emirate also has numerous leaders and potential
leaders to support the vision of His Highness.

2 | P a g e Introduction
1.2 Problem Statement
The success of leaders and the construction industry will play a vital role in
transforming the emirate in the coming years. To maintain the development of
effective leaders in industry, it is essential to foster the right talent. The roots of the
development of the concept of emotional intelligence appear to lie in the apparent
inability of traditional measures of “rational thinking”, (e.g. IQ tests, SAT scores,
grades, etc.) to predict who will succeed in life. According to Goleman (1996),
research indicates that IQ contributes at best s about 20 percent of the factors that
determine success in life.
Emotional Intelligence is one of some theories which identify key elements of a
personality for becoming an effective leader. The literature in this emerging field
contains a range of terminology which can tend to be confusing and includes the
terms emotional intelligence (e.g. Goleman, 1996), emotional quotient (e.g.
Goleman, 1996, 1997b; Cooper, 1997), personal intelligences (e.g. Gardner, 1993),
social intelligence (Thorndike, 1920) and interpersonal intelligence (e.g. Gardner and
Hatch, 1989). Goleman (1997) provides a useful definition of the construct of
emotional intelligence, which is:
Knowing what you are feeling and being able to handle those feelings without
having them swamp you;
Being able to motivate yourself to get jobs done, be creative and perform at
your peak; and
Sensing what others are feeling, and handling relationships effectively.
As Dubai’s construction industry is not very old compared to other developed
nations, there has been limited research in the field of emotional intelligence for
leaders and their teams. This dissertation takes a step towards exploring the field of
Emotional Intelligence among potential construction leaders in Dubai and its effective
usage on their teams.

3 | P a g e Introduction
1.3 Aim & Objectives
The dissertation aims to prove the presence of Emotional Intelligence among
Construction Leaders of Dubai and its effect on their teams’ performance.
The aim will be achieved by the following objectives,
Explore the theory of Emotional Intelligence and its relation to leadership
abilities
Examine inter-relationship of Emotional Intelligence among leaders and their
teams’ performance.
Investigate the components of Emotional Intelligence present among
Construction Leaders in Dubai.
Illustrate the effects of Emotional Intelligence on team performance in Dubai’s
construction industry.
1.4 Research Questions
To achieve the research objectives, the following research questions were
formulated for further guidance.
What is Emotional Intelligence, its components and its importance?
How does Emotional Intelligence impact the leadership capabilities?
Does Emotional Intelligence affect team performance?
How do leaders use Emotional Intelligence to enhance team performance?
Do leaders in construction industry of Dubai possess Emotional Intelligence
competencies?
Does Emotional Intelligence affect team performance in the construction
industry of Dubai?

4 | P a g e Introduction
1.5 Research Outline
The thesis is composed of five chapters to explore answers to the research
questions and achieve the defined objectives. The five chapters are as follows,
Chapter 1 – Introduction: The First chapter sets a scene by providing an overview
about Emotional Intelligence, its influence on leadership abilities, and further
explores how leaders in Dubai play a key role in shaping the emirate. The
construction market in the emirate is a leading industry creating job opportunities and
demand for immigrants. The research focuses to prove the presence of Emotional
Intelligence among Construction Leaders of Dubai and its effect on their teams’
performance. The aim is further narrowed down to research objectives and
eventually research questions.
Chapter 2 – Literature Review: The literature review chapter examines prevailing
theories related to the emotional intelligence and recent developments. Then the
principles of leadership and emotional expression of leaders are reviewed. Followed
by which the link between leadership and emotional intelligence is cross-examined
from earlier theories. This is followed by analysis of team performance and influence
of emotional intelligent leaders on them and the transformation of teams to
emotionally intelligent teams.
Chapter 3 – Methodology: The chapter describes different type of research
methodologies and survey procedures followed for conducting studies. Then, all
major forms of survey techniques are evaluated to selected best possible method for
the dissertation. The chapter further examines major type of emotional intelligence
measurement tools such as Bar-On EQ, Goleman ECI 2.0, MSCEIT, etc. to choose
best suited tool for measuring emotional intelligence in the construction industry of
Dubai. Finally, two types of questionnaires were designed specifically suited to
achieve aim and objectives of the dissertation.
Chapter 4 – Data Analysis and Results: Fourth chapter of the research documents
all the data analysis conducted for three types of construction organisations in Dubai.
The analysis and results are presented in accordance with the objectives of the
research such that firstly the extent of leadership styles in three types of
organisations is examined. Secondly, the presence of 18 emotional intelligence

5 | P a g e Introduction
competencies are analysed in three type of construction firms. Thirdly, the influences
of leadership styles are evaluated for teams in each type of the organisations. Lastly,
the effects of 18 emotional competencies are analysed on teams’ performance in the
three types of organisations.
Chapter 5 – Findings & Discussion: This chapter summarises major findings of the
study and discusses the answers to each research question developed in chapter 1
of the dissertation. The responses to each question is summary of the work and
findings deduced from the extensive research carried out on leadership styles,
emotional intelligence, and team performance in Dubai’s construction industry.
Chapter 6 – Conclusions & Recommendations: Finally, the last chapter of the
dissertation concludes the findings, views, inter-dependencies in a holistic view. The
recommendations from this novel study for the region set basis for numerous future
researches and action plans which can be developed further to raise the profile of
the United Arab Emirates as an emerging knowledge based economy for the world.
6 | P a g e Literature Review
22 LLIITTEERRAATTUURREE RREEVVIIEEWW
The second chapter will discuss 3 different concepts which are emotional intelligence
(EI), leadership, and team performance. The terms are explored in regards to its
theories and concepts. Emotional Intelligence, being the core area of this research
study, is reviewed first for its origin, definitions, different models and its
competencies. Second, the various leadership styles and effect of emotional
intelligence among leaders are examined. Finally, the influence of emotional
intelligence on teams and impact of leadership styles combined with emotional
intelligence are viewed and discussed. Finally, it illustrates the theories on emotional
intelligent teams and their roles in an organisation.
2.1 Emotional Intelligence (EI)
2.1.1 Origin & History
Researchers have been studying emotional expression and related concepts for
more than a hundred years. Scientific publication on EI and related phenomena such
as social intelligence appeared in 1920 (Thorndike, 1920). Subsequent research
concentrated in the ability to identify, understand, regulate and express emotions.
Parallel and intersecting lines of research emerged from this. One line of research
was established in 1990 by Salovey and Mayer, another by Goleman in 1995, and
yet another by Bar-on in 1997. It became a hot topic in poplar literature with the
publication of Goleman’s “Emotional Intelligence: Why it can matter than IQ, 1995”.
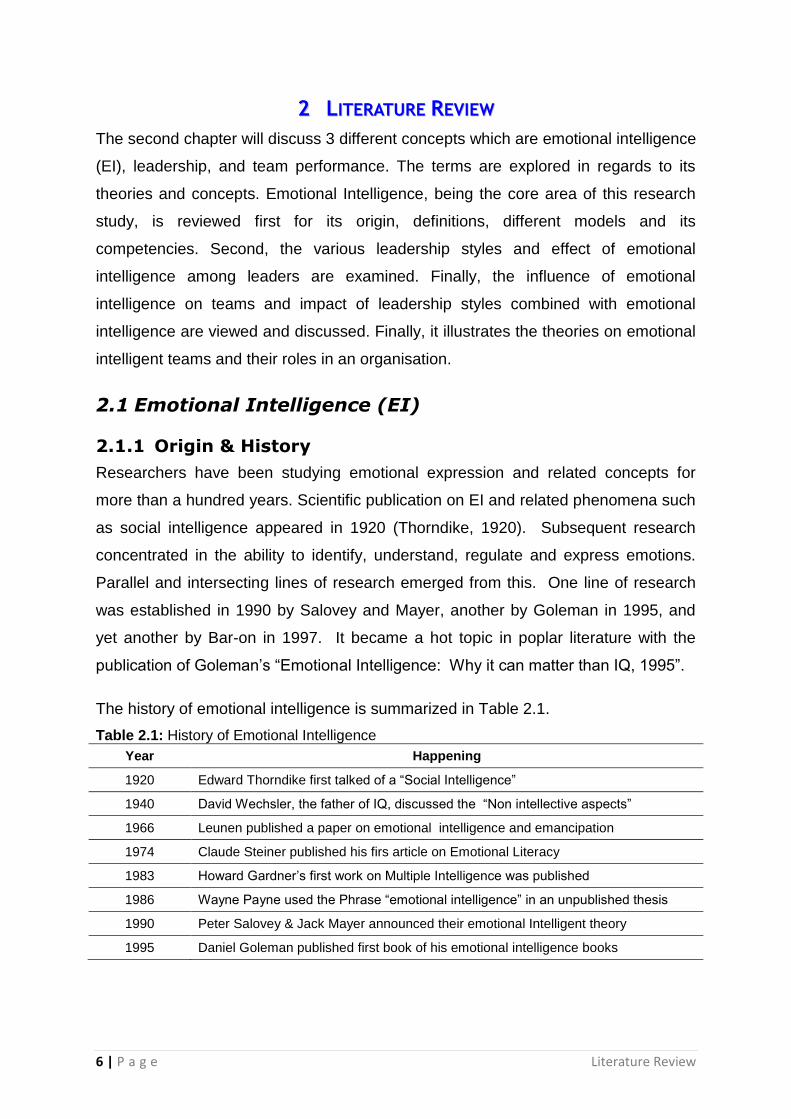
The history of emotional intelligence is summarized in Table 2.1.
Table 2.1: History of Emotional Intelligence
Year Happening
1920 Edward Thorndike first talked of a “Social Intelligence”
1940 David Wechsler, the father of IQ, discussed the “Non intellective aspects”
1966 Leunen published a paper on emotional intelligence and emancipation
1974 Claude Steiner published his firs article on Emotional Literacy
1983 Howard Gardner’s first work on Multiple Intelligence was published
1986 Wayne Payne used the Phrase “emotional intelligence” in an unpublished thesis
1990 Peter Salovey & Jack Mayer announced their emotional Intelligent theory
1995 Daniel Goleman published first book of his emotional intelligence books

7 | P a g e Literature Review
2.1.2 Definitions
US psychologists John Mayer and Peter Salovey first coined the term Emotional
Intelligence in 1990. They defined EI as the "ability to perceive emotions, to access
and generate emotions so as to assist thought, to understand emotions and
emotional meanings, and to reflectively regulate emotions in ways that promote
emotional and intellectual growth”.
In other words, it is a set of skills that enables us to make our way in the complex
world in the personal, social, and survival aspects, the exclusive ability to be
sensitive to and mange our emotions in everyday life. Furthermore, Goleman (1998)
defined emotional intelligence as the capacity for recognizing our own feelings and
those of others, for motivating ourselves, and for managing emotions well in us and
in our relationship.
Like most organizational concepts, different definitions have emerged in the
management literature for the concepts of Emotional Intelligence (EI). Van Rooy
and Viswesvran (2004, p. 72), for example, meta-analyzed the relationship between
EI and performance. They defined EI as “the set of abilities (verbal and non verbal)
that enable a person to generate, recognize, express, understand, and evaluate their
own, and others, emotions in order to guide thinking and action that successfully
cope with environmental demands and pressure”.
According to some scholars, e.g. Johnson and Indvik (1999) and McGarvey (1997) –
the richer the organisation in terms of positive emotions, the higher an employee’s
emotional intelligence is likely to be.
In more scientific terms, emotional intelligence can be defined as an array of non
cognitive skills, capabilities, and competencies that influence a person’s ability to
cope with environmental demands and pressures (Martinez, 1997).
2.1.3 Emotional Intelligence (EI) and Intelligence Quotient
(IQ) - Difference
The idea of different types of intelligences is not new. The psychologist, Thorndike,
defined three types in 1927 (Thorndike et al., 1927). The type that is measured in
IQ tests, that is, understanding and manipulating verbal and mathematical concepts,
he called abstract intelligence. He gave the name of concrete intelligence to the

8 | P a g e Literature Review
understanding and manipulating of objects and shapes. The third type, social
intelligence, was in the area of what we call emotional intelligence. Thorndike
defined it as the ability to understand and relate to people. This is clearly an asset in
any type of teamwork.
Compared to IQ researches, emotional intelligence is still relatively new. However,
recently EI is increasingly being recognized as an important issue in the workplace.
Many studies showed that high IQ does not guarantee a successful life. There is a
surprising finding that IQ is second after emotional intelligence in determining
outstanding job performance (Goleman, 1995; 1998). According to Goleman (1998),
research indicated that emotional competencies (i.e., EI potential that has translated
into practical capabilities) are twice as important as IQ and expertise in contributing
to excellent and effective performance.
EI is an attractive concept because it encapsulates the most powerful of human
abilities that IQ misses. It i the ability to understand how are emotions impact
ourselves and others. Unlike IQ, emotional intelligence can be learned.
2.1.4 Models of Emotional Intelligence
There are two leading models of emotional intelligence. The first was developed by
Peter Salovey and John (Jack) Mayer, what is referred to as an "ability model" of
emotional intelligence. This model views emotional intelligence in a similar way the
psychologists define cognitive intelligence (IQ). Like cognitive intelligence, emotional
intelligence consists of specific abilities, but instead of solving arithmetical equations
or putting together puzzles we recognize emotions in people's faces or understand
the best way to manage someone else's emotion. The MSCEIT has been used in
hundreds of research studies worldwide in order to help understanding the ways in
which emotional intelligence affects people lives.
The ability-based model consists of 4 emotional skills which are:
Perceiving Emotions: The ability to detect and decipher emotions in faces,
pictures, and voices. It also includes the ability to identify one’s own emotions.
Perceiving emotions may represent the most basic aspect of emotional intelligence,
as it makes all the processing of emotional information possible.

9 | P a g e Literature Review
Using Emotions: The ability to harness emotions to facilitate various
cognitive activities, such as thinking and problem solving. We can illustrate
the skills in this branch through a hypothetical scenario. Imagine that you
have to complete a difficult and tedious assignment requiring comprehensive
reasoning and attention to detail in a short amount of time; would it be better,
as far as completing the task goes, to be in a good mood or in sad moods.
Being in a slightly sad mood help people conduct careful, methodical work.
Conversely, a happy mood can stimulate creative and innovative thinking
(e.g., Isen, Johnson, Mertz, & Robinson, 1985). The emotionally intelligent
person can capitalize fully upon his or her changing moods in order to best fit
the task at hand.
Understanding Emotions: The ability to comprehend emotions language
and to appreciate complicated relationships among emotions. For example,
understanding emotions encompasses the ability to be sensitive to slight
variations between emotions, such as the difference between happy and
ecstatic. Furthermore, it includes the ability to recognize and describe how
emotions evolve over time, such as how shock can turn into grief.
Managing Emotions: The ability to regulate emotions in both ourselves and
in others. Everyone is familiar with times in their lives when they have
temporarily, and sometimes embarrassingly, lost control of their emotions.
The fourth branch also includes the ability to manage the emotions of others.
For example, an emotionally intelligent politician might increase her own
anger and use it to deliver a powerful speech in order to arouse righteous
anger in others. Therefore, the emotionally intelligent person can harness
emotions, even negative ones, and manage them to achieve intended goals.
A second model, by psychologist Reuven Bar-On, who coined the term EQ (for
emotional quotient) – to parallel the more commonly known IQ – was developed in
the late 1980s and early 1990s. It is widely agreed that it involves the ability to
understand and manage emotions. Broadly speaking, emotional intelligence
addresses the emotional, social, and survivor dimensions of intelligence. These are
often more important for daily functioning than the more cognitive or intellectual
aspects of intelligence. Emotional intelligence is concerned in understanding oneself
10 | P a g e Literature Review
and others, relating to people, and adopting to and coping with the immediate
surroundings.
According to Bar-on (1997) five factors of EI contribute to success in life:
interpersonal skills
Adaptability: this is a personal EI competency applied in a team context. If
you have rigid beliefs then these will adversely impact the way you listen and
respond to your colleagues. EI requires people to enquire into their personal
development in order that, they stay open to new opportunities and manage
change positively.
Assertiveness: assertiveness is a direct complement to adaptability. It is
about being able to set and maintain boundaries, about engaging in direct and
honest communication and about knowing for what one stands, individually
and as a team. It is about being respectful and clear in all interactions.
Empathy: within a team setting this is about attending to people’s emotional
cues. Empathy is not about getting into somebody’s hole with them; rather it is
about developing that capacity to step into someone else’s shoes, see what
their experience is like and so build genuine understanding.
Influence: it is about individual team members behaving in ways that
enhance relationships both inside and outside the team. Strong relationships
are critical when the team has to face new challenges and EI underpins the
trust, support and understanding that the team will need when managing
change.
Emotional intelligence includes self-awareness and impulse control, persistence,
zeal and motivation, empathy and social deftness. These are the qualities that mark
people who excel: whose relationships flourish, who are stars in the workplace.
2.1.5 Emotional Competencies
The Goleman theory of EI is based on the emotional competencies of the person.
The EI competency is the talent to know, interprets, and adapts the information of
the person’s emotions and others, which will lead to high achievements.
11 | P a g e Literature Review
Goleman’s (1998) first model of EI identified 5 components, including 25
competencies. The five components consist of two parts, the first part focus on the
personal competencies which are “self-awareness, self-regulation, and motivation”.
The second part focuses on social competencies which are, “empathy and social
skills”,
A statistical study by Richard Boyatzis (2000) supported convergence of twenty five
competencies into twenty, and the five domains into the four: Self-Awareness, Self-
Management, Social Awareness, and Relationship Management (Boyatzis,
Goleman, & Rhee, 2000).
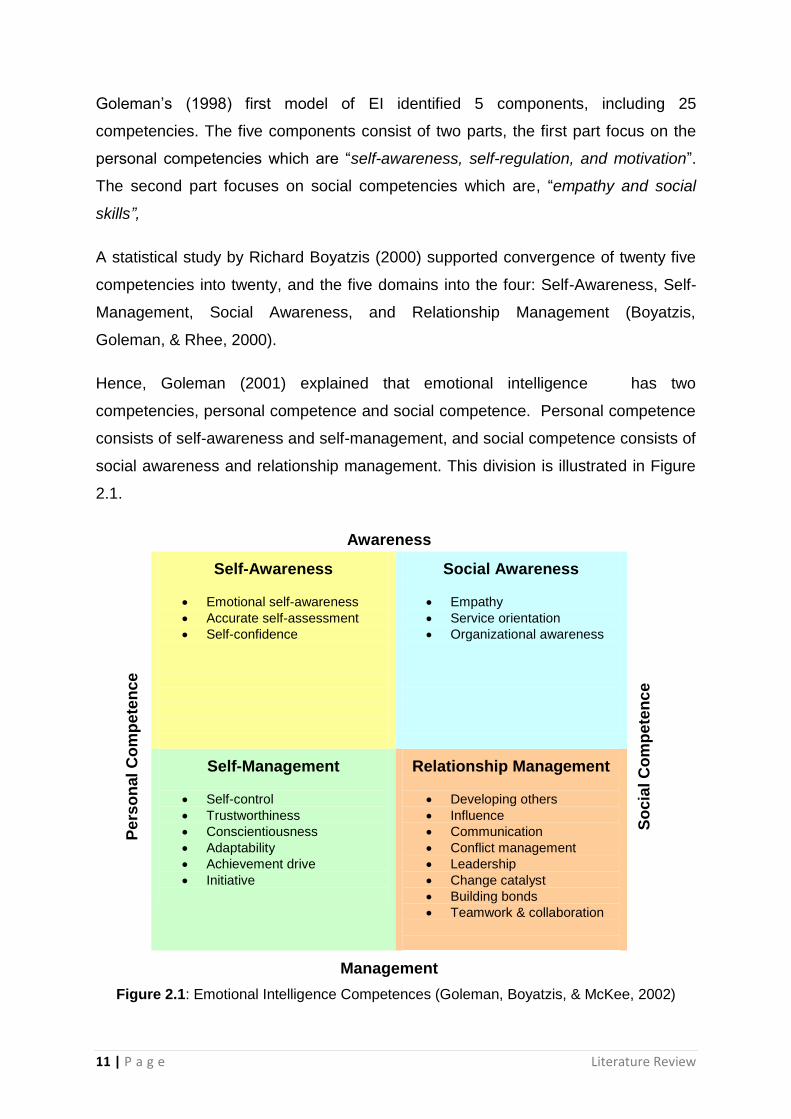
Hence, Goleman (2001) explained that emotional intelligence has two
competencies, personal competence and social competence. Personal competence
consists of self-awareness and self-management, and social competence consists of
social awareness and relationship management. This division is illustrated in Figure
2.1.
Pe
rso
nal
Co
mp
ete
nce
Awareness
So
cia
l C
om
pe
ten
ce
Self-Awareness
Emotional self-awareness
Accurate self-assessment
Self-confidence
Social Awareness
Empathy
Service orientation
Organizational awareness
Self-Management
Self-control
Trustworthiness
Conscientiousness
Adaptability
Achievement drive
Initiative
Relationship Management
Developing others
Influence
Communication
Conflict management
Leadership
Change catalyst
Building bonds
Teamwork & collaboration
Management
Figure 2.1: Emotional Intelligence Competences (Goleman, Boyatzis, & McKee, 2002)

12 | P a g e Literature Review
Each competence needs to be explored further because the elements are similar to
leadership traits and effective team management. The elaboration of these
competencies will prove a clear link between emotional intelligence, leadership and
its influence on team performance. The following four competencies are discussed
further,
1. Self-Awareness
2. Self-Management
3. Social Awareness
4. Relationship Management
2.1.5.1 Self-Awareness
Self-awareness means knowing one's feelings at the given moment and using it for
decision-making. It is normally known as intuition. It consists of emotional
awareness (recognizing one's emotions and their effects), accurate self-assessment
(knowing one's strength and limit), and self confidence (a strong sense of one's self
worth and capabilities).
People with strong self-awareness are realistic – neither overly self-critical nor
naively hopeful. Rather, they are honest with and about themselves.
Intuition, that essential leadership ability to apply not just technical expertise but also
life wisdom in making business decisions, comes naturally to the self-aware leader.
The reason why an intuitive sense should have any place in business today, is
because attuning to our feelings, according to neurological research, helps us find
the meaning in data, and so leads to better decisions. The emotional memory banks
thus enable to judge information efficiently (Kline, H.J. et al., 1999). Hence, as
proven by science, emotions are part of rationality, not opposed to it.
2.1.5.2 Self-Management
Self-management is the ability to regulate distressing factors such as anxiety and
anger to restrain emotion impulsivity. Competencies of self-management are as
follows,
emotional self-control (keeping disruptive emotions and impulses in check),
trust worthiness (maintaining standard of honesty and integrity),

13 | P a g e Literature Review
conscientiousness (taking responsibilities for personal performance)
adaptability (flexibility in handling change),
achievement drive (strive to improve or meet a standard of excellence), and
Initiative (innovativeness and readiness to act on opportunities).
Without knowing what one is feeling, the person cannot mange his feeling. However,
feeling tend to control the behaviour of the person. This is acceptable, for good
feelings like eagerness to overcome an obstacle.
Leaders who has positive mental attitude, remain positive and determined, in difficult
time. By managing their feelings, they create a very good working atmosphere of
trust; comfort (Goleman, 2002).
Self-management also enables transparency, which is not a leadership virtue but
also an organizational strength (Kolb, D.A, et al., 2001).
2.1.5.3 Social-Awareness
With social awareness a person can recognize other's feelings. A person with this
ability can read non verbal cues for emotional current from others which are critical
for job performance when the focus is on interactions with people. Social
awareness competences are empathy (understanding other's feeling and
perspectives, taking an active interest in their concern and cultivating opportunities
through them), service orientation (anticipating, recognizing, and meeting customer's
needs), and organizational awareness (reading a group's emotional currents and
power relationships).
Empathy is a necessary ingredient of leadership. By focus on how team members
feel, a leader can take proper action that is relevant to the situation. Empathy that
includes listening and taking the point of views of the team members will give leaders
the opportunity to strengthen the ties between the leader and the team.
2.1.5.4 Relationship Management
Relationship management is the skill to attune oneself to or influence the emotions of
another person. The competencies of relationship management are developing
others (sensing other's developmental needs and bolstering their abilities),
influence(welding effective tactics for persuasion), communication (listening openly

14 | P a g e Literature Review
and sending convincing messages), conflict management (negotiating and resolving
disagreements), visionary leadership (inspiring, guiding and commitment to
individuals and groups), change catalyst (initiating or managing change), building
bonds (nurturing instrumental relationships) and teamwork and collaboration
(working with others towards shared goals).
Nowadays, leadership turn out to be more dynamic and team oriented. Therefore,
relationship talent become more important and organisations need leaders with such
skills. In other words, organisation needs leaders who work closely with their peers
and cross-functional teams to align goals, strategy, marketing, etc. Relationship skills
allow leaders to put their emotional intelligence to work
2.2 Leadership
Hemphill and Coons (1957) defined the term “leadership” as “the behaviour of an
individual…directing the activities of a group toward a shared goal.” Burns (1978)
stated that “Leadership is exercised when persons…mobilize…institutional, political,
psychological and other resources to arouse, engage, and satisfy the motives of
followers.”
Latest definitions of the term “leadership” are the “person’s ability to influence,
motivate, and enables others to contribute toward the effectiveness and success of
the organization…” (House, Hanges, Ruiz-Quintanilla, Dorfman, Javidan, Dickson, &
Associates, 1999).
2.2.1 Leadership Traits
Leadership originally was thought to be inherent in an individual and it was argued
that leaders were born not made (Bass, 1990). Traits such as self-confidence,
integrity, intelligence and a sense of humour were among those found to be
associated with effective leaders (Kenny and Zacarro, 1983).
Today, we recognize that personal attributes of leaders do explain some variance in
whether a person will emerge as a leader (Kenny and Zacarro, 1983) or whether a
leader will acquire the necessary skills to be effective (Kirkpatrick and Locke, 1991).
Some traits identified with effective leadership are related to emotion. Important
emotional traits include emotional balance and control (Bass, 1990) and emotional
intelligence (Goleman, 1998). Additionally, expression of emotion can provide data to
15 | P a g e Literature Review
followers who may then infer certain traits such as self-confidence, integrity, or loss
of control.
In addition to leader traits associated with emotional expression, there are emotional
behaviours. Contingency theories of leadership argue that choosing appropriate
behaviours are contingent upon characteristics of the situation have significant
impacts on individual, group, and organizational outcomes (Bass, 1990; House,
1968). In a specific organizational context, choosing appropriate emotions to express
reflects a leader's ability to respond in an effective way.
2.2.2 Leadership Styles & EI Competencies
According to the University of Michigan 3 important qualities of effective leaders
were found:
1. “Task-oriented behaviour”,
2. “Relation-oriented behaviour”
3. “Participative leadership”.
The studies showed that the effective “task-oriented managers” use his time wisely
in planning and coordinating the different activities. In addition, these types of
managers give some time to guide their team in defining what is to be done, and
when.
“Effective relationship-orientated managers” is demonstrating high level of assisting
the team with their problems (both career and personal problems), Effective
“relationship-oriented managers” guide the team in goal setting.
The third quality is, “participative leadership” described the role of the leader as a
“facilitator of teamwork and collaboration” (Katz, Maccoby, & Morse, 1950; Katz &
Kahn, 1952; Likert, 1961, 1967).
Six different leadership styles were proposed by Goleman, Boyatzis, & McKee
(2002) in relation to (EI) competencies. Goleman, et al. (2002) identifies leadership
style as either “resonant or dissonant”. Resonant styles include “visionary, affiliative,
democratic, and coaching styles”. Visionary leaders are described as “empathic, self-
confident, and often act as agents of change”. Affiliative leaders, “exhibit empathy

16 | P a g e Literature Review
while demonstrating strengths in building relationships and managing conflict”. The
democratic leader “encourages collaboration and teamwork and communicates
effectively”. The coaching leader tends to be “emotionally self-aware, empathic, and
skilled at identifying and building on the potential of others”.
In Contrast, “dissonant leadership styles”, including “coercive and pace-setting”
leaders, tend to degrade organizational climate over time. The coercive leader
depends on his official power to execute organisational goals. Typically the coercive
leader shows a lack of empathy. The pacesetting leader, by contrast, put high
standards and exemplifies them. However, the pacesetting leader some times
practice micromanagement or criticize team members who made a mistake rather
than assisting them to get better (Goleman, et al., 2002). Table 2.2 identifies the
leadership styles and links to EI Competencies described earlier.
Table 2.2: Leadership styles and EI Competencies (Goleman, et al., 2002)
Leadership Styles EI Competencies
Visionary Self-confidence; empathy; change catalyst
Coaching Developing others; empathy; emotional self-awareness
Affiliative Empathy, building bonds, conflict management
Democratic Collaboration; team leadership; communication
Pacesetting Conscientiousness; drive to achieve; initiative
Commanding Drive to achieve, initiative, emotional self-control
The research by Goleman (2002) indicates that there are six common and important
styles of leadership, each of which has a very distinctive impact on organisation and
teams.
Visionary: It has a strongest positive impact, which helps shifting people thinking
toward shared vision or goal. This type of leadership style is recommended to be
used when organisation changes require a new vision, or when a clear direction is
needed.

17 | P a g e Literature Review
Coaching: This style has a highly positive impact because it connects what a person
wants with the organisation’s goal. Thus, it is most effective to help an employee
improve performance by building long- term capabilities.
Affiliative: It impacts positively and creates harmony by connecting people to one
another. It is recommended to be applied to heal rifts in a team or motivate during
stressful items.
Democratic: It positively impact by valuing people’s input and getting their
commitment through participation. It is used to build buy-in or consensus, or get
valuable input from employees.
Pace-setting: This type of style is often misused so it may have a highly negative
impact. However, helps meet challenging and exciting goals. It can be effective to
get high quality results from a motivated and competent team.
Commanding: This leadership style is also misused so it may have a negative
impact. Although, it helps sooth fears by giving clear direction in an emergency. It is
applied to kick-start a turnaround strategy, or with a problem employee.
2.2.3 Emotional Intelligence & Leadership
Leaders can be found at all levels of employment, and at the very least, all managers
are expected to be leaders. Yet managerial status does not guarantee leadership.
Leadership is a necessary component of and a filter for successful management.
Effective managers demonstrate leadership capabilities. Leadership attributes are
well captured in measures of emotional intelligence (EQ). Hence, leadership can
improve if managers work to develop their EQ (Goleman, et al., 2002).
Much has been written about the link between leadership and emotional intelligence
(EI), from Daniel Goleman (1998a; 1998b), to studies by the Centre for Creative
Leadership and The Consortium for Research on EI in Organizations, to Stephen
Covey (1989), Jack Welch (2004), and the Harvard Business Review (2003). World-
leading organizations from American Express to Federal Express, from the U.S. Air
Force to Sheraton, are experimenting with emotional intelligence as a component of
competitive advantage.

18 | P a g e Literature Review
A global community of emotional intelligence practitioners has emerged, with
consultants, researchers, trainers, and coaches implementing emotional intelligence
training in all sectors of society. Google shows some 1.3 million links to the two
keywords leadership and emotional intelligence combined (and a similar number of
links to the keywords management and emotional intelligence combined).
There is growing evidence that the range of capabilities that constitutes EI plays a
key role in determining success in life and in the workplace. The Harvard Business
Review (HBR) has published several articles on emotional intelligence. In April 2003,
it reported: “In hard times, the soft stuff often goes away. But emotional intelligence,
it turns out, isn’t so soft. If emotional obliviousness jeopardizes your ability to
perform, fend off aggressors, or be compassionate in a crisis”.
Emotional intelligence isn’t a luxury you can dispense with in tough times. It’s a basic
tool that, deployed with finesse, is the key to professional success. Goleman,
Boyatzis, and McKee (2002) stressed the importance of empathic listening and
resonance and self-awareness when displaying leadership. According to these
authors, empathic listening and resonance is viewed as the ability of leaders. To
perceive and influence the flow of emotions (including motivational states) between
themselves and others they work with, while self-awareness can be described as the
ability to perceive and moderate the effect one is having on others.
Sosik and Megerian (1999) found empirical support for the importance of self-
awareness and noted that emotional intelligence is the foundation of leadership.
According to Cooper (1997), trustworthiness is an important element in a leader’s
makeup, as it is related to innovation and creativity. Miller (1999) believes that many
managers fail because they are too rigid and have poor relationships. The list of
attributes is lengthy, and empirical support is growing. Although different models for
working with and measuring emotional intelligence (EQ) exist, measured EQ
components align closely with the characteristics attributed to leadership and good
management. Hence, the claim is made that leadership will improve if managers
work to develop their EQ. It is within this context that we look at the EQ performance
of a large composite group of employees across different levels in their respective
organizations.

19 | P a g e Literature Review
During the last decade interpersonal skills have become more integral to effective
leadership (Goleman, 1988a). Where leaders were once seen to control, plan and
inspect the overall running of an organisation, in today’s more service-oriented
industries, leadership roles are also to motivate and inspire others, to foster positive
attitude at work, and to create a sense of contribution and importance with and
among employees (Hogan et al., 1994). These contemporary leadership
requirements have placed new demands on leadership training program to develop
these skills in evolving leaders and on organisation involved in leadership selection
to identify them in potential candidate (Fulmer, 1997).
As a result research has been exploring the underlying attributes and behaviours of
leaders who successfully perform these contemporary leadership roles in order to
identify leadership selection and training criteria for the recruitment and development
of effective leaders (Church and Waclawski, 1998; Pratch and Jacobbowitz, 1998;
Ross and Offerman, 1997; Sternberg, 1997).
Exactly how, and to what extent EI accounts for effective leadership is currently
unknown. Despite much interest in relating EI to effective leadership there is little
research published that has explicitly examined this relationship. Popular claims
regarding the extent to which EI accounts for effective leadership skills are at present
misleading. or example, one search firm claims “Emotional Intelligence accounts
for more (than 85 percent of exceptional performance in top leaders” (Hay Group,
2000).
Emotionally intelligent leaders are thought to be happier and more committed to
their organisation (Abraham, 2000), achieve greater success (Miller, 1999), perform
better in the workplace (Goleman, 1998a, b; Watkin 2000), take advantage and use
positive emotions to envision major improvements in organisational functioning
(George, 2000), and use emotions to improve their decision making and instil a
sense of enthusiasm, trust and cooperation in other employees through interpersonal
relationships (George, 2000).
Emotional intelligence is a combination of skills, attitudes and habits that can be
developed to improve person’s personal performance and our relationship with
others. And high emotional intelligence has been shown to be a real indicator of

20 | P a g e Literature Review
performance in leadership. Indeed, Warren Bennis, the leadership guru, recognises
the value of EI in leadership:
“In that field I have studied, Emotional Intelligence is much more powerful than IQ in
determining who emerges as a leader” Warren Bennis on Becoming a leader.
2.3 Significance of EI in Organisation
Emotional intelligence provides a lot of benefits for individuals as well as
organizations. Nevertheless the study of emotional intelligence in the construction
environment is very rare. In 2002, an Australian consulting company, Learning
Dimensions, set out to determine what tangible commercial benefits could be
achieved from having a workforce that was highly emotionally intelligent.
According to Diggins (2004) EI helps people to
Be aware of their interpersonal style
Recognize and manage the impact of emotions on their thoughts and
behaviour
Develop their ability to judge social dynamics in the workplace; and
Understand how well they manage relationships and how to improve
Diggins (2004, p.34) suggested that EI is the key to effective performance and to
staying ahead of the pack at times of organisational change.
In partnership with Swinburne University, Learning Dimensions used scientifically
valid instruments to measure EI and a number of other factors that contributed to the
workplace performance. The finding drawn from a study of 80 employees from four
organizations in Melbourne, show that people high in emotional intelligence have:
Lower absenteeism from work
Better psychological health
Higher commitment to the organization
Clearer role boundaries

21 | P a g e Literature Review
Higher level of responsibility for the activities and work performance of direct
reports
Are generally most satisfied at work
More regularly seek support when coping with stressful situation at work.
According to Mike Bagshaw (2000), when people in the workplace do not act with
emotional intelligence the cost can be great. Low morale, bitter conflict, and stress
all limit business effectiveness. There is also the financial cost of litigation when
people complain of being bullied, intimidated, and exploited. Emotional intelligence
also contributes in a positive business enhancing way, improving team working,
customer service and the managing of diversity
According to Pamela R. Johnson and Julie Indvik (1999), when emotional
intelligence is present, there is increased employee cooperation, increased
motivation, increased productivity and increased profit.
Lately, Emotional Intelligence (EI) is increasingly being recognized as an important
issue in the workplace. Research has shown that for an individual to be a star
performer in every field, EI is twice as important as IQ becomes more important as a
person assumes responsibilities in higher level of organization management
(Goleman, 1998). Carmeli (2003) revealed emotionally intelligent senior managers
will perform better on their job compared to the ones with lower EI.
Where EI is present studies have shown that a significant part of an organisation’s
profitability is linked to the quality of its work life, which is based largely on trust and
loyalty within the organisation, and with outside people, such as customer and
suppliers.
Organizations has shifted to a more team-based workplace, they are asking
employees for commitment and passion-to bring both their brains and hearts to the
job. Along with this, organisations have to expect people to bring their emotions to
work too (McGarvey, 1997). Emotional intelligence is the hidden advantage. If you
take care of the soft stuff, the hard stuff will take care of itself. As leaders worldwide
22 | P a g e Literature Review
are discovering, attention to emotions has been shown to save time, expand
opportunities, and focus energy for better results (Cooper, 1997).
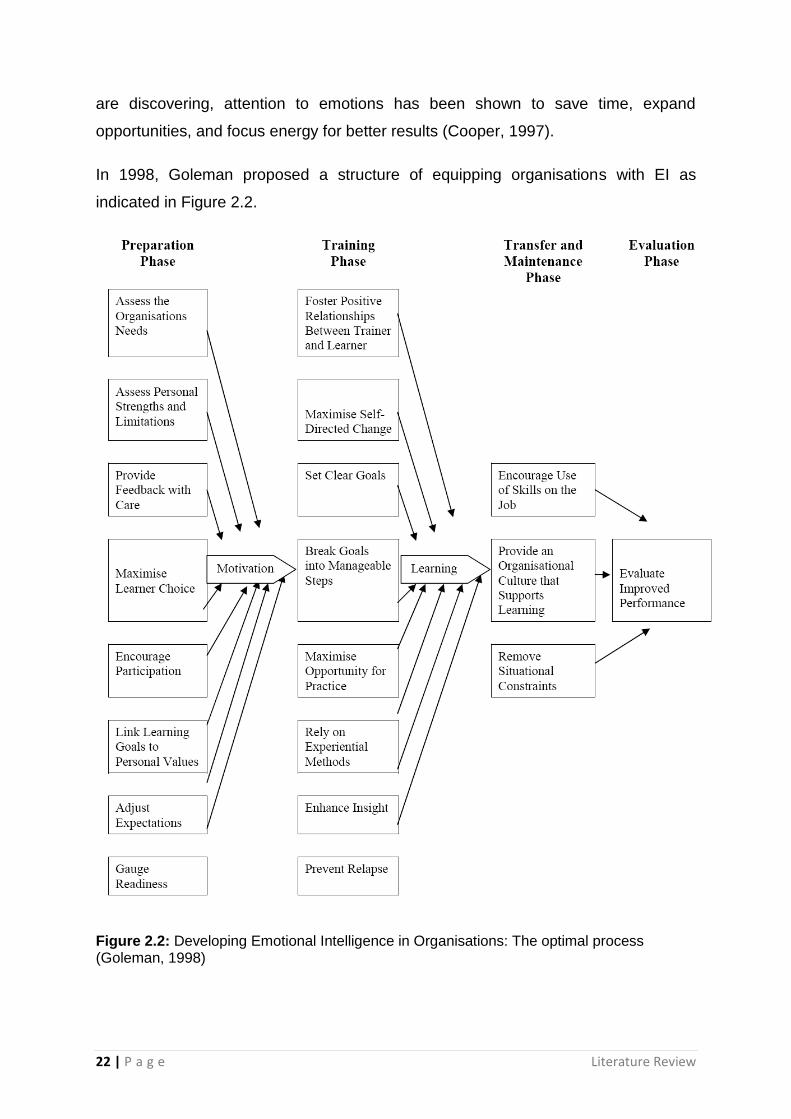
In 1998, Goleman proposed a structure of equipping organisations with EI as
indicated in Figure 2.2.
Figure 2.2: Developing Emotional Intelligence in Organisations: The optimal process (Goleman, 1998)

23 | P a g e Literature Review
Martinez (1997) suggests that an individual‘s success at work is 80 percent
dependent on emotional intelligence, and only 20 percent dependent on IQ.
According to Cliona Diggins and Pearn Kandola (2004), in organisations, the
inclusion of emotional intelligence in training programs has helped employees to co-
operate better and be more motivated, thereby increasing productivity and profits.
For example, one study concluded that experienced partners in a multinational
consulting firm, who have above average scores on emotional intelligence factors,
delivered $1.2 million profit from their accounts than other partners.
2.4 Impact of Leader’s EI on their Teams
In the past, a boss probably could ignore his employees’ emotional lives: workers
were, in effect, told to leave their emotions at home and most of them complied.
This is no longer the case. In fact, from kindergarten to business schools to
corporations across the country, people are taking seriously the idea that a little
more time spent on the “touchy-feely” skills so often derided may, in fact, pay rich
dividends (Gibbs, 1995).
Leader behaviours and traits have been proposed and found to have an influence on
leader/follower relationships (Meindl et al., 1985). Leaders who use emotion
appropriately to communicate, or who demonstrate better knowledge of their own
emotions and those of others, are argued to perform at a higher level (Goleman,
1998)
The experience of followers as they observe emotional expression in leaders is
proposed to have a direct effect on their perception of a leader's effectiveness.
Followers associate certain emotions expressed as representing desirable or
undesirable traits. For example, a leader expressing sadness may be perceived as
lacking self-confidence, a trait consistently associated with effective leaders
(Kirkpatrick and Locke, 1991).
In addition to emotions as indications of traits, followers evaluate emotional
expression according to social and role norms for leader behaviours (Rafaeli and
Sutton, 1987, 1989, 1990; Sutton, 1991; Sutton and Rafaeli, 1988). In the role of a
CEO level leader, anger has often been associated with strong leadership (Bass,

24 | P a g e Literature Review
1990). However, anger may indicate lack of emotional control, which Goleman
(1998) found to be consistently related to leader ineffectiveness. The specific
consequences of expressing negative emotions on evaluation of leader effectiveness
have yet to be explored. In previous studies, it is anticipated that expression of
emotions in general will be considered to represent poor judgement on the part of
the leader. This is due primarily to the fact that expressing anger and sadness will be
perceived as outside of leader role norms (Rafaeli and Sutton, 1987), representing a
lack of emotional control (Goleman, 1998), and signifying a lack of self-confidence
(Kirkpatrick and Locke, 1991). When participants observe these role-violating
emotions, it is anticipated that they will perceive the leader to be less effective.
2.4.1 Leader's Emotional expressions to their Teams
Emotions expressed by leaders may vary from positive to negative (Larsen and
Diener, 1992; Watson and Tellegen, 1985). However, leaders often express positive
emotions such as enthusiasm (active positive). Thus, when team-members observe
and experience the emotional expression of a leader, they may be emotionally
influenced through emotional contagion (Hated et al., 1994). There are three ways in
which an individual can `catch' another's emotion, which are as follows
1. conscious cognitive processes,
2. conditioned or unconditioned emotional responses, and
3. Mimicry / feedback.
Conscious cognitive processing occurs when individuals empathize with someone
who is expressing an emotion, actually attempting to internalize and feel the emotion
expressed (Davis, 1996). Transmission of emotion through this cognitive process
varies based on a variety of factors related to the sender and receiver of the
emotion. Team-members may empathize with a leader expressing an emotion they
cognitively interpret as appropriate.
On the other hand, team-members may respond emotionally (conditioned or
unconditioned) without empathy based on prior similar emotional experiences.
Thirdly, team-members could mimic the leader expressing emotion.

25 | P a g e Literature Review
Any of the above mechanisms could occur in the leader and team-members
situation. However, extensive research into the cognitive experience of emotion
supports the cognitive processing process (e.g., Arnold, 1970; Izard, 1977;
Schachter, 1970). Literature indicates that experienced emotion has elements of
physiological (Langeand James, 1922), behavioural (Izard, 1977), and cognitive
processes (Arnold, 1970; Izard et al., 1984; Schechter, 1970).
Early emotion theorists Lange and James (1922) believed that it was the perception
and assessment of an event that initiated an emotional experience. Experiences are
often perceived instinctively, but primarily cognitively as social and environmental
context is interpreted (Crawford et al., 1992; Schachter and Singer, 1962). When a
person observes emotional expression in others, he/she cognitively processes the
information surrounding the experience, and the result is emotional contagion (Frijda,
1986; Hatfield et al., 1994). Thus, the emotion of a team-member is proposed to be
influenced by the leader's emotional display.
This emotional experience is of interest because positive and negative emotions or
moods at work have been shown to impact important employee outcomes, including
absenteeism and satisfaction (George, 1989; George and Jones, 1997; Staw et al.,
1994).
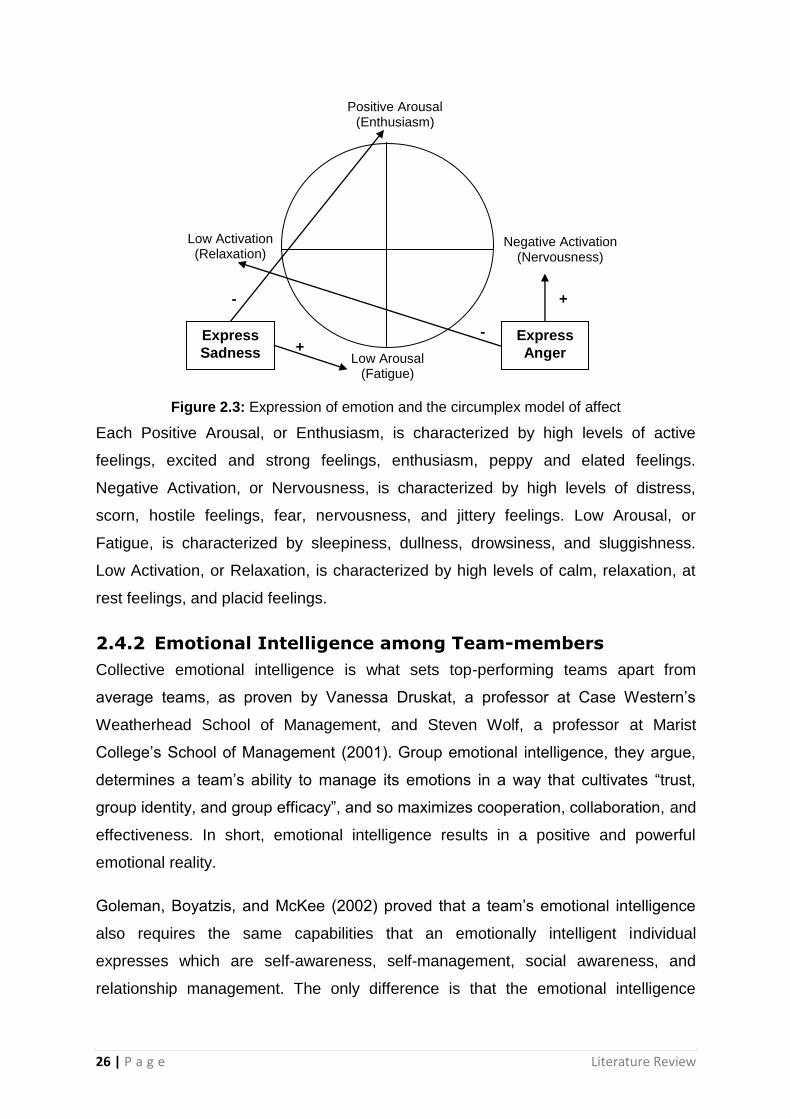
Team-members' affective responses can be described using the circumplex model of
affect (Larsen and Diener, 1992). In the circumplex model of affect, positive and
negative emotion can vary from active to passive. Burke et al. (1989) identify the four
variations on this model, which are positioned around the circumplex of affective
experience as shown in Figure 2.2.
1. Positive Arousal,
2. Negative Activation,
3. Low Arousal, and
4. Low Activation,
26 | P a g e Literature Review
Figure 2.3: Expression of emotion and the circumplex model of affect
Each Positive Arousal, or Enthusiasm, is characterized by high levels of active
feelings, excited and strong feelings, enthusiasm, peppy and elated feelings.
Negative Activation, or Nervousness, is characterized by high levels of distress,
scorn, hostile feelings, fear, nervousness, and jittery feelings. Low Arousal, or
Fatigue, is characterized by sleepiness, dullness, drowsiness, and sluggishness.
Low Activation, or Relaxation, is characterized by high levels of calm, relaxation, at
rest feelings, and placid feelings.
2.4.2 Emotional Intelligence among Team-members
Collective emotional intelligence is what sets top-performing teams apart from
average teams, as proven by Vanessa Druskat, a professor at Case Western’s
Weatherhead School of Management, and Steven Wolf, a professor at Marist
College’s School of Management (2001). Group emotional intelligence, they argue,
determines a team’s ability to manage its emotions in a way that cultivates “trust,
group identity, and group efficacy”, and so maximizes cooperation, collaboration, and
effectiveness. In short, emotional intelligence results in a positive and powerful
emotional reality.
Goleman, Boyatzis, and McKee (2002) proved that a team’s emotional intelligence
also requires the same capabilities that an emotionally intelligent individual
expresses which are self-awareness, self-management, social awareness, and
relationship management. The only difference is that the emotional intelligence
Negative Activation (Nervousness)
Low Activation (Relaxation)
Low Arousal (Fatigue)
Positive Arousal (Enthusiasm)
Express
Anger
Express
Sadness
-
+ -
+

27 | P a g e Literature Review
competencies relate to individuals and team as a whole. Teams have moods and
needs, and they act collectively similar to an individual.
As is true with individuals, in teams each of the emotional intelligence abilities build
on one another in practice, becoming a kind of continuum. In other words, when
team members begin to practice self-awareness, noticing the group’s mood and
needs, they tend to respond to one another with empathy, the very act of showing
one another empathy leads the team to create and sustain positive norms and
manage its relationships with the outside world more effectively. At a team level,
social awareness, especially empathy is the foundation that enables a team to build
and maintain effective relationships with the rest of the organisation.
Self-aware Team: A team expresses its self-awareness by being mindful of
shared moods as well as of the emotions of individuals within the group. In
other words, members of a self-aware team are attuned to the emotional
undercurrents of individuals and the group as a whole. They have empathy for
each other and there are norms to support vigilance and mutual
understanding. Team self-awareness might also mean creating norms such
as listening to everyone’s perspective, including that of a lone dissenter
before a decision is made.
Self-managed Team: A key element of such teams is that team-members will
practice positive norms over and over again. Thus, when core values and
norms are clear to people, a leader does not even need to be physically
present for the team to run effectively. This is mostly applicable to thousands
of managers who work with virtual teams, and whose team members are
located all over the globe. So, team self-management is everyone’s
responsibility. It takes a strong, emotionally intelligent leader to hold the group
to the practice of self-management, especially for teams not accustomed to
proactively handling emotions and habits.
Hence an emotionally intelligent team then has the collective equivalent of empathy,
the basis of all relationship skills. It identifies other key groups in the organization
(and beyond) that contribute to the team’s success, and it takes consistent action to
foster a good working relationship with those groups.

28 | P a g e Methodology
33 MMEETTHHOODDOOLLOOGGYY
This chapter elaborates on the approach adopted to achieve the aim and objectives
of the research. First, different research methodologies are discussed. Secondly
major data collection methods are illustrated. Next, the reasons for selecting the
proper research methodology and data collection methods are given. Then the
literature and market research is provided to illustrate the available measurement
tools for emotional intelligence. Moreover, the section further defines the elements of
measurement, which will be covered in this dissertation and based on which the
questionnaire is selected.
3.1 Review of Possible Research Methodologies:
Research can be conducted within three main paradigms. These are quantitative,
qualitative and critical social science paradigm (Neuman, 2000; Bryman, 20004).
The first two paradigms are the most frequently used approaches in research. The
critical social science paradigm is rather a philosophy about the purpose of research
than a methodology. This philosophy of the critical social science paradigm is that
any approach (e.g. qualitative or quantitative) is acceptable as long as it contributes
to the ideal of improving the quality of society (Neuman, 2000; Bryman, 2004).
Qualitative and quantitative approaches to research are often positioned as opposing
approaches. Although there is no rule that only one approach may be used in
research, researchers usually embrace only one of the two.
The difference in approach by quantitative and qualitative researchers with regard to
alternative research perspectives (ontology, epistemology and methodology) is
described in Table 3.1.

29 | P a g e Methodology
Table 3.1: Differences between the quantitative and qualitative research paradigms Research Perspectives Quantitative Paradigm Qualitative Paradigm
Ontology The nature of reality and nature behaviour
Believes in an objective reality that can be explains, controlled and predicted by natural cause-effect laws Human behaviour can be explained in casual, deterministic ways
Discard the external objective reality. Tries to understand reality by discovering meaning that people in specific settings attach to it. Behaviour is intentional and creative and it can be explained, but not predicted.
Epistemology The relationship of researchers to reality and the road that they will follow in the search of the truth
Researcher sees him/herself as detached from the object of the study. The researcher is therefore objective. She/he doesn’t influence the objects of the study and is not influenced by it.
The researchers is subjective because she/he interacts with the subject
Methodology Knowing how scientific methods and techniques employed obtain valid knowledge
Emulates natural science. Hypotheses are postulated and tested in order to verify them.
Research is dialectical and interpretative. Qualitative methods are used to uncover the world of the subject.
Source: Schurink (1998); Mouton & Marais (1996)
3.1.1 The qualitative and the quantitative approaches
Qualitative research is language based and conceptualised through observation of
social reality. It describes people in their natural habitat. Quantitative research
refers to frequencies, concepts, variables and measurement of people’s perceptions
and opinions. Qualitative research may normally start with an ‘open’ agenda and is
led by the evidence to a conclusion. In contrast, quantitiave is either supported or
not supported by empirical evidence during the research. Schrink (1988:241)
describes the differences between the two approaches in Table 3.2.
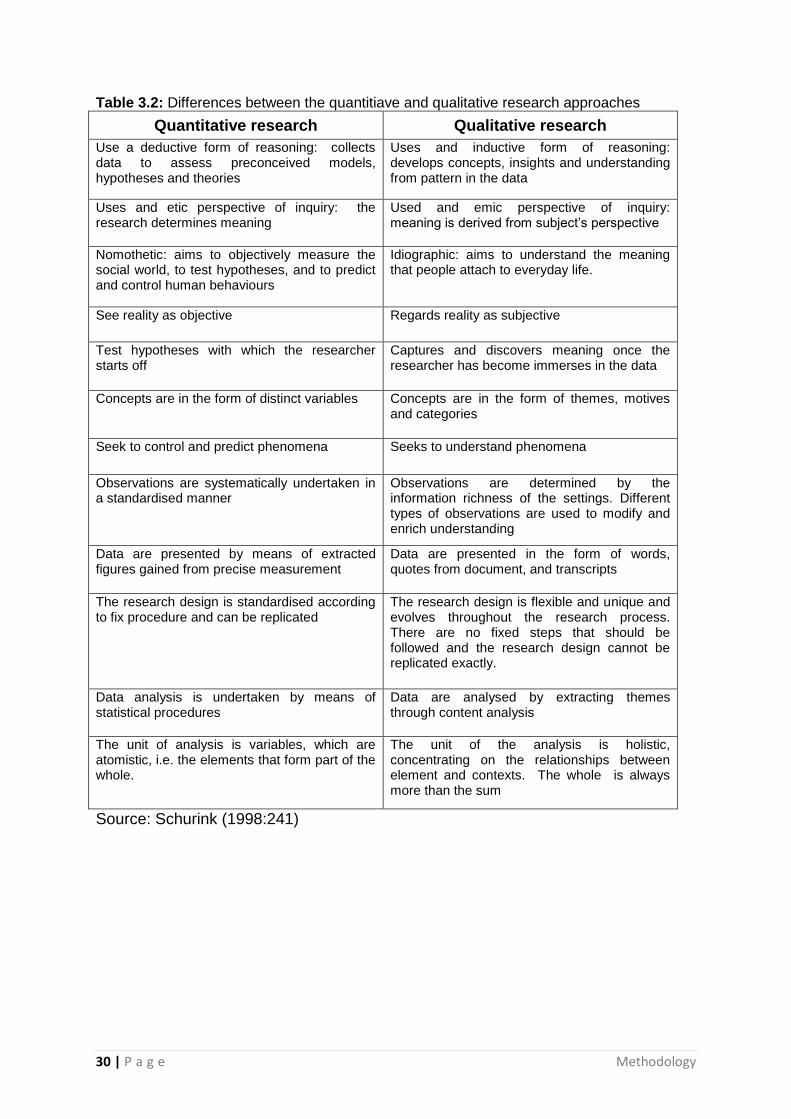
30 | P a g e Methodology
Table 3.2: Differences between the quantitiave and qualitative research approaches
Quantitative research Qualitative research
Use a deductive form of reasoning: collects data to assess preconceived models, hypotheses and theories
Uses and inductive form of reasoning: develops concepts, insights and understanding from pattern in the data
Uses and etic perspective of inquiry: the research determines meaning
Used and emic perspective of inquiry: meaning is derived from subject’s perspective
Nomothetic: aims to objectively measure the social world, to test hypotheses, and to predict and control human behaviours
Idiographic: aims to understand the meaning that people attach to everyday life.
See reality as objective Regards reality as subjective
Test hypotheses with which the researcher starts off
Captures and discovers meaning once the researcher has become immerses in the data
Concepts are in the form of distinct variables Concepts are in the form of themes, motives and categories
Seek to control and predict phenomena Seeks to understand phenomena
Observations are systematically undertaken in a standardised manner
Observations are determined by the information richness of the settings. Different types of observations are used to modify and enrich understanding
Data are presented by means of extracted figures gained from precise measurement
Data are presented in the form of words, quotes from document, and transcripts
The research design is standardised according to fix procedure and can be replicated
The research design is flexible and unique and evolves throughout the research process. There are no fixed steps that should be followed and the research design cannot be replicated exactly.
Data analysis is undertaken by means of statistical procedures
Data are analysed by extracting themes through content analysis
The unit of analysis is variables, which are atomistic, i.e. the elements that form part of the whole.
The unit of the analysis is holistic, concentrating on the relationships between element and contexts. The whole is always more than the sum
Source: Schurink (1998:241)
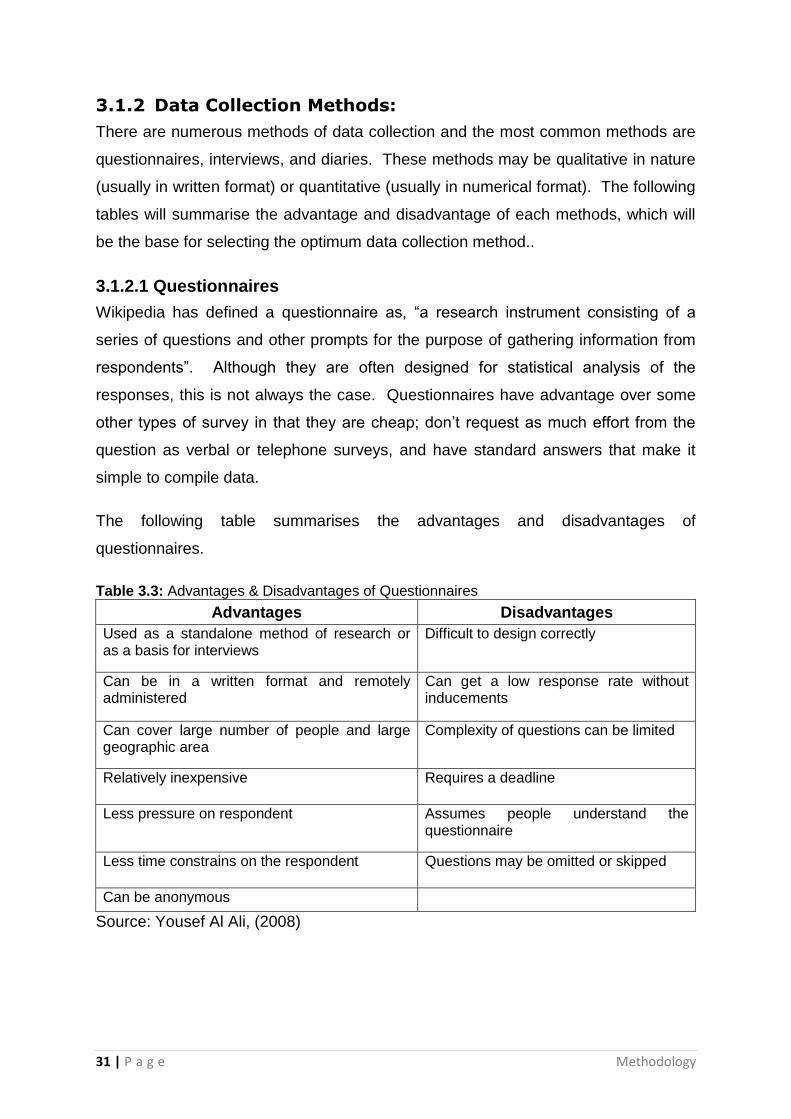
31 | P a g e Methodology
3.1.2 Data Collection Methods:
There are numerous methods of data collection and the most common methods are
questionnaires, interviews, and diaries. These methods may be qualitative in nature
(usually in written format) or quantitative (usually in numerical format). The following
tables will summarise the advantage and disadvantage of each methods, which will
be the base for selecting the optimum data collection method..
3.1.2.1 Questionnaires
Wikipedia has defined a questionnaire as, “a research instrument consisting of a
series of questions and other prompts for the purpose of gathering information from
respondents”. Although they are often designed for statistical analysis of the
responses, this is not always the case. Questionnaires have advantage over some
other types of survey in that they are cheap; don’t request as much effort from the
question as verbal or telephone surveys, and have standard answers that make it
simple to compile data.
The following table summarises the advantages and disadvantages of
questionnaires.
Table 3.3: Advantages & Disadvantages of Questionnaires
Advantages Disadvantages
Used as a standalone method of research or as a basis for interviews
Difficult to design correctly
Can be in a written format and remotely administered
Can get a low response rate without inducements
Can cover large number of people and large geographic area
Complexity of questions can be limited
Relatively inexpensive Requires a deadline
Less pressure on respondent Assumes people understand the questionnaire
Less time constrains on the respondent Questions may be omitted or skipped
Can be anonymous
Source: Yousef Al Ali, (2008)

32 | P a g e Methodology
3.1.2.2 Interviews:
According to Wikipedia, an interview is a conversation between two or more people
(the interviewer and the interviewee), where a question is asked by the interviewer
to obtain information from the interviewee.
The following table describes the advantages and disadvantages of interviews:
Table 3.4: Advantages & Disadvantages of Interviews
Advantages Disadvantages
Good response rate. Need organization
Immediate Time consuming.
Can use more complex questions Restrictive locations
In control Can be costly
Emotive feelings can be observed by the interviewer
Need lots of preparation
Can be tapped Can be embarrassing if personal questions are included
Source: Yousef Al Ali, (2008)
3.1.2.3 Diaries
Diaries are a form of data collection method, which is flexible, and could be used as
a basis for setting up interviews or questionnaires. The following table summarize
the advantages and disadvantages of this data collection method.
Table 3.5: Advantages & Disadvantages of Diaries
Advantages Disadvantages
Create source of information from employees.
Can be confusing
Variable in nature Certain level of literacy written skills required
Flexible Requires structure
Completed by other people Needs to be directed
Can be used as a basis for setting up interviews or questionnaires
Constant checking required
Confidentiality is very important
Difficult to analyze and present findings
Source: Yousef Al Ali, (2008)

33 | P a g e Methodology
3.1.3 Optimum Data Collection Method to Meet Study
Objectives:
The dissertation aims to prove the presence of Emotional Intelligence among
construction leaders of Dubai and its effect on their teams’ performance. rom the
four research objectives (mentioned in page: 4). The first two objectives were met
through the comprehensive literature review in Chapter two.
Explore the theory of Emotional Intelligence and its relation to leadership
abilities
Examine inter-relationship of Emotional Intelligence among leaders and their
teams’ performance.
The latter two objectives will be achieved through questionnaires:
Investigate the components of Emotional Intelligence present among
Construction Leaders in Dubai.
Illustrate the effects of Emotional Intelligence on team performance in Dubai’s
construction industry.
From the above objectives, it is obvious that, the research will be examining
opinions, feelings, and values of the leaders and their peers in terms of the
emotional intelligence competencies.
It will be also examining, the effects of Emotional Intelligence of leaders on team
performance in terms of their emotions and their responses to the emotions. This is
based on different situations. Thus, this research will be following the qualitative
research approach.
Having selected the qualitative approach, now let us discuss, which data collection
methods is suitable for this research.
The dominant constraints for this study were time. Therefore, interviews and diaries
were ruled out. In other words, the leaders involved in this study did not have the
time or any incentive to maintain a diary. Also, interviewing leaders in Dubai is very
time consuming and would contain too many key variables to be of any use for the
34 | P a g e Methodology
researchers. Hence, the questionnaires were used as the data collection method for
this study. Further details of the questionnaires will be discussed in section 3.4.
3.2 Measurement Tools for EI
Literature research of previous study indicates that there are number of self and peer
evaluation forms developed to measure EI. Bernard M. Bass and Bruce J. Avolio in
1995 developed Multifactor Leadership questionnaire (MLQM) which identified
various dimensions of emotional intelligence and leadership traits. However, more
focused EI questionnaires have been created and used worldwide. The four most
popular questionnaires used for measuring emotional intelligence are,
1. Emotional Quotient Inventory (EQ-i:Bar-On, 1997)
2. Emotional Intelligence Questionnaire (EIQ; Dulewicz & Higgs, 1999)
3. Mayer-Salovey-Caruso Emotional Intelligence Test (MSCEIT; Mayer et
al.,2002)
4. Emotional Competency Inventory (ECI 360o; Goleman, 2002)
3.2.1 Emotional Quotient Inventory: Bar-On
The Bar-On EQ-i identifies the level of a client’s emotional and social functioning
based on his or her responses. The EQ-360 assessment explores the situation
further by having those who work closely with the client provides information as well.
When observer ratings are compared with the results of a standard EQ-I self-report,
a more complete 360-degree profile emerges.
The EQ-360 is ideal for use in corporate environments where developing effective
communication between individuals, teams, and the entire organization is cruicial to
success. The EQ-360 identifies key employee strengths and impediments to high
performance that could be improved. The assessment process can also be used as
a follow-up to formal coaching and to measure progress.
The Bar-On EQ-i measures the following key areas of a leader,

35 | P a g e Methodology
Table 3.6: Bar-On EQ-I measures summary
EQ-I Scales The EI Competencies and Skills Assessed by each scale
Intrapersonal Self-awareness and self-expression:
Self-Regard To accurately perceive, understand and accept oneself.
Emotional Self-awareness To be aware of and understand one’s emotions and oneself.
Assertiveness To effectively and constructively express one’s emotions and oneself.
Independence To be self-reliant and free of emotional dependency on others.
Self-Actualization To strive to achieve personal goals and actualize one’s potential
Interpersonal Social awareness and interpersonal relationship:
Empathy To be aware of and understand how others feel.
Social Responsibility To identify with one’s social group and cooperate with others
Interpersonal Relationship To establish mutually satisfying relationships and relate well with others.
Stress Management Emotional management and regulation:
Stress Tolerance To effectively and constructively manage emotions.
Impulse Control To effectively and constructively control emotions.
Adaptability Change management:
Reality-testing To objectively validate one’s feelings and thinking with external reality.
Flexibility To adapt and adjust one’s feelings and thinking to new situations.
Problem-Solving To effectively solve problems of a personal and interpersonal nature.
General Mood Self-motivation:
Optimism To be positive and look at the brighter side of life.
Happiness To feel content with oneself, others and life in general.
3.2.2 Emotional Intelligence Questionnaire
Dr. Victor Dulewicz and Dr. Malcolm Higgs developed an Emotional Intelligence
Questionnaire in 1999. The test examines seven key elements of emotional
intelligence through self-responses. The research studies indicate a high level of
emotional intelligence has been found to be associated with 'success' in a work
context. Indeed, there are claims that high emotional intelligence is associated with
more wide-reaching 'life-success'. The seven elements of emotional intelligence
tested by the EIQ are briefed in table 3.3.

36 | P a g e Methodology
Table 3.7: EIQ measurement summary
EI Elements Description
Self-Awareness The awareness of one's own feelings and the ability to recognise and manage these feelings in a way which one feels that one can control. This factor includes a degree of self-belief in one's ability to manage one's emotions and to control their impact in a work environment.To accurately perceive, understand and accept oneself.
Emotional resilience
The ability to perform consistently in a range of situations under pressure and to adapt behaviour appropriately. The ability to balance the needs of the situation and task with the needs and concerns of the individuals involved. The ability to retain focus on a course of action or need for results in the face of personal challenge or criticism.
Motivation The drive and energy to achieve clear results and make an impact and, also, to balance short- and long-term goals with an ability to pursue demanding goals in the face of rejection or questioning.
Interpersonal sensitivity
The ability to be aware of, and take account of, the needs and perceptions of others in arriving at decisions and proposing solutions to problems and challenges. The ability to build from this awareness and achieve the commitment of others to decisions and action ideas. The willingness to keep open one's thoughts on possible solutions to problems and actively listen to, and reflect on, the reactions and inputs from others.
Influence The ability to persuade others to change a viewpoint based on the understanding of their position and the recognition of the need to listen to this perspective and provide a rationale for change.
Intuitiveness The ability to arrive at clear decisions and drive their implementation when presented with incomplete or ambiguous information using both rational and 'emotional' or intuitive perceptions of key issues and implications.
Conscientiousness The ability to display clear commitment to a course of action in the face of challenge and to match 'words and deeds' in encouraging others to support the chosen direction. The personal commitment to pursuing an ethical solution to a difficult business issue or problem.
3.2.3 Mayer-Salovey-Caruso Emotional Intelligence Test
(MSCEIT)
In 1990, Mayer and Salovey published two articles on emotional intelligence. The
first article (Salovey & Mayer, 1990) reviewed literature throughout the disciplines of
psychology and psychiatry, artificial intelligence, and other areas, and concluded that
a human ability called emotional intelligence might exist. The idea was that some
people reasoned with emotions more than others. The second article (Mayer,
DiPaolo, & Salovey, 1990) presented a first ability model of emotional intelligence –

37 | P a g e Methodology
a suggestion that emotional intelligence, measured as a true intelligence, might exist.
Since that time, Mayer, Salovey, and their colleagues refined their model of
emotional intelligence and expanded considerable efforts toward developing a high-
quality ability measure in the area. The newly developed Mayer-Salovey-Caruso
Emotional Intelligence Test (MSCEIT) is the result of this theoretical and empirical
research.
The MSCEIT test uses a variety of interesting and creative tasks to measure a
person’s capacity for reasoning with emotional information. This makes the MSCEIT
test ideal for situations where respondents may want to create a positive impression.
This test is recommended for people who want a substantive understanding of the
way they process emotions. It is mostly used for coaching and advanced training.
The MSCEIT is suitable for all kinds of corporate, educational, research, and
therapeutic settings. It measures intelligence in the following manner and areas,
Table 3.8: Structure and levels of feedback from the MSCEIT
Overall Score Area Scores Branch Scores Tasks Associated
with each
Emotional Intelligence
Experiential Emotional
Intelligence
Perceiving Emotions
Faces
Pictures
Facilitating Thought
Facilitation
Sensations
Strategic Emotional
Intelligence
Understanding Emotions
Changes
Blends
Managing Emotions
Emotional Management
Emotional Relations
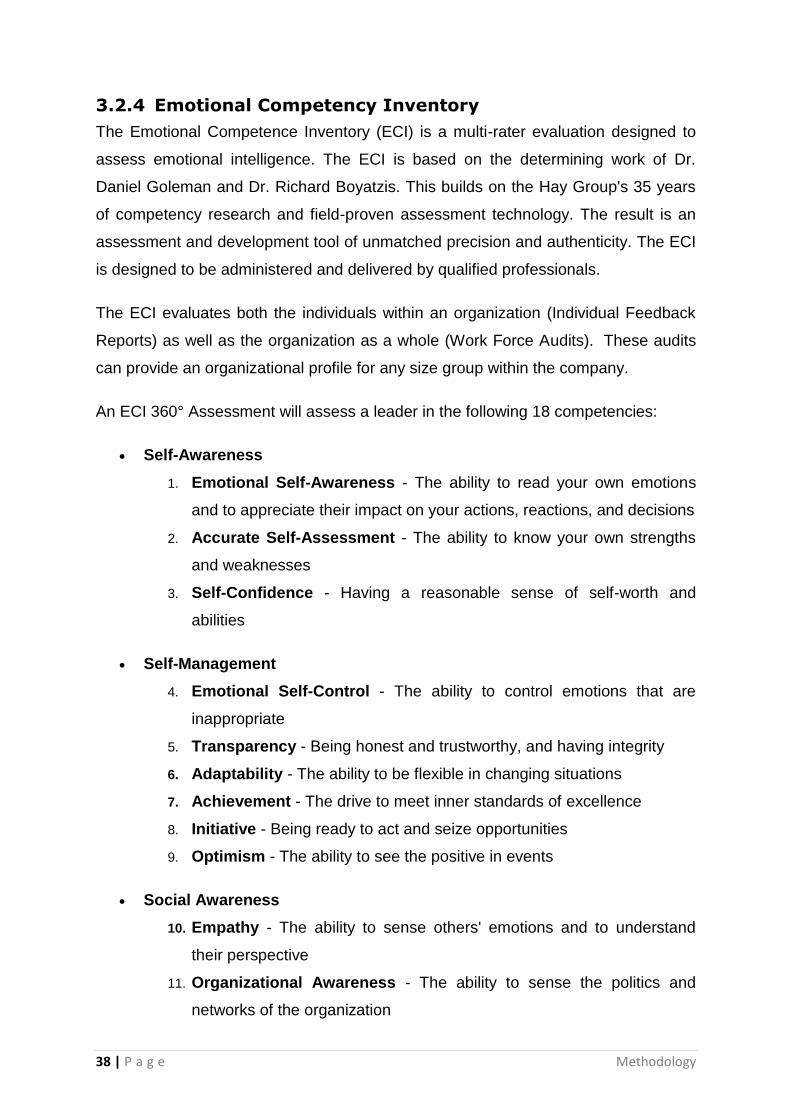
38 | P a g e Methodology
3.2.4 Emotional Competency Inventory
The Emotional Competence Inventory (ECI) is a multi-rater evaluation designed to
assess emotional intelligence. The ECI is based on the determining work of Dr.
Daniel Goleman and Dr. Richard Boyatzis. This builds on the Hay Group's 35 years
of competency research and field-proven assessment technology. The result is an
assessment and development tool of unmatched precision and authenticity. The ECI
is designed to be administered and delivered by qualified professionals.
The ECI evaluates both the individuals within an organization (Individual Feedback
Reports) as well as the organization as a whole (Work Force Audits). These audits
can provide an organizational profile for any size group within the company.
An ECI 360° Assessment will assess a leader in the following 18 competencies:
Self-Awareness
1. Emotional Self-Awareness - The ability to read your own emotions
and to appreciate their impact on your actions, reactions, and decisions
2. Accurate Self-Assessment - The ability to know your own strengths
and weaknesses
3. Self-Confidence - Having a reasonable sense of self-worth and
abilities
Self-Management
4. Emotional Self-Control - The ability to control emotions that are
inappropriate
5. Transparency - Being honest and trustworthy, and having integrity
6. Adaptability - The ability to be flexible in changing situations
7. Achievement - The drive to meet inner standards of excellence
8. Initiative - Being ready to act and seize opportunities
9. Optimism - The ability to see the positive in events
Social Awareness
10. Empathy - The ability to sense others' emotions and to understand
their perspective
11. Organizational Awareness - The ability to sense the politics and
networks of the organization

39 | P a g e Methodology
12. Service Orientation - The ability to understand and fulfill the needs of
customers and followers
Relationship Management
13. Developing Others - Building others' abilities
14. Inspirational Leadership - Having a compelling vision to lead with
individuals and groups
15. Change Catalyst - The ability to initiate, manage, and lead in a new
direction
16. Influence - The ability to utilize persuasion
17. Conflict Management - The ability to resolve disagreements
18. Teamwork and Collaboration - The ability to build and guide teams
3.3 Selection of Measurement tool
The study aims to measure the level of Emotional Intelligence competencies among
leaders of the Dubai construction industry, hence there was a need to have
comprehensive and focused list of competencies.
Further to a detailed review of the four famous Emotional Intelligence measurement
techniques, it was concluded that because the Dubai construction industry is a novel
market for testing Emotional Intelligence, the measurement techniques need to be
kept simple and straight.
The Emotional Competency Inventory was selected for measuring EI because it
gives a 360 feedback of a person, rather than relying on a self-report. The MSCEIT
test could not be used because the environment and culture would have affected the
responses of leaders and led to incorrect representation of results. The Bar-On
measurement technique was complicated and needed considerable time from
leaders to understand. The Emotional Intelligence Questionnaire is based on trait
theory, which could also have been misleading.
Hence, considering all the factors and timeline for the study, Goleman’s (2002) &
Hay group’s Emotional Competency Inventory was more aligned with the objectives
of the study. The 18 competencies of EI are more precise and require focused input
from leaders. Thus, a self-questionnaire was designed for the leader and a peer-
questionnaire was formulated for his/her two peers.

40 | P a g e Methodology
3.4 Evaluation of EI Test Tools
The Table 3.5 below summarise the four major types of Emotional Intelligence test.
Table 3.9: Evaluation of EI Test Tools
EQ-I Bar-On Emotional Intelligence
Questionnaire MSCEIT
Emotional
Competency
Inventory
Based on
“Definition”
an array of non-
cognitive capabilities,
competencies, and
skills that influence
one’s ability to
succeed in coping
with environmental
demands and
pressures
self-perceived ability,
to identify, assess,
and manage the
emotions of one's
self, of others, and of
groups
Emotional intelligence
involves the ability to
perceive accurately,
appraise, and express
emotion; the ability to
access and/or
generate feelings
when they facilitate
thought; the ability to
understand emotion
and emotional
knowledge; and the
ability to regulate
emotions to promote
emotional and
intellectual growth.
emotional
competence is 'a
learned capability
based on emotional
intelligence that
results in
outstanding
performance at
work
Measures Emotionally
Intelligent Behaviour
Emotional
Intelligence Traits Emotional Intelligence Competencies
Testing
Methods
This test is
dependent on self-
report only.
It uses self-report to
test traits of
Emotional
Intelligence.
This is Ability
measure test, which
requires evaluation of
pictures and different
situations.
This is a self-test
report with
feedback from
close peers.
Test Items
It consists of 133
items and provides
score on 5
composite scales
along with an overall
scale.
The test
encompasses 15
subscales organized
under four factors:
Well-Being, Self-
Control,
Emotionality, and
Sociability
It consists of 145 test
items, which
measures 4 branches
of EI.
It consists of 72
questions on a
scale of 5 with an
option of not
responding.

41 | P a g e Methodology
General
Notes
Bar-On hypothesizes
that those individuals
with higher than
average EQ.’s are in
general more
successful in
meeting
environmental
demands and
pressures. He also
notes that a
deficiency in EI can
mean a lack of
success and the
existence of
emotional problems.
Problems in coping
with one’s
environment are
thought, by Bar-On,
to be especially
common among
those individuals
lacking in the
subscales of reality
testing, problem
solving, stress
tolerance, and
impulse control.
The trait EI model is general and subsumes the Goleman and Bar-On models discussed above.
The tests are
measuring too many
things which are
influenced by the
person's environment.
For example, the
problem solving
section of the test will
give different results
based on a person's
training, experience,
etc.
The answers depend
too much on your
culture, your beliefs
and what you have
seen all around you
all your life.
The ECI is a 360-
degree tool
designed to assess
the emotional
competencies of
individuals and
organizations.
3.5 Elements to Measure
The objectives of the study are to
Explore the theory of EI and its relation to leadership abilities
Examine inter-relationship of EI among leaders and their teams’ performance
Investigate the presence of emotional intelligent competencies defined by
Goleman (2002) among construction leaders in Dubai
Measure the influence of these EI competencies and leadership traits on team
performance.
The first two objectives of the study have been achieved by extensive literature
research. The latter two objectives will be achieved by surveying potential leaders in
the Dubai Construction Market.

42 | P a g e Methodology
EI is an emerging concept in the Middle East and Dubai market will be pioneering in
this field of research. First, the study will examine the extent of leadership styles
present among the leaders. Secondly, the presence of Goleman’s (2002) eighteen
defined EI competencies as in Hay Group survey will be measured. Then the
influence of these leadership styles and competencies on team performance will be
identified through questionnaire as shown in Appendix A..
To summarise, the elements of measurement for the study are as follows:
1. Presence of leadership styles
2. Emotional competencies among leaders
3. Affect of leadership styles on team performance
4. Affect of emotional competencies on team performance
3.6 Questionnaires
Two questionnaires were designed as shown in Appendix A, one was a self-
questionnaire for a leader and second was a peer-questionnaire for two peers-
candidate leader.
The self-questionnaire for candidate leaders has three main parts,
1. General Information
2. Leadership styles
3. Emotional Competency Inventory (Haygroup,2008)
However, the peer-questionnaire had five parts; the first three parts were similar to
the self-questionnaire with an additional two sections to determine his/her
performance due to the type of leadership styles and emotional intelligence
competencies. The additional two parts of peer-questionnaire were,
4. Affect of Leadership style on peer’s performance
5. Affect of EI Competencies of leader on peer’s Performance

43 | P a g e Methodology
3.6.1 General Section
The General Information of the questionnaire inquires about demographical
information about the leader and peers, in order to determine factors affecting the
leadership style and emotional intelligence of the person.
Figure 3.1: General Information for the questionnaire
3.6.2 Leadership styles
The second section of the survey briefly explains the six type of leadership styles
(Goleman, 2002) and requests input of the person to choose his/her frequency on a
scale of five, Never, Rarely, Sometimes, Often, and Consistently. This will help in
determining the most pre-dominant leadership style present in the person.

44 | P a g e Methodology
A similar section was included in the peer-questionnaire as well, so as to compare
the responses of the leader candidates and understand the variation among their
responses.
Figure 3.2: Leadership styles (Goleman, 2002)
3.6.3 Emotional Competency Inventory (Hay Group)
The third section of the survey examines the presence of 18 competencies defined
by Goleman (2002) through the help of ECI questionnaire. The responses are on a
scale of five with an additional option of not responding as indicated in Figure 3.3.
This 72 questions evaluation sheet is from Hay Group (2008) survey exercise, which
was completed as part of this study. A similar section was also included in the peer-
questionnaire, so as to compare any variations among leaders and their peer’s
responses.

45 | P a g e Methodology
Figure 3.3: An extract from ECI questionnaire (Haygroup, 2008)

46 | P a g e Methodology
3.6.4 Performance due to leadership style
This section is only, for the peer-questionnaire because it determines the effect of
leadership style on team performance. The responses of peers were also on a
frequency scale of 5 to maintain the consistency with the remaining questionnaire.
Figure 3.4: Team performance due to leadership style (Goleman, 2002)
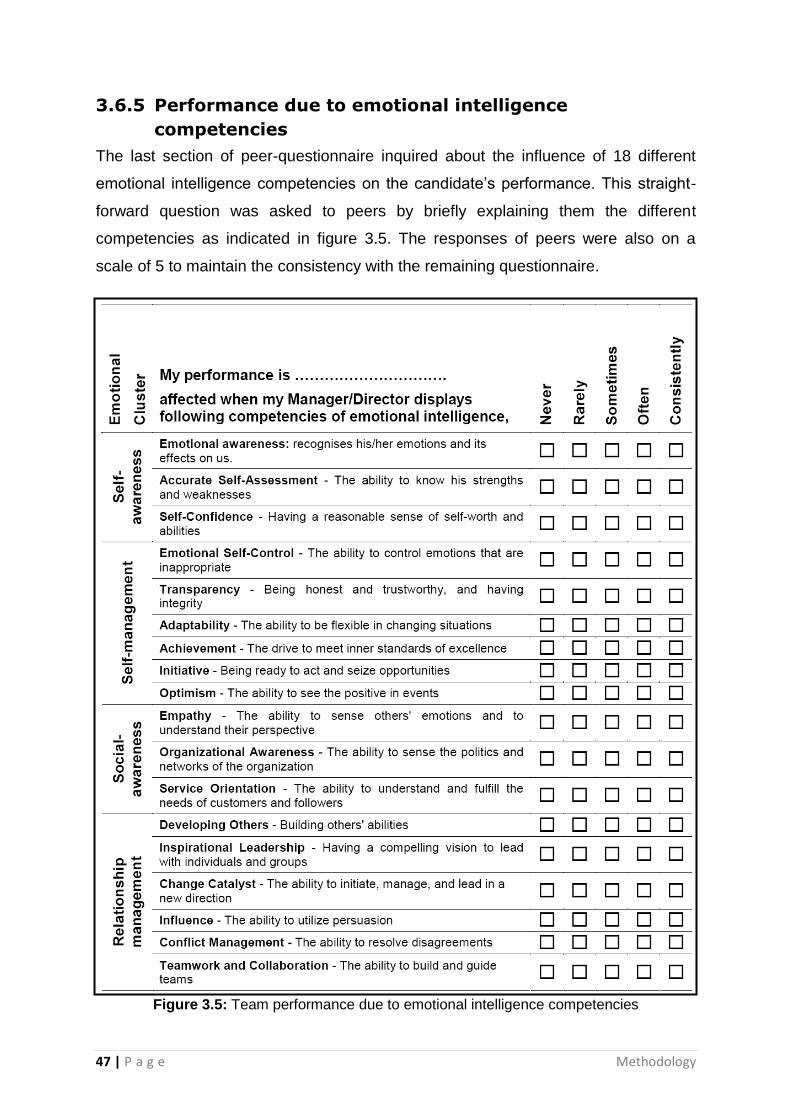
47 | P a g e Methodology
3.6.5 Performance due to emotional intelligence
competencies
The last section of peer-questionnaire inquired about the influence of 18 different
emotional intelligence competencies on the candidate’s performance. This straight-
forward question was asked to peers by briefly explaining them the different
competencies as indicated in figure 3.5. The responses of peers were also on a
scale of 5 to maintain the consistency with the remaining questionnaire.
Figure 3.5: Team performance due to emotional intelligence competencies

48 | P a g e Methodology
3.7 Survey Sample
A total of 33 candidates were selected for the survey of the study from the
construction industry of Dubai. The selected candidates were in leadership roles in
various different sectors of the industry, such that it includes leaders from the
government sector, private developers, and project management companies. The
self-questionnaires and peer-questionnaires were hand delivered to all the
candidates and their sub-ordinates for evaluation. The candidates were given four
weeks (due to official holidays), to complete the questionnaires and then the
questionnaires were collected.
3.8 Response Rate
The study identified 33 potential leaders in the construction industry of Dubai and
approached them with the set of questionnaires. The set of questionnaire consisted
of one self questionnaire and a questionnaire for two peers of each leader (as shown
in Appendix A). The questionnaires were hand delivered to each leaders and peers.
Sixteen useable questionnaires were received from the leaders and twenty six
questionnaires were received from their peers.
Hence, the response rate for the survey was 48%, which is substantial considering
the availability and approachability to different leaders in the busy construction
industry. The responses from different leaders can be classified into the type of
organizations as indicated in Table 3.5.
Table 3.10: Classification of participating organisations in the survey.
Type of organisations Number of
organisations Number of
Leaders Number of Peers
Private Developers 4 6 11
Government Organisations
2 4 5
Project Management Companies
4 6 10
Total 10 16 26
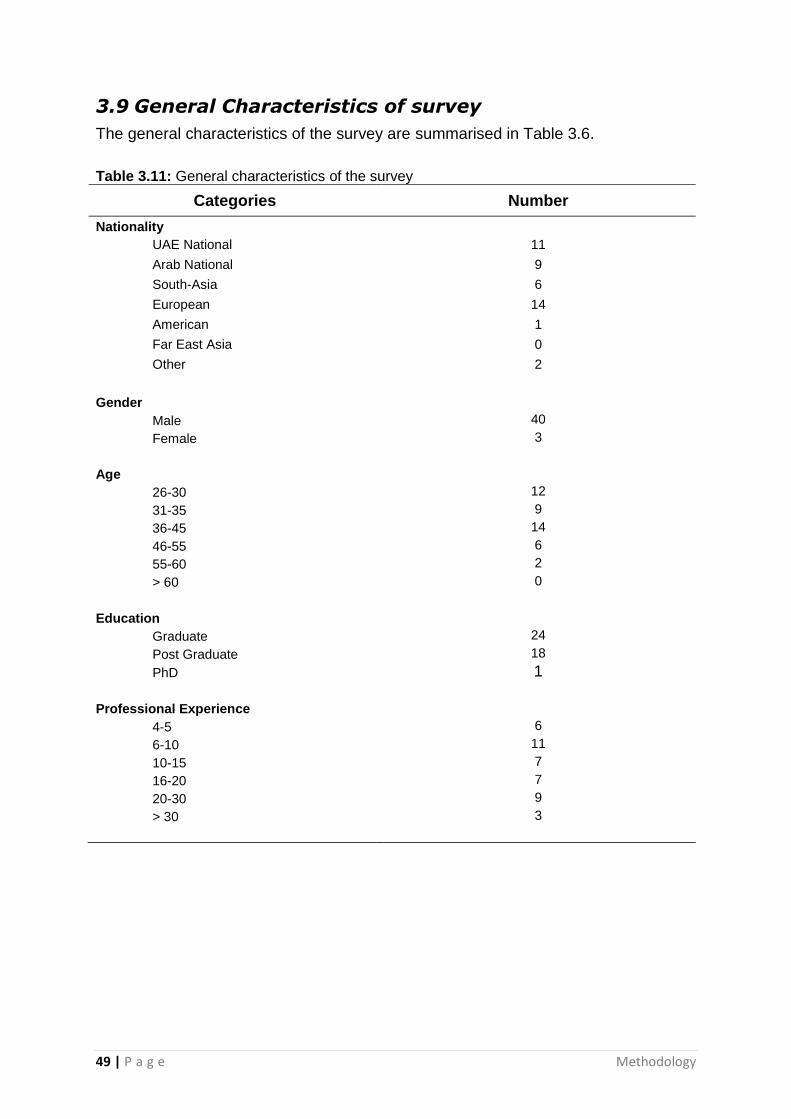
49 | P a g e Methodology
3.9 General Characteristics of survey
The general characteristics of the survey are summarised in Table 3.6.
Table 3.11: General characteristics of the survey
Categories Number
Nationality
UAE National 11
Arab National 9
South-Asia 6
European 14
American 1
Far East Asia 0
Other 2
Gender
Male 40
Female 3
Age
26-30 12
31-35 9
36-45 14
46-55 6
55-60 2
> 60 0
Education
Graduate 24
Post Graduate 18
PhD 1
Professional Experience
4-5 6
6-10 11
10-15 7
16-20 7
20-30 9
> 30 3

50 | P a g e Data Analysis & Results
44 DDAATTAA AANNAALLYYSSIISS AANNDD RREESSUULLTTSS
The data analysis and results chapter summarizes the results of the data acquired
through the survey methodology as explained in chapter 3. The analysis was carried
out to achieve the aim and objectives of the dissertation and hence it is classified in
the following main and respective sub-categories,
1. Prevalent Leadership styles (General)
a. Leadership styles in Private Developers
b. Leadership styles in Government Organisations
c. Leadership styles in Project Management Companies
2. Assessment of Emotional Competency Inventory (ECI) in Leaders (General)
a. ECI in Leaders of Private Developers
b. ECI in Leaders of Government Organisations
c. ECI in Leaders of Project Management Companies
3. Effect of Leadership styles on Team performance (General)
a. Effect of Leadership styles in Teams of Private Developers
b. Effect of Leadership styles in Teams of Government Organisations
c. Effect of Leadership styles in Teams of Project Management
Companies
4. Effect of Emotional Intelligence Competencies (EIC) on Team performance
(General)
a. Effect of EIC on Teams of Private Developers
b. Effect of EIC on Teams of Government Organisations
c. Effect of EIC on Teams of Project Management Companies
5. Correlation of Emotional Intelligence Competencies
a. Correlation Test
b. T-test
c. Cronbach-alpha reliability test
d. Chi-square
Since the research is of its first kind to measure emotional intelligence competencies
among leaders in Dubai’s construction industry, the research is more directed
towards exploratory methods of analysis in order to provide a platform for future
researches. Each of the above mentioned categories provides us with descriptive

51 | P a g e Data Analysis & Results
statistic results containing responses’ frequencies and percentages, mode, mean,
median and standard deviation. Furthermore, graphical representations of mean
values are indicated to give a better comparison.
4.1 Prevalent Leadership styles
Firstly, the extent of common leadership styles is measured among the leaders from
the construction industry of Dubai. The measurement is carried on a frequency scale
of 1 to 5, where each number represents; 1=Never; 2=Rarely; 3 = Sometimes; 4 =
Often; 5 = Consistently. Leaders’ responses are cross-examined by responses of
their peers and the frequency and percentage of responses are illustrated in Tables
4.1 and Table 4.2.
Table 4.1: Leadership styles in general by leaders – frequency and percentage
Table 4.2: Leadership styles in general by peers – frequency and percentage
Leadership Styles
Leaders (N=16)
Never Rarely Sometimes Often Consistently
f % f % f % f % f %
Visionary 0 0.00 - 0.00 3 18.75 7 43.75 6 37.50
Coaching 1 6.25 2 12.50 5 31.25 5 31.25 3 18.75
Affiliative 1 6.25 1 6.25 7 43.75 1 6.25 6 37.50
Democratic 0 0.00 2 12.50 3 18.75 6 37.50 5 31.25
Pace-setting 1 6.25 2 12.50 7 43.75 6 37.50 0 0.00
Commanding 0 0.00 4 25.00 6 37.50 4 25.00 2 12.50

52 | P a g e Data Analysis & Results
Tables 4.1 and 4.2 illustrate that according to the leaders’ they depict more visionary
and democratic styles at their workplace, whereas peers collectively view that
affiliative and democratic leadership styles are more prevalent.
Table 4.3: Leadership styles in general – descriptive analysis
Leadership Styles
Leaders (N=16) Peers (N=27)
Mode Mean Median Std Dev. Mode Mean Median Std Dev.
Visionary 4 4.19 4.00 0.75 4 3.89 4.00 1.01
Coaching 4 3.44 3.50 1.15 4 3.56 4.00 0.93
Affiliative 3 3.63 3.00 1.26 4 3.67 4.00 0.78
Democratic 4 3.88 4.00 1.02 5 4.30 5.00 0.87
Pace-setting 3 3.13 3.00 0.89 3 3.30 3.00 1.17
Commanding 3 3.25 3.00 1.00 4 3.00 3.00 1.14
In Table 4.3 different statistics parameters indicate that the leaders are more
visionary and democratic style oriented and similarly the results of peer responses
compliment the finding. The mean values of the responses from three sub-categories
of the companies are graphically represented in Figures 4.1 and 4.2. The graphs of
Leadership Styles
Peers (N=27)
Never Rarely Sometimes Often Consistently
f % f % f % f % f %
Visionary 1 3.70 1 3.70 6 22.22 11 40.74 8 29.63
Coaching 0 0.00 4 14.81 8 29.63 11 40.74 4 14.81
Affiliative 0 0.00 2 7.41 8 29.63 14 51.85 3 11.11
Democratic 0 0.00 1 3.70 4 14.81 8 29.63 14 51.85
Pace-setting 1 3.70 7 25.93 7 25.93 7 25.93 5 18.52
Commanding 2 7.41 9 33.33 5 18.52 9 33.33 2 7.41
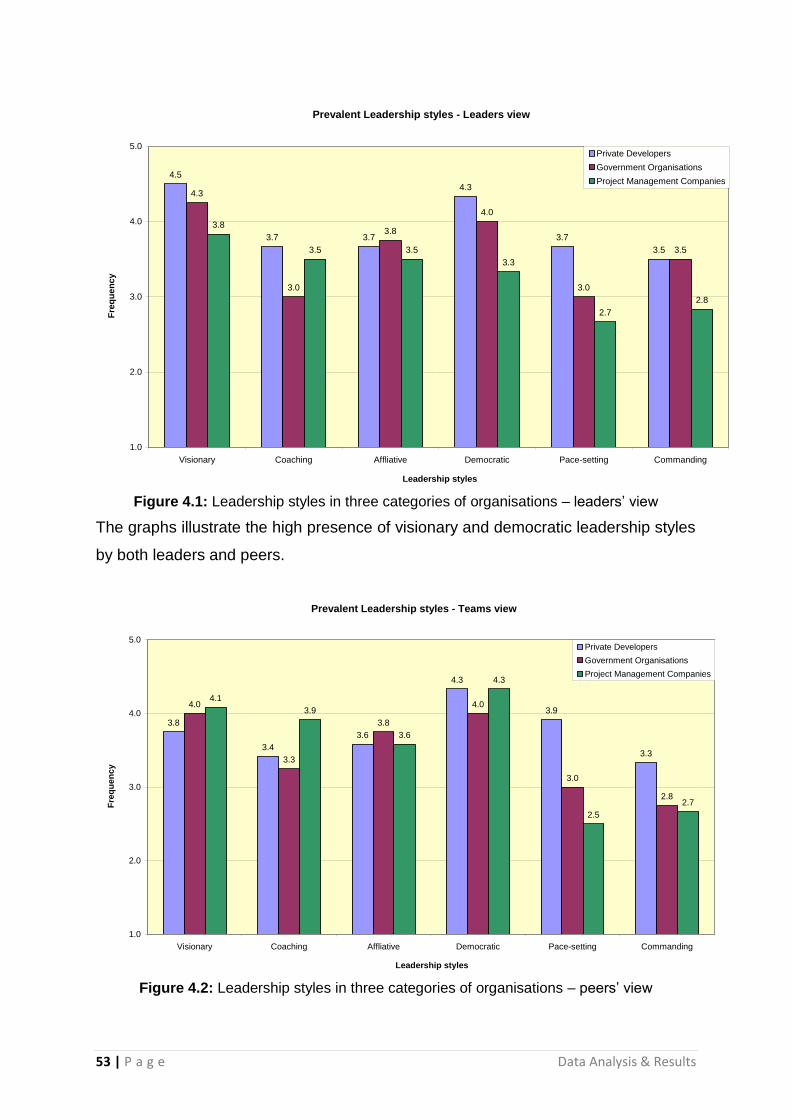
53 | P a g e Data Analysis & Results
Prevalent Leadership styles - Leaders view
4.5
3.7 3.7
4.3
3.7
3.5
4.3
3.0
3.8
4.0
3.0
3.5
3.8
3.5 3.5
3.3
2.7
2.8
1.0
2.0
3.0
4.0
5.0
Visionary Coaching Affliative Democratic Pace-setting Commanding
Leadership styles
Fre
qu
en
cy
Private Developers
Government Organisations
Project Management Companies
Figure 4.1: Leadership styles in three categories of organisations – leaders’ view
The graphs illustrate the high presence of visionary and democratic leadership styles
by both leaders and peers.
Prevalent Leadership styles - Teams view
3.8
3.4
3.6
4.3
3.9
3.3
4.0
3.3
3.8
4.0
3.0
2.8
4.1
3.9
3.6
4.3
2.5
2.7
1.0
2.0
3.0
4.0
5.0
Visionary Coaching Affliative Democratic Pace-setting Commanding
Leadership styles
Fre
qu
en
cy
Private Developers
Government Organisations
Project Management Companies
Figure 4.2: Leadership styles in three categories of organisations – peers’ view
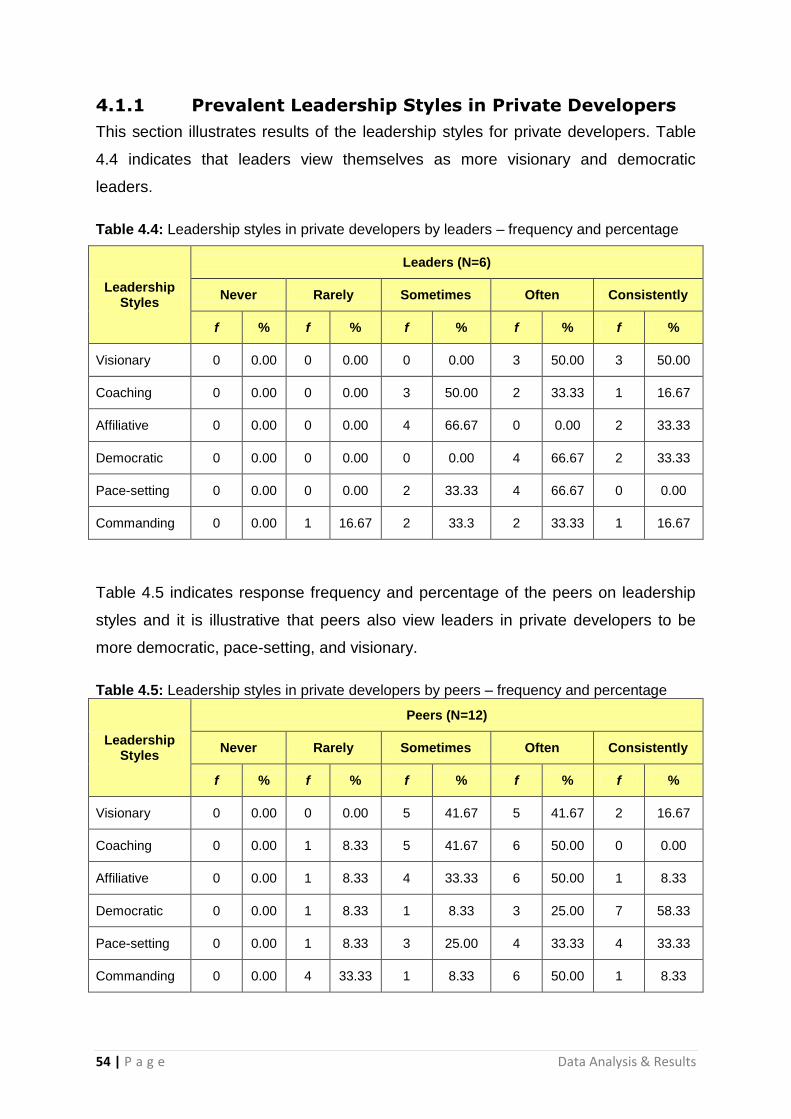
54 | P a g e Data Analysis & Results
4.1.1 Prevalent Leadership Styles in Private Developers
This section illustrates results of the leadership styles for private developers. Table
4.4 indicates that leaders view themselves as more visionary and democratic
leaders.
Table 4.4: Leadership styles in private developers by leaders – frequency and percentage
Leadership Styles
Leaders (N=6)
Never Rarely Sometimes Often Consistently
f % f % f % f % f %
Visionary 0 0.00 0 0.00 0 0.00 3 50.00 3 50.00
Coaching 0 0.00 0 0.00 3 50.00 2 33.33 1 16.67
Affiliative 0 0.00 0 0.00 4 66.67 0 0.00 2 33.33
Democratic 0 0.00 0 0.00 0 0.00 4 66.67 2 33.33
Pace-setting 0 0.00 0 0.00 2 33.33 4 66.67 0 0.00
Commanding 0 0.00 1 16.67 2 33.3 2 33.33 1 16.67
Table 4.5 indicates response frequency and percentage of the peers on leadership
styles and it is illustrative that peers also view leaders in private developers to be
more democratic, pace-setting, and visionary.
Table 4.5: Leadership styles in private developers by peers – frequency and percentage
Leadership Styles
Peers (N=12)
Never Rarely Sometimes Often Consistently
f % f % f % f % f %
Visionary 0 0.00 0 0.00 5 41.67 5 41.67 2 16.67
Coaching 0 0.00 1 8.33 5 41.67 6 50.00 0 0.00
Affiliative 0 0.00 1 8.33 4 33.33 6 50.00 1 8.33
Democratic 0 0.00 1 8.33 1 8.33 3 25.00 7 58.33
Pace-setting 0 0.00 1 8.33 3 25.00 4 33.33 4 33.33
Commanding 0 0.00 4 33.33 1 8.33 6 50.00 1 8.33

55 | P a g e Data Analysis & Results
Table 4.6 summarises descriptive statistic parameters of the survey and it also
proves that leaders and peers are on agreement that leaders in private developers
are more visionary, democratic and pace-setting.
Table 4.6: Leadership styles in private developers – descriptive analysis
Leadership Styles
Leaders (N=6) Peers (N=12)
Mode Mean Median Std Dev. Mode Mean Median Std Dev.
Visionary 5 4.50 4.50 0.55 4 3.75 4.00 0.75
Coaching 3 3.67 3.50 0.82 4 3.42 3.50 0.67
Affiliative 3 3.67 3.00 1.03 4 3.58 4.00 0.79
Democratic 4 4.33 4.00 0.52 5 4.33 5.00 0.98
Pace-setting 4 3.67 4.00 0.52 4 3.92 4.00 1.00
Commanding 3 3.50 3.50 1.05 4 3.33 4.00 1.07
4.1.2 Prevalent Leadership Styles in Government
Organisations
The numbers of participants from government organisations were limited but in
construction related government organisations, the most prevalent leadership styles
are visionary, affiliative, and democratic.
Table 4.7: Leadership styles in government organisations by leaders – frequency and percentage
Leadership Styles
Leaders (N=4)
Never Rarely Sometimes Often Consistently
f % f % f % f % f %
Visionary 0 0.00 0 0.00 1 25.00 1 25.00 2 50.00
Coaching 1 25.00 0 0.00 1 25.00 2 50.00 0 0.00
Affiliative 1 25.00 0 0.00 0 0.00 1 25.00 2 50.00
Democratic 0 0.00 1 25.00 0 0.00 1 25.00 2 50.00
Pace-setting 0 0.00 1 25.00 2 50.00 1 25.00 0 0.00
Commanding 0 0.00 1 25.00 1 25.00 1 25.00 1 25.00

56 | P a g e Data Analysis & Results
Similarly, the responses from peers of leaders indicated in Table 4.8 show that most
prevalent leadership styles are visionary and democratic. This does relate to the
overall vision of the emirate by the Ruler of Dubai.
Table 4.8: Leadership styles in government organisations by peers – frequency and percentage
Leadership Styles
Peers (N=5)
Never Rarely Sometimes Often Consistently
f % f % f % f % f %
Visionary 0 0.00 0 0.00 1 20.00 3 60.00 1 20.00
Coaching 0 0.00 2 40.00 0 0.00 3 60.00 0 0.00
Affiliative 0 0.00 0 0.00 2 40.00 2 40.00 1 20.00
Democratic 0 0.00 0 0.00 1 20.00 3 60.00 1 20.00
Pace-setting 0 0.00 2 40.00 0 0.00 3 60.00 0 0.00
Commanding 0 0.00 2 40.00 2 40.00 1 20.00 0 0.00
Table 4.9 summarises the mode, mean, median and standard deviation for
responses received from leaders and peers in the government organisations, which
further compliments the finding that most leaders are visionary and democratic.
Table 4.9: Leadership styles in government organisations – descriptive analysis
Leadership Styles
Leaders (N=4) Peers (N=5)
Mode Mean Median Std Dev. Mode Mean Median Std Dev.
Visionary 5 4.25 4.50 0.96 4 4.00 4.00 0.71
Coaching 4 3.00 3.50 1.41 4 3.20 4.00 1.10
Affiliative 5 3.75 4.50 1.89 4 3.80 4.00 0.84
Democratic 5 4.00 4.50 1.41 4 4.00 4.00 0.71
Pace-setting 3 3.00 3.00 0.82 4 3.20 4.00 1.10
Commanding N/A 3.50 3.50 1.29 3 2.80 3.00 0.84

57 | P a g e Data Analysis & Results
4.1.3 Prevalent Leadership Styles in Project Management
Companies
This section illustrates the results of data received from project management
companies. Table 4.10 and 4.11 indicate frequency of responses for each scale of
measurement, which show that leaders in project management companies are more
visionary and coaching as per the responses received from leaders.
Table 4.10: Leadership styles in project management companies by leaders – frequency and percentage
Leadership Styles
Leaders (N=6)
Never Rarely Sometimes Often Consistently
f % f % f % f % f %
Visionary 0 0.00 0 0.00 2 33.33 3 50.00 1 16.67
Coaching 0 0.00 2 33.33 1 16.67 1 16.67 2 33.33
Affiliative 0 0.00 1 16.67 3 50.00 0 0.00 2 33.33
Democratic 0 0.00 1 16.67 3 50.00 1 16.67 1 16.67
Pace-setting 1 16.67 1 16.67 3 50.00 1 16.67 0 0.00
Commanding 0 0.00 2 33.33 3 50.00 1 16.67 0 0.00
On the other hand, peers’ responses indicated in Table 4.11 show that visionary,
democratic and affiliative leadership styles are more prevalent.
Table 4.11: Leadership styles in project management companies by peers – frequency and percentage
Leadership Styles
Peers (N=10)
Never Rarely Sometimes Often Consistently
f % f % f % f % f %
Visionary 1 10.00 1 10.00 0 0.00 3 30.00 5 50.00
Coaching 0 0.00 1 10.00 3 30.00 2 20.00 4 40.00
Affiliative 0 0.00 1 10.00 2 20.00 6 60.00 1 10.00
Democratic 0 0.00 0 0.00 2 20.00 2 20.00 6 60.00
Pace-setting 1 10.00 4 40.00 4 40.00 0 0.00 1 10.00
Commanding 2 20.00 3 30.00 2 20.00 2 20.00 1 10.00
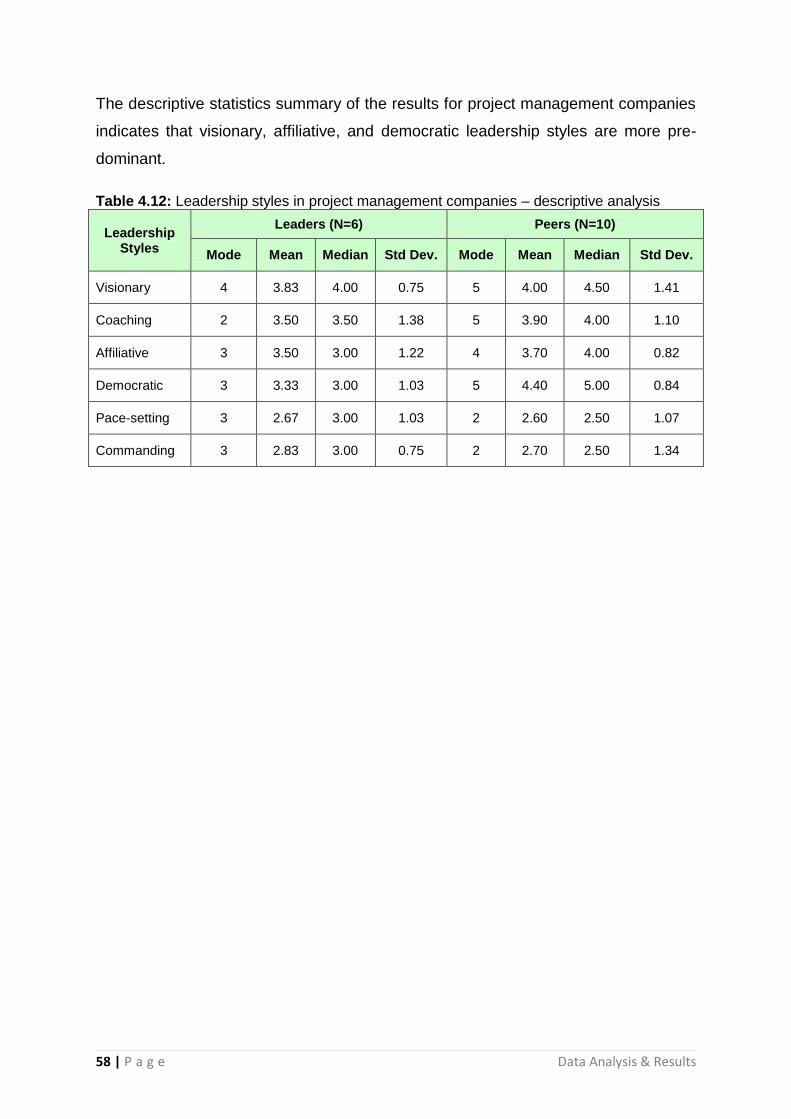
58 | P a g e Data Analysis & Results
The descriptive statistics summary of the results for project management companies
indicates that visionary, affiliative, and democratic leadership styles are more pre-
dominant.
Table 4.12: Leadership styles in project management companies – descriptive analysis
Leadership Styles
Leaders (N=6) Peers (N=10)
Mode Mean Median Std Dev. Mode Mean Median Std Dev.
Visionary 4 3.83 4.00 0.75 5 4.00 4.50 1.41
Coaching 2 3.50 3.50 1.38 5 3.90 4.00 1.10
Affiliative 3 3.50 3.00 1.22 4 3.70 4.00 0.82
Democratic 3 3.33 3.00 1.03 5 4.40 5.00 0.84
Pace-setting 3 2.67 3.00 1.03 2 2.60 2.50 1.07
Commanding 3 2.83 3.00 0.75 2 2.70 2.50 1.34
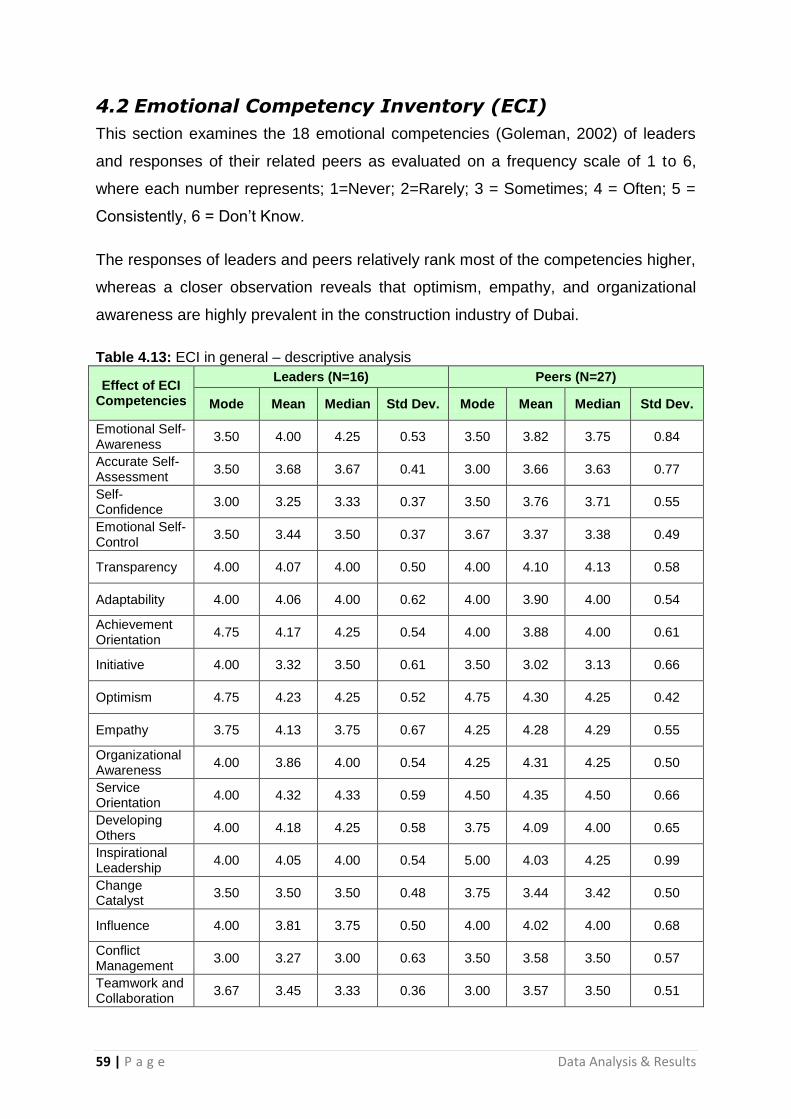
59 | P a g e Data Analysis & Results
4.2 Emotional Competency Inventory (ECI)
This section examines the 18 emotional competencies (Goleman, 2002) of leaders
and responses of their related peers as evaluated on a frequency scale of 1 to 6,
where each number represents; 1=Never; 2=Rarely; 3 = Sometimes; 4 = Often; 5 =
Consistently, 6 = Don’t Know.
The responses of leaders and peers relatively rank most of the competencies higher,
whereas a closer observation reveals that optimism, empathy, and organizational
awareness are highly prevalent in the construction industry of Dubai.
Table 4.13: ECI in general – descriptive analysis
Effect of ECI Competencies
Leaders (N=16) Peers (N=27)
Mode Mean Median Std Dev. Mode Mean Median Std Dev.
Emotional Self-Awareness
3.50 4.00 4.25 0.53 3.50 3.82 3.75 0.84
Accurate Self-Assessment
3.50 3.68 3.67 0.41 3.00 3.66 3.63 0.77
Self-Confidence
3.00 3.25 3.33 0.37 3.50 3.76 3.71 0.55
Emotional Self-Control
3.50 3.44 3.50 0.37 3.67 3.37 3.38 0.49
Transparency 4.00 4.07 4.00 0.50 4.00 4.10 4.13 0.58
Adaptability 4.00 4.06 4.00 0.62 4.00 3.90 4.00 0.54
Achievement Orientation
4.75 4.17 4.25 0.54 4.00 3.88 4.00 0.61
Initiative 4.00 3.32 3.50 0.61 3.50 3.02 3.13 0.66
Optimism 4.75 4.23 4.25 0.52 4.75 4.30 4.25 0.42
Empathy 3.75 4.13 3.75 0.67 4.25 4.28 4.29 0.55
Organizational Awareness
4.00 3.86 4.00 0.54 4.25 4.31 4.25 0.50
Service Orientation
4.00 4.32 4.33 0.59 4.50 4.35 4.50 0.66
Developing Others
4.00 4.18 4.25 0.58 3.75 4.09 4.00 0.65
Inspirational Leadership
4.00 4.05 4.00 0.54 5.00 4.03 4.25 0.99
Change Catalyst
3.50 3.50 3.50 0.48 3.75 3.44 3.42 0.50
Influence 4.00 3.81 3.75 0.50 4.00 4.02 4.00 0.68
Conflict Management
3.00 3.27 3.00 0.63 3.50 3.58 3.50 0.57
Teamwork and Collaboration
3.67 3.45 3.33 0.36 3.00 3.57 3.50 0.51

60 | P a g e Data Analysis & Results
Emotional Competency Inventory
Private Developers
3.3
2.9
2.6
2.8
3.3
3.2
3.4
2.8
3.3
3.3
3.2
3.2
3.4
3.4
2.9
2.9
2.6
2.7
3.0
3.0
3.1
2.8
3.3
3.1
3.3
2.5
3.4
3.4
3.3
3.5
3.2
3.4
3.0
3.3
3.0
3.0
1 2 3 4
1. Self-Awareness
Emotional Self-Awareness
Accurate Self-Assessment
Self-Confidence
2. Self-Management
Emotional Self-Control
Transparency
Adaptability
Achievement Orientation
Initiative
Optimism
3. Social Awareness
Empathy
Organizational Awareness
Service Orientation
4. Relationship Management
Developing Others
Inspirational Leadership
Change Catalyst
Influence
Conflict Management
Teamwork and Collaboration
Clu
ste
r /
Co
mp
ete
nc
ies
Competency Levels Leaders Peers
4.2.1 ECI in Private Developers
The study then analyses the responses of leaders and peers from each category of
surveyed organisations. Firstly, the responses from private developers in Dubai were
evaluated as represented in Figure 4.3.
Figure 4.3: ECI in Private Developers – Leaders & Peers comparison
The mean value of responses indicated in Figure 4.3 show that leaders view
themselves and their peers also consider them high on emotional self-awareness,
transparency, adaptability, achievement orientation, optimism, empathy,
organisational awareness, developing others, inspirational leadership, and change
catalyst. This all can be linked to the overall inspiring vision of the Ruler for the
Emirate and a fostering environment for businesses to grow.

61 | P a g e Data Analysis & Results
On the other hand, leaders view themselves low on self-control, initiative, conflict
management, teamwork and collaboration, which can be associated to relatively less
local market experience.
Table 4.14 indicate mode, mean, median, and standard deviation of the responses
from both leaders and peers. The results provide clear distinction that ECI
competencies, self-awareness, transparency, achievement orientation, developing
others, and inspirational leadership are highly prevalent in private developers’
leaders.
Table 4.14: ECI in Private Developers – descriptive analysis
Effect of ECI Competencies
Leaders (N=6) Peers (N=12)
Mode Mean Median Std Dev. Mode Mean Median Std Dev.
Emotional Self-Awareness
3.50 4.13 4.25 0.52 N/A 3.96 4.00 0.77
Accurate Self-Assessment
3.50 3.65 3.58 0.44 4.00 3.71 3.75 0.56
Self-Confidence
3.00 3.22 3.17 0.27 3.67 3.78 3.67 0.69
Emotional Self-Control
3.50 3.47 3.50 0.49 N/A 3.60 3.54 0.48
Transparency 4.75 4.08 4.13 0.63 4.00 4.04 4.00 0.64
Adaptability 4.00 4.04 4.13 0.56 3.67 3.86 4.00 0.69
Achievement Orientation
4.50 4.25 4.38 0.55 4.25 4.08 4.13 0.34
Initiative 4.00 3.54 3.63 0.49 4.00 3.36 3.50 0.83
Optimism 4.75 4.08 4.13 0.63 3.75 4.08 4.00 0.54
Empathy 3.50 4.08 3.75 0.72 4.25 4.13 4.25 0.85
Organizational Awareness
N/A 4.01 4.13 0.56 4.00 3.96 4.00 0.86
Service Orientation
N/A 4.04 4.13 0.71 N/A 4.14 4.13 0.52
Developing Others
4.00 4.21 4.13 0.51 3.50 3.83 3.63 0.56
Inspirational Leadership
4.00 4.29 4.13 0.49 4.25 4.29 4.25 0.40
Change Catalyst
3.50 3.63 3.63 0.26 3.25 3.69 3.50 0.65
Influence 3.50 3.67 3.63 0.30 4.00 4.07 4.00 0.44
Conflict Management
N/A 3.19 3.13 0.50 N/A 3.83 3.88 0.54
Teamwork and Collaboration
3.00 3.42 3.29 0.48 4.50 3.81 4.00 0.84

62 | P a g e Data Analysis & Results
Emotional Competency Inventory
Government Organisations
3.2
2.8
2.7
2.8
3.2
3.2
3.3
2.4
3.4
3.2
2.8
3.5
3.2
3.1
2.9
3.1
2.7
2.9
2.7
2.7
2.8
2.5
3.4
2.9
3.1
2.5
3.2
3.2
3.1
3.4
3.1
3.0
2.6
3.0
2.7
2.7
1 2 3 4
1. Self-Awareness
Emotional Self-Awareness
Accurate Self-Assessment
Self-Confidence
2. Self-Management
Emotional Self-Control
Transparency
Adaptability
Achievement Orientation
Initiative
Optimism
3. Social Awareness
Empathy
Organizational Awareness
Service Orientation
4. Relationship Management
Developing Others
Inspirational Leadership
Change Catalyst
Influence
Conflict Management
Teamwork and Collaboration
Clu
ste
r /
Co
mp
ete
nc
ies
Competency Levels Leaders Peers
4.2.2 ECI in Government Organisations
The analysis for the government organisations diagrammatically indicated in Figure
4.4 below show that leaders view them high on self-awareness, transparency,
adaptability, achievement orientation, optimism, empathy, service orientation, and
developing others. However, the peers of the leaders in government organisations
feel the leaders are low on emotional self-awareness and adaptability; this can be
the result of considerable bureaucratic procedures followed in government
organisations.
The change towards such an attitude is necessary in order to become a world
leading society, which is clearly highlighted in the Strategic Plan 2020 of Dubai by
H.H. Sheikh Muhammad bin Rashid Al Maktoum.
Figure 4.4: ECI in Government Organisations – Leaders & Peers comparison

63 | P a g e Data Analysis & Results
The descriptive analysis for responses from leaders and peers are illustrated in
Table 4.15. However the numbers of participants from the government organisations
are relatively low compared to other organisations but the responses are sufficient to
deduce the prevalent emotional intelligence competencies. The analysis of table
4.15 indicates that leaders and peers feel that government organisations have higher
emotional competencies of transparency, achievement orientation, service
orientation, and developing others.
Table 4.15: ECI in Government Organisations – descriptive analysis
Effect of ECI Competencies
Leaders (N=4) Peers (N=5)
Mode Mean Median Std Dev. Mode Mean Median Std Dev.
Emotional Self-Awareness
3.50 3.30 3.50 1.51 3.75 3.55 3.75 0.99
Accurate Self-Assessment
N/A 2.91 3.25 1.37 3.00 3.55 3.25 0.84
Self-Confidence
N/A 2.79 3.50 1.31 3.50 3.38 3.50 0.41
Emotional Self-Control
3.67 2.91 3.50 1.37 N/A 3.07 3.00 0.41
Transparency 4.25 3.33 3.75 1.52 4.50 4.20 4.25 0.33
Adaptability N/A 3.32 3.25 1.71 4.00 3.75 3.75 0.25
Achievement Orientation
4.75 3.37 3.75 1.81 4.00 3.95 4.00 0.27
Initiative N/A 2.57 3.00 1.24 3.50 3.10 3.25 0.52
Optimism 3.75 3.51 3.75 1.73 4.00 4.13 4.00 0.40
Empathy 4.50 3.37 3.75 1.51 3.75 3.95 3.75 0.41
Organizational Awareness
N/A 2.92 3.25 1.25 3.75 3.85 3.75 0.29
Service Orientation
4.00 3.60 4.00 1.76 4.50 4.28 4.50 0.46
Developing Others
4.00 3.31 4.00 1.69 3.75 3.95 3.75 0.33
Inspirational Leadership
3.25 3.18 3.25 1.68 3.50 3.90 3.50 0.65
Change Catalyst
N/A 2.98 3.00 1.52 3.25 3.32 3.25 0.27
Influence N/A 3.17 3.50 1.66 4.00 3.78 3.75 0.22
Conflict Management
3.50 2.84 3.50 1.31 3.00 3.40 3.25 0.52
Teamwork and Collaboration
3.50 3.10 3.50 1.28 3.50 3.48 3.50 0.29

64 | P a g e Data Analysis & Results
Emotional Competency Inventory
Project Management Companies
3.1
3.0
2.9
2.6
3.1
3.1
3.3
2.5
3.5
3.2
3.0
3.5
3.4
3.2
2.7
2.9
2.4
2.8
3.1
2.7
3.2
2.8
3.3
3.1
3.2
2.2
3.5
3.6
3.6
3.6
3.4
3.3
2.8
3.5
2.8
2.9
1 2 3 4
1. Self-Awareness
Emotional Self-Awareness
Accurate Self-Assessment
Self-Confidence
2. Self-Management
Emotional Self-Control
Transparency
Adaptability
Achievement Orientation
Initiative
Optimism
3. Social Awareness
Empathy
Organizational Awareness
Service Orientation
4. Relationship Management
Developing Others
Inspirational Leadership
Change Catalyst
Influence
Conflict Management
Teamwork and Collaboration
Clu
ste
r /
Co
mp
ete
nc
ies
Competency LevelsLeaders Peers
4.2.3 ECI in Project Management Companies
The project management companies include international firms, which have more
foreign expats working in the Dubai market. The results of emotional competency
inventory for leaders in these project management companies are graphically
illustrated in figure 4.5.
Figure 4.5: ECI in Project Management Companies – Leaders & Peers comparison
The leaders and peers responses support that leaders in such organisations show
high level of emotional self-awareness, transparency, adaptability, achievement
orientation, optimism, empathy, service orientation, developing others, and
inspirational leadership.
Although, leaders believe that they are relatively low on influence competency, their
peers’ responses indicate that the leaders are high on influencing competency.

65 | P a g e Data Analysis & Results
The descriptive analysis of ECI for project management companies is represented in
Table 4.16, which also illustrates that leaders in project management companies
highly depict the following emotional intelligence competencies; transparency,
adaptability, achievement orientation, empathy, organizational awareness, service
orientation, and developing others.
The construction market of Dubai is at its early cycle of development; thus the
workforce seems to be highly optimistic and service oriented.
Table 4.16: ECI in Project Management Companies – descriptive analysis
Effect of ECI Competencies
Leaders (N=6) Peers (N=10)
Mode Mean Median Std Dev. Mode Mean Median Std Dev.
Emotional Self-Awareness
4.25 3.75 3.75 0.58 N/A 3.62 3.33 0.90
Accurate Self-Assessment
3.50 3.75 3.50 0.35 N/A 3.32 3.50 0.77
Self-Confidence
3.50 3.33 3.33 0.20 3.67 3.87 3.75 0.25
Emotional Self-Control
3.50 3.35 3.50 0.38 3.00 3.43 3.50 0.43
Transparency 4.00 3.95 4.00 0.67 4.00 3.97 4.00 0.65
Adaptability 3.75 4.05 4.00 0.33 4.00 3.92 4.00 0.69
Achievement Orientation
4.00 3.90 4.00 0.29 4.25 4.00 4.25 1.00
Initiative 2.75 3.25 3.25 0.53 N/A 2.77 3.25 0.93
Optimism 4.00 4.35 4.25 0.42 N/A 4.22 4.25 0.38
Empathy N/A 4.15 4.00 0.72 4.75 4.60 4.67 0.18
Organizational Awareness
4.25 3.95 4.00 0.33 4.25 4.58 4.67 0.33
Service Orientation
N/A 4.52 4.50 0.38 N/A 4.30 4.50 0.78
Developing Others
4.25 4.20 4.25 0.54 N/A 3.95 4.00 0.65
Inspirational Leadership
4.00 4.00 4.00 0.35 4.50 3.80 4.50 1.43
Change Catalyst
3.25 3.15 3.25 0.29 3.50 3.50 3.50 0.47
Influence 3.75 3.90 3.75 0.55 N/A 4.17 4.33 0.84
Conflict Management
N/A 3.35 3.00 0.99 3.25 3.40 3.25 0.38

66 | P a g e Data Analysis & Results
Teamwork and Collaboration
N/A 3.40 3.33 0.31 4.00 3.45 3.25 0.51
4.3 Effect of Leadership styles on Teams
Thirdly, the effect of leadership styles on team performance was evaluated using the
responses from the peers. As explained in chapter 3, the peers were inquired to
scale the frequency of effect on them for different leadership styles. The frequency
scale was the same from 1 to 5; where each number is represented as; 1=Never;
2=Rarely; 3 = Sometimes; 4 = Often; 5 = Consistently.
Figure 4.6 graphically summarises the responses of all peers from the three types of
organisations. It can be noted that in private developers coaching leadership style
has positive influence, whereas in government organisations, pace-setting
leadership style have higher influence. Similarly, in project management companies’
democratic leadership style has higher influence on performance of the peers.
The responses from government organisations are relatively higher on the
leadership styles as compared to the private developers’ peers, whereas the
responses from peers of project management companies are quite varied between
different leadership styles.
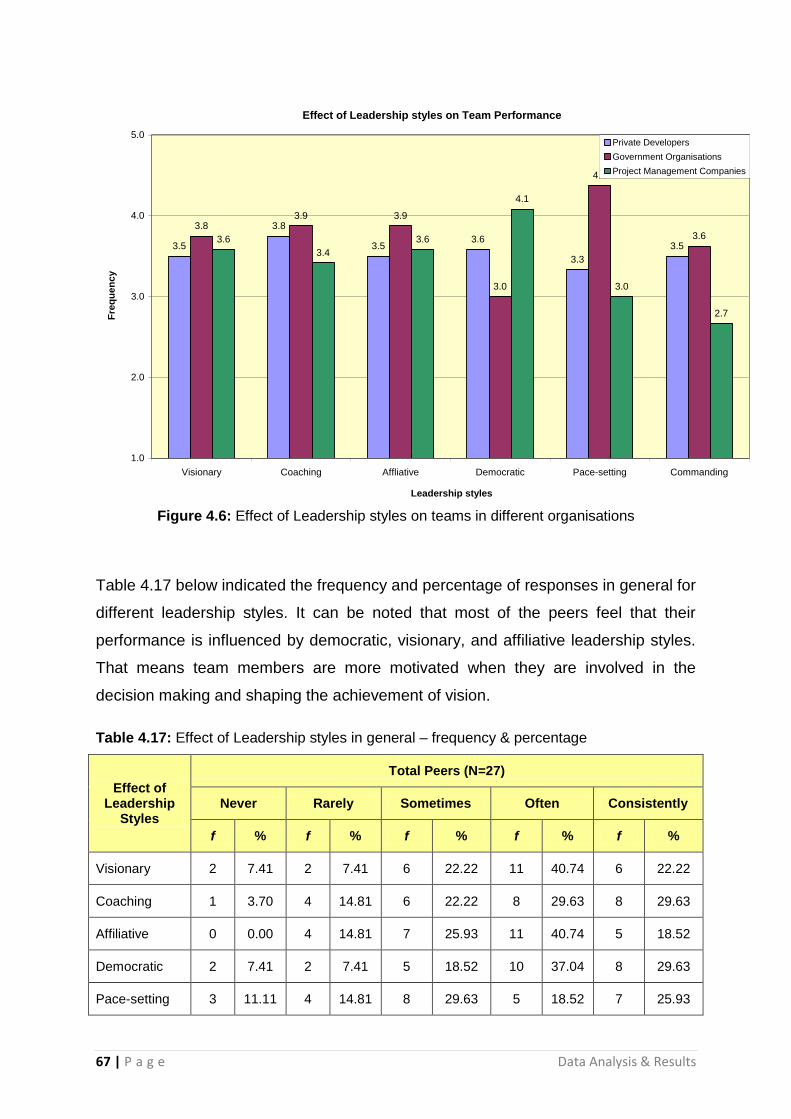
67 | P a g e Data Analysis & Results
Effect of Leadership styles on Team Performance
3.5
3.8
3.53.6
3.3
3.5
3.83.9 3.9
3.0
4.4
3.63.6
3.4
3.6
4.1
3.0
2.7
1.0
2.0
3.0
4.0
5.0
Visionary Coaching Affliative Democratic Pace-setting Commanding
Leadership styles
Fre
qu
en
cy
Private Developers
Government Organisations
Project Management Companies
Figure 4.6: Effect of Leadership styles on teams in different organisations
Table 4.17 below indicated the frequency and percentage of responses in general for
different leadership styles. It can be noted that most of the peers feel that their
performance is influenced by democratic, visionary, and affiliative leadership styles.
That means team members are more motivated when they are involved in the
decision making and shaping the achievement of vision.
Table 4.17: Effect of Leadership styles in general – frequency & percentage
Effect of Leadership
Styles
Total Peers (N=27)
Never Rarely Sometimes Often Consistently
f % f % f % f % f %
Visionary 2 7.41 2 7.41 6 22.22 11 40.74 6 22.22
Coaching 1 3.70 4 14.81 6 22.22 8 29.63 8 29.63
Affiliative 0 0.00 4 14.81 7 25.93 11 40.74 5 18.52
Democratic 2 7.41 2 7.41 5 18.52 10 37.04 8 29.63
Pace-setting 3 11.11 4 14.81 8 29.63 5 18.52 7 25.93

68 | P a g e Data Analysis & Results
Commanding 3 11.11 6 22.22 5 18.52 10 37.04 3 11.11
The Table 4.18 illustrates the mode, mean, median and standard deviation of the
responses from peers for six different leadership styles, it is indicative that relatively
all leadership styles influence the performance of teams.
Table 4.18: Effect of Leadership styles in general – descriptive analysis
Effect of Leadership Styles
Total Peers (N=27)
Mode Mean Median Std Dev.
Visionary 4 3.63 4 1.15
Coaching 5 3.67 4 1.18
Affiliative 4 3.63 4 0.97
Democratic 4 3.74 4 1.20
Pace-setting 3 3.33 3 1.33
Commanding 4 3.15 3 1.23
4.3.1 Effect of Leadership styles in Private Developers
In private developers the teams’ are motivated more by coaching and democratic
leadership styles as indicated in Table 4.19. The results in the table also indicate that
visionary and affiliative leadership styles also play a part in influencing the
performance of teams.
Table 4.19: Effect of Leadership styles in Private Developers – frequency & percentage
Effect of Leadership
Styles
PrivateDevelopers’Peers(N=12)
Never Rarely Sometimes Often Consistently
f % f % f % f % f %
Visionary 1 8.33 0 0.00 5 41.67 4 33.33 2 16.67
Coaching 0 0.00 2 16.67 3 25.00 3 25.00 4 33.33
Affiliative 0 0.00 2 16.67 4 33.33 4 33.33 2 16.67
Democratic 1 8.33 0 0.00 4 33.33 5 41.67 2 16.67
Pace-setting 1 8.33 2 16.67 4 33.33 2 16.67 3 25.00

69 | P a g e Data Analysis & Results
Commanding 0 0.00 3 25.00 2 16.67 5 41.67 2 16.67
Table 4.20 illustrates the descriptive analysis for effect of leadership styles on teams
in private developers, which supports the findings that coaching democratic and
commanding leadership styles affects the performance of teams.
Table 4.20: Effect of Leadership styles in Private Developers – descriptive analysis
Effect of Leadership Styles
PrivateDevelopers’Peers(N=12)
Mode Mean Median Std Dev.
Visionary 3 3.50 3.5 1.09
Coaching 5 3.75 4.0 1.14
Affiliative 3 3.50 3.5 1.00
Democratic 4 3.58 4.0 1.08
Pace-setting 3 3.33 3.0 1.30
Commanding 4 3.50 4.0 1.09
4.3.2 Effect of Leadership styles in Government
Organisations
The influence of leadership styles in government organisations are represented in
Table 4.21 and 4.22. The result illustrates that visionary, coaching, affiliative, and
pace-setting leadership styles effect performance of the teams in government
organisations. This is consistent with the construction market drive in the emirate as
employees in the government sector would like to have clearer goals and necessary
coaching for achieving them.
Table 4.21: Effect of Leadership styles in Government Organisations – frequency & percentage
Effect of Leadership
Styles
GovernmentOrganisations’Peers(N=5)
Never Rarely Sometimes Often Consistently
f % f % f % f % f %
Visionary 0 0.00 1 20.00 0 0.00 2 40.00 2 40.00
Coaching 0 0.00 1 20.00 0 0.00 2 40.00 2 40.00

70 | P a g e Data Analysis & Results
Affiliative 0 0.00 1 20.00 0 0.00 2 40.00 2 40.00
Democratic 1 20.00 1 20.00 0 0.00 2 40.00 1 20.00
Pace-setting 0 0.00 0 0.00 1 20.00 2 40.00 2 40.00
Commanding 0 0.00 0 0.00 2 40.00 3 60.00 0 0.00
Table 4.22 also supports the findings that teams in government sector would like to
have more pace-setting leadership styles to achieve the set goals and objectives for
the departments and organisations.
Table 4.22: Effect of Leadership styles in Government Organisations – descriptive analysis
Effect of Leadership Styles
GovernmentOrganisations’Peers(N=5)
Mode Mean Median Std Dev.
Visionary 4 4.00 4.0 1.22
Coaching 4 4.00 4.0 1.22
Affiliative 5 4.00 4.0 1.22
Democratic 4 3.20 4.0 1.64
Pace-setting 5 4.20 4.0 0.84
Commanding 4 3.60 4.0 0.55
4.3.3 Effect of Leadership styles in Project Management
Companies
The teams in project management companies mostly comprise a mix of foreign
expatriates from diverse cultures; hence their performance is influenced by cultures
too. The results in Table 4.23 indicate that employees in such companies consider
influence of democratic, visionary, and affiliative to be of higher importance than
others.
Table 4.23: Effect of Leadership styles in Project Management Companies – frequency & percentage
Effect of Leadership
Styles
ProjectManagementCompanies’Peers(N=10)
Never Rarely Sometimes Often Consistently
f % f % f % f % f %
Visionary 1 10.00 1 10.00 1 10.00 5 50.00 2 20.00

71 | P a g e Data Analysis & Results
Coaching 1 10.00 1 10.00 3 30.00 3 30.00 2 20.00
Affiliative 0 0.00 1 10.00 3 30.00 5 50.00 1 10.00
Democratic 0 0.00 1 10.00 1 10.00 3 30.00 5 50.00
Pace-setting 2 20.00 2 20.00 3 30.00 1 10.00 2 20.00
Commanding 3 30.00 3 30.00 1 10.00 2 20.00 1 10.00
The descriptive analysis presented in Table 4.24 represents that visionary,
democratic, and affiliative leadership styles are highly influential on peers’
performance.
Table 4.24: Effect of Leadership styles in Project Management Companies – descriptive analysis
Effect of Leadership Styles
ProjectManagementCompanies’Peers(N=10)
Mode Mean Median Std Dev.
Visionary 4 3.60 4.0 1.26
Coaching 4 3.40 3.5 1.26
Affiliative 4 3.60 4.0 0.84
Democratic 5 4.20 4.5 1.03
Pace-setting 3 2.90 3.0 1.45
Commanding 1 2.50 2.0 1.43
4.4 Effect of Emotional Intelligence Competencies on
Teams Performance
Similar to the previous section, the peers were inquired to rate frequency of influence
for Goleman’s (2002) 18 Emotional Intelligence competencies on their performance.
This was also measured on a scale from 1 to 5, where 1=Never; 2=Rarely; 3 =
Sometimes; 4=Often; 5=Consistently. In general, it is noted that all emotional
intelligence competencies often influence the performance of teams in one way or
another.

72 | P a g e Data Analysis & Results
Effect of Emotional Intelligence on Team Performance
1.0
2.0
3.0
4.0
5.0
Em
otiona
l Sel
f-Awar
enes
s
Acc
urat
e Self-A
sses
smen
t
Self-C
onfid
ence
Em
otiona
l Sel
f-Con
trol
Trans
pare
ncy
Ada
ptab
ility
Ach
ieve
men
t Orie
ntat
ion
Initiat
ive
Opt
imism
Em
path
y
Org
anizat
iona
l Awar
enes
s
Ser
vice
Orie
ntat
ion
Dev
elop
ing
Oth
ers
Insp
iratio
nal L
eade
rship
Cha
nge
Cat
alys
t
Influ
ence
Con
flict M
anag
emen
t
Team
wor
k an
d Collabo
ratio
n
Emotional Competency Inventory - 18 Competencies
Fre
qu
en
cy
Private Developers
Government Organisations
Project Management Companies
Figure 4.7, diagrammatically summarises the findings from the three types of
organisations and indicates that self-confidence, initiative, influence, teamwork and
collaboration are highly influential competencies on teams. Other competencies also
affect the performance of teams and the responses from all organisations are
relatively similar indicating the emotional intelligence as a whole has greater
influence on team performances.
Figure 4.7: Effect of Emotional Intelligence competencies on teams in different organisations
Table 4.25 illustrates the frequency of responses received for each element of the
scale, which indicates that transparency, initiative, service orientation, influence,
teamwork & collaboration, and inspirational leadership are highly affecting
competencies on the teams in all three organisations.
Table 4.25: Effect of ECI competencies in general – frequency & percentage
Effect of ECI Competencies
Total Peers (N=27)
Never Rarely Sometimes Often Consistently
f % f % f % f % f %
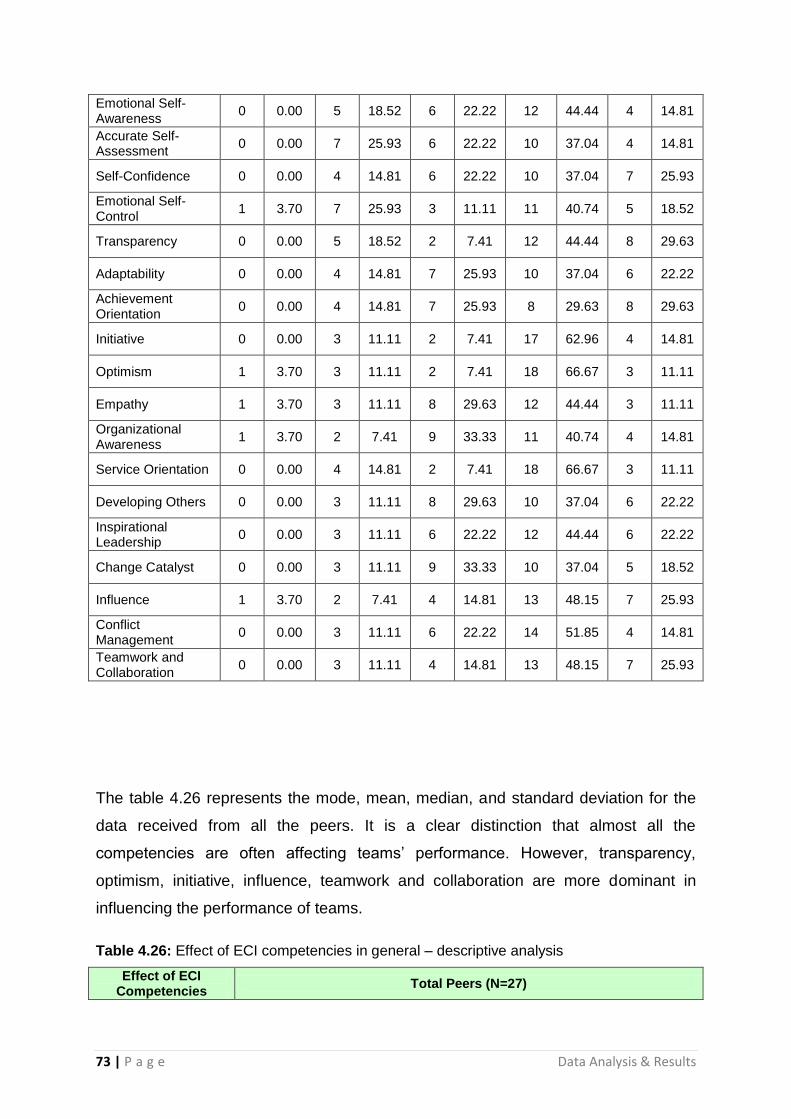
73 | P a g e Data Analysis & Results
Emotional Self-Awareness
0 0.00 5 18.52 6 22.22 12 44.44 4 14.81
Accurate Self-Assessment
0 0.00 7 25.93 6 22.22 10 37.04 4 14.81
Self-Confidence 0 0.00 4 14.81 6 22.22 10 37.04 7 25.93
Emotional Self-Control
1 3.70 7 25.93 3 11.11 11 40.74 5 18.52
Transparency 0 0.00 5 18.52 2 7.41 12 44.44 8 29.63
Adaptability 0 0.00 4 14.81 7 25.93 10 37.04 6 22.22
Achievement Orientation
0 0.00 4 14.81 7 25.93 8 29.63 8 29.63
Initiative 0 0.00 3 11.11 2 7.41 17 62.96 4 14.81
Optimism 1 3.70 3 11.11 2 7.41 18 66.67 3 11.11
Empathy 1 3.70 3 11.11 8 29.63 12 44.44 3 11.11
Organizational Awareness
1 3.70 2 7.41 9 33.33 11 40.74 4 14.81
Service Orientation 0 0.00 4 14.81 2 7.41 18 66.67 3 11.11
Developing Others 0 0.00 3 11.11 8 29.63 10 37.04 6 22.22
Inspirational Leadership
0 0.00 3 11.11 6 22.22 12 44.44 6 22.22
Change Catalyst 0 0.00 3 11.11 9 33.33 10 37.04 5 18.52
Influence 1 3.70 2 7.41 4 14.81 13 48.15 7 25.93
Conflict Management
0 0.00 3 11.11 6 22.22 14 51.85 4 14.81
Teamwork and Collaboration
0 0.00 3 11.11 4 14.81 13 48.15 7 25.93
The table 4.26 represents the mode, mean, median, and standard deviation for the
data received from all the peers. It is a clear distinction that almost all the
competencies are often affecting teams’ performance. However, transparency,
optimism, initiative, influence, teamwork and collaboration are more dominant in
influencing the performance of teams.
Table 4.26: Effect of ECI competencies in general – descriptive analysis
Effect of ECI Competencies
Total Peers (N=27)

74 | P a g e Data Analysis & Results
Mode Mean Median Std Dev.
Emotional Self-Awareness
4.0 3.56 4 0.97
Accurate Self-Assessment
4.0 3.41 4 1.05
Self-Confidence 4.0 3.74 4 1.02
Emotional Self-Control
4.0 3.44 4 1.19
Transparency 4.0 3.85 4 1.06
Adaptability 4.0 3.67 4 1.00
Achievement Orientation
5.0 3.74 4 1.06
Initiative 4.0 3.85 4 0.83
Optimism 4.0 3.70 4 0.95
Empathy 4.0 3.48 4 0.98
Organizational Awareness
4.0 3.56 4 0.97
Service Orientation 4.0 3.74 4 0.86
Developing Others 4.0 3.70 4 0.95
Inspirational Leadership
4.0 3.78 4 0.93
Change Catalyst 4.0 3.63 4 0.93
Influence 4.0 3.85 4 1.03
Conflict Management 4.0 3.70 4 0.87
Teamwork and Collaboration
4.0 3.89 4 0.93
4.4.1 Effect of ECI Competencies in Private Developers
The emotional competencies in private developers’ teams also play a role as
indicated in Table 4.27 given below. The frequency and percentage analysis
illustrates that transparency, initiative, service orientation, and influence are highly
influential competencies on the teams in private developers. The remaining
competencies also influence the performance of peers as indicated in their
responses.

75 | P a g e Data Analysis & Results
Table 4.27: Effect of ECI competencies in private developers – frequency & percentage
Effect of ECI Competencies
PrivateDevelopers’Peers(N=12)
Never Rarely Sometimes Often Consistently
f % f % f % f % f %
Emotional Self-Awareness
0 0.00 1 8.33 3 25.00 6 50.00 2 16.67
Accurate Self-Assessment
0 0.00 2 16.67 4 33.33 4 33.33 2 16.67
Self-Confidence 0 0.00 1 8.33 2 16.67 6 50.00 3 25.00
Emotional Self-Control
1 8.33 3 25.00 1 8.33 5 41.67 2 16.67
Transparency 0 0.00 2 16.67 0 0.00 8 66.67 2 16.67
Adaptability 0 0.00 2 16.67 3 25.00 5 41.67 2 16.67
Achievement Orientation
0 0.00 1 8.33 4 33.33 4 33.33 3 25.00
Initiative 0 0.00 1 8.33 0 0.00 8 66.67 2 16.67
Optimism 1 8.33 2 16.67 0 0.00 7 58.33 2 16.67
Empathy 1 8.33 0 0.00 3 25.00 6 50.00 2 16.67
Organizational Awareness
1 8.33 0 0.00 2 16.67 6 50.00 3 25.00
Service Orientation 0 0.00 2 16.67 0 0.00 8 66.67 2 16.67
Developing Others 0 0.00 1 8.33 3 25.00 6 50.00 2 16.67
Inspirational Leadership
0 0.00 1 8.33 4 33.33 5 41.67 2 16.67
Change Catalyst 0 0.00 1 8.33 4 33.33 5 41.67 2 16.67
Influence 0 0.00 1 8.33 1 8.33 7 58.33 3 25.00
Conflict Management
0 0.00 2 16.67 3 25.00 4 33.33 3 25.00
Teamwork and Collaboration
0 0.00 1 8.33 2 16.67 6 50.00 3 25.00
Table 4.28 illustrates the descriptive analysis of responses received from peers in
private developers, which also indicates that self-confidence, transparency, initiative,
organizational awareness, service orientation, and influence are relatively high
influencing competencies from the Goleman’s 18 competency inventory. It is a clear
distinction that employees in private developers work better when trust is placed in
their capabilities, environment for initiatives is provided, and better people service is
provided.

76 | P a g e Data Analysis & Results
Table 4.28: Effect of ECI competencies in private developers – descriptive analysis
Effect of ECI Competencies
PrivateDevelopers’Peers (N=12)
Mode Mean Median Std Dev.
Emotional Self-Awareness
4 3.75 4 0.87
Accurate Self-Assessment
3 3.50 3.5 1.00
Self-Confidence 4 3.92 4 0.90
Emotional Self-Control
4 3.33 4 1.30
Transparency 4 3.83 4 0.94
Adaptability 4 3.58 4 1.00
Achievement Orientation
3 3.75 4 0.97
Initiative 4 4.00 4 0.77
Optimism 4 3.58 4 1.24
Empathy 4 3.67 4 1.07
Organizational Awareness
4 3.83 4 1.11
Service Orientation 4 3.83 4 0.94
Developing Others 4 3.75 4 0.87
Inspirational Leadership
4 3.67 4 0.89
Change Catalyst 4 3.67 4 0.89
Influence 4 4.00 4 0.85
Conflict Management 4 3.67 4 1.07
Teamwork and Collaboration
4 3.92 4 0.90
4.4.2 Effect of ECI Competencies in Government
Organisations
In government organisations, the most influencing emotional competencies are
initiative, optimism, service orientation, inspirational leadership, influence, conflict
management, teamwork and collaboration as illustrative in Table 4.29. This proves
that government organisation employees would like to have more focused and goal-
oriented work programs with an inspirational leadership.
Table 4.29: Effect of ECI competencies in government organisations – frequency & percentage
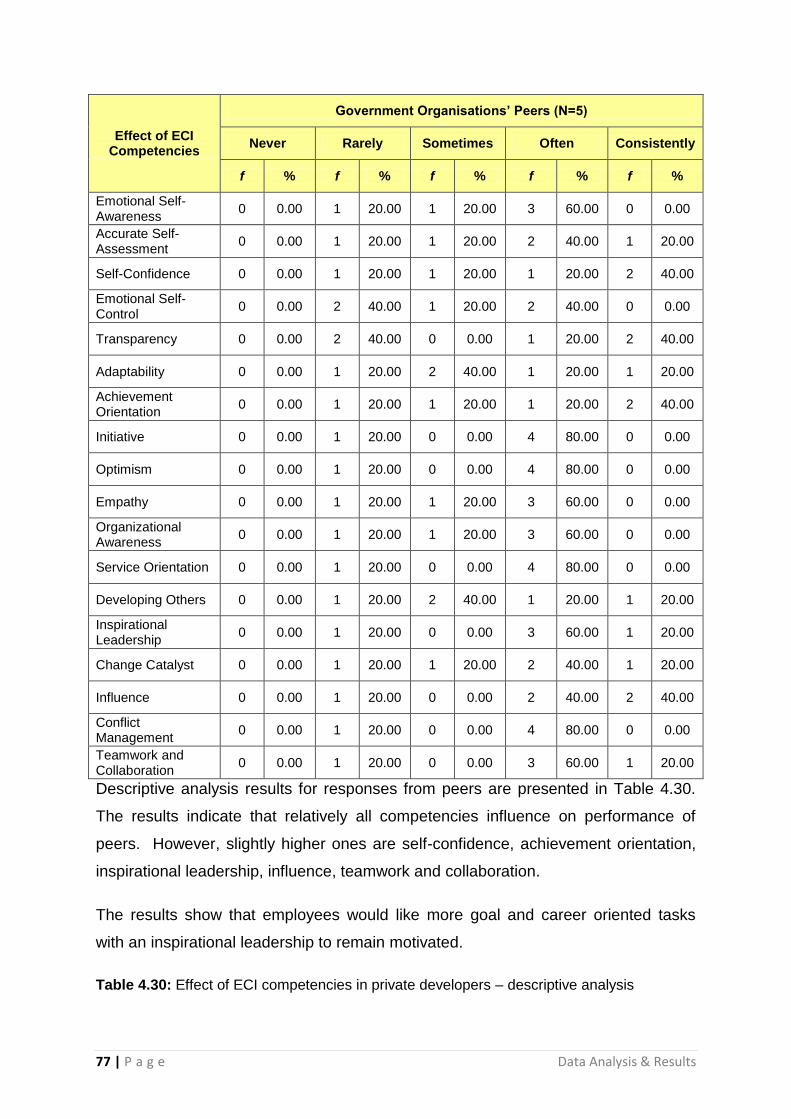
77 | P a g e Data Analysis & Results
Effect of ECI Competencies
GovernmentOrganisations’Peers(N=5)
Never Rarely Sometimes Often Consistently
f % f % f % f % f %
Emotional Self-Awareness
0 0.00 1 20.00 1 20.00 3 60.00 0 0.00
Accurate Self-Assessment
0 0.00 1 20.00 1 20.00 2 40.00 1 20.00
Self-Confidence 0 0.00 1 20.00 1 20.00 1 20.00 2 40.00
Emotional Self-Control
0 0.00 2 40.00 1 20.00 2 40.00 0 0.00
Transparency 0 0.00 2 40.00 0 0.00 1 20.00 2 40.00
Adaptability 0 0.00 1 20.00 2 40.00 1 20.00 1 20.00
Achievement Orientation
0 0.00 1 20.00 1 20.00 1 20.00 2 40.00
Initiative 0 0.00 1 20.00 0 0.00 4 80.00 0 0.00
Optimism 0 0.00 1 20.00 0 0.00 4 80.00 0 0.00
Empathy 0 0.00 1 20.00 1 20.00 3 60.00 0 0.00
Organizational Awareness
0 0.00 1 20.00 1 20.00 3 60.00 0 0.00
Service Orientation 0 0.00 1 20.00 0 0.00 4 80.00 0 0.00
Developing Others 0 0.00 1 20.00 2 40.00 1 20.00 1 20.00
Inspirational Leadership
0 0.00 1 20.00 0 0.00 3 60.00 1 20.00
Change Catalyst 0 0.00 1 20.00 1 20.00 2 40.00 1 20.00
Influence 0 0.00 1 20.00 0 0.00 2 40.00 2 40.00
Conflict Management
0 0.00 1 20.00 0 0.00 4 80.00 0 0.00
Teamwork and Collaboration
0 0.00 1 20.00 0 0.00 3 60.00 1 20.00
Descriptive analysis results for responses from peers are presented in Table 4.30.
The results indicate that relatively all competencies influence on performance of
peers. However, slightly higher ones are self-confidence, achievement orientation,
inspirational leadership, influence, teamwork and collaboration.
The results show that employees would like more goal and career oriented tasks
with an inspirational leadership to remain motivated.
Table 4.30: Effect of ECI competencies in private developers – descriptive analysis
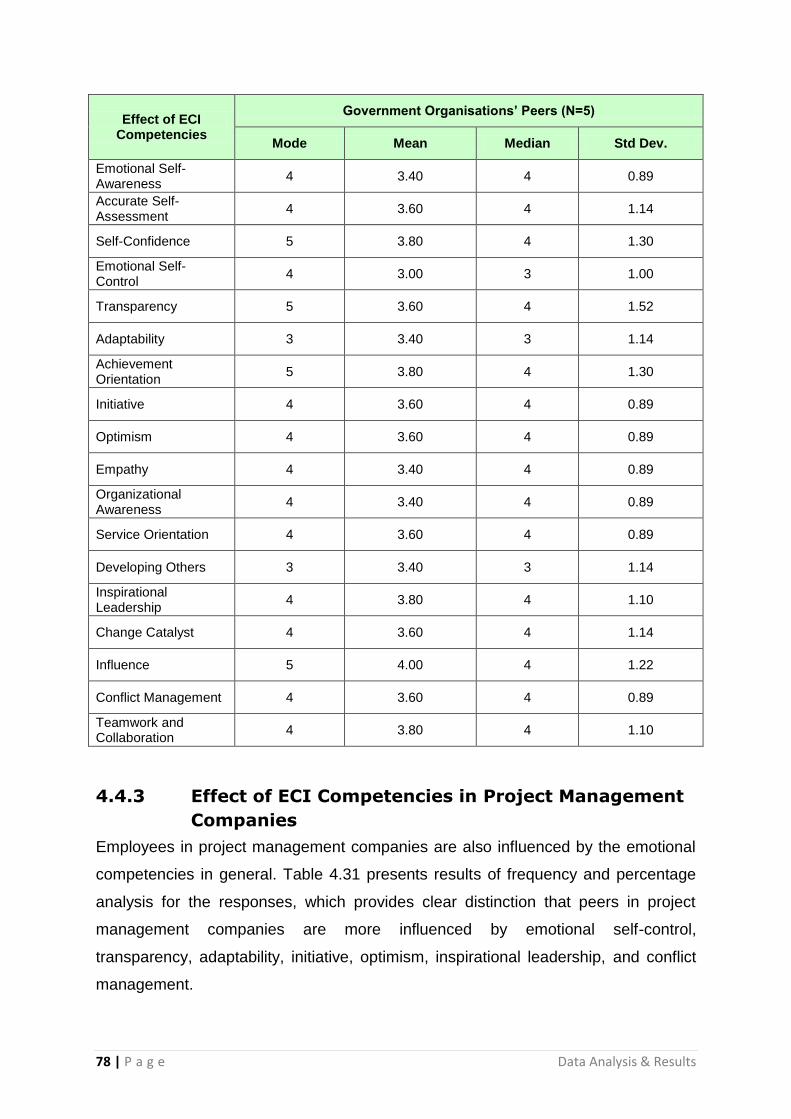
78 | P a g e Data Analysis & Results
Effect of ECI Competencies
GovernmentOrganisations’Peers(N=5)
Mode Mean Median Std Dev.
Emotional Self-Awareness
4 3.40 4 0.89
Accurate Self-Assessment
4 3.60 4 1.14
Self-Confidence 5 3.80 4 1.30
Emotional Self-Control
4 3.00 3 1.00
Transparency 5 3.60 4 1.52
Adaptability 3 3.40 3 1.14
Achievement Orientation
5 3.80 4 1.30
Initiative 4 3.60 4 0.89
Optimism 4 3.60 4 0.89
Empathy 4 3.40 4 0.89
Organizational Awareness
4 3.40 4 0.89
Service Orientation 4 3.60 4 0.89
Developing Others 3 3.40 3 1.14
Inspirational Leadership
4 3.80 4 1.10
Change Catalyst 4 3.60 4 1.14
Influence 5 4.00 4 1.22
Conflict Management 4 3.60 4 0.89
Teamwork and Collaboration
4 3.80 4 1.10
4.4.3 Effect of ECI Competencies in Project Management
Companies
Employees in project management companies are also influenced by the emotional
competencies in general. Table 4.31 presents results of frequency and percentage
analysis for the responses, which provides clear distinction that peers in project
management companies are more influenced by emotional self-control,
transparency, adaptability, initiative, optimism, inspirational leadership, and conflict
management.
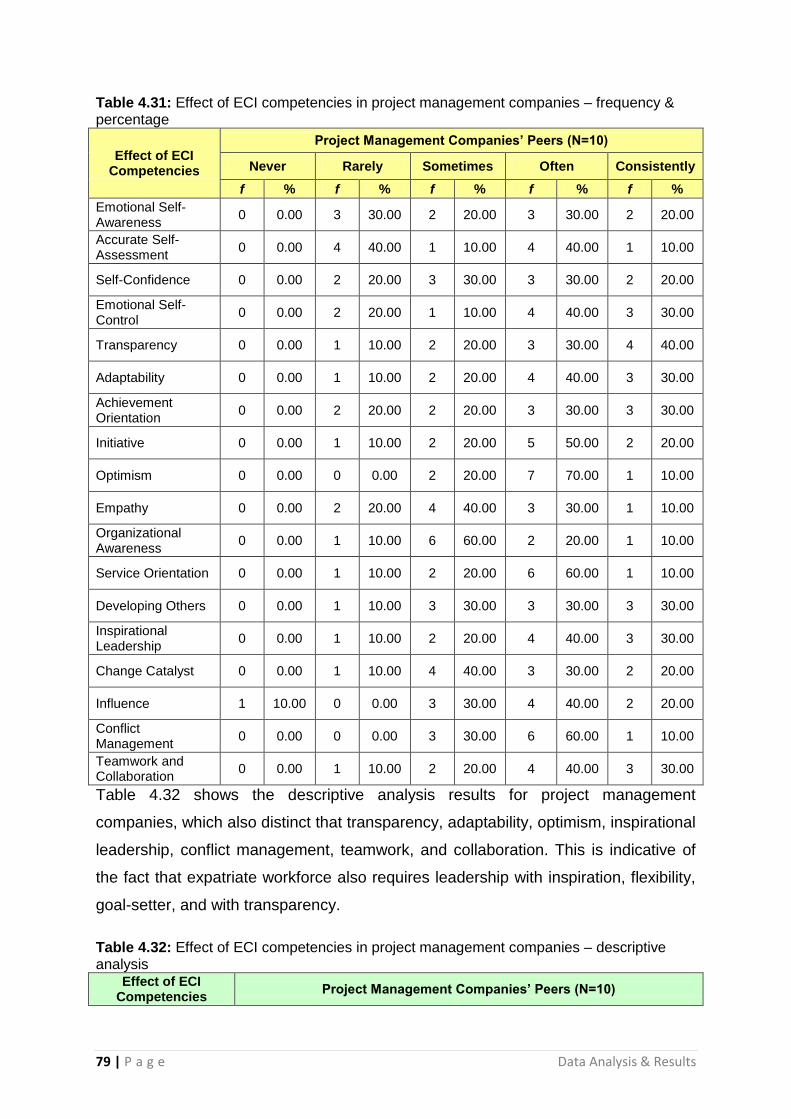
79 | P a g e Data Analysis & Results
Table 4.31: Effect of ECI competencies in project management companies – frequency & percentage
Effect of ECI Competencies
ProjectManagementCompanies’Peers(N=10)
Never Rarely Sometimes Often Consistently
f % f % f % f % f %
Emotional Self-Awareness
0 0.00 3 30.00 2 20.00 3 30.00 2 20.00
Accurate Self-Assessment
0 0.00 4 40.00 1 10.00 4 40.00 1 10.00
Self-Confidence 0 0.00 2 20.00 3 30.00 3 30.00 2 20.00
Emotional Self-Control
0 0.00 2 20.00 1 10.00 4 40.00 3 30.00
Transparency 0 0.00 1 10.00 2 20.00 3 30.00 4 40.00
Adaptability 0 0.00 1 10.00 2 20.00 4 40.00 3 30.00
Achievement Orientation
0 0.00 2 20.00 2 20.00 3 30.00 3 30.00
Initiative 0 0.00 1 10.00 2 20.00 5 50.00 2 20.00
Optimism 0 0.00 0 0.00 2 20.00 7 70.00 1 10.00
Empathy 0 0.00 2 20.00 4 40.00 3 30.00 1 10.00
Organizational Awareness
0 0.00 1 10.00 6 60.00 2 20.00 1 10.00
Service Orientation 0 0.00 1 10.00 2 20.00 6 60.00 1 10.00
Developing Others 0 0.00 1 10.00 3 30.00 3 30.00 3 30.00
Inspirational Leadership
0 0.00 1 10.00 2 20.00 4 40.00 3 30.00
Change Catalyst 0 0.00 1 10.00 4 40.00 3 30.00 2 20.00
Influence 1 10.00 0 0.00 3 30.00 4 40.00 2 20.00
Conflict Management
0 0.00 0 0.00 3 30.00 6 60.00 1 10.00
Teamwork and Collaboration
0 0.00 1 10.00 2 20.00 4 40.00 3 30.00
Table 4.32 shows the descriptive analysis results for project management
companies, which also distinct that transparency, adaptability, optimism, inspirational
leadership, conflict management, teamwork, and collaboration. This is indicative of
the fact that expatriate workforce also requires leadership with inspiration, flexibility,
goal-setter, and with transparency.
Table 4.32: Effect of ECI competencies in project management companies – descriptive analysis
Effect of ECI Competencies
ProjectManagementCompanies’Peers(N=10)

80 | P a g e Data Analysis & Results
Mode Mean Median Std Dev.
Emotional Self-Awareness
4 3.4 3.5 1.17
Accurate Self-Assessment
4 3.2 3.5 1.14
Self-Confidence 4 3.5 3.5 1.08
Emotional Self-Control
4 3.8 4 1.14
Transparency 5 4.0 4 1.05
Adaptability 4 3.9 4 0.99
Achievement Orientation
4 3.7 4 1.16
Initiative 4 3.8 4 0.92
Optimism 4 3.9 4 0.57
Empathy 3 3.3 3 0.95
Organizational Awareness
3 3.3 3 0.82
Service Orientation 4 3.7 4 0.82
Developing Others 4 3.8 4 1.03
Inspirational Leadership
4 3.9 4 0.99
Change Catalyst 3 3.6 3.5 0.97
Influence 4 3.6 4 1.17
Conflict Management 4 3.8 4 0.63
Teamwork and Collaboration
4 3.9 4 0.99
4.5 Correlation of Emotional Intelligence Competencies
This section illustrates further results by analysing the data through the following
techniques:
1. Correlation Test
2. T-test
3. Cronbach-alpha reliability test
4. Chi-square
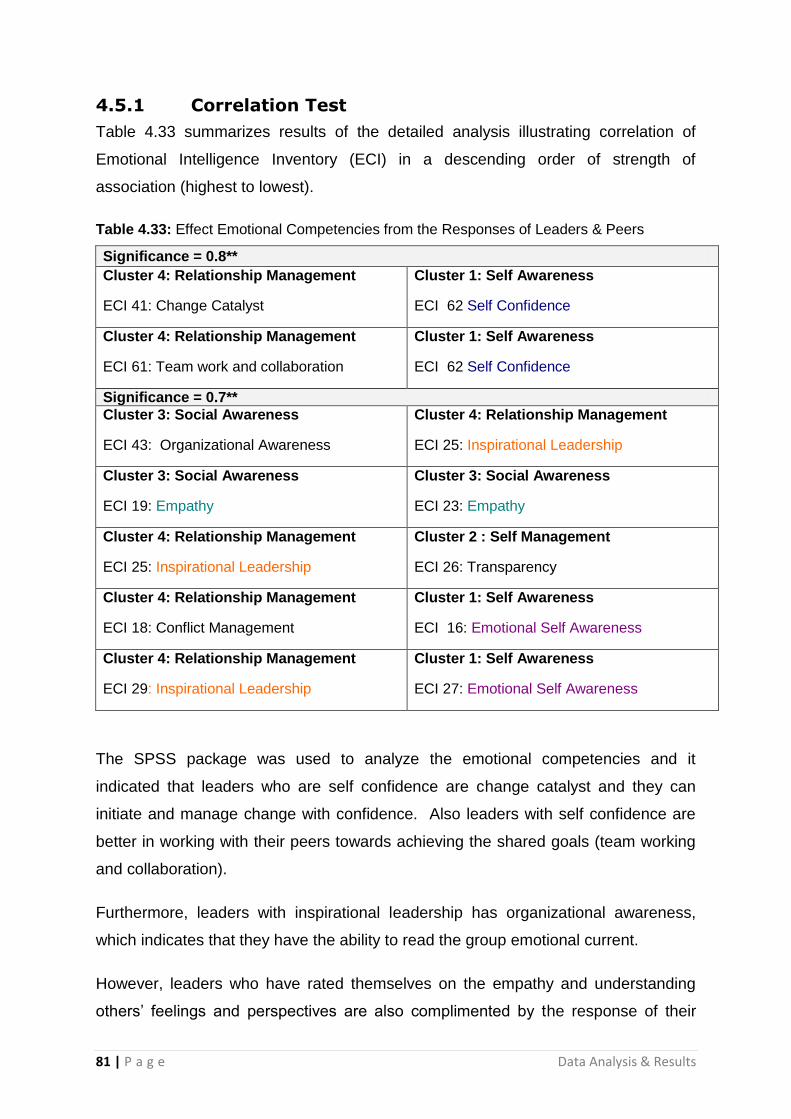
81 | P a g e Data Analysis & Results
4.5.1 Correlation Test
Table 4.33 summarizes results of the detailed analysis illustrating correlation of
Emotional Intelligence Inventory (ECI) in a descending order of strength of
association (highest to lowest).
Table 4.33: Effect Emotional Competencies from the Responses of Leaders & Peers
Significance = 0.8**
Cluster 4: Relationship Management
ECI 41: Change Catalyst
Cluster 1: Self Awareness
ECI 62 Self Confidence
Cluster 4: Relationship Management
ECI 61: Team work and collaboration
Cluster 1: Self Awareness
ECI 62 Self Confidence
Significance = 0.7**
Cluster 3: Social Awareness
ECI 43: Organizational Awareness
Cluster 4: Relationship Management
ECI 25: Inspirational Leadership
Cluster 3: Social Awareness
ECI 19: Empathy
Cluster 3: Social Awareness
ECI 23: Empathy
Cluster 4: Relationship Management
ECI 25: Inspirational Leadership
Cluster 2 : Self Management
ECI 26: Transparency
Cluster 4: Relationship Management
ECI 18: Conflict Management
Cluster 1: Self Awareness
ECI 16: Emotional Self Awareness
Cluster 4: Relationship Management
ECI 29: Inspirational Leadership
Cluster 1: Self Awareness
ECI 27: Emotional Self Awareness
The SPSS package was used to analyze the emotional competencies and it
indicated that leaders who are self confidence are change catalyst and they can
initiate and manage change with confidence. Also leaders with self confidence are
better in working with their peers towards achieving the shared goals (team working
and collaboration).
Furthermore, leaders with inspirational leadership has organizational awareness,
which indicates that they have the ability to read the group emotional current.
However, leaders who have rated themselves on the empathy and understanding
others’ feelings and perspectives are also complimented by the response of their
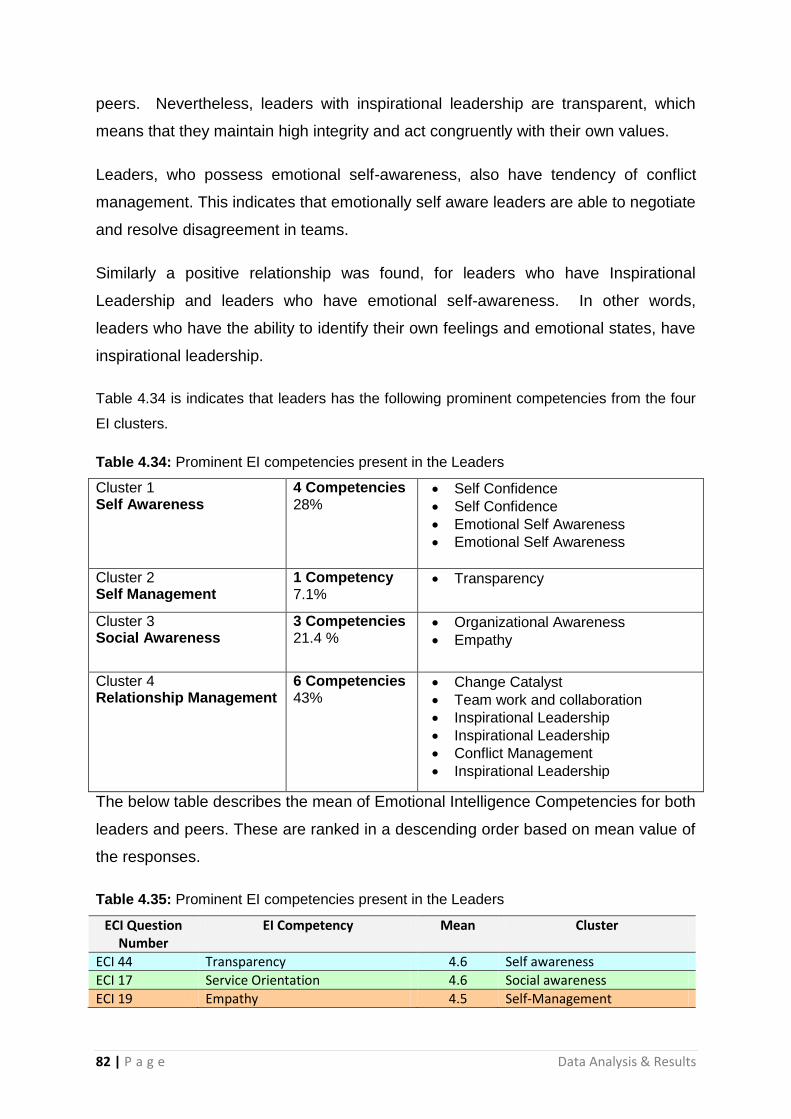
82 | P a g e Data Analysis & Results
peers. Nevertheless, leaders with inspirational leadership are transparent, which
means that they maintain high integrity and act congruently with their own values.
Leaders, who possess emotional self-awareness, also have tendency of conflict
management. This indicates that emotionally self aware leaders are able to negotiate
and resolve disagreement in teams.
Similarly a positive relationship was found, for leaders who have Inspirational
Leadership and leaders who have emotional self-awareness. In other words,
leaders who have the ability to identify their own feelings and emotional states, have
inspirational leadership.
Table 4.34 is indicates that leaders has the following prominent competencies from the four
EI clusters.
Table 4.34: Prominent EI competencies present in the Leaders
Cluster 1 Self Awareness
4 Competencies 28%
Self Confidence
Self Confidence
Emotional Self Awareness
Emotional Self Awareness
Cluster 2 Self Management
1 Competency 7.1%
Transparency
Cluster 3 Social Awareness
3 Competencies 21.4 %
Organizational Awareness
Empathy
Cluster 4 Relationship Management
6 Competencies 43%
Change Catalyst
Team work and collaboration
Inspirational Leadership
Inspirational Leadership
Conflict Management
Inspirational Leadership
The below table describes the mean of Emotional Intelligence Competencies for both
leaders and peers. These are ranked in a descending order based on mean value of
the responses.
Table 4.35: Prominent EI competencies present in the Leaders
ECI Question Number
EI Competency Mean Cluster
ECI 44 Transparency 4.6 Self awareness
ECI 17 Service Orientation 4.6 Social awareness
ECI 19 Empathy 4.5 Self-Management
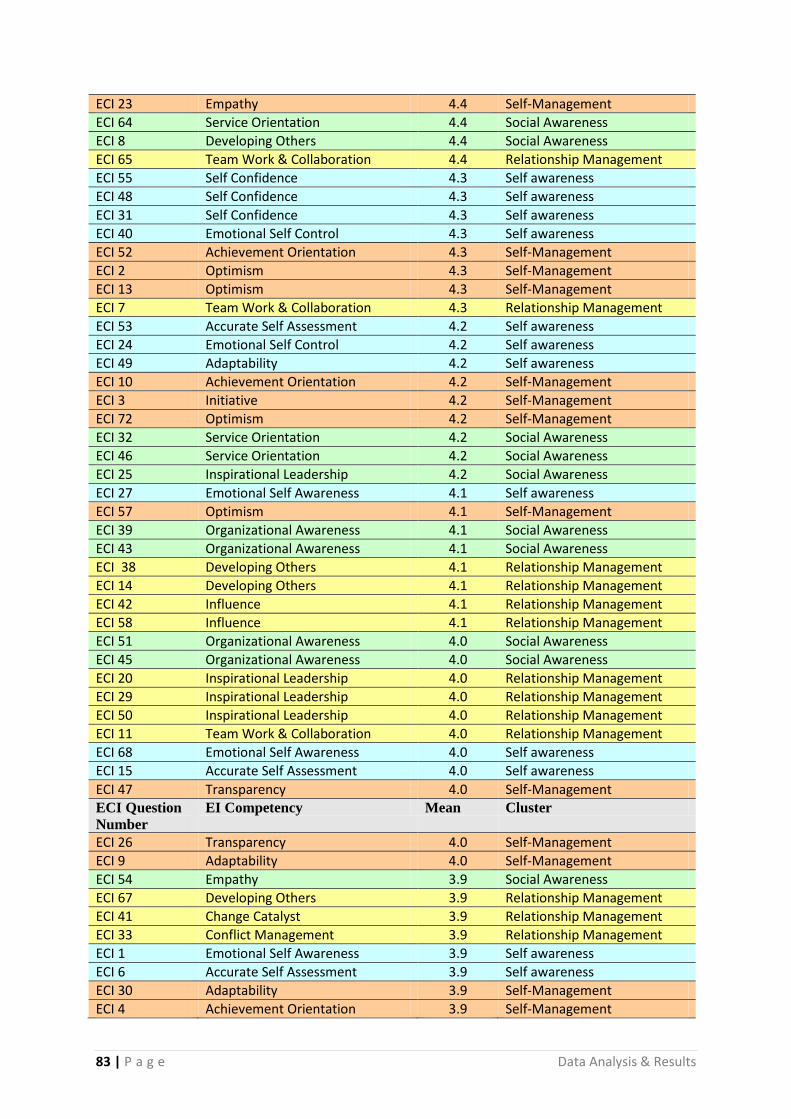
83 | P a g e Data Analysis & Results
ECI 23 Empathy 4.4 Self-Management
ECI 64 Service Orientation 4.4 Social Awareness
ECI 8 Developing Others 4.4 Social Awareness
ECI 65 Team Work & Collaboration 4.4 Relationship Management
ECI 55 Self Confidence 4.3 Self awareness
ECI 48 Self Confidence 4.3 Self awareness
ECI 31 Self Confidence 4.3 Self awareness
ECI 40 Emotional Self Control 4.3 Self awareness
ECI 52 Achievement Orientation 4.3 Self-Management
ECI 2 Optimism 4.3 Self-Management
ECI 13 Optimism 4.3 Self-Management
ECI 7 Team Work & Collaboration 4.3 Relationship Management
ECI 53 Accurate Self Assessment 4.2 Self awareness
ECI 24 Emotional Self Control 4.2 Self awareness
ECI 49 Adaptability 4.2 Self awareness
ECI 10 Achievement Orientation 4.2 Self-Management
ECI 3 Initiative 4.2 Self-Management
ECI 72 Optimism 4.2 Self-Management
ECI 32 Service Orientation 4.2 Social Awareness
ECI 46 Service Orientation 4.2 Social Awareness
ECI 25 Inspirational Leadership 4.2 Social Awareness
ECI 27 Emotional Self Awareness 4.1 Self awareness
ECI 57 Optimism 4.1 Self-Management
ECI 39 Organizational Awareness 4.1 Social Awareness
ECI 43 Organizational Awareness 4.1 Social Awareness
ECI 38 Developing Others 4.1 Relationship Management
ECI 14 Developing Others 4.1 Relationship Management
ECI 42 Influence 4.1 Relationship Management
ECI 58 Influence 4.1 Relationship Management
ECI 51 Organizational Awareness 4.0 Social Awareness
ECI 45 Organizational Awareness 4.0 Social Awareness
ECI 20 Inspirational Leadership 4.0 Relationship Management
ECI 29 Inspirational Leadership 4.0 Relationship Management
ECI 50 Inspirational Leadership 4.0 Relationship Management
ECI 11 Team Work & Collaboration 4.0 Relationship Management
ECI 68 Emotional Self Awareness 4.0 Self awareness
ECI 15 Accurate Self Assessment 4.0 Self awareness
ECI 47 Transparency 4.0 Self-Management ECI Question
Number
EI Competency Mean Cluster
ECI 26 Transparency 4.0 Self-Management
ECI 9 Adaptability 4.0 Self-Management
ECI 54 Empathy 3.9 Social Awareness
ECI 67 Developing Others 3.9 Relationship Management
ECI 41 Change Catalyst 3.9 Relationship Management
ECI 33 Conflict Management 3.9 Relationship Management
ECI 1 Emotional Self Awareness 3.9 Self awareness
ECI 6 Accurate Self Assessment 3.9 Self awareness
ECI 30 Adaptability 3.9 Self-Management
ECI 4 Achievement Orientation 3.9 Self-Management

84 | P a g e Data Analysis & Results
ECI 12 Achievement Orientation 3.8 Self-Management
ECI 34 Influence 3.8 Relationship Management
ECI 35 Change Catalyst 3.8 Relationship Management
ECI 59 Influence 3.7 Relationship Management
ECI 69 Adaptability 3.6 Self-Management ECI 36 Change Catalyst 3.6 Relationship Management
ECI 16 Emotional Self Awareness 3.5 Self awareness
ECI 22 Transparency 3.5 Self Management
ECI 22 Transparency 3.5 Self-Management
ECI 56 Initiative 3.4 Self-Management
ECI 18 Conflict Management 3.4 Relationship Management
ECI 63 Conflict Management 3.4 Relationship Management
ECI 28 Conflict Management 3.2 Relationship Management
ECI 70 Initiative 2.9 Self-Management
ECI 60 Emotional self Control 2.7 Self-Management
ECI 5 Change Catalyst 2.7 Relationship Management
ECI 21 Accurate Self Assessment 2.6 Self awareness
ECI 37 Emotional Self Control 2.3 Self-Management
ECI 66 Initiative 2.0 Self-Management
ECI 61 Team Work and Collaboration 1.9 Relationship Management
ECI 62 Self Confidence 1.8 Self awareness
The above table indicates that half of the EI competencies with low means are in the
Cluster 2 (Self Management). This implies that the cluster of self-management is an
area for leader development in the construction market of Dubai. There are however
few occurrences of high means in cluster 2 (self management) but an over
representation in low means. The cluster with many of the lowest means overall is
Relationship Management.
Furthermore, Table 4.35 illustrates that the top Emotional Intelligence competencies
(in terms of rank order mean score 4.5) are transparency (Self-awareness), service
orientation (Social awareness), and empathy (self-management).
Table 4.36 summarises the mean value of responses for the four EI Clusters and it
indicates that averaging of leader and peer responses makes all the clusters mean
value close-by. This indicates that Self-Awareness cluster is the least of all.
Table 4.36: EI Clusters and Mean of Leader and Peer responses
EI Clusters Mean Value
Social Awareness 4.2
Self-Management 3.8
Relationship Management 3.8
Self-Awareness 3.7

85 | P a g e Data Analysis & Results
4.5.2 T-test
The detailed results from the independent T test using the SPSS package are
included in the Appendix D. In summary, there is no variance score difference
between the leaders and peers responses for significance at 1% level.
However, there are four variance score that are significant at 5% level.
ECI 1: Emotional Self Awareness
ECI 48: Self Confidence
ECI 19: Empathy
ECI 29: Inspirational Leadership
The mean score differences for the above four competencies are not significant at 5
% level. This indicates that perception of the leaders and peers on the emotional
intelligence of a leader are almost the same, which makes it worthy to consider
results of the peers and leaders as one sample.
4.5.3 Cronbach-Alpha Reliability Test
Table 4.36 describes Cronbach-Alpha value of the 18 Emotional Intelligence
Competencies. It indicates that questions for the competency number 13,
(Developing others) are highly reliable test items as compared to other test items.
The test items numbers 8, 14, 38 and 67 from the 72 questions are as follows:
(8) Give Constructive Feedback
(14) Gives Directions or demonstrations to develop someone
(38) Recognize Specific strengths of others
(67) Provide ongoing mentoring or coaching
The test items for competency numbers 1, 6, 7, 10, 11, 12, and 14 have cronbach-
alpha value between 0.6 and 0.793. This indicates that competencies have
reasonable level of reliability and needs to be improved in future researches.
Furthermore, the remaining competencies, which are number 2, 3, 4,5,8,9, 15, 16,
17 and 18 have cronbach-alpha value of less than 0.6. This illustrates that in future
researches the test items are to be redesigned based on the local conditions. This
can be achieved by including new test items and/or modified test items.
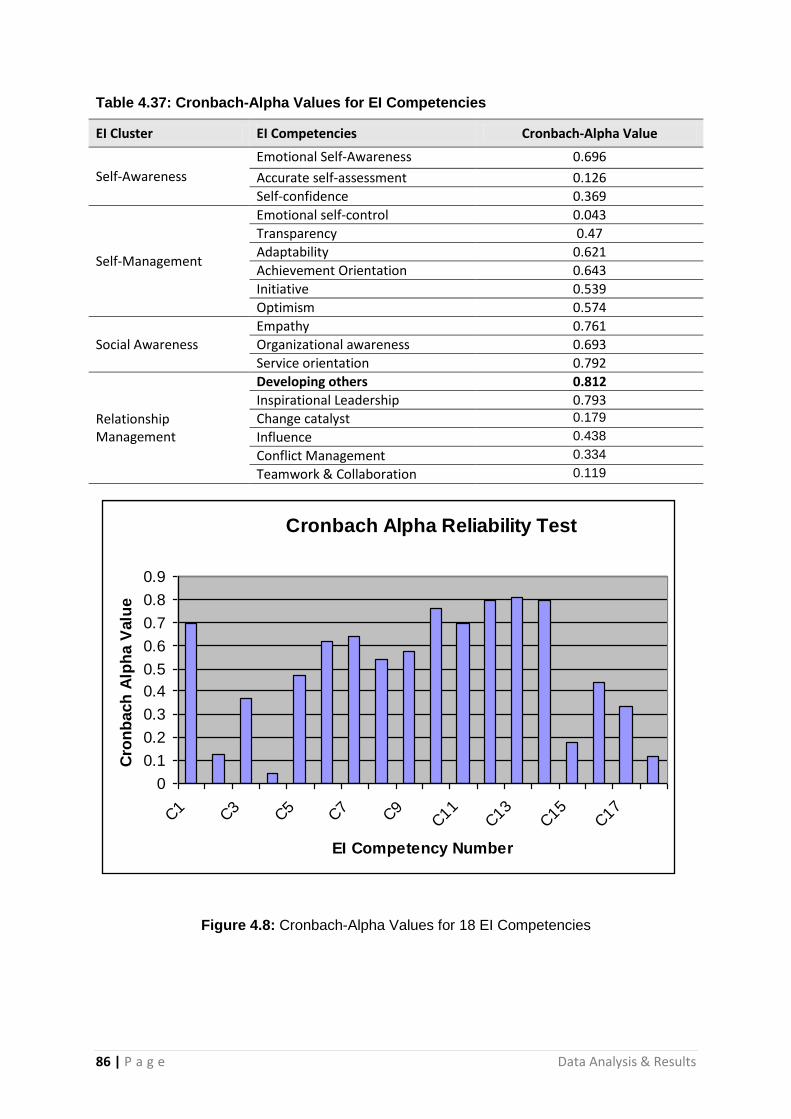
86 | P a g e Data Analysis & Results
Cronbach Alpha Reliability Test
0
0.1
0.2
0.3
0.4
0.5
0.6
0.7
0.8
0.9
C1
C3
C5
C7
C9
C11
C13
C15
C17
EI Competency Number
Cro
nb
ach
Alp
ha V
alu
e
Series1
Table 4.37: Cronbach-Alpha Values for EI Competencies
EI Cluster EI Competencies Cronbach-Alpha Value
Self-Awareness
Emotional Self-Awareness 0.696
Accurate self-assessment 0.126
Self-confidence 0.369
Self-Management
Emotional self-control 0.043
Transparency 0.47
Adaptability 0.621
Achievement Orientation 0.643
Initiative 0.539
Optimism 0.574
Social Awareness
Empathy 0.761
Organizational awareness 0.693
Service orientation 0.792
Relationship Management
Developing others 0.812
Inspirational Leadership 0.793
Change catalyst 0.179
Influence 0.438
Conflict Management 0.334
Teamwork & Collaboration 0.119
Figure 4.8: Cronbach-Alpha Values for 18 EI Competencies

87 | P a g e Data Analysis & Results
4.5.4 Chi-Square Test
The Chi-Square test was performed using SPSS package. It indicates that leaders
ineffective in Teamwork and Collaboration (ECI 61) are also low in Self-Confidence
(ECI 62). On the other hand side, leaders who have the ability to build and lead
teams are having good awareness of their self worth and abilities.
Table 4.38: Chi-square test for EI Competencies
0.8**
Cluster 4: Relationship Management
ECI 41: Change Catalyst
Cluster 1: Self Awareness
ECI 62 Self Confidence
Cluster 4: Relationship Management
ECI 61: Team work and collaboration
Cluster 1: Self Awareness
ECI 62 Self Confidence
0.7**
Cluster 3: Social Awareness
ECI 43: Organizational Awareness
Cluster 4: Relationship Management
ECI 25: Inspirational Leadership
Cluster 3: Social Awareness
ECI 19: Empathy
Cluster 3: Social Awareness
ECI 23: Empathy
Cluster 4: Relationship Management
ECI 25: Inspirational Leadership
Cluster 2 : Self Management
ECI 26: Transparency
Cluster 4: Relationship Management
ECI 18: Conflict Management
Cluster 1: Self Awareness
ECI 16: Emotional Self Awareness
Cluster 4: Relationship Management
ECI 29: Inspirational Leadership
Cluster 1: Self Awareness
ECI 27: Emotional Self Awareness
The results indicated in Table 4.38 signify that leaders who possess inspirational
leadership (ECI 25) are also high on the transparency competency. In contrast,
leaders who have compelling vision to lead individuals and teams are honest, trust
worthy and have integrity. Thus, transparency coaching and mentoring is required in
order to develop leaders with an Inspirational Leadership.
Furthermore, leaders with inspirational leadership (ECI 25) also have emotional self-
awareness (ECI 26). This means leaders who have compelling vision to lead
individuals and teams, are having the ability to read their own emotions, and
appreciate the impact on their action, reactions and decisions. The following Tables

88 | P a g e Data Analysis & Results
number 4.39 to 4.44 illustrates a sample of chi-square analysis carried out for the
Emotional Intelligence competencies.
Table 4.39: Cross-tabulation for ECI 61 & ECI 62
ECI62
.00 1.00 Total
ECI61
.00 Count 38 0 38
% within ECI62 95.0% .0% 90.5%
% of Total 90.5% .0% 90.5%
1.00 Count 2 2 4
% within ECI62 5.0% 100.0% 9.5%
% of Total 4.8% 4.8% 9.5%
Total Count 40 2 42
% within ECI62 100.0% 100.0% 100.0%
% of Total 95.2% 4.8% 100.0%
Table 4.40: Chi-Square Tests for ECI 61 & ECI 62
Value df
Asymp. Sig.
(2-sided)
Exact Sig.
(2-sided)
Exact Sig.
(1-sided)
Pearson Chi-Square 19.950a 1 .000
Continuity Correctionb 10.448 1 .001
Likelihood Ratio 10.536 1 .001
Fisher's Exact Test .007 .007
Linear-by-Linear Association
19.475 1 .000
N of Valid Cases 42
a. 3 cells (75.0%) have expected count less than 5. The minimum expected count is .19.
b. Computed only for a 2x2 table

89 | P a g e Data Analysis & Results
Table 4.41: Cross-tabulation for ECI 25 & ECI 26
ECI 26
.00 1.00 Total
ECI 25
.00 Count 6 2 0
% within ECI 26 54.5% 7.1% .0%
% of Total 15.0% 5.0% .0%
1.00 Count 5 26 1
% within ECI 26 45.5% 92.9% 100.0%
% of Total 12.5% 65.0% 2.5%
Total Count 11 28 1
% within ECI 26 100.0% 100.0% 100.0%
% of Total 27.5% 70.0% 2.5%
Table 4.42: Chi-Square Tests for ECI 25 & ECI 26
Value df
Asymp. Sig.
(2-sided)
Pearson Chi-Square 11.347a 2 .003
Likelihood Ratio 10.464 2 .005
Linear-by-Linear Association 4.000 1 .046
N of Valid Cases 40
a. 3 cells (50.0%) have expected count less than 5. The minimum expected count is .20.

90 | P a g e Data Analysis & Results
Table 4.43: Cross-tabulation for ECI 29 & ECI 27
ECI 27
.00 1.00 Total
ECI 29
.00 Count 4 4 8
% within ECI 27 57.1% 15.4% 24.2%
% of Total 12.1% 12.1% 24.2%
1.00 Count 3 22 25
% within ECI 27 42.9% 84.6% 75.8%
% of Total 9.1% 66.7% 75.8%
Total Count 7 26 33
% within ECI 27 100.0% 100.0% 100.0%
% of Total 21.2% 78.8% 100.0%
Table 4.44: Chi-Square Tests for ECI 29 & ECI 27
Value df
Asymp. Sig.
(2-sided)
Exact Sig.
(2-sided)
Exact Sig.
(1-sided)
Pearson Chi-Square 5.236a 1 .022
Continuity Correctionb 3.210 1 .073
Likelihood Ratio 4.669 1 .031
Fisher's Exact Test .042 .042
Linear-by-Linear Association
5.078 1 .024
N of Valid Cases 33
a. 3 cells (75.0%) have expected count less than 5. The minimum expected count is .19.
b. Computed only for a 2x2 table

91 | P a g e Findings & Discussion
55 FFIINNDDIINNGGSS && DDIISSCCUUSSSSIIOONN
This chapter of the dissertation summarises the major findings from the research
process and analysis of results. The findings are not only limited to the results
obtained from the survey data, but also shares the experience gained from the
research carried out on emotional intelligence in leaders from the construction
industry of Dubai. Lastly, the chapter discusses how the research aim and objectives
are fulfilled by finding answers to the research questions.
5.1 Findings
The dissertation has led to numerous findings, parts of which are discussed in the
second section of this chapter. This section provides a summary of findings as
presented below,
Emotional Intelligence concept is novel to the UAE market and requires
considerable research and development for the workforce.
The survey results indicate that construction leaders in Dubai possess the
following emotional intelligence competencies; emotional self-awareness,
transparency, adaptability, achievement orientation, optimism, empathy,
service orientation, developing others, and inspirational leadership.
Results show that team member performance is significantly related to the
emotional intelligence of the leader.
Results revealed significant differences between leaders in private developers
and Government Organisations in the overall emotional intelligence, and in
the particular competency areas of stress management and adaptability.
The apparent overall trend in this research was that the emotional intelligence
of leaders in the study is well-related to the performance of their team and
contributes towards positive influence on team-members.
A positive relationship is found between emotional intelligence, leadership
styles and team performance, with leaders who rated themselves as more
democratic in their leadership style, also reporting themselves as being able
to identify their own feelings and emotional states; to express those inner
feelings to others; to identify and understand the emotions of others; manage

92 | P a g e Findings & Discussion
positive and negative emotions both within oneself and others; effectively
control strong emotional state experienced at work such as anger, stress,
anxiety and frustration.
While conducting the survey, it was found that there is a need to
professionally translate the descriptions of each leadership styles and
emotional intelligence competency into Arabic to facilitate precision and
correct interpretation of the questionnaires.
Correlation analysis indicates that leaders in the construction industry of
Dubai, has lack of the Self-management cluster, which includes following
competencies:
o Emotional Self Control
o Transparency
o Adaptability
o Achievement Orientation
o Initiatives
o Optimism
Chi-Square tests indicate that leaders who possess the inspirational
leadership competence also have the transparency competency. This leads to
an opportunity for coaching in the field of transparency. Conversely, leaders
who are ineffective in teamwork and collaboration (ECI 61) are also low in
self-confidence (ECI62). This issue requires coaching and training
interventions.
Furthermore, leaders with inspirational leadership (ECI 25) also have
emotional self-awareness. This means leaders who have compelling vision to
lead individuals and teams, are having the ability to read their own emotions,
and appreciate the impact on their action, reactions and decisions.

93 | P a g e Findings & Discussion
5.2 Discussion
Four main objectives were set at the early stage of the research. First, explore the
theory of Emotional Intelligence and its relation to leadership abilities. Secondly,
examine inter-relationship of Emotional Intelligence among leaders and their teams’
performance. Thirdly, investigate the components of Emotional Intelligence present
among Construction Leaders in Dubai. Finally, illustrate the effects of Emotional
Intelligence on team performance in Dubai’s construction industry. The research
objectives were formulated in the following research questions as described in
Chapter 1.
1. What is Emotional Intelligence, its components and its importance?
2. How does Emotional Intelligence impact the leadership capabilities?
3. Does Emotional Intelligence affect team performance?
4. How do leaders use Emotional Intelligence to enhance team performance?
5. Do leaders in the construction industry of Dubai possess Emotional
Intelligence competencies?
6. Does Emotional Intelligence affect team performance in the construction
industry of Dubai?
This section presents the summarised answers to the above defined research
questions. The detailed responses to the questions have been presented throughout
the dissertation chapters.
1. What is Emotional Intelligence, its components and its importance?
There are a number of definitions for Emotional Intelligence as illustrated in the
Literature review. However, it can be presented in simply as:; “Emotional Intelligence
is the capacity for recognizing our own feelings and those of others, for motivating
ourselves and for managing emotions effectively in ourselves and others”
(Source:….). An emotional competence is a learned capacity based on emotional
intelligence that contributes to effective performance at work.
There are various theories on Emotional Intelligence such as Bar-On’s Emotional
Quotient, MSCEIT, and Goleman’s Emotional Competencies. However, the most
widely recognised for its comprehensiveness is Goleman’s (2002) Emotional
Competency Inventory (ECI). The Emotional Competence Inventory 2.0 (ECI)

94 | P a g e Findings & Discussion
measures 18 competencies organized into four clusters: Self-Awareness, Self-
Management, Social Awareness, and Relationship Management.
Self-Awareness concerns knowing one's internal states, preferences, resources,
and intuitions. The Self-Awareness cluster contains three competencies:
o Emotional Awareness: Recognizing one's emotions and their effects
o Accurate Self-Assessment: Knowing one's strengths and limits
o Self-Confidence: A strong sense of one's self-worth and capabilities
Self-Management refers to managing ones' internal states, impulses, and resources.
The Self-Management cluster contains six competencies:
o Emotional Self-Control: Keeping disruptive emotions and impulses in check
o Transparency: Maintaining integrity, acting congruently with one’s values
o Adaptability: Flexibility in handling change
o Achievement: Striving to improve or meeting a standard of excellence
o Initiative: Readiness to act on opportunities
o Optimism: Persistence in pursuing goals despite obstacles and setbacks
Social Awareness refers to how people handle relationships and awareness of
others’ feelings, needs, and concerns. The Social Awareness cluster contains three
competencies:
o Empathy: Sensing others' feelings and perspectives, and taking an active
interest in their concerns
o Organizational Awareness: Reading a group's emotional currents and
power relationships
o Service Orientation: Anticipating, recognizing, and meeting customers'
needs
Relationship Management concerns the skill or adeptness at inducing desirable
responses in others. The Relationship Management cluster contains six
competencies:
o Developing Others: Sensing others' development needs and bolstering their
abilities
o Inspirational Leadership: Inspiring and guiding individuals and groups
o Change Catalyst: Initiating or managing change
o Influence: Wielding effective tactics for persuasion
o Conflict Management: Negotiating and resolving disagreements
o Teamwork & Collaboration: Working with others toward shared goals.
Creating group synergy in pursuing collective goals.

95 | P a g e Findings & Discussion
Numerous studies show that emotional intelligence is an important element of
success for individuals and organisations (Katz, Maccoby, & Morse, 1950; Katz &
Kahn, 1952; Likert, 1961, 1967; Goleman, Boyatzis, & McKee (2002). Thus, the
importance of emotional intelligence has been researched well and proven in earlier
studies and this research also compliments the earlier findings.
2. How does Emotional Intelligence impact the leadership capabilities?
To answer the question of analysing the impact of emotional intelligence on
leadership capabilities, extensive literature research was carried out. Earlier studies
indicate that emotional intelligence has stronger influence on leaders and specifically
in the construction industry.
Colleen J. Butler and Paul S. Chinowsky (2005) conducted a research on emotional
intelligence and leadership behaviour in construction executives and results of this
exploratory study into the realm of emotional intelligence and leadership behaviours
of construction leaders have indeed proven that a relationship exist. Not only does a
relationship exist, but it is a strong one as measured by social science researcher
standards. While an individual’s total EQ composite was the most important to the
relationship with transformational behaviour, this study also showed specific areas
where an individual could improve their total EQ with the most impact on
transformational behaviour.
The Center for Creative Leadership (CCL) has studied why managers derail on their
way to becoming executives. Four themes have emerged that endure through time
and across countries:
1. Problems with interpersonal relationships
2. Failure to meet business objectives
3. Failure to build and lead a team
4. Inability to change or adapt during a transition (Van Velsor and Leslie, 1995)
In short, difficulties with emotional intelligence are prime contributors to the failure of
otherwise promising executive careers. The first item relates directly to Empathy,
with derailed executives often described as insensitive to others. CCL found
problems with interpersonal relationships in two-thirds of the cases in Europe and
one-third of the cases among derailed American executives. The third item,

96 | P a g e Findings & Discussion
teamwork, is found in what Goleman describes as the Relationship Management
domain, which sits just outside the models of other EI theorists. The fourth item
references the EI element of Adaptability. A growing body of research shows higher
business performance from teams and/or leaders with higher emotional intelligence.
Many of these studies are cited in Primal Leadership (Goleman, et al, 2002).
Emotionally intelligent leaders help organisations create a competitive advantage
through:
improved performance;
more effective leadership;
better teamwork;
improved motivation;
enhanced innovation;
restored trust.
A global consumer products organisation, based in the US, found that 50 per cent of
its divisional presidents were leaving within two years of being hired. The cost of
search and recruitment to replace these people exceeded $4 million. When the
company started to select new senior managers on the basis of EI competencies,
only 6 per cent left within two years and the cost of recruitment was significantly
reduced.
In a study of those senior executives in a global consultancy who were earmarked as
potential directors, it was found that those who succeeded in being promoted
demonstrated marginally superior analytical and conceptual thinking abilities, but
twice as much self-confidence, three times the self-control, twice the empathy and
two-and-a-half times the teamwork as those who were not promoted (Power, 2002).
3. Does Emotional Intelligence affect team performance?
The research proves that emotional intelligence has positive influence on team
performance. The survey results indicate that almost all emotional competencies
defined by Goleman (2002) affect the performance of team-members. However, the
most influential competencies of leader’s are self-confidence, transparency, initiative,
influence, service orientation, influence, teamwork & collaboration, and inspirational
leadership.

97 | P a g e Findings & Discussion
These findings are also supplemented by Rapisarda (2002) research, which studied
18 study groups in an EMBA program at Case Western Reserve University. The
sample consisted of 15 females and 76 males. The participants were assessed with
the 360-degree version of the ECI. Team performance was measured by a
questionnaire filled out by the participants. It measured their perception of team
cohesion and their perception of the team’s performance. aculty were also asked to
rate team cohesiveness and performance. The findings show that nine competencies
- achievement orientation, empathy, influence, communications, leadership, conflict
management, self-control, adaptability, and building bonds - were significantly
correlated with student ratings of cohesiveness. Two competencies, achievement
orientation and empathy, were positively correlated with (marginal significance of p <
.10) the student ratings of performance. Achievement orientation and influence were
positively correlated with (p < .10) the faculty ratings of cohesiveness.
In a research by Paul G. Power (2002), in one organisation, divisions led by senior
managers who demonstrated a critical mass of emotional intelligence capabilities
outperformed annual earnings goals by 20 per cent. Conversely, divisions led by
senior managers without that critical mass underperformed by almost the same
percentage.
4. How do leaders use Emotional Intelligence to enhance team performance?
Studies have found that the competencies assessed via the ECI have predicted
performance in a wide variety of organisational contexts and roles: for example, in
college leadership, sales, finance, call centres, fire-fighters, human resources,
research and development, as well as senior executives and other organisational
leaders (Hay Group, 2005).
Lloyd found that higher ECI ratings for area development managers working for a
British brewing company predicted better performance compared with those who had
received lower ratings (Hay Group, 2005). Research conducted at the McClelland
Center for Innovation and Research18 shows that the higher individuals move up in
an organisation, the more likely they are to over-rate themselves on these
competencies and develop blind spots that can hinder their effectiveness as leaders.
Because they tend not to see themselves as others see them, they often lose touch

98 | P a g e Findings & Discussion
with those they lead. This is not surprising, given the increased isolation faced by
many executives as they attain the higher reaches of corporate or professional life.
Several studies have shown that the ECI competencies can be developed. Programs
designed to increase and enhance emotional intelligence have been successful, as
Goleman has stated clearly. As the cadre of researchers grows in size, and the
range of research questions continues to expand, we will inevitably learn more and
more about the development of these competencies and the impact of that
development on business results (Hay Group, 2005).
Hay Group research indicates that adults only change their behaviour and habits in
sustainable ways when they go through a series of five discoveries:
1. Who am I?
2. Who do I want to be?
3. How do other people see me?
4. How do I come across to others?
5. What are my goals (my vision for the future)?
Hopkins (2004) also examined the relationship between the competency clusters
and success. She found that relationship management is significantly related to
success for males but not for females. She also found that when males and females
have equivalent total ECI scores that males were rated as more successful (p=.015,
r-squared = .034). A similar result was obtained for the relationship management
competencies. Males were more likely to be rated successful when they had similar
levels of relationship management as females (p=.011, r-squared = .039).
Similarly Cliona Diggns & Pearn Kandola (2004) found that the best managers make
decisions based on a combination of self-management and relationship skills and an
awareness of how their behaviour affects other in the organisation.
5. Do leaders in construction industry of Dubai possess Emotional
Intelligence competencies?
This research question was answered by the survey carried out as part of the study
in the construction industry of Dubai. As detailed in chapter 4, the construction
leaders demonstrate numerous emotional intelligence competencies, which are
verified by their peers. In general, the responses from leaders and their peers reveal

99 | P a g e Findings & Discussion
that optimism, empathy, and organizational awareness are highly prevalent in the
construction industry of Dubai
Leaders in Private Developers organisations view themselves and their peers also
consider them high on emotional self-awareness, transparency, adaptability,
achievement orientation, optimism, empathy, organisational awareness, developing
others, inspirational leadership, and change catalyst.
The leaders in government organisations show higher self-awareness, transparency,
adaptability, achievement orientation, optimism, empathy, service orientation, and
developing others. However, the peers of the leaders in government organisations
feel the leaders are low on emotional self-awareness and adaptability; this can be
the result of red-tape culture.
In project management organisations, the leaders show a high level of emotional
self-awareness, transparency, adaptability, achievement orientation, optimism,
empathy, service orientation, developing others, and inspirational leadership.
Although, leaders believe that they are relatively low on influence competency, their
peers’ responses indicate that the leaders are high on influencing competency.
Hay Group’s Technical Manual (2005) defines six mandatory emotional intelligence
competencies necessary for effective leadership namely, emotional self-awareness,
accurate self-assessment, self-confidence, emotional self-control, empathy and
influence. Of the six mandatory competencies, the construction leaders in Dubai
score low on self-assessment.
6. Does Emotional Intelligence affect team performance in the construction
industry of Dubai?
The survey results from the construction industry indicate that emotional intelligence
does influence the performance of teams in the three types of organisations, which
are private developers, government organisations and project management
companies.
The findings from three types of organisations indicate that self-confidence,
transparency, initiative, service orientation, influence, teamwork & collaboration, and

100 | P a g e Findings & Discussion
inspirational leadership are highly influencing competencies on teams in the
organisations. Other competencies also affect the performance of teams and the
responses from all organisations are relatively similar indicating the emotional
intelligence as a whole has greater influence on team performances.
Riza Yosia Sunindijo; Bonaventura H. W. Hadikusumo; and Stephen Ogunlana
(2007) conducted a study in Thailand on Project Managers and Engineers (PMEs) of
construction industry and concluded that PMEs with higher emotional intelligence
scores tend to use more open communication and proactive leadership styles than
PMEs with lower EI scores. Open communication is a key factor in organizational
success as it opens up the possibility of getting the best from people. Proactivity is
essential to tackle problems at the early stages.
Therefore, a PME with high emotional intelligence can stimulate team performance
and innovation. Positive correlations between leadership behaviours and EI
dimensions were observed. These correlations show the dimensions of EI that
generate particular leadership behaviour. The study also found that EI generates
delegating, open communication, and proactive behaviour. These relationships
support the theory of EI and these three leadership behaviours can bring positive
outcomes for the organization if used properly (Goleman 2001; Goleman et al. 2002;
TalentSmart 2004).

101 | P a g e Conclusions & Recommendations
66 CCOONNCCLLUUSSIIOONNSS && RREECCOOMMMMEENNDDAATTIIOONNSS
The final chapter of the dissertation provides a summary of conclusions drawn from
the extensive research on leadership styles, emotional intelligence, and its link to
teams’ performance. The study does have limitations due to time and accessibility
constraints as described further in this chapter. Importantly, the recommendations on
the emotional intelligence arena for the region and options for future research in the
field are drawn in this chapter.
6.1 Conclusions
In conclusion, I would say that there are a lot of opportunities to improve leader and
their teams through emotional intelligence.
The purpose of this research was to examine the relationships among team
leader emotional intelligence competencies, leadership style, and team
performance. This study provides evidence that emotional intelligence of the
leaders affect team performance.
This study advances the literature pertaining to emotional intelligence by
qualitatively demonstrating the importance of emotional intelligence for
leaders in developing team performance.
This research examined the concept of EI among the leaders of Dubai
construction industry, and how it’s linked to the performance of their team
members, in terms of the 18 EI competencies as well as the leadership styles.
The results reveal significance relationship between the emotional intelligence
of the leader and team performance.
Emotional Intelligence helps people to: be more aware of their interpersonal
style; recognize and mange the impact of emotions on their thoughts and
behaviours; Develop their ability to judge dynamics in the workplace; and
understand how well they manage and improve relationships (Diggns &
Kandola 2004).
Emotional Intelligence is a growing science as a whole; however its novelty in
the Middle East region makes it vital for organisations to invest time and
resources to reach higher peaks in the knowledge based economic world.

102 | P a g e Conclusions & Recommendations
6.2 Limitations
Despite the contribution of this dissertation, the results need to be interpreted with
caution owing to some methodological limitations. Firstly, the survey was limited to a
few top construction related organisations of Dubai.
Secondly, the English language questionnaires may have affected the responses
from leaders and their peers because English is not the first language for the
respondents. Furthermore, in the light of Cronbach-Alpha test analysis the 72
measurement questions should be developed further.
Even though, a generous amount of time (four weeks) was given to the participants
to answer the questionnaires. The quality of the feedback may have been affected,
due to market work pressures on leaders and peers. Finally, the topic of Emotional
Intelligence is relatively new in the region, and this inhibits accurate local input.
6.3 Recommendations
As a result of this preliminary study, some recommendations can be suggested.
The dissertation recommends that investing in developing teams’ emotional
intelligence skills and developing their competencies will significantly increase the
quality of teams’ performance. This can be achieved by the following:
Behaviour modelling: This means to select a role-model who possesses
high emotional intelligence, and Pattern his activities to copy emotionally
intelligent people character and traits
Emotional Intelligence mentoring: This is different form behaviour
modelling; it takes an active interest in developing a person through coaching,
guiding, and shaping a person’s actions. This mentoring is typically
conducted based on a wealth of experience and may involve both personal
and professional conduct.
Benchmarking with emotionally intelligent organisations and collaborating with
Companies that adopt EI concept like Sheraton and Pepsi.
Linking performance appraisal and bonuses with EI test result
Conduct EI awareness campaigns.

103 | P a g e Conclusions & Recommendations
Adopt Daniel Goleman (Optimal Process) for Developing Emotional
Intelligence in Organisations
Incorporate EI as a core course in Leadership development program
Add EI as a basic requirement to pass a job interview.
Enlighten high school students on EI, so that by the time they are in the
career life, they can achieve and deliver.
Start developing the competencies that are lacking, specifically the Self-
management cluster.
Qualify some leaders and some team members to be an Emotional
Intelligence Practitioner. This will foster the EI culture and will have
outstanding results.
6.4 Future Researches
This study is definitely the founding stone for future researches in the region. Further
studies are required in the field of emotional intelligence, specifically in the Arab
World. Future studies can explore (but should not be limited to) the inter-dependency
of Arabian culture and emotional intelligence competencies, integration of emotional
intelligence competencies with Islamic teachings, leadership styles from Arabian
history and links to emotional intelligence.
This study has provided some useful insights into the role emotional intelligence of
leaders play in team performance, particularly in the construction industry of Dubai.
It would be useful to expand this work beyond the construction industry.
A further study, should investigate how would “personality type preferences”
and “thinking preferences” in leader (using Myer Briggs Type Index, MBTI
and Hermann Brain Dominance Instrument, HBDI respectively), is
interrelated to emotional intelligence level of the leaders
Researchers need to address more fully the interrelationship of emotionally
intelligent teams on the profitability of the organisation.
Researchers can examine the emotionally intelligent organisations profitability
compared to non-emotionally intelligent organisations.

104 | P a g e Conclusions & Recommendations
Future research may discuss this topic from different angle (the biological
aspect of emotional intelligence, and the biological dynamics of EI).

105 | P a g e References
77 RREEFFEERREENNCCEESS
Afolabi, Olukayode A.; Ehigie, Benjamin Osayawe “Psychological diversity and team
interaction processes” Academic Exchange Quarterly 22 June 2007 Available from:
www.emeraldinsight.com/1352-7592.htm [29 March 2008].
Ashkanasy, Neal M. ; Rush, Stephen (2004). Emotional Rescue: A conversation with
Neal M. Ashkanasy. Leadership in Action, Vol. 24 No. 4, pp. 15-18.
Bagshaw, Mike. (2000). Emotional intelligence - training people to be affective so
they can be effective. Industrial and Commercial Training, Vol. 32 No. 2, pp. 61-65.
Black, Timothy G.; Westwood, Marvin J. “Evaluating the development of a
multidisciplinary leadership team in a cancer-center” Academic Exchange Quarterly
22 June 2007 Available from: www.emeraldinsight.com/ /0143-7739.htm [29 March
2008].
Bradberry, Travis and Greaves, Jean (2005). The Emotional Intelligence Quick Book.
New York: Fireside. p3-156.
Brown, . William; Bryant, Scott E. & Reilly, Michael D. “Does emotional intelligence
– as measured by the EQI – influence transformational leadership and/or desirable
outcomes?” Academic Exchange Quarterly 22 June 2007 Available from:
www.emeraldinsight.com/ /0143-7739.htm [29 March 2008].
Carmeli, Abraham “The relationship between emotional intelligence and work
attitudes, behavior and outcomes” Academic Exchange Quarterly 22 June 2007
Available from: http://www.emeraldinsight.com/0268-3946.htm [29 March 2008].
Cartwright, Susan and Pappas, Constantinos. (2007). Emotional intelligence, its
measurement and implications for the workplace. International Journal of
Management Reviews. Vol. 10 No. 2, pp. 149-171.
Caruso, David R. and Salovey, Peter (2004). The Emotionally Intelligent Manager.
San Francisco: Jossey-Bass. p1-212.
Cherniss, Cary. (1999). The Business Case for Emotional Intelligence.

106 | P a g e References
Daus, Catherine S.and Ashkanasy, Neal M.. (2005). The case for the ability-based
model of emotional intelligence in organizational behavior. Journal of Organizational
Behavior. Vol. 26, pp.453-466.
Diggins, Cliona; Kandola, Pearn (2004). Emotional intelligence: the key to effective
performance. Leadership & Organization Development Journal, Vol. 12 No. 1, pp.
33-35.
Dimitriades, Zoe S. “Managing emotionally intelligent service workers” Academic
Exchange Quarterly 22 June 2007 Available from: www.emeraldinsight.com/0309-
0590.htm [29 March 2008].
Downey, L.A, Papageorgiou, V. and Stough, C... (2006). Examining the relationship
between leadership, emotional intelligence and intuition in senior female managers.
Leadership & Organization Development Journal, Vol. 27 No. 4, pp. 250-264.
Downey, L.A.; Papageorgiou, V. & Stough, C. “Examining the relationship between
leadership, emotional intelligence and intuition in senior female managers” Academic
Exchange Quarterly 22 June 2007 Available from: www.emeraldinsight.com/ /0143-
7739.htm [29 March 2008].
Dries, Nicky and Pepermans, Ronald. (2007). Using emotional intelligence to identify
high potential: a meta competency perspective. Leadership & Organization
Development Journal, Vol. 28 No. 8, pp. 749-770.
Dulewicz, Victor and Higgs, Malcolm. (2000). Emotional intelligence. Journal of
Managerial Psychology, Vol. 15 No. 4, pp. 341-372.
Dulewicz, Victor and Higgs, Malcolm. (2003). Measuring emotional intelligence:
content, construct and criterion-related validity. Journal of Managerial Psychology,
Vol. 18 No. 4, pp. 405-420.
Dulewicz, Victor; Higgs, Malcolm & Slaski, Mark “Measuring emotional intelligence:
content, construct and criterion-related validity” Academic Exchange Quarterly 22
June 2007 Available from: http://www.emeraldinsight.com/0268-3946.htm [29 March
2008].

107 | P a g e References
Dulewicz, Victor; Higgs, Malcolm “Emotional intelligence A review and evaluation
study” Academic Exchange Quarterly 22 June 2007 Available from: www.emerald-
library.com [29 March 2008].
George, Bill (2003). Authentic Leadership. San Francisco: Jossey-Bass. p1-202.
(last page of content and all the below books are the same)
George, Bill, Mclean, Andrew and Craig, Nick (2008). Finding your True North. San
Francisco: Jossey-Bass. p1-175.
Goleman, Daniel (1996). Emotional Intelligence Why It Can Matter More Than IQ.
London: Bloomsbury Publishing Plc. p 3-352.
Goleman, Daniel (1998). Working with Emotional Intelligence . 2nd ed. London:
Bloomsbury Publishing. p3-316.
Goleman, Daniel, Boyatzis, Rechard and Mckee, Annie (2003). The New Leaders.
2nd ed. London: Time Warner Paperbacks. p3-394.
Goleman, Daniel, Boyatzis, Rechard and Mckee, Annie (2004). Primal Leadership.
2nd ed. USA: Harvard Business School Press. p 3-306.
Goleman, Daniel. (2000). An EI-Based Theory of Performance. Consortium for
Research on Emotional Intelligence in Organization. Available from
http://www.eiconsortium.org/
Goyal, Ajay and Akhilesh, K.B. (2007). Interplay among innovativeness, cognitive
intelligence, emotional intelligence and social capital of work teams. Team
Performance Management, Vol. 13 No. 7/8, pp. 206-226.
Goyal, Ajay; Akhilesh, K.B. “Interplay among innovativeness, cognitive intelligence,
emotional intelligence and social capital of work teams” Academic Exchange
Quarterly 22 June 2007 Available from: www.emeraldinsight.com/1352-7592.htm [29
March 2008].
Grant, Anthony M. “Enhancing coaching skills and emotional intelligence through
training” Academic Exchange Quarterly 22 June 2007 Available from:
http://www.emeraldinsight.com/Insight/ViewContentServlet?Filename=Published/Em
eraldFullTextArticle/Articles/0370390503.html [29 March 2008].
108 | P a g e References
Green, Anna L. and Hill, Aretha Y.. (2005). The use of multiple intelligences to
enhnace team productivity. Management Decision. Vol. 43 No. 3, pp. 349-359.
Green, Anna L.; Hill, Aretha Y.; riday, Earnest; riday, Shawnta S. “The use of
multiple intelligences to enhance team productivity” Academic Exchange Quarterly
22 June 2007 Available from: www.emeraldinsight.com/0025-1747.htm [29 March
2008].
Grewal, Daisy and Salovey, Peter. (2005). The Science of Emotional Intelligence.
American Psychological Society. Vol. 14 No. 6, pp. 281-285.
Grout, Jeff and Fisher, Liz (2007). What do leaders really do?. Chichester: Capstone
Publishing Ltd. p1-196.
Groves, Kevin and Pat McEnrue, Mary. (2006). Choosing Among Tests of Emotional
Intelligence: What Is the Evidence?. Human Resources Development Quarterly. Vol.
17 No. 1, pp. 9-42.
Groves, Kevin S., McEnrue, Mary Pat and Shen, Winny. (2008). Developing and
measuring the emotional intelligence of leaders. Journal of Management
Development, Vol. 27, pp. 225-250.
Groves, Kevin S.. (2006). Leader emotional expressivity, visionary leadership, and
organizational change. Leadership & Organization Development Journal. Vol. 72 No.
7, pp. 566-583.
Groves, Kevin S.; McEnrue, Mary Pat & Shen, Winny “Developing and measuring
the emotional intelligence of leaders” Academic Exchange Quarterly 22 June 2007
Available from: http://www.emeraldinsigh t.com/0262-1711.htm [29 March 2008].
Hede, Andrew “The shadow group” Academic Exchange Quarterly 22 June 2007
Available from: http://www.emeraldinsight.com/0268-3946.htm [29 March 2008].
Holian, Rosalie “Management decision making, ethical issues and “emotional”
intelligence” Academic Exchange Quarterly 22 June 2007 Available from:
www.emeraldinsight.com/0025-1747.htm [29 March 2008].
109 | P a g e References
Hughes, Marcia and Terrell, James Bradford (2007). The Emotionally Intelligent
Team. San Francisco: Jossey-Bass. p1-203.
Hughes, Marcia and Terrell, James Bradford (2009). Team Emotional & Social
Intelligence. San Francisco: Pfeiffer. p1-55.
Indvik, Julie and Johnson, Pamela R.. (1999). Organizational benefits of having
emotionally intelligent managers and employees. Journal of Workplace Learning.
Vol. 11 No. 3, pp. 84-88.
Ireland, Dr. Lew. (2006). Project Manager's Competence in Emotional Intelligence.
Available from http://www.asapm.org
Jackson, Sheila; arndale, Elaine & Kakabadse, Andrew “Executive development:
meeting the needs of top teams and boards” Academic Exchange Quarterly 22 June
2007 Available from: http:// www.emeraldinsigh t.com/0262-1711.htm [29 March
2008].
Johnson, Pamela R.; Indvik, Julie (1999) “Organizational benefits of having
emotionally intelligent managers and employees” Academic Exchange Quarterly 22
June 2007 Available from:
http://www.emeraldinsight.com/Insight/viewContentItem.do?contentType=Article&co
ntentId=882149 [29 March 2008].
Kerr, Robert; Garvin, John; Heaton, Norma & Boyle Emily “Emotional intelligence
and leadership effectiveness” Academic Exchange Quarterly 22 June 2007 Available
from: www.emeraldinsight.com/ /0143-7739.htm [29 March 2008].
Koman, Elizabeth Stubbs and Wolff, Steven B... (2008). Emotional intelligence
competencies in the team and team leader. Journal Management Development, Vol.
27 No. 1, pp. 55-75.
Koman, Elizabeth Stubbs; Wolff, Steven B. “Emotional intelligence competencies in
the team and team leader” Academic Exchange Quarterly 22 June 2007 Available
from: http://www.emeraldinsigh t.com/0262-1711.htm [29 March 2008].
Krames, Jeffrey A. (2005). Jack Welch and the 4E's of Leadership. New York: The
MC Grow Hill. p1-211.

110 | P a g e References
Kunnanatt, James Thomas. (2004). Emotional Intellignece: The New Science of
Interpersonal Effective. Human Resources Development Quarterly. Vol.15 No. 4, pp.
489-495.
Langhorn, Steve “How emotional intelligence can improve management
performance” Academic Exchange Quarterly 22 June 2007 Available from:
www.emeraldinsight.com/0959-6119.htm [29 March 2008].
Langhorn, Steve. (2004). How emotional intelligence can improve management
performance. International Journal of Contemporary Hospitality Management, Vol.
16 No. 4, pp. 220-230.
Locke, Edwin A.. (2005). Why emotional intelligence is an invalid concept. Journal of
Organizational Behavior. Vol. 26, pp. 425-431.
Lynn, Adele B. (2008). The EQ Interview. New York: Amacom. p1-184.
Morehouse, Michelle M. “An exploration of emotional intelligence across career
arenas” Academic Exchange Quarterly 22 June 2007 Available from:
www.emeraldinsight.com/ /0143-7739.htm [29 March 2008].
Morehouse, Michelle M.. (2007). An exploration of emotional intelligence across
career arenas. Leadership & Organization Development Journal, Vol. 28 No. 4, pp.
296-307.
Moriarty, Patricia; Buckley, inian “Increasing team emotional intelligence through
process” Academic Exchange Quarterly 22 June 2007 Available from:
www.emeraldinsight.com/0309-0590.htm [29 March 2008].
Peslak, Alan R.. (2005). Emotions and team projects and processes. Team
Performance Management, Vol. 11No. 7/8, pp. 251-262.
Ringer, T. Martin “Leadership for collective thinking in the work place” Academic
Exchange Quarterly 22 June 2007 Available from: www.emeraldinsight.com/1352-
7592.htm [29 March 2008].
Stein, Steven J. (2007). Make Your Workplace Great. Canada: National Library of
Canada Cataloguing in Publication Data. p1-270.

111 | P a g e References
Suliman, Abubakr M. and Al-Shaikh, Fuad N.. (2007). Emotional intelligence at work:
links to conflict and innovation.Employee Relations, Vol. 29 No. 2, pp. 208-220.
Suliman, Abubakr M.; Al-Shaikh, uad N. “Emotional intelligence at work: links to
conflict and innovation” Academic Exchange Quarterly 22 June 2007 Available from:
www.emeraldinsight.com/0142-5455.htm [29 March 2008].
Vakola, Maria ; Tsaousis , Ioannis & Nikolaou , Ioannis “The role of emotional
intelligence and personality variables on attitudes toward organisational change”
Academic Exchange Quarterly 22 June 2007 Available from:
http://www.emeraldinsight.com/0268-3946.htm [29 March 2008].
Welch, Fim. (2003). The best teams are emotionally literate. Industrial and
Commercial Training, Vol. 35 No. 4, pp. 168-170.
Welch, Jim “The best team are emotionally literate” Academic Exchange Quarterly
22 June 2007 Available from: http://www.emeraldinsigh t.com/0019-7858.htm [29
March 2008].