THE BRAZILIAN TRADE LIBERALISATION
25
THE BRAZILIAN TRADE LIBERALISATION: THE REGIONALIZED IMPACTS ON THE PRODUCTIVE CHAIN OF COTTON, TEXTILE AND APPAREL INDUSTRIES. CÁSSIO FREDERICO CAMARGO ROLIM ([email protected]) CMDE-UFPR Curso de Mestrado em Desenvolvimento Econômico – Universidade Federal do Paraná. Curitiba-PR, Brasil (professor titular) Bolsista da CAPES/MEC LATTS-ENPC Laboratoire Techniques, Territoires et Sociétés – École Nationale des Ponts et Chaussées, Marne la Vallée, France (visiting fellow) 38 th Congress of the European Regional Science Association 28 august-1 september 1998 Vienna During the last 8 years Brazil has experiencing a large program of trade liberalisation overture. The paper analyses the regional impact of this process over the so- called textile chain (cotton-textile-apparel) utilising dates of production and sales from 1980 until 1994 for the most important regions productive in Brazil. In a synthesis, the commercial overture that happened in Brazil during the last 8 years didn’t change the structural tendencies in the spatial division of labour of the productive chain of Cotton, Textile and Apparel industries. It incremented the Cotton March to West, the concurrence among decadent textiles regions as Pernambuco, Minas Gerais and São Paulo and those, more dynamics, as Santa Catarina and Ceará. On the other hand those that are still using old technologies, are closing the plants. But the cotton’s farmers paid the price of this adjusting process.
Transcript of THE BRAZILIAN TRADE LIBERALISATION

THE BRAZILIAN TRADE LIBERALISATION:THE REGIONALIZED IMPACTS ON THE PRODUCTIVE CHAIN OF
COTTON, TEXTILE AND APPAREL INDUSTRIES.
CÁSSIO FREDERICO CAMARGO ROLIM ([email protected])
CMDE-UFPR Curso de Mestrado em Desenvolvimento Econômico –Universidade Federal do Paraná. Curitiba-PR, Brasil(professor titular)Bolsista da CAPES/MEC
LATTS-ENPC Laboratoire Techniques, Territoires et Sociétés – ÉcoleNationale des Ponts et Chaussées, Marne la Vallée, France(visiting fellow)
38th Congress of the European Regional Science Association28 august-1 september 1998
Vienna
During the last 8 years Brazil has experiencing a large program of tradeliberalisation overture. The paper analyses the regional impact of this process over the so-called textile chain (cotton-textile-apparel) utilising dates of production and sales from1980 until 1994 for the most important regions productive in Brazil. In a synthesis, thecommercial overture that happened in Brazil during the last 8 years didn’t change thestructural tendencies in the spatial division of labour of the productive chain of Cotton,Textile and Apparel industries. It incremented the Cotton March to West, the concurrenceamong decadent textiles regions as Pernambuco, Minas Gerais and São Paulo and those,more dynamics, as Santa Catarina and Ceará. On the other hand those that are still usingold technologies, are closing the plants. But the cotton’s farmers paid the price of thisadjusting process.

2
THE BRAZILIAN TRADE LIBERALISATION: THE REGIONALIZED IMPACTS ONTHE PRODUCTIVE CHAIN OF COTTON, TEXTILE AND APPAREL INDUSTRIES
CÁSSIO FREDERICO CAMARGO ROLIM ([email protected]) LATTS-ENPC CMDE-UFPR
1. Introduction[ 1] Protectionism was one of the main features of the Brazilian economy in the secondhalf of the XXth Century. At the beginning of the industrialisation process, protectionismwas a basic element for the import substitution strategy, but in more recent periods it hasbeen considered as a limiting factor to increase efficiency and competitiveness. This diagnosis was already found in analyses about Brazilian economy in theeighties and even during Sarney’s presidency (1985/90) some measures were taken toreduce this excessive protectionism. But it was the government of President Collor(1990/92) which from the beginning of his mandate (in March 1990) gave the way toBrazilian economy. The following Presidents, Itamar Franco (1993/95) and FernandoHenrique Cardoso (1995-?) supported this policy with more or less enthusiasm. The first president Collor’s steps were the fluctuation of the exchange rate and theliberalisation of imports. This liberalisation put an end to import administrative constraintand promoted a program of gradual reduction of import tariffs. One of the first segments affected by this program was the one of the Textile andApparel industry. Events such as the 50% reduction of cotton areas in Brazil and thedissolution of several companies of textile and apparel sector were the starting points ofthis study. To face the lack of information about regional analysis well known in Brazil, weused sources uncommonly used in this kind of survey such as the Statistical System of theNational Confederation of the Industry (CNI) and those of the offices of the FinancialSecretary of State as well as the evaluations of physical output made by the BrazilianInstitute of Geography and Statistics (IBGE). |We also questioned producers andmanufactures. The methodology was based upon the comparison of series of two mainperiods. The first one located in the eighties and the nineties, and even in some cases until1975, and a more recent period, analysed in details, from the trade liberalisation. Althoughthis process began in the government Sarney, it is considered here, as starting withgovernment Collor. At that time it made progress, becoming a clear and importantobjective of economical policy.
The following argument will be developed. The trade liberalisation, which occurredin the last eight years in Brazil, didn't change any of the structural tendencies of the spacedivision of labour in the productive chain of Cotton, Textile and Apparel. It onlyaccelerated the process and increased the existing conflicts among its several segments. Itquickened the development of cotton to the West and increased the competition among thedecadent textile areas such as Pernambuco, Minas Gerais and São Paulo, and the moredynamics, such as Santa Catarina and Ceará. The liberalisation is a road with twodirections (import/export) on which those who accumulated a technological gap of morethan twenty years are living their accelerated end. The agricultural producers of cotton arepaying the price of this adjustment. The paper is divided into 5 parts including an introduction. The second part of thepaper gives a brief survey of the relationships inside the productive chain, as well as the
1 This paper is part of the study Impactos Regionais dos Processos de Regulamentação e Privatizaçãocoordenated by Lenas Lavinas at IPEA.
3
impact of the trade liberalisation. Here the analysis is more focused on the general aspectsof the problem.
In the third part we study the agricultural segment of the productive chain. Here theterritorial impacts of the process are predominant. We examine the industrial segment ofthe chain from its space aspect about physical output, the volume of sales and the numberof employment posts as well as the origin of purchases and the destination of sales. The lastpart makes a synthesis of this research.
2. The trade liberalisation and the productive chain: cotton, textile, and apparel.
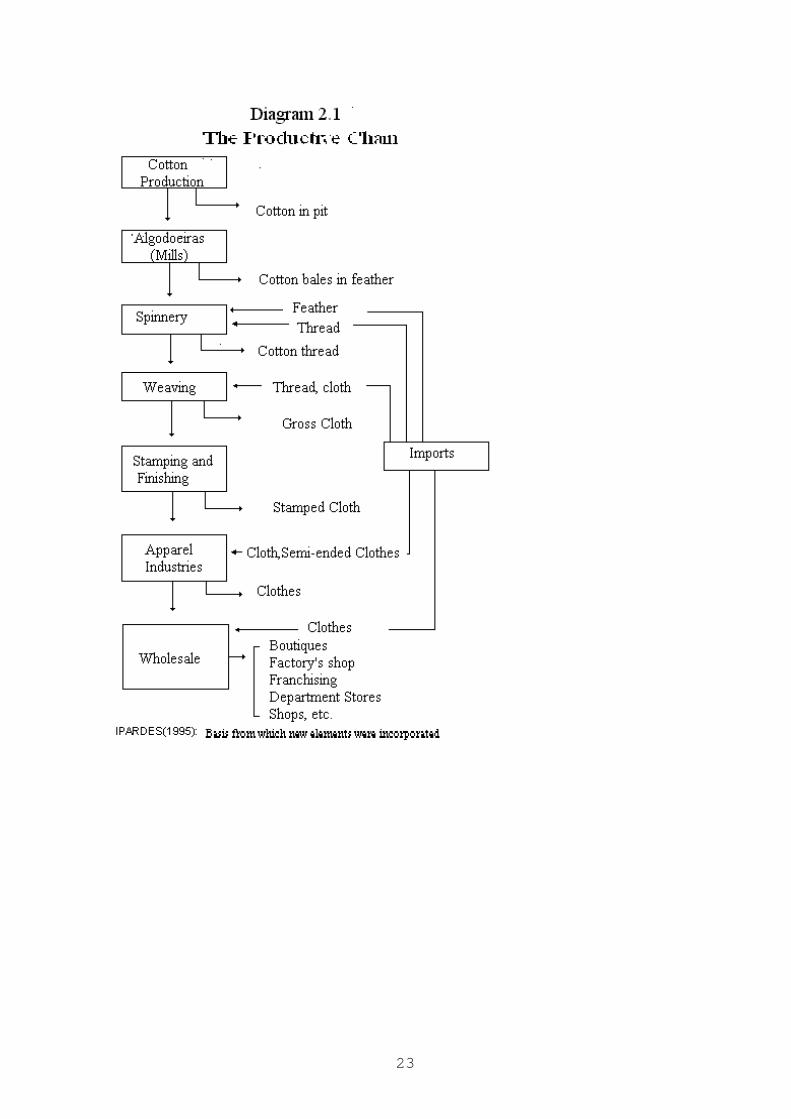
The productive chain of the Cotton, Textile and Apparel is long and complex. It isprobably the only productive chains with strong agricultural links where the integratedoutput doesn’t exist. In the Poultry farming the producing of chickens is the link in thechain co-ordinated by industry, which takes into account the farms output, the assistance tothe producer, the genetic control and even, in same cases, the products distribution to thefinal consumer. In the chain of the Cotton, Textile and Apparel this integration doesn'texist. For the Textile manufacturing the process begins on the door of the factory with acotton bale in feather. For the Apparel industries it begins with the purchase of pieces offabric which are produced anyway.
Although there are other agricultural inputs for the Textile industry, such as wooland silk, the cotton is the fibre that reigns in the Brazilian industry and also in the worldoutput production. In the Brazilian case more of ¾ of the textile production is made fromcotton. This non-integration of the productive process is much more a characteristic of thisindustrial segment. In the production of silk, for example, integration between theagricultural segment and the industrial one exists and it is fundamental for the success ofthe industry.
The diagram 2.1 shows the generic flow of this productive chain in Brazil. Until themiddle of the nineties the only sector periodically open to the imports was the one of thecotton fibre. It was imported directly by the spinnery industries. Later on with thecommercial opening, cloths that will supply the Apparel industries will also be imported.Until then the segments of the Textile industry regulated its prices and production rhythmsto the others. With the commercial liberalisation, for the first time, they begin to feel theeffects of the international competition and to lose part of the control of the system. On theother hand the agricultural segment, already greatly affected, was still in more difficultsituation, what explains the fall of the cotton production in the country.
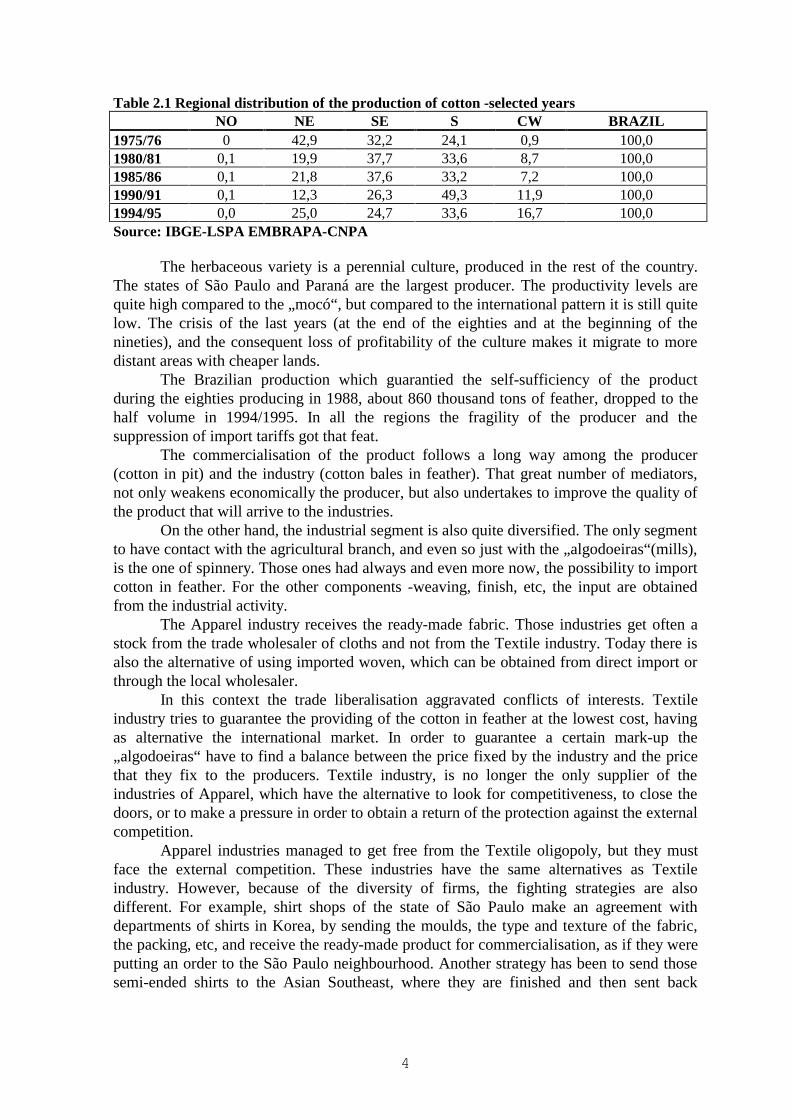
The cotton was rather a culture native of North-east Brazil, (when the arborealvariety, the „mocó“, was dominant). Nowadays this area represents only a small portion ofthe production that is concentrated in the states of São Paulo and Paraná. The Centre-westappears as a new cotton production area. Until the first half of the seventies the Northeastrepresented about 40% of the production and the Southeast and the South about 56%. Inthe middle of the eighties that proportion was already of about 21% for the Northeast and70% for the Southeast and the South, the Centre-west representing already about 7%.Nowadays, amid the nineties, the current actions used to face the crisis of the sectorincrease the participation of the Northeast and of the Centre-west for respectively 25% and16,7%. See table 2.1.
4
Table 2.1 Regional distribution of the production of cotton -selected yearsNO NE SE S CW BRAZIL
1975/76 0 42,9 32,2 24,1 0,9 100,01980/81 0,1 19,9 37,7 33,6 8,7 100,01985/86 0,1 21,8 37,6 33,2 7,2 100,01990/91 0,1 12,3 26,3 49,3 11,9 100,01994/95 0,0 25,0 24,7 33,6 16,7 100,0Source: IBGE-LSPA EMBRAPA-CNPA
The herbaceous variety is a perennial culture, produced in the rest of the country.The states of São Paulo and Paraná are the largest producer. The productivity levels arequite high compared to the „mocó“, but compared to the international pattern it is still quitelow. The crisis of the last years (at the end of the eighties and at the beginning of thenineties), and the consequent loss of profitability of the culture makes it migrate to moredistant areas with cheaper lands.
The Brazilian production which guarantied the self-sufficiency of the productduring the eighties producing in 1988, about 860 thousand tons of feather, dropped to thehalf volume in 1994/1995. In all the regions the fragility of the producer and thesuppression of import tariffs got that feat.
The commercialisation of the product follows a long way among the producer(cotton in pit) and the industry (cotton bales in feather). That great number of mediators,not only weakens economically the producer, but also undertakes to improve the quality ofthe product that will arrive to the industries.
On the other hand, the industrial segment is also quite diversified. The only segmentto have contact with the agricultural branch, and even so just with the „algodoeiras“(mills),is the one of spinnery. Those ones had always and even more now, the possibility to importcotton in feather. For the other components -weaving, finish, etc, the input are obtainedfrom the industrial activity.
The Apparel industry receives the ready-made fabric. Those industries get often astock from the trade wholesaler of cloths and not from the Textile industry. Today there isalso the alternative of using imported woven, which can be obtained from direct import orthrough the local wholesaler.
In this context the trade liberalisation aggravated conflicts of interests. Textileindustry tries to guarantee the providing of the cotton in feather at the lowest cost, havingas alternative the international market. In order to guarantee a certain mark-up the„algodoeiras“ have to find a balance between the price fixed by the industry and the pricethat they fix to the producers. Textile industry, is no longer the only supplier of theindustries of Apparel, which have the alternative to look for competitiveness, to close thedoors, or to make a pressure in order to obtain a return of the protection against the externalcompetition.
Apparel industries managed to get free from the Textile oligopoly, but they mustface the external competition. These industries have the same alternatives as Textileindustry. However, because of the diversity of firms, the fighting strategies are alsodifferent. For example, shirt shops of the state of São Paulo make an agreement withdepartments of shirts in Korea, by sending the moulds, the type and texture of the fabric,the packing, etc, and receive the ready-made product for commercialisation, as if they wereputting an order to the São Paulo neighbourhood. Another strategy has been to send thosesemi-ended shirts to the Asian Southeast, where they are finished and then sent back
5
packed for the commercialisation. [2] Of course only the great companies can follow thosestrategies. However, the predominant companies are small or even family companies. Forthem the strategies consist of obtaining cloth -whatever its nationality is at the lowest priceand at the lowest wages.
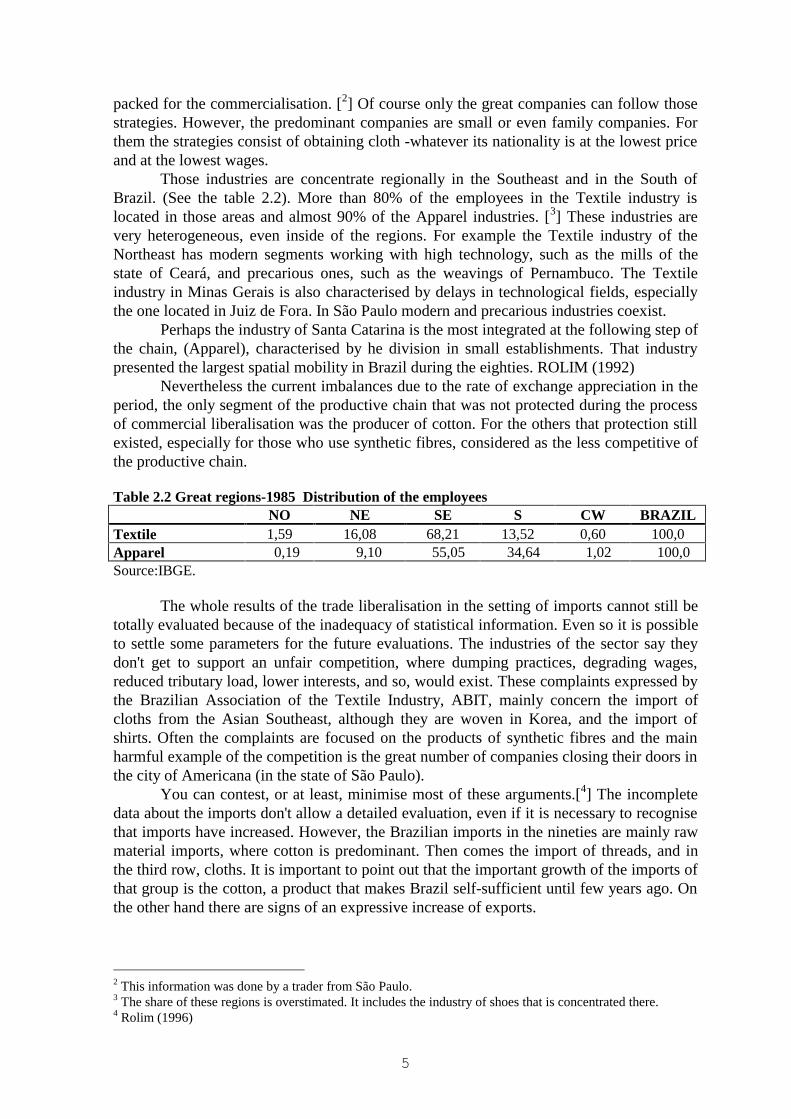
Those industries are concentrate regionally in the Southeast and in the South ofBrazil. (See the table 2.2). More than 80% of the employees in the Textile industry islocated in those areas and almost 90% of the Apparel industries. [3] These industries arevery heterogeneous, even inside of the regions. For example the Textile industry of theNortheast has modern segments working with high technology, such as the mills of thestate of Ceará, and precarious ones, such as the weavings of Pernambuco. The Textileindustry in Minas Gerais is also characterised by delays in technological fields, especiallythe one located in Juiz de Fora. In São Paulo modern and precarious industries coexist.
Perhaps the industry of Santa Catarina is the most integrated at the following step ofthe chain, (Apparel), characterised by he division in small establishments. That industrypresented the largest spatial mobility in Brazil during the eighties. ROLIM (1992)
Nevertheless the current imbalances due to the rate of exchange appreciation in theperiod, the only segment of the productive chain that was not protected during the processof commercial liberalisation was the producer of cotton. For the others that protection stillexisted, especially for those who use synthetic fibres, considered as the less competitive ofthe productive chain.
Table 2.2 Great regions-1985 Distribution of the employeesNO NE SE S CW BRAZIL
Textile 1,59 16,08 68,21 13,52 0,60 100,0Apparel 0,19 9,10 55,05 34,64 1,02 100,0Source:IBGE.
The whole results of the trade liberalisation in the setting of imports cannot still betotally evaluated because of the inadequacy of statistical information. Even so it is possibleto settle some parameters for the future evaluations. The industries of the sector say theydon't get to support an unfair competition, where dumping practices, degrading wages,reduced tributary load, lower interests, and so, would exist. These complaints expressed bythe Brazilian Association of the Textile Industry, ABIT, mainly concern the import ofcloths from the Asian Southeast, although they are woven in Korea, and the import ofshirts. Often the complaints are focused on the products of synthetic fibres and the mainharmful example of the competition is the great number of companies closing their doors inthe city of Americana (in the state of São Paulo).
You can contest, or at least, minimise most of these arguments.[4] The incompletedata about the imports don't allow a detailed evaluation, even if it is necessary to recognisethat imports have increased. However, the Brazilian imports in the nineties are mainly rawmaterial imports, where cotton is predominant. Then comes the import of threads, and inthe third row, cloths. It is important to point out that the important growth of the imports ofthat group is the cotton, a product that makes Brazil self-sufficient until few years ago. Onthe other hand there are signs of an expressive increase of exports.
2 This information was done by a trader from São Paulo.3 The share of these regions is overstimated. It includes the industry of shoes that is concentrated there.4 Rolim (1996)
6
The comparison of the Brazilian cost structures with to some competitive countriesis the starting point for the understanding of the impact of the commercial liberalisation inthis sector.
The cost assessments for the cotton in feather in the crop 1993/94 were of US$1,36/kg in Brazil, US$ 1,42/kg in Argentina, US$ 1,86/kg in United States. [5] The feasibleexplanations for these results about to the cotton are probably related with the migration ofthe culture. (ROLIM,1996)
The estimates for the activities of spinnery and weaving allow discerning some ofthe points pointed out by ABIT. From Hrivanatz’s study HRIVANATZ(1991) at first wecalculated the difference between the structures of costs used in Germany, India, Japan,Korea, USA, on the basis of costs used in Brazil.
Broadly speaking, Brazil has an enormous advantage on the other studied countriesas far as energy and raw material are concerned. The great Brazilian disadvantage is in thecapital costs. In view of the structure of costs of each country and the importance of thisdata, we have the main explanation, in proportional terms, of the high costs of the Brazilianproduction.Compared to Korea, considered as the great Brazilian competitor, there are some strangedata. At first place the differential of total costs turns around 10%, the one of labour, 12%and the one of capital 41%. In the structure of Brazilian costs, labour has an equivalentproportion to the Korean, about 8%. Capital, however, represents 41% in Brazil and 27%in Korea. So it is difficult to understand the importance that entrepreneurs of this sector putin the weight of labour to the so-called „Custo Brasil“.
These values take only into account the production costs. Although they are thebasis of the formation of the sale prices, they don’t integrate commercialisation costs and,mainly, the mark-up of the companies. These figures don’t give either a good image of thedifferentials of productivity among the countries. Besides they concern the year 1991 whenthe raw material, the cotton, had not undergone the whole effect of trade liberalisation.
Even if we consider that in the following years the pressure on the raw materialincreased and that the increase of interests rate occurred in Brazil in more recent periods,the possible loss of competitiveness due to the increase of the called „Custo Brasil“ can befound in that component: the high interests.
In its arguing in favour of the protection against the international competition thetextile industry evokes the volume of unemployment. The data don't confirm this argument.(ROLIM,1996). The volume of employment in 1994 corresponds in half of the existingones in 1990. It is probably due to the technological innovations in the sector and not to theoutside competition. This innovation can be esteemed on the basis of the number ofimports of machines that between 1989 and 1994 had an increase of 127%. That implies ahuge productivity gain,
„...while a machine to weave equipped with a shuttle (180 strokes perminute) arrives to produce 9,8m of woven per hour, a machine without shuttle (700 strokesper minute) produces, at the same time, 38,2m of cloth, occupying less physical space andallowing a reduction of manpower of 50%.“ [6]
The other claiming argument from the Textile industry is focused on the loss ofprofitability of the sector, the consecutive bankruptcies, closings of companies and lossesof work positions. Although they refer to the largest companies, those that had better
5 Ipardes(1995),p.88.6 Conjuntura Economica, ag.1995,p.44.
7
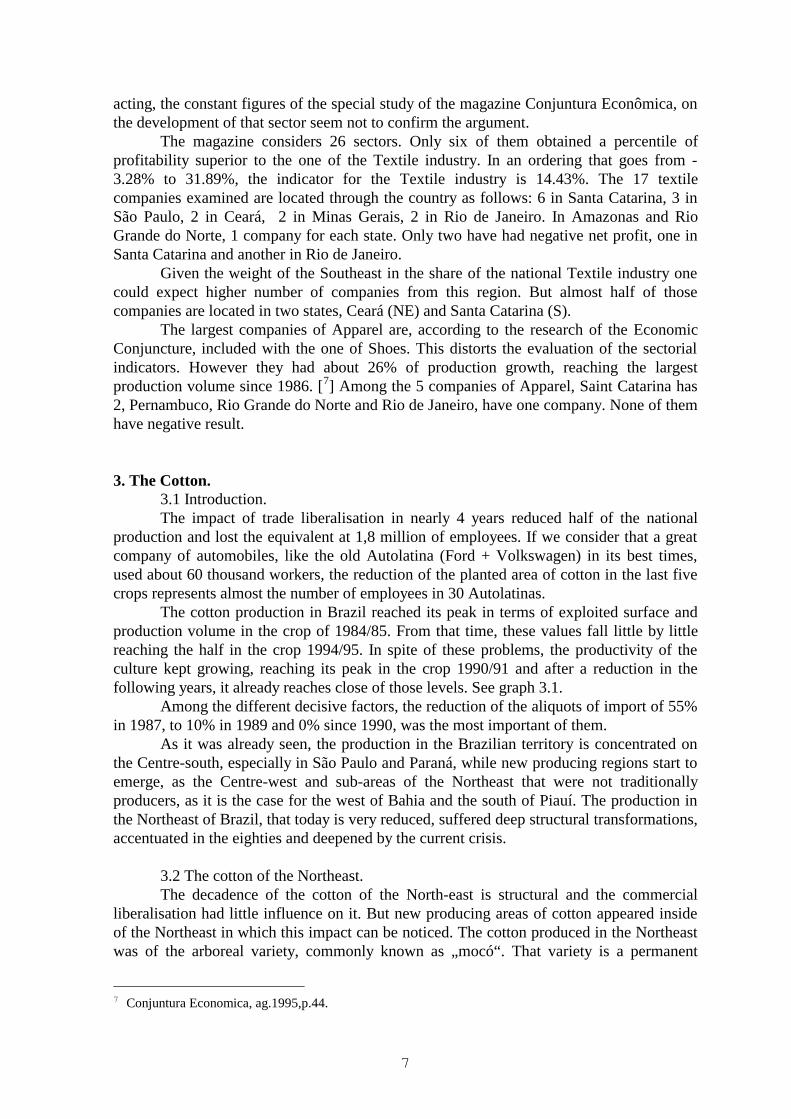
acting, the constant figures of the special study of the magazine Conjuntura Econômica, onthe development of that sector seem not to confirm the argument.
The magazine considers 26 sectors. Only six of them obtained a percentile ofprofitability superior to the one of the Textile industry. In an ordering that goes from -3.28% to 31.89%, the indicator for the Textile industry is 14.43%. The 17 textilecompanies examined are located through the country as follows: 6 in Santa Catarina, 3 inSão Paulo, 2 in Ceará, 2 in Minas Gerais, 2 in Rio de Janeiro. In Amazonas and RioGrande do Norte, 1 company for each state. Only two have had negative net profit, one inSanta Catarina and another in Rio de Janeiro.
Given the weight of the Southeast in the share of the national Textile industry onecould expect higher number of companies from this region. But almost half of thosecompanies are located in two states, Ceará (NE) and Santa Catarina (S).
The largest companies of Apparel are, according to the research of the EconomicConjuncture, included with the one of Shoes. This distorts the evaluation of the sectorialindicators. However they had about 26% of production growth, reaching the largestproduction volume since 1986. [7] Among the 5 companies of Apparel, Saint Catarina has2, Pernambuco, Rio Grande do Norte and Rio de Janeiro, have one company. None of themhave negative result.
3. The Cotton.3.1 Introduction.The impact of trade liberalisation in nearly 4 years reduced half of the national
production and lost the equivalent at 1,8 million of employees. If we consider that a greatcompany of automobiles, like the old Autolatina (Ford + Volkswagen) in its best times,used about 60 thousand workers, the reduction of the planted area of cotton in the last fivecrops represents almost the number of employees in 30 Autolatinas.
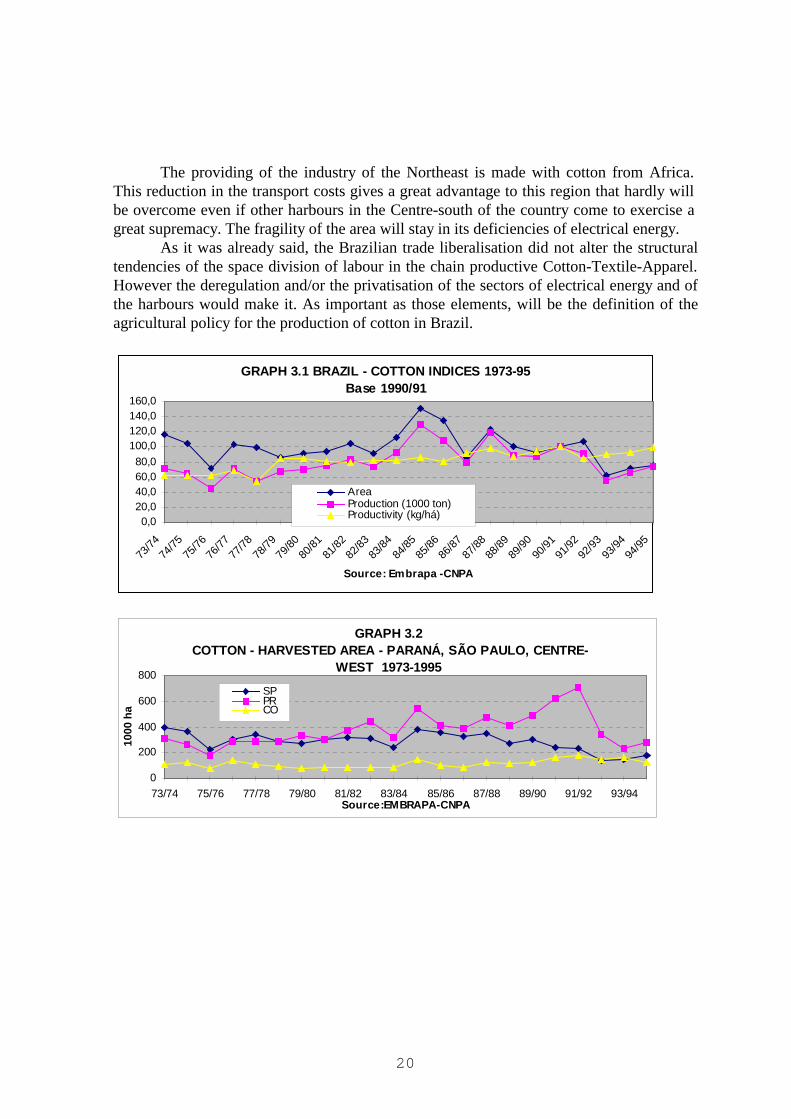
The cotton production in Brazil reached its peak in terms of exploited surface andproduction volume in the crop of 1984/85. From that time, these values fall little by littlereaching the half in the crop 1994/95. In spite of these problems, the productivity of theculture kept growing, reaching its peak in the crop 1990/91 and after a reduction in thefollowing years, it already reaches close of those levels. See graph 3.1.
Among the different decisive factors, the reduction of the aliquots of import of 55%in 1987, to 10% in 1989 and 0% since 1990, was the most important of them.
As it was already seen, the production in the Brazilian territory is concentrated onthe Centre-south, especially in São Paulo and Paraná, while new producing regions start toemerge, as the Centre-west and sub-areas of the Northeast that were not traditionallyproducers, as it is the case for the west of Bahia and the south of Piauí. The production inthe Northeast of Brazil, that today is very reduced, suffered deep structural transformations,accentuated in the eighties and deepened by the current crisis.
3.2 The cotton of the Northeast.The decadence of the cotton of the North-east is structural and the commercial
liberalisation had little influence on it. But new producing areas of cotton appeared insideof the Northeast in which this impact can be noticed. The cotton produced in the Northeastwas of the arboreal variety, commonly known as „mocó“. That variety is a permanent
7 Conjuntura Economica, ag.1995,p.44.

8
culture, with cycle of about 5 years and with very reduced productivity levels. It defined avast well-known area as the area of the consortium cattle-cotton, in its largest part in thesemi-arid region of North-east of Brazil. The farmers planted the cotton with othersubsistence cultures and after the crop the cattle fed with brushwood. That cotton whenbeing benefited, becomes feather, and leaves as by-products the pie (that feeds the cattle)and the oil. A set of factors, among them the economic fragility of the producer and theoutbreak of the plague of the „bicudo“(beaked), was responsible for the decadence andvirtual disappearance of that system in the Northeast [8]. The production that still exists inthe region is the herbaceous variety, whose culture demands a higher technology degreeand larger capitalisation. It is planted in other sub-areas of the Northeast, particularly in thewest of Bahia.
That system, already affected in its structure, cames through three episodes thatmake it seen as a relic: the lingering drought between 1979 and 1983; the plague of the„bicudo“(beaked) in 1983; the commercial liberalisation since 1989/90.
The commercial liberalisation of the nineties is just already a shovel of whitewashon a culture considered anachronic. Its contribution for the end of the culture is almostmarginal. The „mocó“ is over, although one cannot affirm that the production system thatmaintained it is disappeared.
The increase of the cultivated surface and production in the crops of 1993/94 and1994/95 result, mainly, from the production in areas that are not part of the traditionalproducing regions of the Northeast, like Bahia. In those areas the production is moresimilar to the one of the Centre-south. It is a production system different from that of thecattle-cotton
3.3 The cotton of the Centre-south.The analysis of the situation of the Centre-south, specifically the one of the
Southern Zone, for the importance in the Brazilian production can be extended to thenational production of herbaceous cotton and consequently, considering the almostdisappearance of the „mocó“, to the whole Brazilian production.
The largest Brazilian crop was the one of 1984/85, with the production of about2836 tons of cotton in pit, equivalent to 1020 thousand tons of feather. [9] Until 1988 theimport aliquot for the feather was of 55%, in 1989 it was already of 10% and since 1990,0%. The impact of those tariff reductions was already noticed in the crop of 1988/89, but itwas the following crop, 1989/90 that suffered the whole impact of the opening. Since 1989the prices start to fall. The tendency will only reverse itself after 1992, although it has notyet reached its levels of 1989.
The prices of the feather resulted from a growing trajectory since 1986, while theone of the pit, received by the producers, stayed relatively stable. Such prices, althoughthey are influenced by the international prices, react to the volume of existent stocks in thenational market. We can notice, from table 3.1, that in 1984 the stocks were in the lowestlevel registered during the period. It is certainly a reflex of the great depression of thebeginning of the eighties. With the resurgence of the textile industry production there is aretaking of the cotton production that culminated with the great crop of 1984/85 and a greataccumulation of feather stocks. With such a volume of stocks the prices stay stable in 1985and 1986, and the production of the crop 86/87 practically returned at the levels of those ofthe depression. The acceleration of the consumption and the using of the stocks
8 Rolim & Carleial(1990)9 2,77 pit=1 feather
9
accumulated along 1986, launch the prices again in ascending trajectory. With the increaseof stocks, the announcement of the reduction of the import aliquot knocks downs the pricesand also begins the process of downfall of the Brazilian production
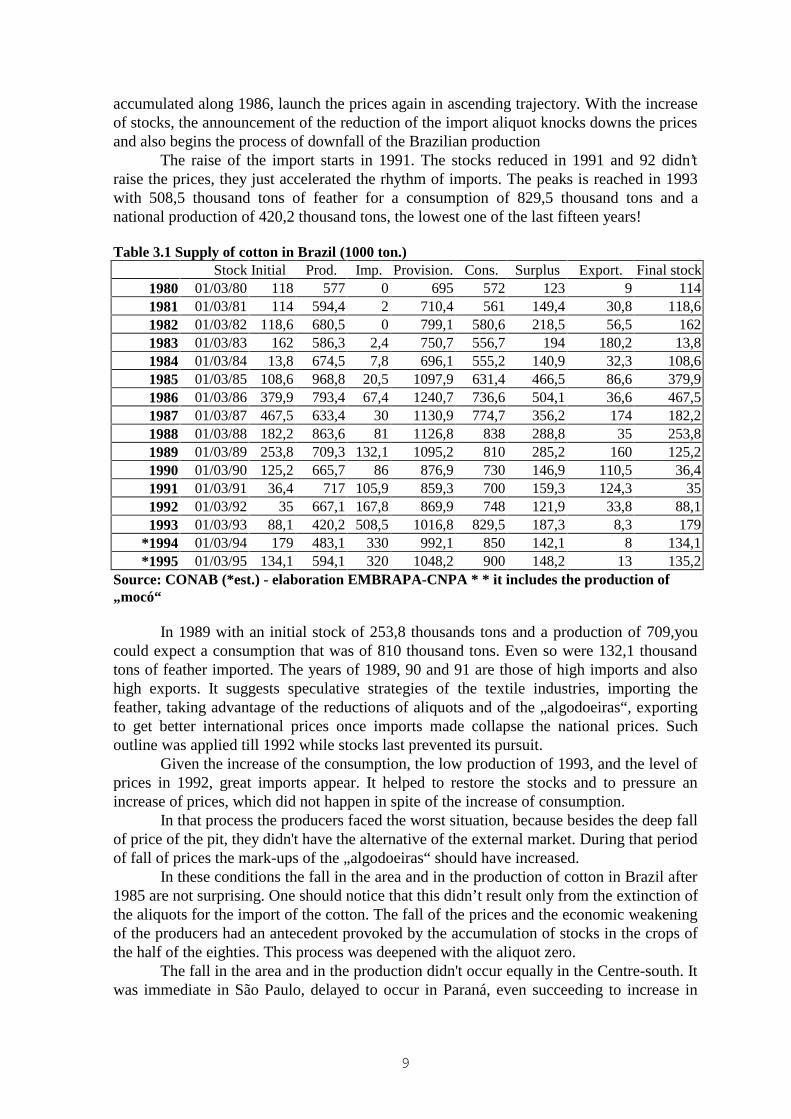
The raise of the import starts in 1991. The stocks reduced in 1991 and 92 didn’traise the prices, they just accelerated the rhythm of imports. The peaks is reached in 1993with 508,5 thousand tons of feather for a consumption of 829,5 thousand tons and anational production of 420,2 thousand tons, the lowest one of the last fifteen years!
Table 3.1 Supply of cotton in Brazil (1000 ton.)Stock Initial Prod. Imp. Provision. Cons. Surplus Export. Final stock
1980 01/03/80 118 577 0 695 572 123 9 1141981 01/03/81 114 594,4 2 710,4 561 149,4 30,8 118,61982 01/03/82 118,6 680,5 0 799,1 580,6 218,5 56,5 1621983 01/03/83 162 586,3 2,4 750,7 556,7 194 180,2 13,81984 01/03/84 13,8 674,5 7,8 696,1 555,2 140,9 32,3 108,61985 01/03/85 108,6 968,8 20,5 1097,9 631,4 466,5 86,6 379,91986 01/03/86 379,9 793,4 67,4 1240,7 736,6 504,1 36,6 467,51987 01/03/87 467,5 633,4 30 1130,9 774,7 356,2 174 182,21988 01/03/88 182,2 863,6 81 1126,8 838 288,8 35 253,81989 01/03/89 253,8 709,3 132,1 1095,2 810 285,2 160 125,21990 01/03/90 125,2 665,7 86 876,9 730 146,9 110,5 36,41991 01/03/91 36,4 717 105,9 859,3 700 159,3 124,3 351992 01/03/92 35 667,1 167,8 869,9 748 121,9 33,8 88,11993 01/03/93 88,1 420,2 508,5 1016,8 829,5 187,3 8,3 179
*1994 01/03/94 179 483,1 330 992,1 850 142,1 8 134,1*1995 01/03/95 134,1 594,1 320 1048,2 900 148,2 13 135,2
Source: CONAB (*est.) - elaboration EMBRAPA-CNPA * * it includes the production of„mocó“
In 1989 with an initial stock of 253,8 thousands tons and a production of 709,youcould expect a consumption that was of 810 thousand tons. Even so were 132,1 thousandtons of feather imported. The years of 1989, 90 and 91 are those of high imports and alsohigh exports. It suggests speculative strategies of the textile industries, importing thefeather, taking advantage of the reductions of aliquots and of the „algodoeiras“, exportingto get better international prices once imports made collapse the national prices. Suchoutline was applied till 1992 while stocks last prevented its pursuit.
Given the increase of the consumption, the low production of 1993, and the level ofprices in 1992, great imports appear. It helped to restore the stocks and to pressure anincrease of prices, which did not happen in spite of the increase of consumption.
In that process the producers faced the worst situation, because besides the deep fallof price of the pit, they didn't have the alternative of the external market. During that periodof fall of prices the mark-ups of the „algodoeiras“ should have increased.
In these conditions the fall in the area and in the production of cotton in Brazil after1985 are not surprising. One should notice that this didn’t result only from the extinction ofthe aliquots for the import of the cotton. The fall of the prices and the economic weakeningof the producers had an antecedent provoked by the accumulation of stocks in the crops ofthe half of the eighties. This process was deepened with the aliquot zero.
The fall in the area and in the production didn't occur equally in the Centre-south. Itwas immediate in São Paulo, delayed to occur in Paraná, even succeeding to increase in
10
that state as well as in the Centre-west. From the crop of 1991/92 the fall was abrupt inParaná although it kept stable in the Centre-west. (See graph 3.2).
The state of Paraná overcomes São Paulo in area planted and production since thecrop of 1978/79. From the super-crop of 1984/85 a tendency of area reduction start to pickin São Paulo substituted by more profitable cultures, accentuated by the commercialopening. On the other hand the cotton in the Centre-west start to enlarge the area from thecrop of 1988/89.
At the beginning of the reduction of the import aliquots and of lowest prices theincrease of the area in Paraná and in the Centre-west may appear as a paradox. It isimportant to undertake a certain delay of the agricultural offer to the movement of prices,but, more important is that with the fall of the profitability of the culture, it starts to migratetowards areas of cheaper lands where it is still possible to obtain some gain. That migrationof the culture proceeds in general lines a logical „thuniana“.
As well as the coffee, the cotton also had its march to the west. In São Paulo, in thethirties, it was in the axis Campinas-Ribeirão Preto and it is going moving to west indirection to Presidente Prudente, and to northwest, Araçatuba and São José do Rio Preto.Now it is at the far west of the state.
That movement also had compensation in Paraná, where the culture, begun in thenortheast of the state, moved to the northwest and west. The performance of the co-operatives was significant for that march and also for the expansion of the area. Howeverthe basic subject stays in the reduced prices of the lands and in the substitution of cultures.[10]
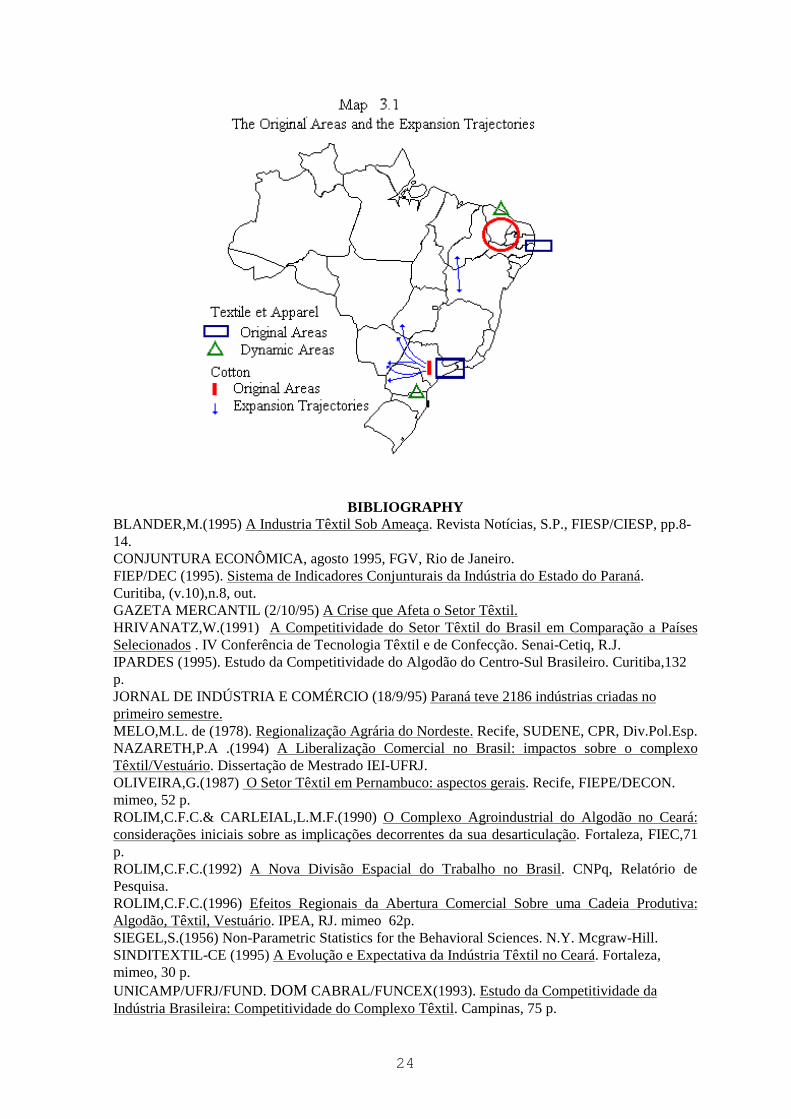
The cotton in the Centre-west is nothing else that the continuity of this march. Itgoes up by the south of Goiás and east of Mato Grosso , in the pursuit of the northwest ofSão Paulo and for the west of the state in direction to Mato Grosso do Sul. See map 3.1.
The expansion in that area has been explained by a privileged topography thatallows the mechanisation of whole the process, even of the crop; for the most regularclimate, that it allows larger homogeneity of the fibre; for the fact of the production tohappen in great areas with high technology and productivity; and also for the expectationsmaids starting from Hidrovia Tietê-Paraná and for Ferronorte. [11] The productivity in thisarea has been overcoming the one of Paraná in the last crops.
Another aspect of the crisis of the Brazilian culture of cotton is the reduction of thevolume of direct employment in the agriculture. The estimates below consider the labourcoefficients for area and a certain number of worked days, that in the case of the Northeastis of 170 days a year, considering the installation of the culture, its maintenance and crop.The total values for the Northeast are the sum of the values for the area of the mocó and ofthe herbaceous. The values for the Centre-south follow also similar methodology ofcalculation, although the coefficients are slightly different.
On the basis of those estimates the calculation of the current losses caused by tradeliberalisation was made considering as basis the volume of employment of 1988, fromwhere the values esteemed for every year were subtracted. The results are presented in table3.2.
If the price for the modernisation of the complex Cotton/Textile/Apparel went thatway, it would be very high and badly distributed sectorially and regionally.
A synthesis of this section would say that:
10 Ipardes(1995) pp. 46-6111 Ipardes(1995) pp. 37-38
11
- the trade liberalisation deepened a crisis already existent in the cotton productionin Brazil, leading to the reduction of the half country production, stopping it to be self-sufficient.
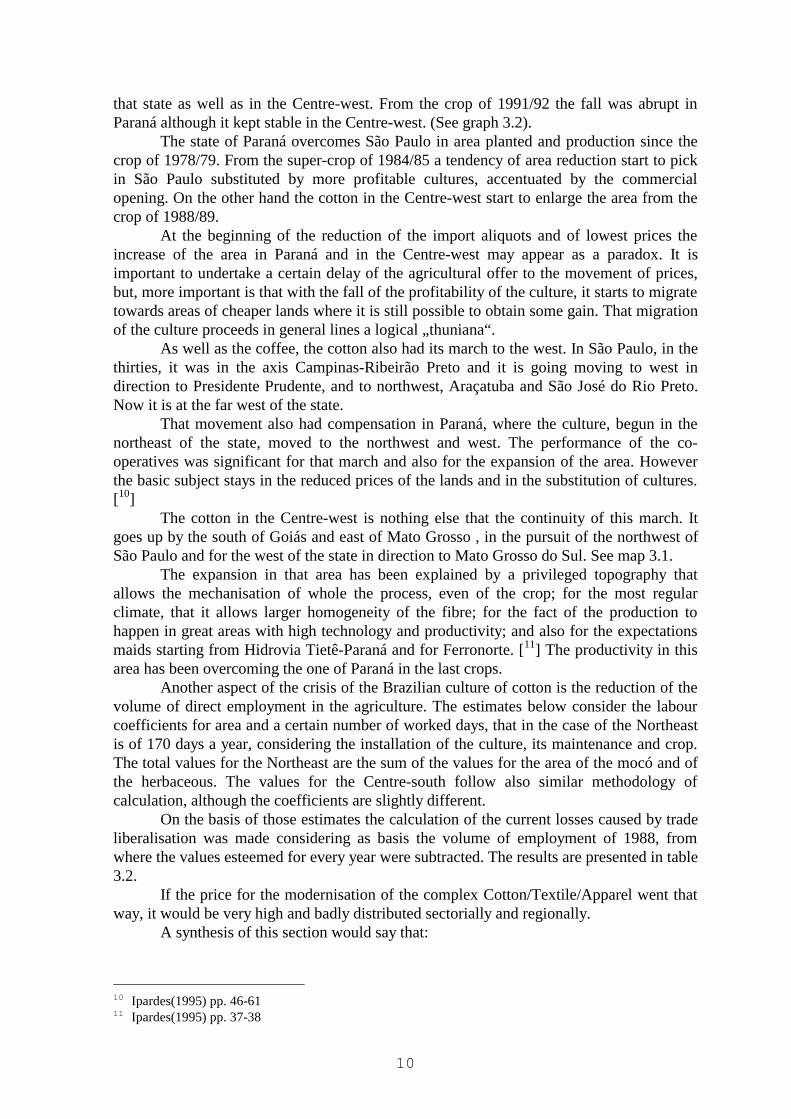
Table 3.2 Estimates of lost employment in the culture of cotton due to the trade liberalisation- 1989-1994 (*)
BRAZIL PARANÁ S. PAULO NORTHEASTMocó Herbaceous TOTAL
1989 143.300 18.000 31.300 19.113 55.125 74.2381990 216.700 -7.000 29.000 42.193 142.874 185.0671991 241.100 -49.000 34.100 64.028 140.863 204.8911992 242.200 -78.000 45.400 74.248 131.475 205.7241993 497.300 41.000 75.000 98.345 200.341 298.6851994 460.600 76.000 73.500 102.006 114.300 216.306SUM 1.801.200 1.000 288.300 399.933 784.978 1.184.911
Source: ROLIM, 1996. (*) The estimates for Brazil, São Paulo and Paraná were madewith coefficients different from those used for NE. (Differential close to7%)
- this crisis had differentiated effect in the different areas of the country. - it contributed to the apparition of new regions of herbaceous cotton in the
Northeast. It didn’t affect the crisis in the production of cotton „mocó“.- it accelerated a process of shifting of the culture toward to new areas, Centre-west,
West of Paraná, West of São Paulo and even to Rondonia, to the detriment of thetraditional areas inside of the own state of São Paulo and of Paraná.
- the adjustment was achieved on the agricultural producers, by the „algodoeiras“ asby the Textile industry. The remaining producers got to show won of productivity throughthe reduction of production costs.
- the losses of employment due to the reduction of the exploited area are equal to 30great factories of automobiles.
4. The INDUSTRIAL SEGMENT.4.1 INTRODUCTION.The basic procedure in the analysis of these data was the comparison of the degree
of likeness among the series of indexes of physical production and of sales. To Brazil as awhole the comparison was made with the total of the manufacturing industry. For the stateswe tried to detect those with similar trajectories. That was made through the observation ofthe group of generated graphs and, in a more rigorous way, through the use of coefficientsof no-parametric statistics. The coefficient of concordance of Kendall, that shows theordinal correlation between two or more series. It varies from 0 to 1, It shows that thehigher it is, the bigger the correlation among them is. It doesn't care about the absolutelevels, but if there is likeness among the trajectories of the series. The second coefficient,ordinal correlation of Spearman, is used to measure the correlation between pairs of series.It also varies between 0 and 1. The difference among them is that the first can measure agroup of series and the second only a pair. (SIEGEL, 1956)
Considering Brazil as a whole, the trajectory of the indexes of industrial physicalproduction for the Manufacturing industry, Textile and Apparel, in the period between1975 and 1990, with annual data, and the period 1991-1995, where took place the effects ofthe commercial liberalisation, with monthly data, some facts pointed out which can besummarised as follows:

12
- The first observation is that the correlation of the trajectories of the two sectorswith the Manufacturing industry decreases, K = .68, basically due to the trajectory of theTextile industry, K = .71, once the Apparel industry and the one manufacturing maintainedthe same coefficients, K = .75. See table 4.1.
- The Textile industry since 1975 to the middle of the nineties had a trajectory muchmore similar to the one of the Manufacturing industry as a whole than with the Apparelindustry.
- The industry of Apparel was in crisis during the whole second half of the eighties,with a slight recovery in 1992 and 93, to enter in decadence again.
- Since the second half of 1994, coinciding with the settlement of the Real [12], thetwo sectors, particularly Textile, enter a period of increase of production, more intense thanthe one of the previous yearly cycles. The fall of the production levels in the first semesterof 1995 is cyclic; the difference is in the fact that it was deeper than it used to be inprevious years. The increase of the second semester of 94 was also more intense.
Table 4.1 Brazil-Manufacturing, Textile, Apparel industries Coefficient of Concordance ofKendall 1975-1990(yearly) 1991-1995(monthly)
1975-1990 1991-1995All industries; Textile;Appar.
K = .78 (=35.06 K = .68 (=113.55
Textile, Apparel K = .82 (=24.66 K = .84 (=92.42All industries; Textile K = .93 (=27.79 K = .71 (=78.05All industries; Apparel K = .75 (=22.63 K = .75 (=75.03
4.2 The Regional TrajectoryThe studied states were Ceará, Pernambuco, Minas Gerais, Rio de Janeiro, São
Paulo, Paraná and Santa Catarina. Initially the performance of the industrial physicalproduction was analysed in those states, with data from the IBGE. Soon after, with datafrom the Federations of Industries of each state, collected with a common methodologydeveloped by the National Confederation of the Industry, the system CNI, the indexes ofthe volume of sales and employees were analysed. Finally, with data from the StateSecretariats of Finance, the origins of the purchases and the destiny of the sales of theconsidered sectors.
The industrial segment of the productive chain is composed by the Textile andApparel [13] sector. Although the segment Shoes doesn't make part of the given productivechain, the level of aggregation of the IBGE and of the other sources of information, makeimpossible to exclude it. However its participation in the sector is relatively reduced andconcentrated in the states of São Paulo and Rio Grande do Sul (not considered in thesample).
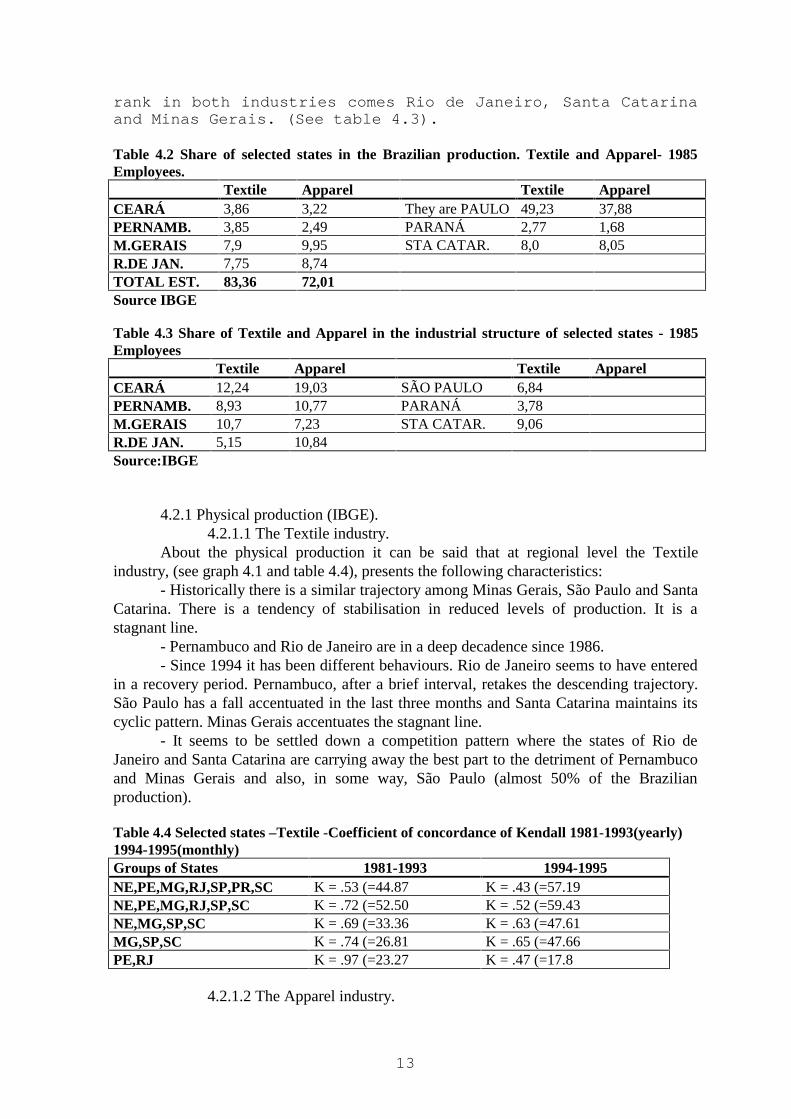
The selected states represent, respectively, about 83%and 72% of the employees, of the Textile and Apparelindustries. (See table 4.2). Ceará, Minas Gerais and SantaCatarina are the states where the Textile sector presentslarger participation in the structure of the local industry.Apparel has the main share in the states of Ceará, SantaCatarina, Rio de Janeiro and Pernambuco. Disputing the second
12 The new Brazilian currency wich cames from a stabilization plan.13 The Brazilian statistics includes the shoes manufactures in this sector.
13
rank in both industries comes Rio de Janeiro, Santa Catarinaand Minas Gerais. (See table 4.3).
Table 4.2 Share of selected states in the Brazilian production. Textile and Apparel- 1985Employees.
Textile Apparel Textile ApparelCEARÁ 3,86 3,22 They are PAULO 49,23 37,88PERNAMB. 3,85 2,49 PARANÁ 2,77 1,68M.GERAIS 7,9 9,95 STA CATAR. 8,0 8,05R.DE JAN. 7,75 8,74TOTAL EST. 83,36 72,01Source IBGE
Table 4.3 Share of Textile and Apparel in the industrial structure of selected states - 1985Employees
Textile Apparel Textile ApparelCEARÁ 12,24 19,03 SÃO PAULO 6,84PERNAMB. 8,93 10,77 PARANÁ 3,78M.GERAIS 10,7 7,23 STA CATAR. 9,06R.DE JAN. 5,15 10,84Source:IBGE
4.2.1 Physical production (IBGE).4.2.1.1 The Textile industry.
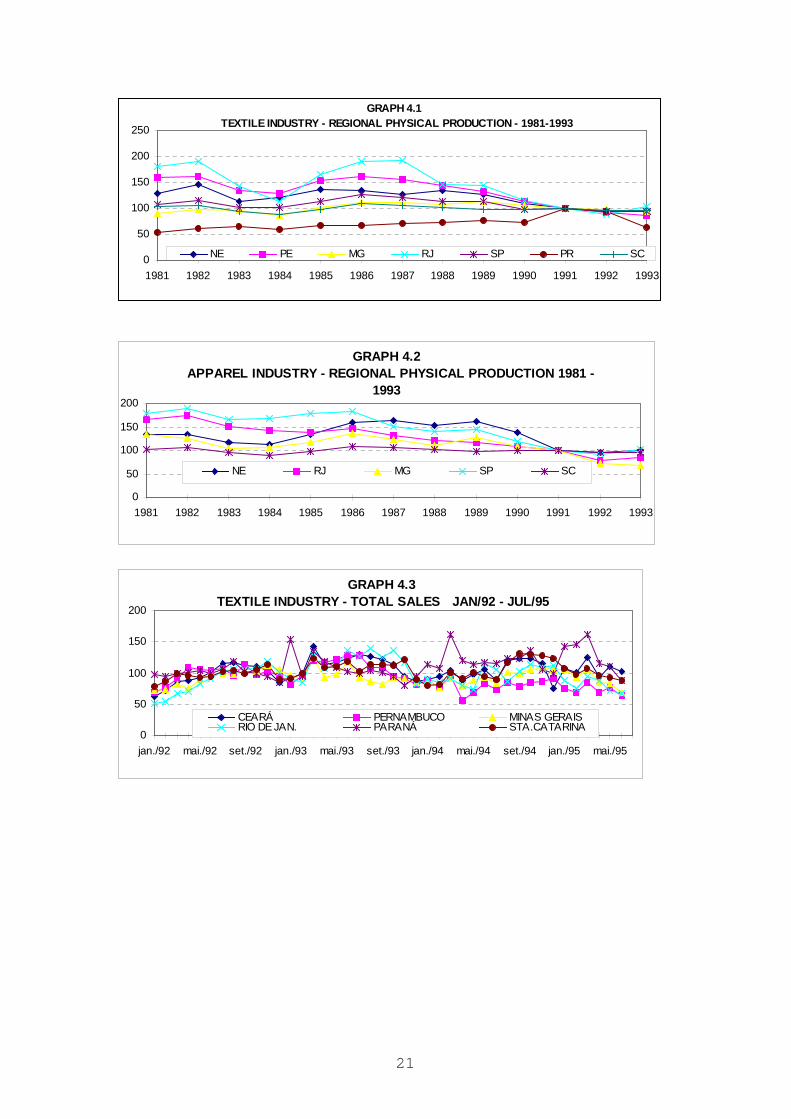
About the physical production it can be said that at regional level the Textileindustry, (see graph 4.1 and table 4.4), presents the following characteristics:
- Historically there is a similar trajectory among Minas Gerais, São Paulo and SantaCatarina. There is a tendency of stabilisation in reduced levels of production. It is astagnant line.
- Pernambuco and Rio de Janeiro are in a deep decadence since 1986.- Since 1994 it has been different behaviours. Rio de Janeiro seems to have entered
in a recovery period. Pernambuco, after a brief interval, retakes the descending trajectory.São Paulo has a fall accentuated in the last three months and Santa Catarina maintains itscyclic pattern. Minas Gerais accentuates the stagnant line.
- It seems to be settled down a competition pattern where the states of Rio deJaneiro and Santa Catarina are carrying away the best part to the detriment of Pernambucoand Minas Gerais and also, in some way, São Paulo (almost 50% of the Brazilianproduction).
Table 4.4 Selected states –Textile -Coefficient of concordance of Kendall 1981-1993(yearly)1994-1995(monthly)Groups of States 1981-1993 1994-1995NE,PE,MG,RJ,SP,PR,SC K = .53 (=44.87 K = .43 (=57.19NE,PE,MG,RJ,SP,SC K = .72 (=52.50 K = .52 (=59.43NE,MG,SP,SC K = .69 (=33.36 K = .63 (=47.61MG,SP,SC K = .74 (=26.81 K = .65 (=47.66PE,RJ K = .97 (=23.27 K = .47 (=17.8
4.2.1.2 The Apparel industry.

14
Despite its heterogeneity this industry tends to present larger concordance oftrajectories among the studied states. The graph 4.2 and the table 4.5 illustrate thatassertion.
The synthesis on this sector is as follows:- The three larger producers, Minas Gerais, Rio and São Paulo, responsible for
about 58% of the employees of the industry in 1985, present a declining tendency since1986, Rio de Janeiro just sketches a reaction in the most recent periods.
- Apparently a more important dynamism is appearing in other producing regionssuch as the Northeast, Santa Catarina and Paraná.
- Regions in difficult situation were already structurally in recession before the tradeliberalisation.
Table 4.5 Selected states-Apparel -Coefficient of concordance of Kendall 1981-1993(yearly)1994-1995(monthly)Groups of States 1981-1993 1994-1995NE,PE,MG,RJ,SP,PR,SC K = .56 (=74.29NE,PE,MG,RJ,SP,SC K = .71 (=81.10NE,MG,RJ,SP,SC K = .71 (=42.83 K = .68 (=65.07NE,MG,SC K = .75 (=27.07 K = .70 (=40.11MG,RJ,SP K = .85 (=30.68 K = .71 (=40.79RJ,SP K = .97 (=23.27 K = .88 (=33.37RJ,SP,SC K = .79 (=44.90NE,SC K = .74 (=17.67 K = .87 (=33.06
4.2.2 Sales and Employees (CNI)Another source of information was the indexes of industrial activity produced by
the Federations of Industries under the co-ordination of the National Confederation ofIndustries (CNI). The Federations of the states always collected information of the levels ofsales and employment from its members. However the methodologies didn’t alwayscoincided or didn’t have continuity in the work. Recently CNI began to set up a nationalsystem of monthly economic statistics where each Federation collects and manages groupsof indexes of sales, employment, utilised capacity, etc, with a homogeneous methodology.That system has its basis on January 1992. The sample considered in each state representsat least 50% of the sector, classified according to the IBGE.
The system, although it is already operating, is still in a phase of improvement andit moves toward an effective methodological unification. In some states it is moreconsolidated than in others. Although the indexes are only indicators and not absolutevalues, one can evaluate the trajectory of activities in the different states.
It was not possible to obtain all the information for all the states. Thus, we onlyworked on the index of Total Sales and Employment.
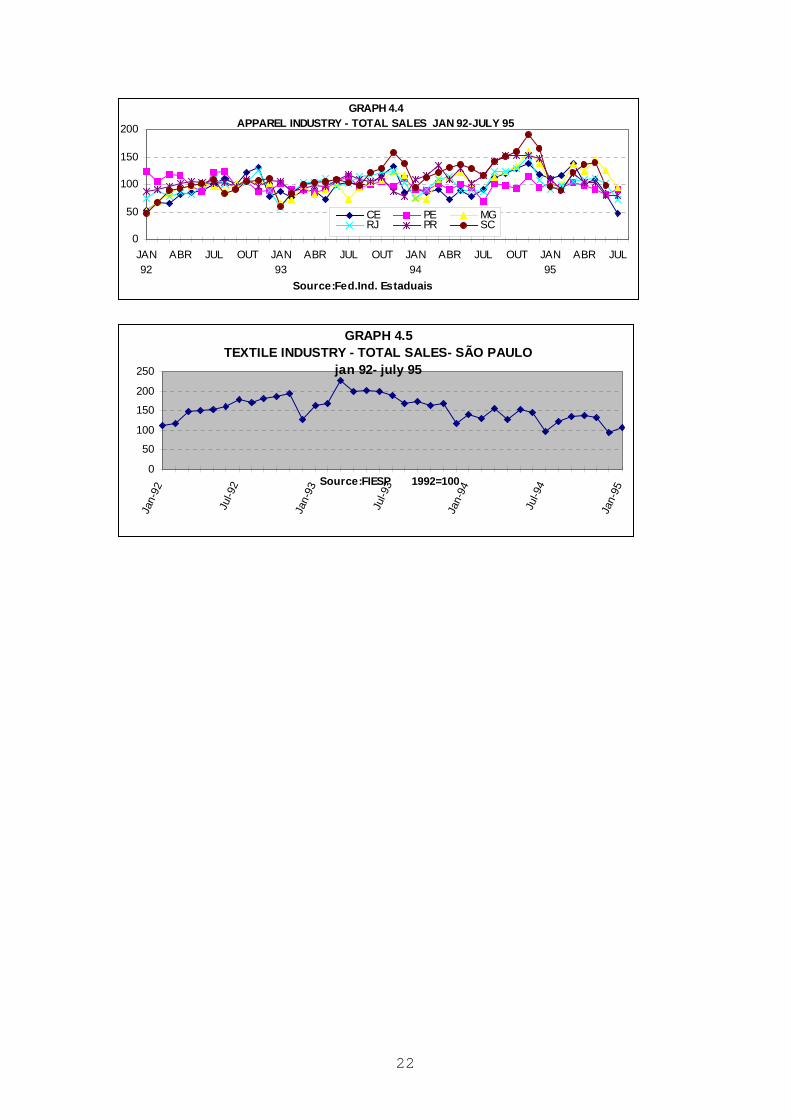
4.2.2.1 The Textile Industry.The main results can be synthesised as it follows. (See table 4.6 and 4.7, graphs 4.3
and 4.5).- For the Textile industry the recurrent pattern of the sales is the one of an inverted
U, whose top is the middle of the year. The difference in 1995 is that up to where the dataallow to evaluate, the expansion phase did not still occur.
- The states with larger trajectory concordance are Ceará, Minas Gerais, Rio deJaneiro and Santa Catarina.
15
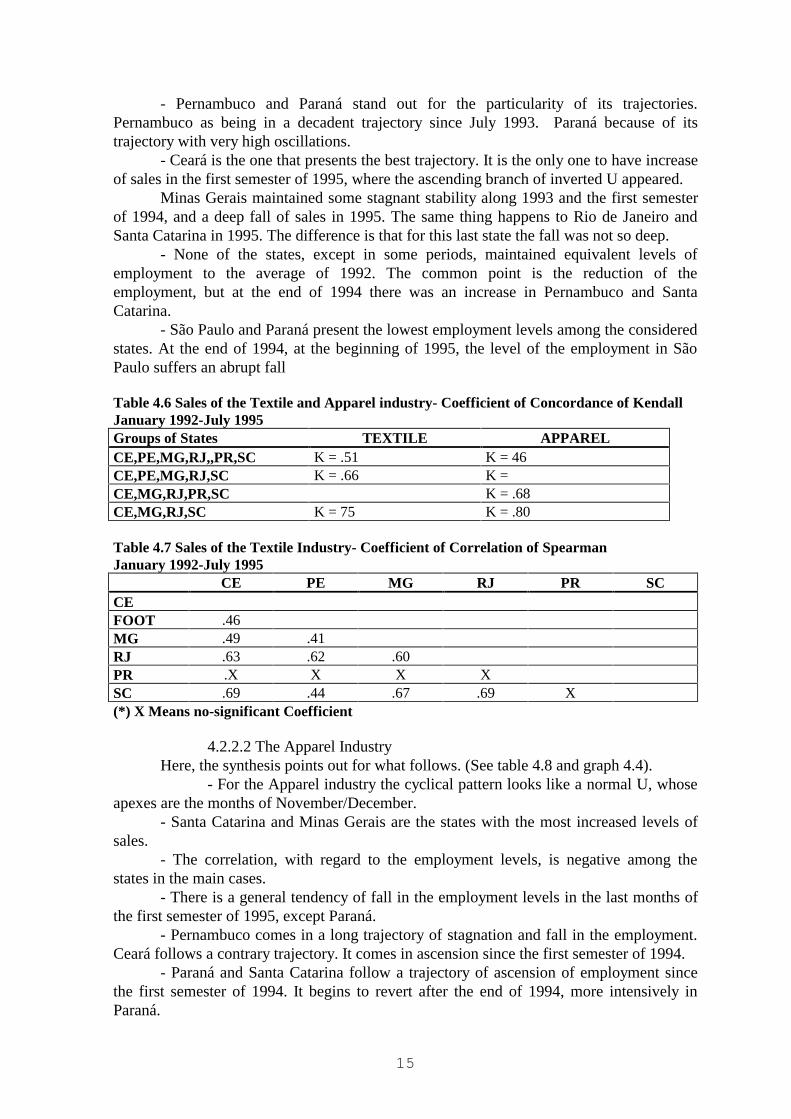
- Pernambuco and Paraná stand out for the particularity of its trajectories.Pernambuco as being in a decadent trajectory since July 1993. Paraná because of itstrajectory with very high oscillations.
- Ceará is the one that presents the best trajectory. It is the only one to have increaseof sales in the first semester of 1995, where the ascending branch of inverted U appeared.
Minas Gerais maintained some stagnant stability along 1993 and the first semesterof 1994, and a deep fall of sales in 1995. The same thing happens to Rio de Janeiro andSanta Catarina in 1995. The difference is that for this last state the fall was not so deep.
- None of the states, except in some periods, maintained equivalent levels ofemployment to the average of 1992. The common point is the reduction of theemployment, but at the end of 1994 there was an increase in Pernambuco and SantaCatarina.
- São Paulo and Paraná present the lowest employment levels among the consideredstates. At the end of 1994, at the beginning of 1995, the level of the employment in SãoPaulo suffers an abrupt fall
Table 4.6 Sales of the Textile and Apparel industry- Coefficient of Concordance of KendallJanuary 1992-July 1995Groups of States TEXTILE APPARELCE,PE,MG,RJ,,PR,SC K = .51 K = 46CE,PE,MG,RJ,SC K = .66 K =CE,MG,RJ,PR,SC K = .68CE,MG,RJ,SC K = 75 K = .80
Table 4.7 Sales of the Textile Industry- Coefficient of Correlation of SpearmanJanuary 1992-July 1995
CE PE MG RJ PR SCCEFOOT .46MG .49 .41RJ .63 .62 .60PR .X X X XSC .69 .44 .67 .69 X(*) X Means no-significant Coefficient
4.2.2.2 The Apparel IndustryHere, the synthesis points out for what follows. (See table 4.8 and graph 4.4).
- For the Apparel industry the cyclical pattern looks like a normal U, whoseapexes are the months of November/December.
- Santa Catarina and Minas Gerais are the states with the most increased levels ofsales.
- The correlation, with regard to the employment levels, is negative among thestates in the main cases.
- There is a general tendency of fall in the employment levels in the last months ofthe first semester of 1995, except Paraná.
- Pernambuco comes in a long trajectory of stagnation and fall in the employment.Ceará follows a contrary trajectory. It comes in ascension since the first semester of 1994.
- Paraná and Santa Catarina follow a trajectory of ascension of employment sincethe first semester of 1994. It begins to revert after the end of 1994, more intensively inParaná.

16
Table 4.8 Sales of the Apparel industry –Coefficient Correlation of SpearmanJanuary 1992-July 1995
CE PE MG RJ PR SCCEPE XMG .56 XRJ .64 X .67PR .45 X .33 .26SC .48 X .80 .70 .51
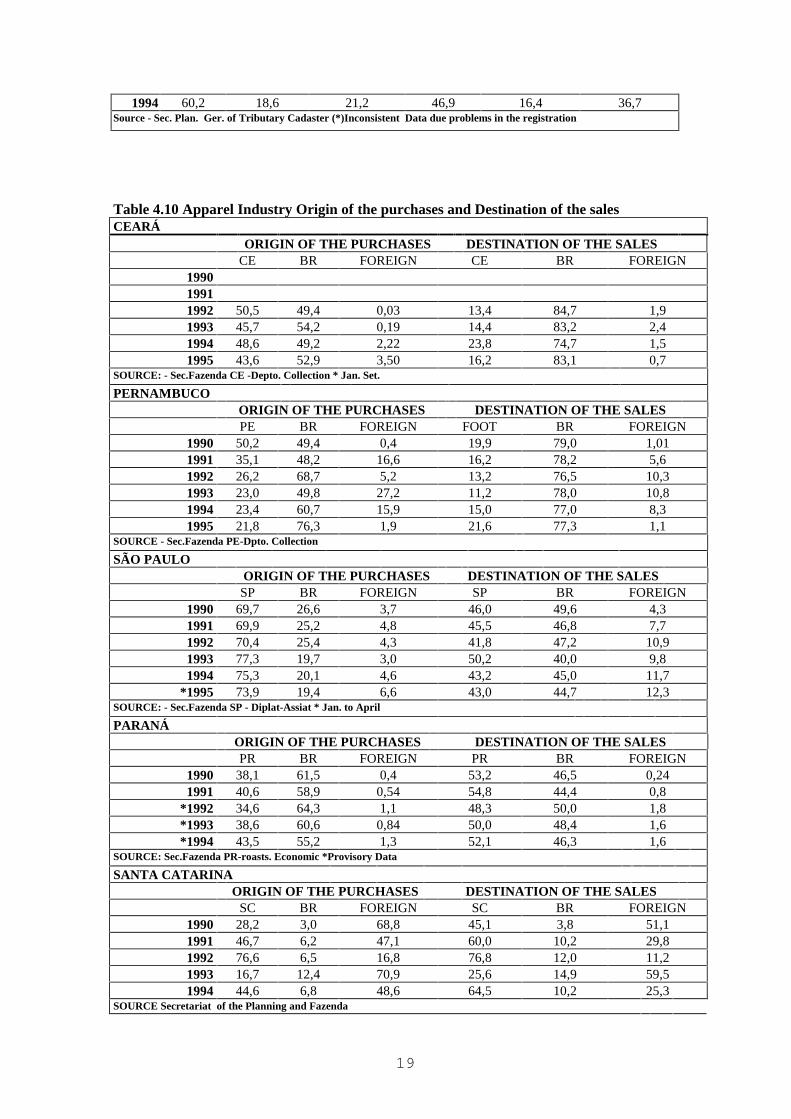
4.2.3 Origin of the Purchases and Destiny of the Sales (Secretariats ofFinances)
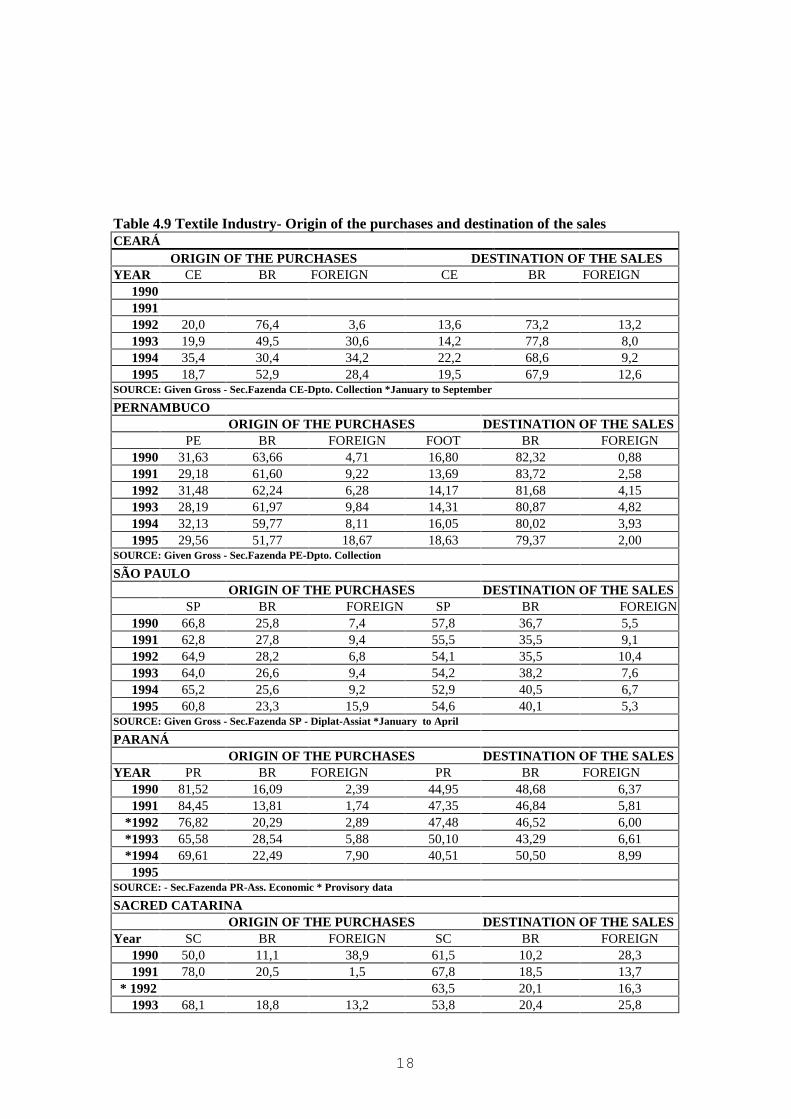
The analysis that follows has been made on the basis of data from the Secretariatsof Finance of some states. [] The origin of the purchases of the Textile and Apparelindustries shows at first the integration degree of the states. The changes in the percentilesof external purchases are an indicator of the impact of trade liberalisation. That measure isnot perfect because nothing prevents that a product imported by a wholesaler of São Paulois resold for the industry of Ceará. That operation would be counted in Ceará as a purchasefrom another state and not as a purchase from the exterior. If that wholesaler was in Cearáand did the same operation, it would be counted as an internal purchase. In spite of thoseproblems these information can work as indicator of the impact of the trade liberalisation.(See tables 4.9 and 4.10).
In synthesis:- There is an increase of the purchases done in the exterior, reflex of the trade
liberalisation, so much for the Textile industry that for the Apparel industry, in allconsidered states. The percentiles are particularly high at the end of the period and in thestates of the Northeast.
- On the other hand there is also an increase of the percentile of the sales to theexterior, indicating that the liberalisation is not a unique direction process. That increasefor the Apparel industry, in some cases, is proportionally bigger for exports than forimports. In the state of São Paulo, it is particularly expressive.
- The high proportion of sales inside Santa Catarina reveals the intense processes ofindustrial reorganisation in course in that state.
- Santa Catarina and the Northeast, are the regions that appeared with betterperformance in Apparel industry. They are the ones that buy more products from outside.5. Last Considerations.
While a general conclusion, we can say that up to now the trade liberalisation didnot change any structural tendency in the space division of labour of the sector, it justdeepened the existent ones. A second general conclusion is that the bill of the adjustmentwas paid, in its largest part, by the agricultural producers and perhaps by the small andmedium industrial of the Apparel industry.
The cotton production was severely affected by the liberalisation of the imports. Itwas not due to any pressure of costs, on the contrary it was in a context of stable prices butwith great stocks that forced the prices down. This fall plus the increase of the mark-up ofthe „algodoeiras“, reduced more the prices received by the producers. The consequencewas the reduction for half of the cultivated area in the country. The culture still maintainsitself, largely because the migration to areas with cheaper lands than those where
17
traditionally the cultivation occurred. The march of the cotton continued in direction to thewest of São Paulo and of Paraná, reaching the Centre-west and occupying new areas in theNortheast, the west of Bahia and the South of Piauí. In the traditional regions of productionin the Northeast, the areas of the „mocó“, the culture practically disappeared.
The Textile and Apparel industries were historically the most protected Brazilianindustries. After the process of commercial liberalisation, started under the governmentSarney, they still went on being the most protected. That long protection led theseindustries to produce with very surpassed technology. At the beginning of the process, thetax for importation of raw materials and machines was immediately reduced. They coulddo investments for modernisation. Many of those investments implied in voluminouslabour reductions. Nowadays the numbers of that contingent of unemployed are used toillustrate the harmful effects of the competition!!
In those areas where there were already structural problems in these industries, thesituation seems to get worse. It is the case, for example, of Pernambuco, Minas Gerais andeven São Paulo. The good surprise seems to be Rio de Janeiro, which gives signs of havingleft a long decadence period. On the other hand new areas had consolidate, as it is the caseof Ceará and Santa Catarina, and another blunt as promise, as it is the case of Paraná. Inthose areas the differentiation is in the integrated organisation of the chain productiveand/or in the modernisation of equipment and also in the strong participation of theexternal section. See map 3.1.
The results of other works of the project, referring to the deregulation and/orprivatisation of the sector of electric energy and of the port sector, point out that theincrease of tariffs of electric energy in Brazil is a strong probability and the dispute thatwill aim the Brazilian port at better conditions of competitiveness is still indefinite.
The definition of those elements will have important impacts on the currenttendencies of the space division of labour in the country, particularly in what it refers tothe chain Cotton-Textile-Apparel. The two emergent regions, in the South and in theNortheast of Brazil, present characteristic particularly sensitive to them.
The industry of the South is provisioned with cottonfrom Paraná, Mato Grosso do Sul, Paraguay and Argentina.(ROLIM, 1996) This gives this region some advantage inrelation to the most traditional areas like Rio de Janeiro,Minas and São Paulo. Although it is not the reason of itslargest competitiveness. It resides inside the largestintegration of the productive chain. However if the tariffsof electrical energy suffer increases differentiated alongthe national territory that picture will be more and moreuncertain. Let us suppose that the prices of energy are lowerproportionally to the traditional areas. They could reversethe tendency that, currently, is unfavourable to them.However, if the electrical energy is more expensive in thoseareas, it could mean the stroke of grace to its textileindustries. In the same way the advantages in theprovisioning of raw material, the cotton in feather, will bedefined by the format that will be brought to adopt thecurrent structure of transport. If a harbour between Rio deJaneiro and São Paulo succeeded in supplying those twocentres with advantage in relation to Santa Catarina'sprovisioning, basically done by surface roads, the balancewould lean all over for these regions again.
18
Table 4.9 Textile Industry- Origin of the purchases and destination of the salesCEARÁ ORIGIN OF THE PURCHASES DESTINATION OF THE SALESYEAR CE BR FOREIGN CE BR FOREIGN
199019911992 20,0 76,4 3,6 13,6 73,2 13,21993 19,9 49,5 30,6 14,2 77,8 8,01994 35,4 30,4 34,2 22,2 68,6 9,21995 18,7 52,9 28,4 19,5 67,9 12,6
SOURCE: Given Gross - Sec.Fazenda CE-Dpto. Collection *January to September
PERNAMBUCOORIGIN OF THE PURCHASES DESTINATION OF THE SALES
PE BR FOREIGN FOOT BR FOREIGN1990 31,63 63,66 4,71 16,80 82,32 0,881991 29,18 61,60 9,22 13,69 83,72 2,581992 31,48 62,24 6,28 14,17 81,68 4,151993 28,19 61,97 9,84 14,31 80,87 4,821994 32,13 59,77 8,11 16,05 80,02 3,931995 29,56 51,77 18,67 18,63 79,37 2,00
SOURCE: Given Gross - Sec.Fazenda PE-Dpto. Collection
SÃO PAULOORIGIN OF THE PURCHASES DESTINATION OF THE SALES
SP BR FOREIGN SP BR FOREIGN1990 66,8 25,8 7,4 57,8 36,7 5,51991 62,8 27,8 9,4 55,5 35,5 9,11992 64,9 28,2 6,8 54,1 35,5 10,41993 64,0 26,6 9,4 54,2 38,2 7,61994 65,2 25,6 9,2 52,9 40,5 6,71995 60,8 23,3 15,9 54,6 40,1 5,3
SOURCE: Given Gross - Sec.Fazenda SP - Diplat-Assiat *January to April
PARANÁORIGIN OF THE PURCHASES DESTINATION OF THE SALES
YEAR PR BR FOREIGN PR BR FOREIGN1990 81,52 16,09 2,39 44,95 48,68 6,371991 84,45 13,81 1,74 47,35 46,84 5,81
*1992 76,82 20,29 2,89 47,48 46,52 6,00*1993 65,58 28,54 5,88 50,10 43,29 6,61*1994 69,61 22,49 7,90 40,51 50,50 8,991995
SOURCE: - Sec.Fazenda PR-Ass. Economic * Provisory data
SACRED CATARINAORIGIN OF THE PURCHASES DESTINATION OF THE SALES
Year SC BR FOREIGN SC BR FOREIGN1990 50,0 11,1 38,9 61,5 10,2 28,31991 78,0 20,5 1,5 67,8 18,5 13,7
* 1992 63,5 20,1 16,31993 68,1 18,8 13,2 53,8 20,4 25,8
19
1994 60,2 18,6 21,2 46,9 16,4 36,7Source - Sec. Plan. Ger. of Tributary Cadaster (*)Inconsistent Data due problems in the registration
Table 4.10 Apparel Industry Origin of the purchases and Destination of the salesCEARÁ
ORIGIN OF THE PURCHASES DESTINATION OF THE SALESCE BR FOREIGN CE BR FOREIGN
199019911992 50,5 49,4 0,03 13,4 84,7 1,91993 45,7 54,2 0,19 14,4 83,2 2,41994 48,6 49,2 2,22 23,8 74,7 1,51995 43,6 52,9 3,50 16,2 83,1 0,7
SOURCE: - Sec.Fazenda CE -Depto. Collection * Jan. Set.
PERNAMBUCOORIGIN OF THE PURCHASES DESTINATION OF THE SALESPE BR FOREIGN FOOT BR FOREIGN
1990 50,2 49,4 0,4 19,9 79,0 1,011991 35,1 48,2 16,6 16,2 78,2 5,61992 26,2 68,7 5,2 13,2 76,5 10,31993 23,0 49,8 27,2 11,2 78,0 10,81994 23,4 60,7 15,9 15,0 77,0 8,31995 21,8 76,3 1,9 21,6 77,3 1,1
SOURCE - Sec.Fazenda PE-Dpto. Collection
SÃO PAULOORIGIN OF THE PURCHASES DESTINATION OF THE SALESSP BR FOREIGN SP BR FOREIGN
1990 69,7 26,6 3,7 46,0 49,6 4,31991 69,9 25,2 4,8 45,5 46,8 7,71992 70,4 25,4 4,3 41,8 47,2 10,91993 77,3 19,7 3,0 50,2 40,0 9,81994 75,3 20,1 4,6 43,2 45,0 11,7
*1995 73,9 19,4 6,6 43,0 44,7 12,3SOURCE: - Sec.Fazenda SP - Diplat-Assiat * Jan. to April
PARANÁORIGIN OF THE PURCHASES DESTINATION OF THE SALESPR BR FOREIGN PR BR FOREIGN
1990 38,1 61,5 0,4 53,2 46,5 0,241991 40,6 58,9 0,54 54,8 44,4 0,8
*1992 34,6 64,3 1,1 48,3 50,0 1,8*1993 38,6 60,6 0,84 50,0 48,4 1,6*1994 43,5 55,2 1,3 52,1 46,3 1,6
SOURCE: Sec.Fazenda PR-roasts. Economic *Provisory Data
SANTA CATARINAORIGIN OF THE PURCHASES DESTINATION OF THE SALES
SC BR FOREIGN SC BR FOREIGN1990 28,2 3,0 68,8 45,1 3,8 51,11991 46,7 6,2 47,1 60,0 10,2 29,81992 76,6 6,5 16,8 76,8 12,0 11,21993 16,7 12,4 70,9 25,6 14,9 59,51994 44,6 6,8 48,6 64,5 10,2 25,3
SOURCE Secretariat of the Planning and Fazenda
20
The providing of the industry of the Northeast is made with cotton from Africa.This reduction in the transport costs gives a great advantage to this region that hardly willbe overcome even if other harbours in the Centre-south of the country come to exercise agreat supremacy. The fragility of the area will stay in its deficiencies of electrical energy.
As it was already said, the Brazilian trade liberalisation did not alter the structuraltendencies of the space division of labour in the chain productive Cotton-Textile-Apparel.However the deregulation and/or the privatisation of the sectors of electrical energy and ofthe harbours would make it. As important as those elements, will be the definition of theagricultural policy for the production of cotton in Brazil.
GRAPH 3.1 BRAZIL - COTTON INDICES 1973-95Base 1990/91
0,020,040,060,080,0
100,0120,0140,0160,0
73/7
474
/75
75/7
676
/77
77/7
878
/79
79/8
080
/81
81/8
282
/83
83/8
484
/85
85/8
686
/87
87/8
888
/89
89/9
090
/91
91/9
292
/93
93/9
494
/95
Source: Embrapa -CNPA
AreaProduction (1000 ton)Productivity (kg/há)
GRAPH 3.2 COTTON - HARVESTED AREA - PARANÁ, SÃO PAULO, CENTRE-
WEST 1973-1995
0
200
400
600
800
73/74 75/76 77/78 79/80 81/82 83/84 85/86 87/88 89/90 91/92 93/94Source:EMBRAPA-CNPA
1000
ha
SPPRCO
21
GRAPH 4.1 TEXTILE INDUSTRY - REGIONAL PHYSICAL PRODUCTION - 1981-1993
0
50
100
150
200
250
1981 1982 1983 1984 1985 1986 1987 1988 1989 1990 1991 1992 1993
NE PE MG RJ SP PR SC
GRAPH 4.2 APPAREL INDUSTRY - REGIONAL PHYSICAL PRODUCTION 1981 -
1993
0
50
100
150
200
1981 1982 1983 1984 1985 1986 1987 1988 1989 1990 1991 1992 1993
NE RJ MG SP SC
GRAPH 4.3 TEXTILE INDUSTRY - TOTAL SALES JAN/92 - JUL/95
0
50
100
150
200
jan./92 mai./92 set./92 jan./93 mai./93 set./93 jan./94 mai./94 set./94 jan./95 mai./95
CEARÁ PERNAMBUCO MINAS GERAISRIO DE JAN. PARANÁ STA.CATARINA
22
GRAPH 4.4 APPAREL INDUSTRY - TOTAL SALES JAN 92-JULY 95
0
50
100
150
200
JAN92
ABR JUL OUT JAN93
ABR JUL OUT JAN94
ABR JUL OUT JAN95
ABR JUL
Source:Fed.Ind. Estaduais
CE PE MGRJ PR SC
GRAPH 4.5 TEXTILE INDUSTRY - TOTAL SALES- S ÃO PAULO
jan 92- july 95
0
50
100
150
200
250
Jan-
92
Jul-9
2
Jan-
93
Jul-9
3
Jan-
94
Jul-9
4
Jan-
95
Source:FIESP 1992=100
23
24
BIBLIOGRAPHYBLANDER,M.(1995) A Industria Têxtil Sob Ameaça. Revista Notícias, S.P., FIESP/CIESP, pp.8-14.CONJUNTURA ECONÔMICA, agosto 1995, FGV, Rio de Janeiro.FIEP/DEC (1995). Sistema de Indicadores Conjunturais da Indústria do Estado do Paraná.Curitiba, (v.10),n.8, out.GAZETA MERCANTIL (2/10/95) A Crise que Afeta o Setor Têxtil.HRIVANATZ,W.(1991) A Competitividade do Setor Têxtil do Brasil em Comparação a PaísesSelecionados . IV Conferência de Tecnologia Têxtil e de Confecção. Senai-Cetiq, R.J.IPARDES (1995). Estudo da Competitividade do Algodão do Centro-Sul Brasileiro. Curitiba,132p.JORNAL DE INDÚSTRIA E COMÉRCIO (18/9/95) Paraná teve 2186 indústrias criadas noprimeiro semestre.MELO,M.L. de (1978). Regionalização Agrária do Nordeste. Recife, SUDENE, CPR, Div.Pol.Esp.NAZARETH,P.A .(1994) A Liberalização Comercial no Brasil: impactos sobre o complexoTêxtil/Vestuário. Dissertação de Mestrado IEI-UFRJ.OLIVEIRA,G.(1987) O Setor Têxtil em Pernambuco: aspectos gerais. Recife, FIEPE/DECON.mimeo, 52 p.ROLIM,C.F.C.& CARLEIAL,L.M.F.(1990) O Complexo Agroindustrial do Algodão no Ceará:considerações iniciais sobre as implicações decorrentes da sua desarticulação. Fortaleza, FIEC,71p.ROLIM,C.F.C.(1992) A Nova Divisão Espacial do Trabalho no Brasil. CNPq, Relatório dePesquisa.ROLIM,C.F.C.(1996) Efeitos Regionais da Abertura Comercial Sobre uma Cadeia Produtiva:Algodão, Têxtil, Vestuário. IPEA, RJ. mimeo 62p.SIEGEL,S.(1956) Non-Parametric Statistics for the Behavioral Sciences. N.Y. Mcgraw-Hill.SINDITEXTIL-CE (1995) A Evolução e Expectativa da Indústria Têxtil no Ceará. Fortaleza,mimeo, 30 p.UNICAMP/UFRJ/FUND. DOM CABRAL/FUNCEX(1993). Estudo da Competitividade daIndústria Brasileira: Competitividade do Complexo Têxtil. Campinas, 75 p.

25