The boring but have to get through stuff…… A basic understanding of Positive Behavioral...
100
Data Collection The boring but have to get through stuff……
-
Upload
clement-ramsey -
Category
Documents
-
view
214 -
download
0
Transcript of The boring but have to get through stuff…… A basic understanding of Positive Behavioral...

Data CollectionThe boring but have to get through
stuff……
A basic understanding of Positive Behavioral Interventions and Supports and How it fits with Problem Solving Model
First…
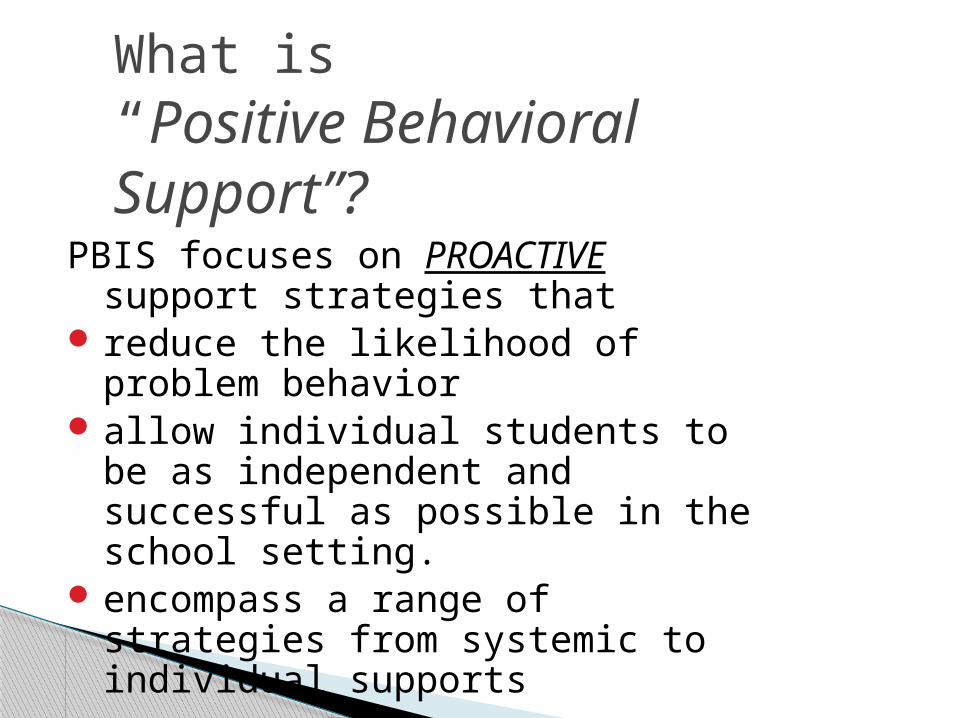
What is “Positive Behavioral Support”?
PBIS focuses on PROACTIVE support strategies that
reduce the likelihood of problem behavior allow individual students to be as
independent and successful as possible in the school setting.
encompass a range of strategies from systemic to individual supports

PBIS Continuum
80% of Students
15%
5%Universal Interventions –
proactive strategies supporting all students
Intensive Interventions -individualized
strategies supporting students with high
risk behaviors
Targeted Interventions –specialized strategies
supporting students with at risk behaviors
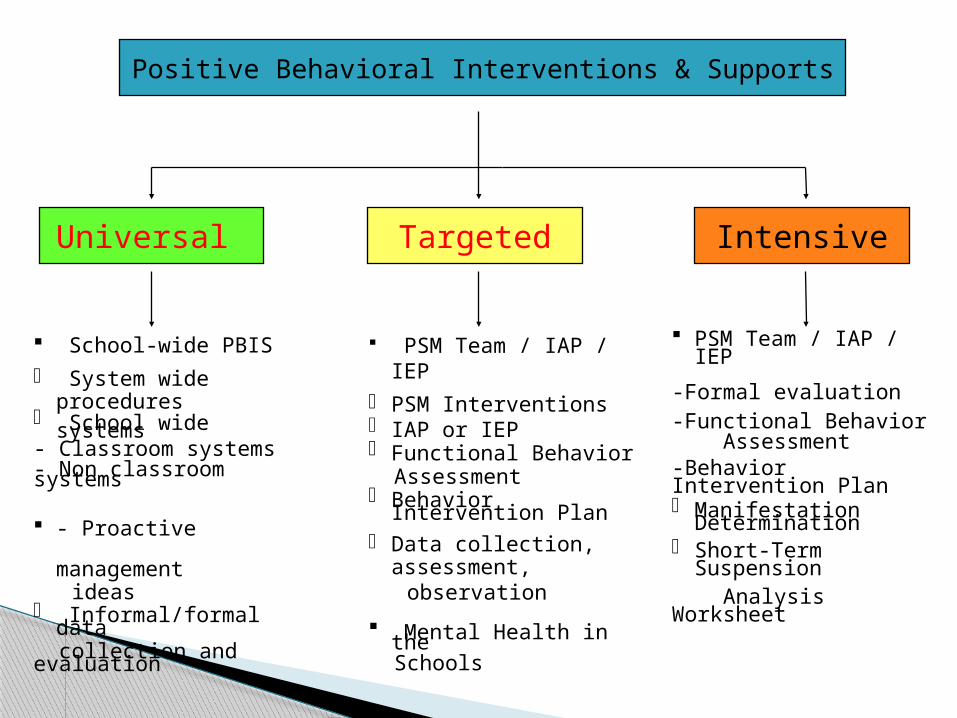
Positive Behavioral Interventions & Supports
Universal
School-wide PBIS
- System wide procedures- School wide systems- Classroom systems- Non classroom systems
- Proactive management ideas- Informal/formal data collection and evaluation
Targeted
PSM Team / IAP / IEP
- PSM Interventions- IAP or IEP- Functional Behavior Assessment- Behavior Intervention Plan- Data collection, assessment, observation
Mental Health in the Schools
Intensive
PSM Team / IAP / IEP
-Formal evaluation-Functional Behavior Assessment -Behavior Intervention Plan- Manifestation Determination- Short-Term Suspension Analysis Worksheet

Problem Solving Continuum
School-wide systems to support student achievement.
Leve
ls o
f Int
erve
ntio
n
INTENSIVE 1 – 7 %
STRATEGIC 5 - 15 %
CORE 80 - 90 %
Adapted from Sugai and Horner

Baseline data collection Analysis of data collected Problem definition Design interventions Identification of who, when, where teaching will occur Implementation of interventions Charting/Progress Monitoring Analysis of progress Continue implementation, change the interventions some, change the
interventions significantly Continue with the review plan, intervene, analyze process Based in Behavior Analysis
How Do the Processes Align?
The most important alignment is that both support most students through “universal” school/classroom processes, some students through more “targeted” support, and a small group with the most “intensive” support
Other Areas of Alignment Include: PSM
PBIS
Collecting Data in Many Ways to Assist in the Development of
Intervention Strategies
Data Collection
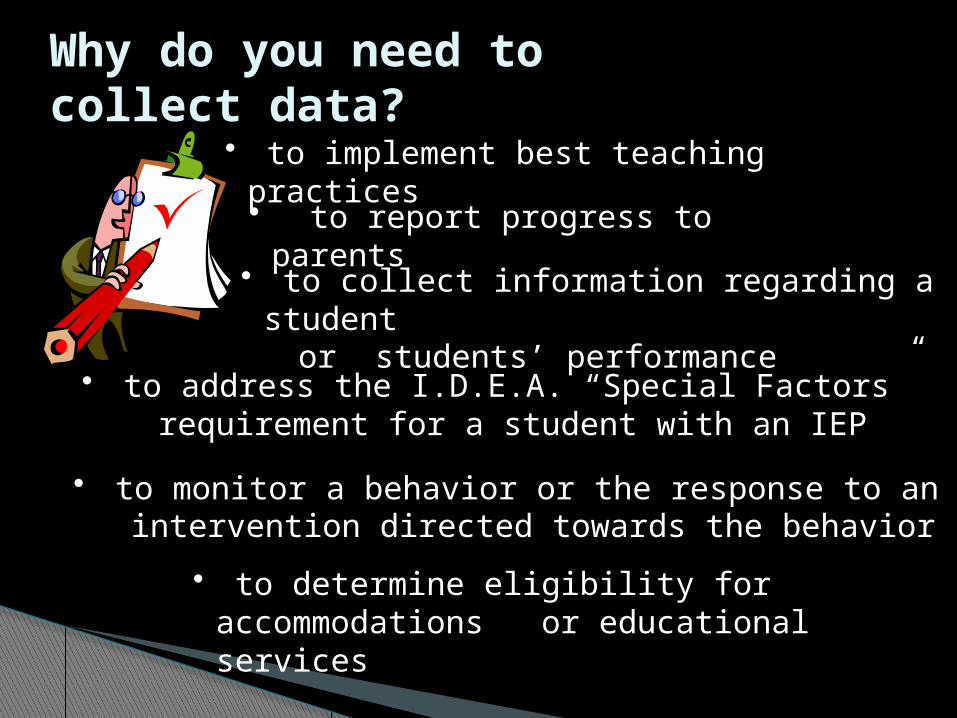
Why do you need to collect data?
• to collect information regarding a student or students’ performance
• to report progress to parents
• to monitor a behavior or the response to an intervention directed towards the behavior
• to determine eligibility for accommodations or educational services
• to implement best teaching practices
• to address the I.D.E.A. “Special Factors” requirement for a student with an IEP

Data is collected for a variety of reasons.◦ To establish base-line data.◦ To identify behavioral patterns
- Time- Frequency- Duration- Intensity
◦ To measure student behavior in specific settings or contexts.
◦ To provide objective and accurate data to evaluate student growth.- Data collected must be unbiased and purely
objective.- Data must be accurate and free of speculation or
personal opinion.- Data should never be influenced by other students
or related consequences and should only reflect the behavior of the student being observed.
Why do we collect data and why is it so important that the data be objective and accurate?
Data should be collected in as many settings and contexts as possible.
Data collection is important in areas where behaviors are not observed to help substantiate a lack of stimuli.
Where should we collect data?
Time of day or schedule is sometimes very important in determining student behavior patterns.
Fatigue or the end of a medication cycle might give way to a behavioral episode, so it is important to not leave out any period during the day.
When should we collect data?

Data collected will provide information about specific behavior patterns.
Data will help identify stimuli or triggers for student behavior.
Data will provide observed responses to specific stimuli.
Data collection is an important component of the Functional Behavior Assessment process.
Data will help provide a picture of the child and give the care-giver an objective base from which to develop a hypothesis about student’s behavior.
This hypothesis will serve as a platform on which to build a Behavior Intervention Plan.
How do we use the data collected?

Data collection is not limited to students with behavioral needs.
Any type of student need should be identified and based on objective observation or assessment.
IEPs are based on data collected from a variety of performance and functional levels.◦ Social/Emotional◦ Health/Physical◦ Intelligence◦ Academic Performance◦ Communication
Who should data be collected for?

The ultimate outcome we want from effective and accurate data is a complete understanding of the child and a road map to success in meeting the child’s needs and providing an educational environment in which the child can learn.
This is after all the goal of special education to provide a free and appropriate public education for all special needs children.
To level the playing field by providing modifications, accommodations and services to meet the specific needs of the children
What is the final use and purpose of the data collected?
The Rules of Data Collection
1. Meaningful and relevant to the behavior2. Unobtrusive as possible3. Respect the dignity of the student and the
student’s age4. Promote independence5. Foster peer acceptance
Educational Team Member’s Responsibility?

Teacher Responsibilities
Identify and define skill/behavior
Establish BASELINE and CRITERIA
Create a user-friendly data collection method
Train team members to collect data across environments
Review and analyze data weekly
Modify programs based on data
Related Service Personnel Responsibilities
Evaluate in specialty areas for present level of performance (baseline)
Provide recommendations to educational team based on evaluation
Evaluate in specialty area for student progress (criteria)

Para-Professional Responsibilities
Participate in data collection training
Collect data in environments where the teacher may not be present and during instruction
Review and analyze data with educational staff

Parent Responsibilities
Participate in data collection training
Collect data in home and community settings
Share data with educational team on a regular basis
How to Select a Data Collection Method?

Indirect or Informant Reports; Direct Observation; and, Combination System.
Data Collection Options
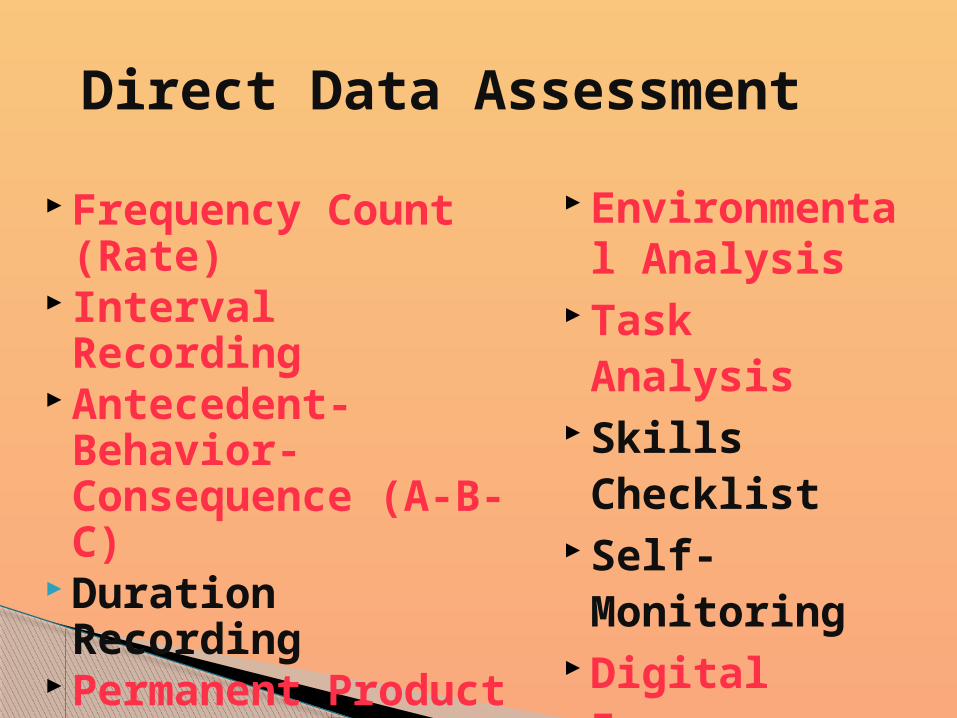
Direct Data Assessment
Frequency Count (Rate)
Interval Recording Antecedent-Behavior-
Consequence (A-B-C) Duration Recording Permanent Product Video
Environmental Analysis
Task Analysis Skills Checklist Self-Monitoring Digital Images Photographs

Frequency Count
Number of times the behavior or skill occurred
Interval Recording

A-B-C Analysis
Antecedent Behavior Consequence
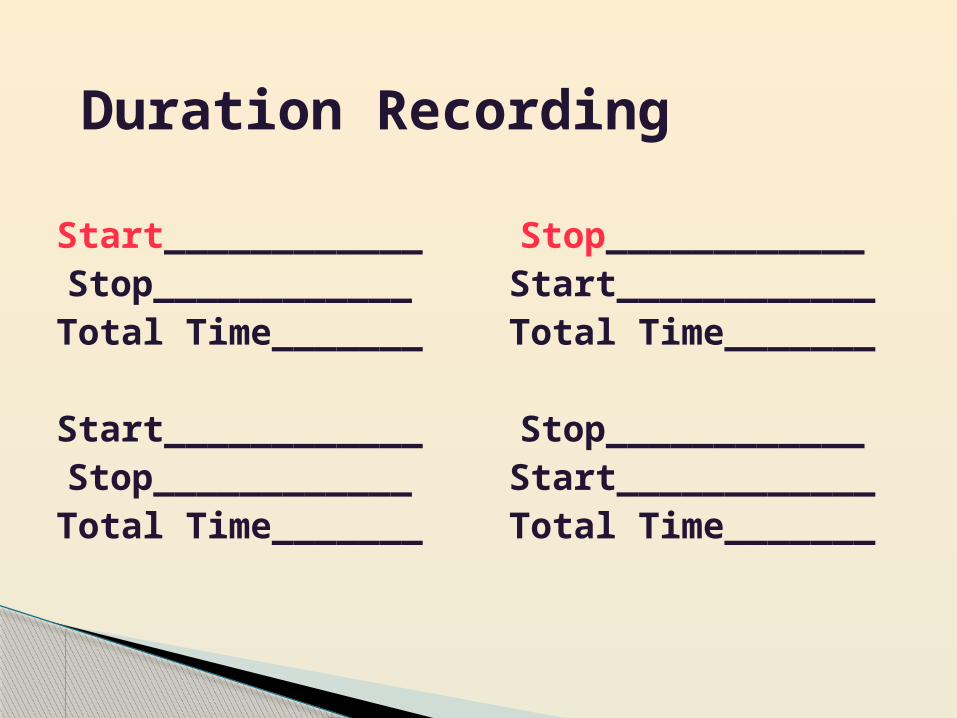
Duration Recording
Start____________Stop____________Total Time_______
Start____________Stop____________Total Time_______
Stop____________Start____________Total Time_______
Stop____________Start____________Total Time_______

Permanent Product
skoole04+7
14
School
04+7
11

Environmental Analysis
Hallway Group Recess Lunch MathBehavior or skill
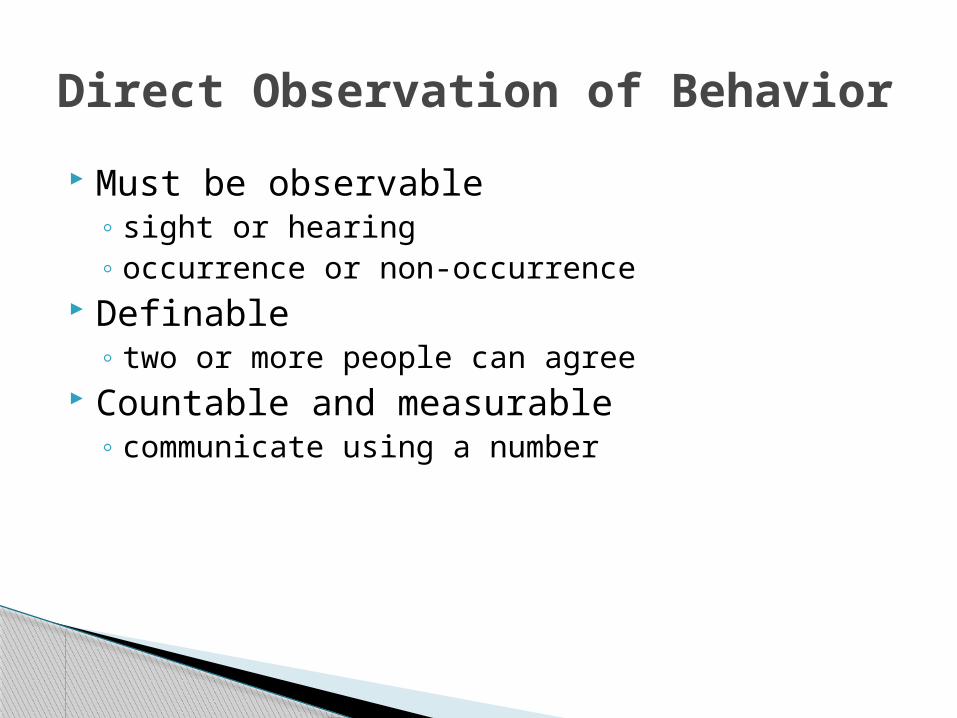
Must be observable◦ sight or hearing◦ occurrence or non-occurrence
Definable◦ two or more people can agree
Countable and measurable◦ communicate using a number
Direct Observation of Behavior
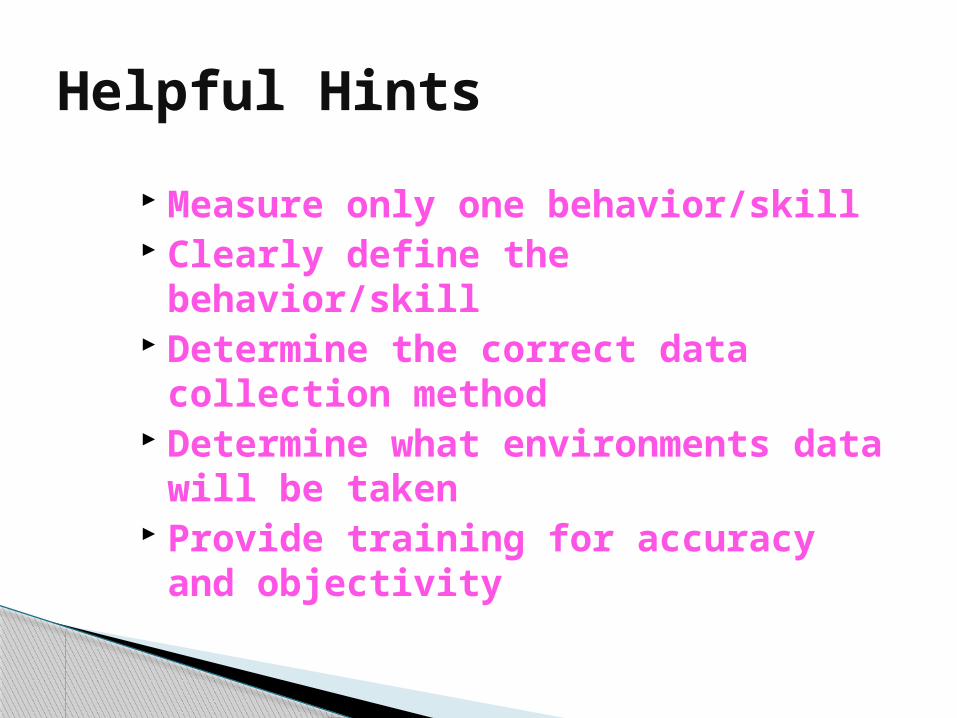
Helpful Hints
Measure only one behavior/skill Clearly define the behavior/skill Determine the correct data collection
method Determine what environments data will
be taken Provide training for accuracy and
objectivity

Trish is aggressive.
Descriptions of Problem Behavior
Trish hits other students during recess when she does not get her way.
Concrete Description of Behavior
Carlos is disruptive.
Description of Behavior

Carlos makes irrelevant and inappropriate comments during class discussion.
Concrete Description of Behavior

Academic engaged time refers to attending to material and task, making the appropriate motor response, and asking for assistance in an appropriate manner.
Academic Engaged Time

Total disruptive behavior is a class of behaviors that disturbs, the classroom ecology and interferes with instruction. Examples of disruptive behaviors include being out of seat without permission, not complying with teacher instruction, hitting, biting, making any audible noises or vocalizations that disrupt the environment, yelling, cursing, and taking others’ property.
Total Disruptive Behavior

Total negative social interaction is defined as behaviors that disturb ongoing play activities and involves physical or verbal aggression. Examples of these disruptive behaviors include hitting, biting, curing, threatening, and grabbing.
Total Negative Social Interation

Time spent alone is defined as when the target student is not within 10 feet of any other children, is not socially engaged, and is not participating in any activity with other children.
Time Spent Alone
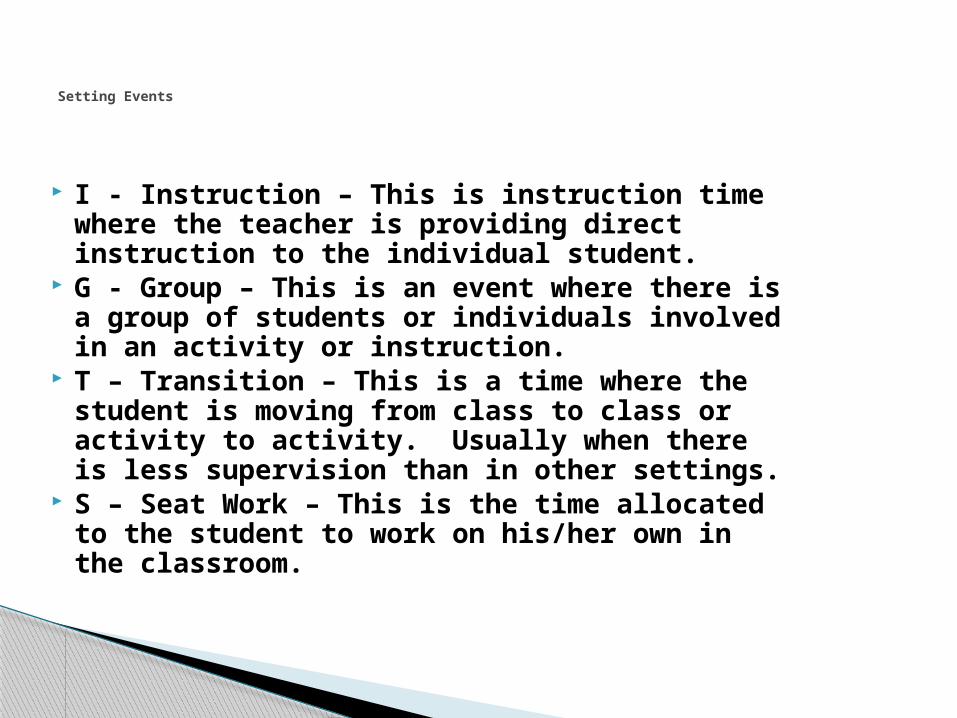
I - Instruction – This is instruction time where the teacher is providing direct instruction to the individual student.
G - Group – This is an event where there is a group of students or individuals involved in an activity or instruction.
T – Transition – This is a time where the student is moving from class to class or activity to activity. Usually when there is less supervision than in other settings.
S – Seat Work – This is the time allocated to the student to work on his/her own in the classroom.
Setting Events

Environmental settings the child experiences during the day◦ Academic Classroom (math, science, social studies
or English)◦ Gymnasium◦ Lunchroom◦ Hallway◦ Music room
The structure and presentation may vary and may provide for different behavioral opportunities
Different contexts may also offer different challenges to the student and may trigger different behavior responses.◦ Example might be:
- Academic learning challenges.- Physical challenges in PE.- Social challenges in group activities like music
Contexts
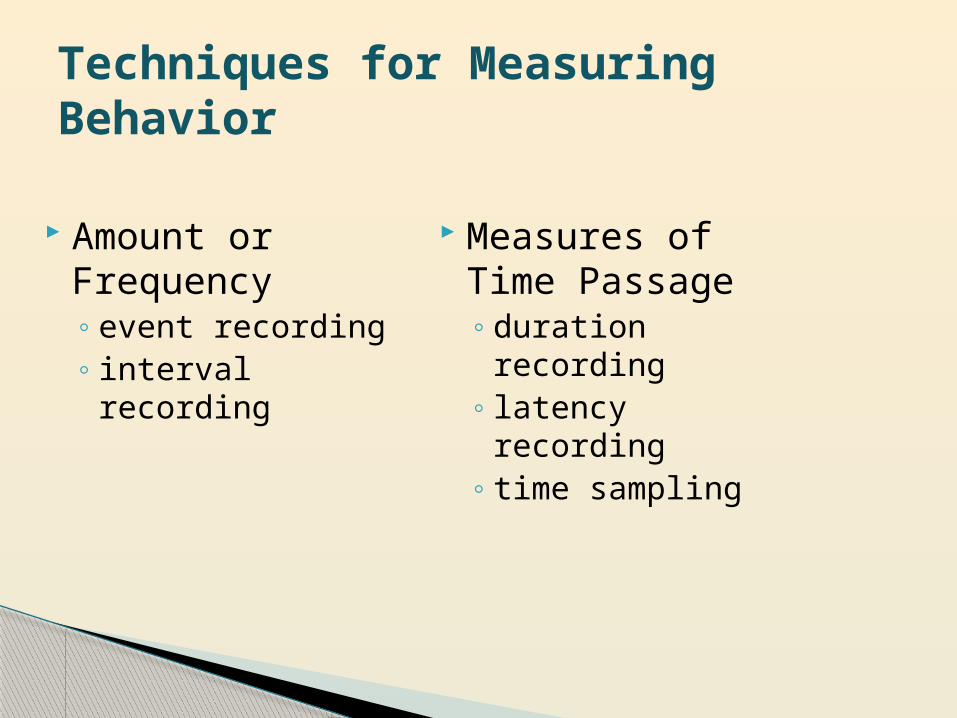
Amount or Frequency◦ event recording◦ interval recording
Measures of Time Passage ◦ duration
recording◦ latency recording ◦ time sampling
Techniques for Measuring Behavior

Event Recording◦ Behaviors that have a discrete beginning and end
Interval Recording◦ Behavior happens very frequently and lasts for a
discrete period of time
Amount or Frequency

What events, persons or environmental factors are present when the behaviors occur?◦ Events examples
- Doing math problems (not understanding)- Playing basketball and being dominated- Giving a speech in front of the class and struggling
with words.- Asked to do school work
◦ Persons in the setting- Class bully- X-girlfriend- Demanding teacher perceived as an enemy- Group of students ignoring the child
◦ Environmental factors- Temperature in the room- Physical location of desk- Hunger, thirst of illness.- Social problems or problems at home.
Antecedents
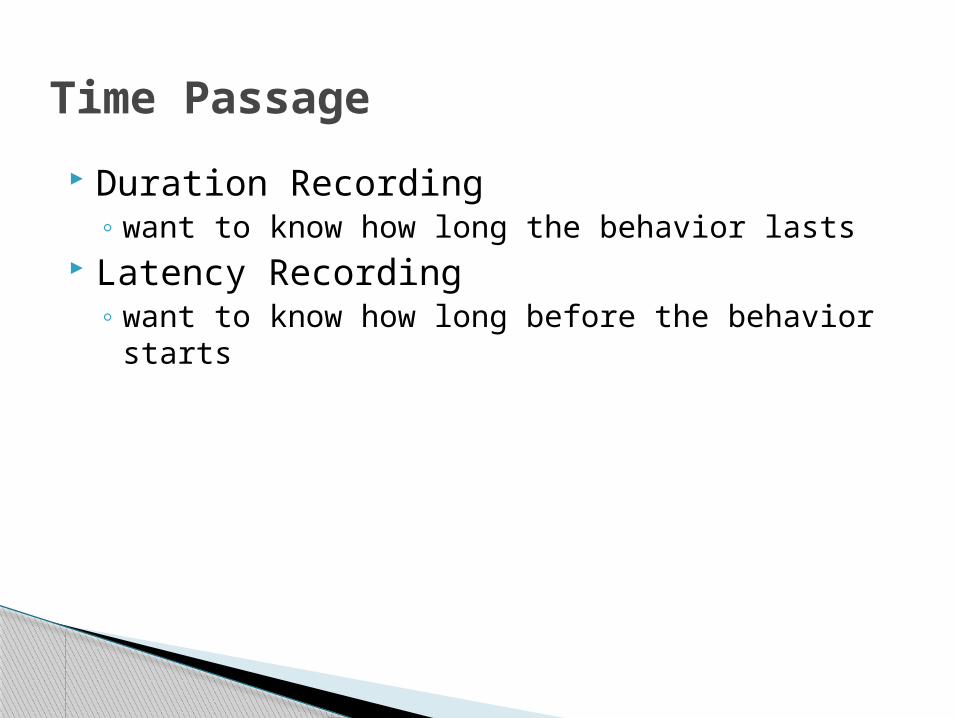
Duration Recording◦ want to know how long the behavior lasts
Latency Recording◦ want to know how long before the behavior starts
Time Passage
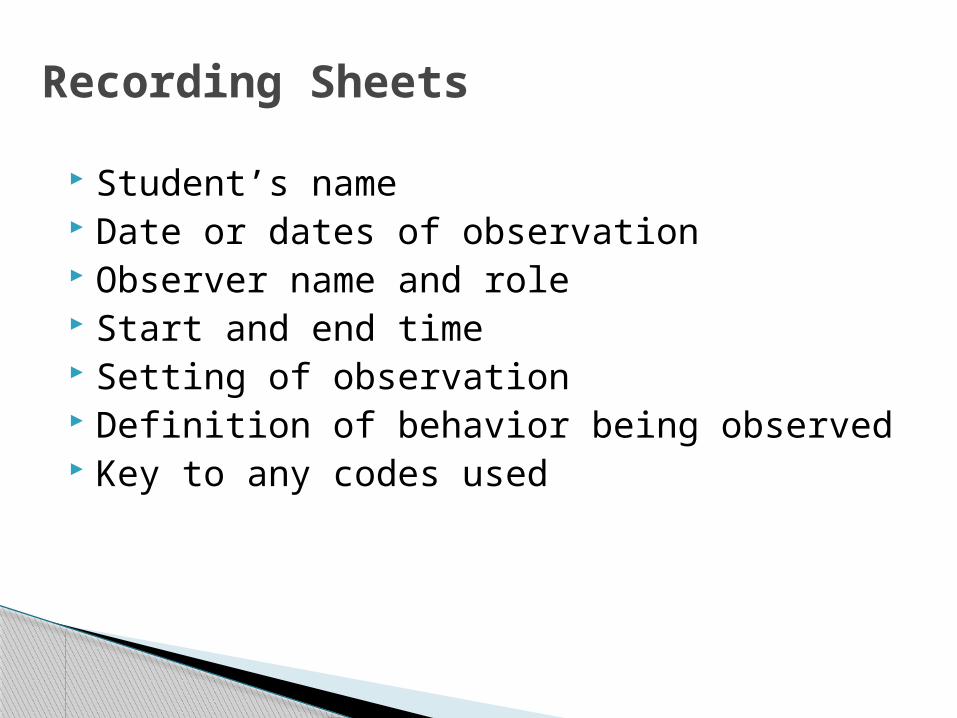
Student’s name Date or dates of observation Observer name and role Start and end time Setting of observation Definition of behavior being observed Key to any codes used
Recording Sheets
Advantage◦ easily converted into a graph
Limitations◦ requires behavior that occurs at a relatively stable
level and is easy to count◦ not useful when behavior occurs at high rates or
for extended period of time
Event Recording
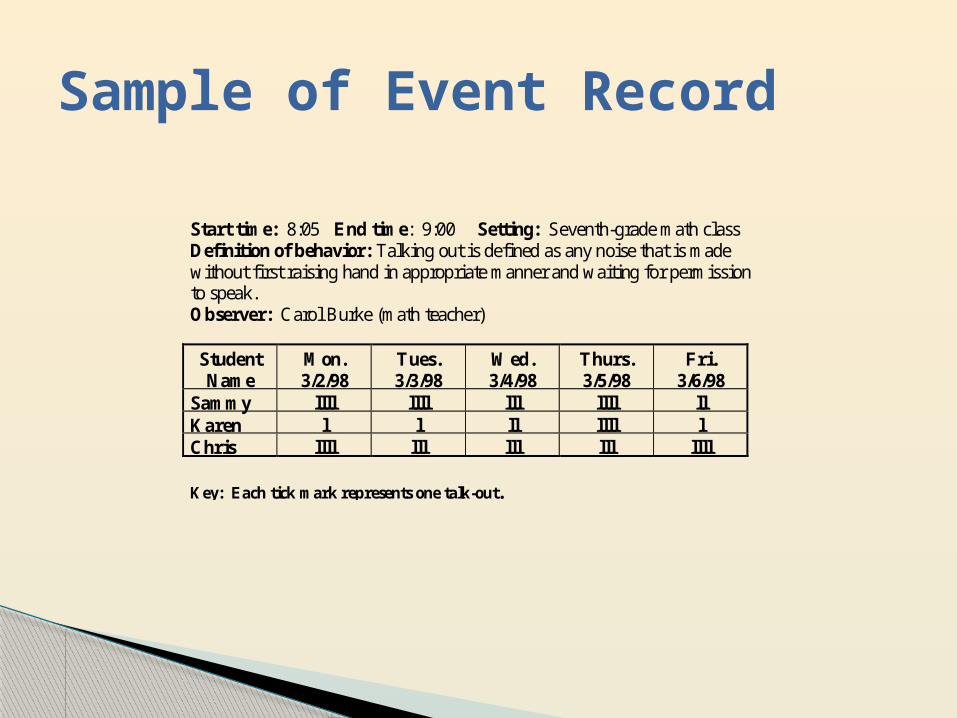
Sample of Event Record
Start time: 8:05 End time: 9:00 Setting: Seventh-grade math class Definition of behavior: Talking out is defined as any noise that is made without first raising hand in appropriate manner and waiting for permission to speak. Observer: Carol Burke (math teacher) Student Name
Mon. 3/2/98
Tues. 3/3/98
Wed. 3/4/98
Thurs. 3/5/98
Fri. 3/6/98
Sammy llll llll lll llll ll Karen l l ll llll l Chris llll lll lll lll llll Key: Each tick mark represents one talk-out.

Sample of Event Record
Student Name: Peter Pan Start time: 8:05 End time: 9:00 Setting: Seventh-grade math class Definition of behavior: Hand raising is one hand over head, makes eye contact with teacher, no sounds or extraneous movement. Relevant Comment/Question is a comment or question that has direct relationship with what is being discussed at the time. It is delivered in an appropriate manner. Homework Completion is turning in homework on time, acceptable quality, all questions attempted. Observer: Carol Burke (math teacher) Behavior Mon.
3/2/98 Tues. 3/3/98
Wed. 3/4/98
Thurs. 3/5/98
Fri. 3/6/98
Hand raising
llll llll lll llll ll
Relevant Comment/Question
l l ll llll l
Homework Completion
llll lll lll lll llll
Key: Each tick mark represents one occurrence.

What types of behavior might you use event
recording to measure?

Chart Clipboard Tape Beads Beans/coins/paperclips Golf counter Knitting counter
Innovative techniques

Requires undivided attention during intervals
Watch student during entire interval Record whether behavior occurred Intervals are approximately 10 to 30
seconds each
Interval Recording

Sample of Interval Recording
Student: Bugs Bunny Start time: 8:05 End time: 8:15 Setting: seventh-grade English class Definition of behavior: On-task behavior is defined as appropriately writing, reading, talking about the assignment, or waiting to ask the teacher a question regarding the assignment. Observer: Daffy Duck (recess monitor) minute 10” 20” 30” 40” 50” 60”
1 O O X X X O 2 X O O O X O 3 X O O X O X 4 X X X O O X 5 O O X O X O 6 O X X X X X 7 X O O O O O 8 O X X X X O 9 X O O O X X
10 O X X O X O Key: O = Behavior was not observed at all during the 10-second interval. X = Behavior was observed at least once during the 10-second interval. 10” = 10 seconds.

Sample of Interval Recording
Student: Bugs Bunny Start time: 8:05 End time: 8:20 Setting: morning recess Definition of behavior:
Social Interaction: within 2 feet of another child with interactions Parallel Play within 2 feet of another child, no interactions Alone: further than 2 feet from anyone Organized Play: interacting with others in an organized game or activity No Code: none of the above. Observer: Elmer Fudd (paraprofessional)
Time Social Interaction
Parallel Play
Alone Organized Play
No Code
+ - + - 10” x 20” x 30” x 40” x 50” x 60” x 70” x 80” x 90” x
100” x Key: 10” = 10 seconds.

Advantages◦ applies to virtually any target behavior◦ can be converted to percent◦ yields data of relative frequency and duration
Disadvantages◦ requires accurate measure of behavior in
relation to a small amount of time◦ requires undivided attention
Interval Recording

What types of behavior might
you measure using interval recording?

Timers Stop watches Use breaks between intervals
◦ On 30 seconds◦ Rest 10 seconds
Innovative ways to use interval recording

Use a stopwatch or a watch with a second hand
Start timing when behavior starts Stop when behavior ends
Duration Recording

Sample Duration Recording
Student: Spongebob Squarepants Setting: Third-grade class Definition of behavior: Student has tantrums showing inappropriate signs of anger (e.g.:clenched fists, yelling, cursing, kicking, refusal to follow directions, punching, or usingobscene gestures). Observer: Patrick Starr (teacher)
Date Start Time End Time Duration 3/2/98 8:45:07 8:59:09 :14:02
2:39:49 2:49:59 :10:10 3/3/98 9:05:03 9:14:03 :09:00

Advantages◦ produces a percentage◦ measures behaviors that occur at extremely high
rates and/or extended periods of time Limitations
◦ requires discrete behaviors◦ requires a stopwatch
Duration Recording

What types of behaviors might
you measure using duration recording?

Measures how long it takes for behavior to begin◦ use a stopwatch or watch with a second hand◦ start timing when request for behavior is given◦ stop timing when behavior is initiated
Latency Recording

Sample Latency Recording
Student: Tommy Pickles Setting: Third-grade class Definition of behavior: Student initiates, following teacher’s verbaldirections. Observer: Angelica Pickles (counselor)
Date TeacherRequest
StudentInitiates
FollowingDirections
Latency
3/2/98 8:45:07 8:59:09 :14:02 2:39:49 2:49:59 :10:10
3/3/98 9:05:03 9:14:03 :09:00

Advantages◦ can easily be converted to an average
Limitations◦ requires discrete behavior◦ requires a stopwatch
Latency Recording

What types of behavior might
you measure using latency recording?

Set up time intervals Observe behavior only at the end of the
time interval Record whether the behavior is or is not
occurring at that particular time.
Momentary Time Sampling

Sample Momentary Time Sampling
Student: Tom Cat Start time: 8:05 End time: 8:15 Setting: seventh-grade English class Definition of behavior: On-task behavior is defined as appropriately writing, reading,talking about the assignment, or waiting to ask the teacher a question regarding theassignment. Observer: Jerry Rodent (paraprofessional)
minute 10' 20' 30' 40' 50' 60' 1 O O X X X O
Key: O = Behavior was not observed at the end of the 10 minute interval. X = Behavior was observed at the end of the 10 minute interval. 10' = 10 minutes.

Advantages◦ Data can easily be converted to percent◦ Does not interrupt the delivery of instruction
Limitations◦ requires a large number of observations to allow
for interpretation of data
Momentary Time Sampling

What types of behavior might
you measure using momentary
time sampling?

Advantages◦ allows the observer to plot the relationship
between two or more variables◦ easy to complete and interpret◦ useful in deciding about more focused
assessment
Scatterplots

Limitations◦ May not capture complete picture of
social/environmental context of behavior◦ May fail to distinguish between low and high
intensity behavior◦ Technical adequacy may vary from person to
person
Scatterplots


Measure Reward Evaluate
Teach Self Control

Clearly define behavior(s) and regularly review definition(s).
Assure that observers and interviewers have adequate training and experience.
Select appropriate assessment strategies for behavior(s) and context(s).
Ways to Strengthen Measurement of Behavior

Collect information across time and settings using multiple strategies and persons.
Conduct routine checks of the accuracy of observer scoring/recording procedures.
Ways to Strengthen Measurement of Behavior (continued)

Summary of Data Collection Provides data to determine success of BIP Measures improvement for student and
professionals Teaches protocol for new behavior Alerts staff to use of specific consequences
impacting positive or negative behavior

Bonus Slide: Positive Interventions: Top 1010. Student praised privately9. Whole class praised8. Student praised by other students7. Student praised in front of other students6. Student’s work displayed
5. Student’s name mentioned in assembly4. Student receives positive comment on written
work3. Parent informed about good behavior2. Student receives good marks on report card

And the number 1 positive intervention…
……Teacher Reaction!
“Verbal and physical teacher reactions are the simplest ways to acknowledge and reinforce acceptable behavior and to acknowledge and provide negative consequences for unacceptable behavior…” (Marzano, 2003)

And Now What?
Organize
and
Summarize Analyze
Intervention and
Evaluation

Organize and Summarize
• Collect information across time and settings
• Utilize multiple observers, if possible
• Record behaviors that can be seen and measured
• Utilize data collection tools
Be Specific
Be Concise
Be Descriptive
Just the facts!

Analyze the Data
Are there patterns? Are there specific locations,times, subjects or
people? (Triggers) Are there physical signals of impending
problems? Are there home concerns? Divorce? Death?
Illness? Transition? How often do the behaviors occur? (frequency) How long do behaviors last? (duration) How severe or damaging are the behaviors?
(intensity) Can the student continue with their school day
when behavioral episode is over?

BehaviorsOf
Concern(What student does)
Frequency(How often occurs per hour,
day week)
Intensity(How damaging or
destructive: mild, moderate, severe)
Duration(How long lasts: minutes,
hours)
Example Format for Data Analysis

Intervention and Evaluation• Change aspects of the environment that trigger challenging behavior
• Teach the student more acceptable ways to get their needs met• Change aspects of the environment that happen following the behavior
• Collect data and evaluate impact of interventions on behavior

Research
What We Should Know About Behaviors

Focus on Tiers (Levels) I & II as General Education Requirement
Tier I Data on Office & Discipline referrals and Actions
that took place School wide Positive Behavioral Interventions
and Supports Second StepTier II Direct behavior training (social skills) Additional training or groups (self-instruction,
anger control, organizational skills) Development of Programs in the school to
address top areas of need
-George Batsche

Focus of Tier (Level) III as More Formal Process
Team Meets & Typically begins ◦ Formal Collection of data (Frequency
data)◦ Completion of Functional Behavioral
Assessment (FBA)◦ Design of a Behavioral Intervention Plan
(BIP)◦ Implementation of BIP◦ Progress Monitoring
-George Batsche

What about Progress Monitoring & Peer Comparisons?
Level of Behavior “necessary for success” versus Level of Current, Local Peer Performance
Level of Behavior Necessary for Success (Proficient Level)
Level of Current, Local Peer Performance
• 75% for • On Task• Compliant• Accuracy of Work
Peer could be as high as 90% but this is more than proficient. National Standard (NCLB) is proficient.
-George Batsche

But What About the Most Severe Behaviors?
Harmful to self or others: Assault and battery
Not Harmful to self or others but causes significant disruption of the learning environment.
Target for replacement behavior would need to be higher than the 75% proficient level
100% would need to be the target level for replacement behavior

Progress Monitoring
Using the Student’s Progress
to Monitor Effectiveness of the PSM
Intervention Strategies

Progress Monitor Student’s Response to Interventions
Progress monitor by observing student at least 3 times a week
Remember you need to progress monitor academic areas that are impacted by the behavior
Chart results of your behavior observations and your academic probes
Utilize same decision making strategies regarding changing the interventions as you would with an academic only issue
Remember that students who have behavioral issues but there is no educational impact will
continue at PSM intervention level but will not be eligible for consideration for entitlement.

Example Baseline Data on Tyler Teal
Student: Tyler Teal Grade 3 Target Behavior: On Task Baseline Data:
◦Day 1 26/60 = 43%◦Day 2 46/60 = 77%◦Day 3 32/60 = 54%◦Median 32/60 = 54%
I just know I can do my work.

Set Goal for Tyler Teal On task behavior falls under “level
of behavior necessary for success” or proficiency level which is 75%
Goal for Tyler Teal’s on task behavior would be 45/60 (75%).
Current baseline for Tyler Teal is 32/60 or 54%

Progress Monitoring
Name: Tyler Teal
Target Behavior:
On Task
Baseline (Median): 32/60 or 54%
Goal: 45/60 or 75% Proficiency
0 1 2 3 4 5 6 7 8 9 10 11 12 13 14 15
Days
90
80
70
60
50
40
30
20
10
M T W TH F M T W TH F M T W TH F
Baseline = 54%
Day 1 = 26/60 = 43%
Day 2 = 40/60 = 67%
Day 3 = 40/60 = 67%
Day 4 = 32/60 = 54%
Day 5 = 50/60 = 83%
Day 6 = 51/60 = 85%
Day 7 = 34/60 = 57%
Day 8 = 55/60 = 92%
Day 9 = 24/60 = 40%
Day 10 = 33/60 = 55%
Day 11 = 39/60 = 65%
Day 12 = 38/60 = 63%
Day 13 = 41/60 = 68%
Day 14 = 40/60 = 67%
Day 15 = 45/60 = 75%
On
Task
B
ehav
ior
Wee
k 1
Wee
k 2

Will Tyler Teal get to Proficient Level within 18 weeks of Intervention?
Consider whether Tyler will likely reach the 75% within 18 weeks or less
Ask if Tyler’s projected “on task” behavior (trend) line will intersect the “aim line” within the time period above.
If no, then the “Growth Rate” Behavior criteria
has been met.
• If yes, the “Growth Rate” Behavior criteria has NOT been met.

Another Example:Situation: Toby has low incidence but high
intensity behaviors that meet the definition of “assault” . (i.e. hitting adults & peers such that there are safety concerns)
Toby’s Baseline: 4 thirty minute intervals in a day without incident (4/12) or 33%.
Goal : 12/12 intervals without incident or 100%.Note: There are 12 thirty minute intervals in the
day. (6 hour day)

Progress Monitoring
Name: Toby Toms
Target Behavior:
Time without Assaults
Baseline (Median): 4/12 or 33%
Goal: 12/12 or 100%
0 1 2 3 4 5 6 7 8 9 10 11 12 13 14 15
Days
1210
8
6
4
2
M T W TH F M T W TH F M T W TH F
Baseline = 54%
Day 1 = 4/12 = 33%
Day 2 = 4/12 = 33%
Day 3 = 3/12 = 25%
Day 4 = 4/12 = 33%
Day 5 = 5/12 = 42%
Day 6 = 4/12 = 33%
Day 7 = 5/12 = 42%
Day 8 = 5/12 = 42%
Day 9 = 6/12 = 50%
Day 10 = 6/12 = 50%
Day 11 = 6/12 = 50%
Day 12 = 5/12 = 42%
Day 13 = 6/12 = 50%
Day 14 = 6/12 = 50%
Day 15 = 5/12 = 42%
Tim
e S
egm
ents
Wit
hout
A
ssau
lts
Beh
avio
r
Wee
k 1
We
ek
2

Progress Monitoring
Teacher records intervals without incidents in the 12 thirty minute intervals during each day. Simply use checks on a chart for intervals without incident.
Record your data on a Progress Monitoring chart.
What about Toby Toms?Would you project that he will reach 100% in 18
weeks or less?