The Board of Trustees of the Leland Stanford Junior ... Board of Trustees of the Leland Stanford...
70
The Board of Trustees of the Leland Stanford Junior University Center for Materials Research Stanford, California 94305-4045 Santa Clam, 12th Congressional District Final Technical Report on PROTEIN CRYSTAL GROWTH IN LOW GRAVITY NASA #NAG8-774 CMR-93-1 SPO#7218 for the period April 27, 1989 through December 31, 1992 Submitted to George C. Marshall Space Flight Center ES-76, Space Science Lab MSFC, AL 35812 Principal Investigator: Rot_rt S.'Fe_l_o0/', Prgf_,_sor (Res.) Center for'lrclaterial_ Rg_rch Stanford, California 94"305-4045 (415) 723-4007 January1993 https://ntrs.nasa.gov/search.jsp?R=19930008697 2018-06-02T14:42:03+00:00Z
Transcript of The Board of Trustees of the Leland Stanford Junior ... Board of Trustees of the Leland Stanford...

The Board of Trustees of the
Leland Stanford Junior UniversityCenter for Materials Research
Stanford, California 94305-4045Santa Clam, 12th Congressional District
Final Technical Reporton
PROTEIN CRYSTAL GROWTH IN LOW GRAVITYNASA #NAG8-774
CMR-93-1SPO#7218
for the periodApril 27, 1989 through December 31, 1992
Submitted to
George C. Marshall Space Flight CenterES-76, Space Science Lab
MSFC, AL 35812
Principal Investigator:
Rot_rt S.'Fe_l_o0/', Prgf_,_sor (Res.)Center for'lrclaterial_ Rg_rchStanford, California 94"305-4045(415) 723-4007
January1993
https://ntrs.nasa.gov/search.jsp?R=19930008697 2018-06-02T14:42:03+00:00Z

ABSTRACT
This Final Technical Report for NASA Grant NAG8-774 cover the period from
April 27, 1989 through December 31, 1992. It covers five main topics: fluid flow studies, the
influence of growth conditions on the morphology of isocitrate lyase crystals, control of
nucleation, the growth of lysozyme by the temperature gradient method and graphoepitaxy of
protein crystals. The section on fluid flow discusses the limits of detectability in the Schlieren
imaging of fluid flows around protein crystals.
The isocitrate lyase study compares crystals grown terrestrially under a variety of
conditions with those grown in space. The controlling factor governing the morphology of the
crystals is the supersaturation. The lack of flow in the interface between the drop and the
atmosphere in gg causes protein precipitation in the boundary layer and a lowering of the
supersaturation in the drop. This lowered supersaturation leads to improved crystal
morphology.
Preliminary experiments with lysozyme indicated that localized temperature gradients
could be used to nucleate crystals in a controlled manner. An apparatus (Thermonucleator) was
designed to study the controlled nucleation of protein crystals. This apparatus has been used to
nucleate crystals of materials with both normal (ice-water, Rochelle salt and lysozyme) and
retrograde (horse serum albumin and 0_ chymotrypsinogen A) solubility. These studies have
lead to the design of an new apparatus that small and more compatible with use in t.tg.
Lysozyme crystals were grown by transporting nutrient from a source (lysozyme
powder) to the crystal in a temperature gradient. The influence of path length and cross section
on the growth rate was demonstrated. This technique can be combined with the
Thermonucleator to control both nucleation and growth.
Graphoepitaxy utilizes a patterned substrate to orient growing crystals. In this study,
silicon substrates with 10t.t grooves were use to grow crystals of catalase, lysozyme and
canavalin. In all cases, the crystals grew oriented to the substrate. The supersaturation needed
for nucleation and growth was lower on the patterned substrates. In some cases, isolated,
large crystals were grown.

TABLE OF CONTENTS
ABSTRACT
TABLE OF CONTENTS
I. INTRODUCTION
II° RESEARCH RESULTS
A. FLUID FLOW STUDIES
B. INFLUENCE OF GROWTH CONDITIONS ONTHE MORPHOLOGY OF ISOCITRATELYASE CRYSTALS
C. CONTROL OF NUCLEATION
D. GROWTH OF LYSOZYME BY
TEMPERATURE GRADIENT (AT)
E. GRAPHOEPITAXY
III. REFERENCES
IV. PUBLISHED PAPERS
V. FIGURES
ii
2
2
3
8
14
17
24
26
27
ii

I. INTRODUCTION
The research reported on in this final report had as its objective the study of the effect of
low gravity on the growth of protein crystals and those parameters which will affect growth
and crystal quality. The proper design of the flight hardware and experimental protocols are
highly dependent on understanding the factors which influence the nucleation and growth of
crystals of biological macromolecules. Thus, the primary objective of this research was
centered on investigating those factors and relating them to the body of knowledge which has
been built up for "small molecule" crystallization. This data also provides a basis of
comparison for the results obtained from low-g experiments.
The main component of this research program was the study of mechanisms involved
in protein crystallization and those parameters which influence the growth process and
crystalline perfection. Both canavalin and lysozyme were used as the basic model proteins in
these studies. Other biological macromolecules were included in this research program when
they provide an opportunity to better understand the nature of the crystallization process. The
program involves four broad areas:
o The application of both classical and novel chemical and physical techniques to study
the fundamentals of protein crystallization. Included in this area was a study of the
phase relationships in the systems of interest, primarily the factors controlling
solubility, the study of growth kinetics to determine the growth rate controlling
mechanism and the relevant activation energy involved in the process. The effects of
fluid flow on the growth and perfection of protein crystals were studied using flow
visualization techniques.
o Characterization of protein crystals. Optical microscopy gave a general evaluation of
crystal morphology, size and perfection. Phase contrast techniques gave enhanced
contrast to the surface features allowing observation down to the O.11t level.
3, Control of nucleation and growth. The information developed in the phase relationship
studies of section 1) was used to design experiments to separately control the nucleation
and growth processes. The information from section 2) was used to optimize the
growth.
4. The design and construction of a prototype of space flight hardware. The design
incorporated the results of section 3).

II. RESEARCH RESULTS
A. FLUID FLOW STUDIES
The analysis of the flows around growing crystals begun during the previous grant
(NAG8-489) has been continued. In a previous report,[ 1] it was noted that flows had been
observed around growing crystals of Rochelle salt, lysozyme and canavalin using the Schlieren
imaging technique. The values for the change of density and index of refraction with change of
concentration for each system were also reported. The change in density and index of
refraction with concentration do not by themselves indicate whether flow will occur and, if it
does, whether that flow can be imaged. The Grashof number,
Gr = Ag__2 L 3
pv 2
(g is the acceleration of gravity, Ap the change in density across the diffusion boundary layer,
L the characteristic length of the system-taken to be the height of the crystal, p the density and
v the viscosity) is a non-dimensional, fluid dynamic variable that relates the buoyant force to
the viscous drag. The larger this number, the more likely that flow will occur. More
importantly, systems with the same Grashof number should behave alike. Thus, if a range of
values of Grashof numbers can be established over which flow can be demonstrated to occur in
crystallizing systems, then calculation of a Grashof number for a new system (macromolecular
or not) will predict if flow should occur in that system.
Similarly, the ability to image the flow is not directly dependent on the change of index
of refraction with concentration, but is related to the local change in light intensity
AUI = (f2/a) f(1/n) (_n/_x) dz
where f2 is the focal length of the second mirror in the Schlieren optics, a the knife edge
aperture, n the index of refraction, On/_x is given by (dn/dc)(Oc/Ox) where x is the direction
across the plume, and dz is perpendicular to the plan of the film. Again it should be possible to
establish a range of values under which the flows will be visible. Comparisons of new
systems will establish the possibility of flow visualization.
In addition to the values for the changes in density and index with concentration, it is
necessary to establish the actual concentration at the crystal interface. For a crystal growing
under diffusion control (Rochelle salt), it is equal to the solubility. However, lysozyme[ 2] and
canavalin[ 3] grow under interface control and the interface concentration may be estimated by
using a method outlined by Pusey and Naumann.[ 41 Using these estimates, the Grashof
number and the local change in light intensity for each system have now been calculated under

theexperimentalconditions. Thevaluesof theGrashofnumberare772.48for Rochellesalt,
23.04for lysozymeand67.84for canavalin. If theGrashofnumberis normalizedby fixing
the sizeof thecrystalsat lmm, then theGrashofnumbersbecome112.64for Rochellesalt,
7.04 for lysozymeand 8.96 for canavalin. There is a much lower tendencyfor theprotein
solutionsto experienceconvectionundertheconditionsof theseexperimentsevenwhensizeconsiderationsare takeninto account,but flow doesoccurin all thesesystems. The values
found for the local change in intensity are 21.7 for Rochelle salt, 2.93 for lysozyme and 4.39
for canavalin. Based on the image quality of the films used in this study, the value of 2.39
appears to be near the limit of detectability in our system (400ASA film, f2.8, 1/51 sec
exposure).
B. INFLUENCI_ QF GROWTH CONDITIONS ON THEMORPHOLOGY OF ISQCITRATE LYASE CRYSTALS
The structure of the protein isocitrate lyase (ICL) has been under study for a
number of years at Du Pont Merck. Attempts to grow isocitrate lyase crystals by the hanging
drop method produced crystals with very poor growth morphologies (Fig. 1). It was not
immediately clear whether this poor morphology was due to unstable growth conditions or
sedimentation. A series of experiments were designed to answer this question. In addition to
the ground based experiments, ICL has been flown as part of the NASA shuttle program. As
a result of these experiments and the application of theoretical evaporation models to the
crystallizing system, factors affecting the growth of ICL crystals and, by extension, other
protein crystals became apparent.
All of the ICL used in these experiments came from Du Pont Merck. Before use, the
ICL solution (ICL in 0.1M Tris-HC1 pH 7.8, 10mM EDTA, lmM DTr, 0.4M KC1) was
incubated at 4°C for 24 hrs with a reducing solution (0.3M Glutathione, 66raM EDTA in 1M
Tris-HC1 pH 8.0) (4:100 v/v) and an inhibitor solution (50mM 3-nitroproprionate, 0.5M
MgOAc in 50raM Tris-HC1 pH 7.0) (4:100 v/v). The ICL concentrations were 10mg]ml (Du
Pont Merck) and 12mg/ml (Stanford). The well solution was 1.6-2.0M (60-80% saturation)
Na-citrate (Na-cit). The usual drop size was 41.tl (2l.tl ICL solution and 2gl well solution).
Crystals appeared within one week at 24°C.
The source of the poor morphology was investigated by closely observing drops during
crystallization. These 41.tl hanging drops (12mg/ml ICL solution, 72% Na-Cit well solution)
were observed through a microscope at 150x.
Figure 2 shows a typical result of the 41.tl hanging drop experiments. The crystal is
more obviously dendritic than those grown from a 301.tl drop (Fig. 1). It is obvious that the
poor morphology resulted from uncontrolled growth originating at the comers of the crystal.
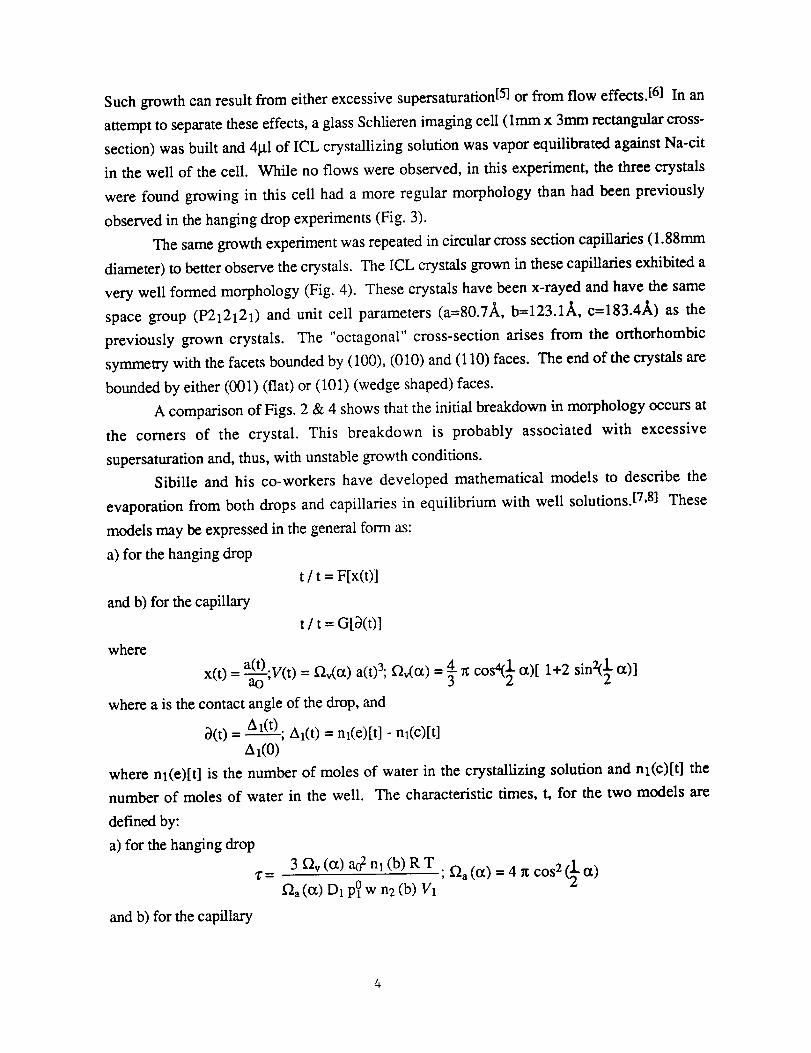
Suchgrowthcanresult from eitherexcessivesupersaturation[5]or from flow effects.[ 6] In an
attempt to separate these effects, a glass Schlieren imaging cell (lmm x 3mm rectangular cross-
section) was built and 4gl of ICL crystallizing solution was vapor equilibrated against Na-cit
in the well of the cell. While no flows were observed, in this experiment, the three crystals
were found growing in this cell had a more regular morphology than had been previously
observed in the hanging drop experiments (Fig. 3).
The same growth experiment was repeated in circular cross section capiUaries (1.88mm
diameter) to better observe the crystals. The ICL crystals grown in these capillaries exhibited a
very well formed morphology (Fig. 4). These crystals have been x-rayed and have the same
space group (P212121) and unit cell parameters (a=80.7A, b=123.1]k, c=183.4A) as the
previously grown crystals. The "octagonal" cross-section arises from the orthorhombic
symmetry with the facets bounded by (100), (010) and (110) faces. The end of the crystals are
bounded by either (001) (flat) or (101) (wedge shaped) faces.
A comparison of Figs. 2 & 4 shows that the initial breakdown in morphology occurs at
the corners of the crystal. This breakdown is probably associated with excessive
supersaturation and, thus, with unstable growth conditions.
SibiUe and his co-workers have developed mathematical models to describe the
evaporation from both drops and capillaries in equilibrium with well solutions.[7, 8] These
models may be expressed in the general form as:
a) for the hanging drop
t / t = F[x(t)]
and b) for the capillary
t / t = G[_(t)]
where
x(t)= _--_-;V(t) = f2,,(ct)a(t)3; f2,,(tx) = _ cos4( 1 ct)[ 1+2 sin_l a)]
where a is the contact angle of the drop, and
O(t) = l(t___);AAl(t) = nl(e)[t] - nl(c)[t]
zx_(0)
where nl(e)[t] is the number of moles of water in the crystallizing solution and nl(c)[t] the
number of moles of water in the well. The characteristic times, t, for the two models arc
defined by:
a) for the hanging drop
and b) for the capillary
3 f2v (a) ao2 nl (b) R T
_'2a (0t) D1 p0 w n2 (b) V1; .Qa (a) = 4 n COS2 (21-"0t)

R T L A12 (0)"r-
4S D1 pO w n2
where nl(b) is the number of moles of water in the well, D1 the diffusion coefficient of water
in air, pl 0 the vapor pressure of pure water, w the vapor pressure lowering constant, n2(b) the
number of moles of precipitant in the well, V1 the partial molar volume of water, L the distance
between the crystallizing solution and the well, S the cross sectional area of the capillary, n2 the
total number of moles of precipitant in the crystallizing solution and the well, and R and T have
their usual meaning. The parameters needed to use these models for ICL and lysozyme were
calculated as outlined in ref. [7] The osmotic coefficient for Na-cit was estimated using
equation 10, section 14 of Shoemaker and Garland.[ 9] The contact angle for the hanging drop
simulations was 90 °, the well volume 500gl and the spacing 5ram. The well volume for the
capillary simulations was 350gl and the spacing was 3.5cm. Figure 5 compares the results of
applying these models to a drop and a 1.88ram ID capillary containing the same volume of ICL
solution. The drop evaporates at a rate which is two orders of magnitude faster than the
capillary. This difference in rates is consistent with laboratory observations.
The rate of change of supersaturation is somewhat more complicated than the rate of
change in volume of the crystallizing solution since the concentration of both the crystallizing
species and the precipitant change with the change in volume and, through the solubility curve,
both affect the supersaturation. The supersaturation is further affected by the growth of
crystals in the solution. Unfortunately, neither the solubility curve nor the growth kinetics of
ICL is known. In order to estimate how supersaturation would change during crystal growth
by vapor equilibration, the models of Sibille et al.[ 7,8] were applied to lysozyme crystallization
using the solubility data reported by Pusey[ 10] and the growth kinetics described by Pusey and
Naumann.[ 4] The growth solution modeled contained 30mg/ml lysozyme and 2% NaC1
equilibrated against a well of 4% NaC1. Ten crystals were assumed to nucleate at c/s = 4 (a
value consistent with other studies). No further nucleation was allowed to take place. The
amount of lysozyme removed from solution during each growth period was determined.
Figure 6 shows the results for both a hanging drop and a capillary. The supersaturation in the
drop reaches a peak which is almost double that of the capillary. The crystallizing system can
react to this increased supersaturation by either 1) nucleating more crystals (secondary
nucleation), 2) increasing the growth rate to the point of instability, or 3) a combination of the
two. Lysozyme does the latter exhibiting secondary nucleation together with surface
roughening. ICL ,on the other hand, exhibits morphological instability.
Figure 7 shows an ICL crystal which was grown by Du Pont Merck in low-g during a
shuttle mission. The morphology is greatly improved over those grown by the hanging drop
technique on Earth. The drops used in space were larger (30gl vs. 4gl) than those used on

Earthwhichraisesthequestionof whethertheimprovementsin crystalqualityarerelatedto the
effectsof _g or simply the differencein evaporationrate. Figure 8 showsthe theoretical
evaporationratesfor 41xland 301.tldrops. The rate of equilibration was5x slower for the
largerdrop, but the crystalsshownin Figs. 1& 2 were grown underthe sameconditions.
While therewassomeimprovementin themorphologyof the 1-gcrystalgrownfrom a 30lxl
drop (Fig. 1), the decreasein equilibration rate cannot satisfactorily explain the greatly
improvedmorphologyfoundin theICL crystalsgrownin spacefrom thesamesizedrop.
Thereareotherfactorswhich mayaffect themorphologyof spacegrown crystals. It
hasbeenpointedout[-/]thatdropsevaporateslowerthanpredictedin spacedueto theexistence
of aconcentratedlayerof precipitantneartheir surfaceswhich lowersthevaporpressureof the
drop and retardsevaporation. The preliminary data in ref. [7] indicated that the rate of
evaporationdecreasedby a factor of about2. This would producea lower evaporationrate
(10x) for 30_tldropsin _tgcomparedto 4ktldropsat 1-g. This is still anorderof magnitude
faster than the equilibration rates for the capillary experiments. Clearly, the reduced
equilibrationratedueto thepresenceof aconcentratedsalt layerat the liquid-vaporinterface
wasnot theonly factorcontributingto theimprovedqualityof thespacegrownICL crystals.
In anattemptto simulate_tgconditionson thegroundandto provideafurtherbasisforcomparisonbetweenprotein crystalgrowth at 1-g andI.tg,a seriesof capillary ICL crystal
growth experimentswere performed together with somesimulatedgrowth experiments
(identicalsolutionswithout protein). Experimentswereconductedwith thecapillary in both
thenormalandinvertedpositions. In thelatter case,it washopedthat gravitywould stabilize
the densersalt layer at the liquid-vaporinterface. In thesimulatedgrowth experiments,the
invertedcapillariesequilibratedat a slightly slowerrate. In the actualgrowthexperiments,a
precipitatelayerappearedat theliquid-vaporinterfacein theinvertedcapillaries.Noprecipitatewas found in the normal capillaries,nor did such layers appearin the simulatedgrowth
experimentsandit mustbeconcludedthattheprecipitatewasisocitratelyase. In somecases
crystalseventuallygrew in this layer. Theexistenceof the precipitatein the surfacelayer
decreasethesupersaturationin theICL solutionin the samemannerasthe growing crystalsdid in the lysozymegrowth simulation. Therefore,the ICL crystalswereactually growing
from a lower supersaturationthanwould beexpectedon thebasisof evaporationalone. IfSibille'smodelof thestablesurfacelayerin _g[7] is correct,thenthis mechanismcanexplain
theimprovedcrystalmorphologyseenin theICL _tgexperiments.
"Octagonal"ICL crystalswereonly observedin the normalcapillary configuration.
Thisconfigurationpromotessolutalconvection.ThesoluteRayleighnumberbasedona ICLcrystallizing solutionwith adepthof 7.2ramis approximately2x106which is in excessof the
critical Rayleighnumberfor aqueoussolutionsof 300. Evencorrectingfor thesizeof the

capillary, theRayleighnumberwould beas high as 104. The time for onsetof convectioncalculatedfrom the time dependentRayleigh numberwas approximately lxl0 -3 seconds.
Therewill bemixing in thisconfigurationandtheresultsindicatethatsomedegreeof mixing is
desirablein thegrowthof ICL fromcapillaries.
The poor morphologyof theICL crystalsgrown by the hangingdrop methodin 1-gwasdueto high (unstable)growthratesdueto high supersaturation.While it is necessaryin
all unseeded"batch"typecrystalgrowthto increasethe supersaturationhigh enoughto cause
nucleation,aslowerrateof increaseof thesupersaturationdoesleadto morecontrolledgrowth
and crystals with better morphology. This effect is further mitigated by the presenceof
growing crystalsor aprecipitatebothof which will actto lower theoverall supersaturation.The slow rateof supersaturationcanbeachievedby usingvapor diffusion equilibration in
smalldiametercapillaries.An alternativeapproachwhichis potentiallymorecontrollableis to
use the method proposed by Wilson and co-workers[11] in which flowing nitrogen of
controlledhumiditycontrolstherateof evaporation.
TheICL growthexperimentsconductedin thecapillariesindicatethatsomeconvective
mixing is beneficialto thecrystalgrowthbyprovidingmixinganda uniformsupersaturationinthe crystallizing solution. Puseyand co-workers[12] have demonstratedin the case of
lysozyme that high flow rates can cause cessation of growth. However, most small molecule
aqueous crystal growth is done with some form of stirring (see i.e. Buckley[ 13] and
Chernov[5]). The best crystals will be expected to be found between the extremes of no flow
(mixing) and rapid flows which can cause cessation of growth in protein systems.
The usual flows found in protein crystallization are due to solutal convection where
gravity acts on density differences at the growth interface or at the vapor-liquid interface where
evaporation is taking place. These flows can be non-uniform and unpredictable. The capillary
experiments with ICL may have been fortuitous in that the size of the capillary and the volume
of solution may have provided a Grashof number which yielded a suitable flow regime for
growth. It is possible to engineer growth systems to give the proper Grashof number if the
parameters of the system are known. However, the need to quantify the parameters can be by-
passed by using gravity as a variable. To date this parameter has been explored only at the
limits available: 1-g and _tg. Experiments in an induced artificial gravity between the extremes
are needed to study the effect of gravity and flow on the growth and morphology of protein
crystals.

Summary_
While the lack of fluid flow in a _g environment is a factor in the improved quality of
space grown ICL crystals. The results of this study indicate that lack of fluid flow around the
crystal may not be as important a factor as the lack of mixing in the drop itself. This lack of
mixing in the drop allows the protein to precipitate at the liquid-vapor interface thereby
lowering the supersaturation at which the crystal grows. This lowered supersaturation leads to
a slower growth rate which improves the crystal morphology. More study is needed both in
1-g and I.tg to determine ff this mechanism is operative in other protein systems.
C. CONTROL OF NUCLEATION
It is well known that crystal growth involves two separate processes; 1) nucleation
of the species desired, and 2) the growth of these nuclei into macroscopic crystals of suitable
size and quality for the intended application. Nucleation involves a phase transformation in
which a solid surface of the phase desired is created within a nutrient phase. The crystal
growth process, on the other hand, involves heat and mass transport, i.e. removing the latent
heat evolved during the crystallization process and supplying nutrient to the growing crystal at
an appropriate rate. It is not surprising, therefore, that the energetics involved in these two
processes are not the same. In many cases, they are significantly different.
It is of practical importance to be able to isolate and control the nucleation process
separately from the subsequent growth phase. In small molecule crystal growth, this is most
often accomplished by introducing an appropriate seed crystal (usually of the material being
grown) into a melt, vapor, or solution. The use of a seed by-passes the nucleation stage by
providing the solid-liquid interface necessary for the crystal growth process to proceed. In the
growth of crystals containing biological macromolecules, obtaining seeds of the appropriate
size and quality is often very difficult and has rarely been an attractive strategy. In most
macromolecular crystal growth processes currently in use, the nucleation step is achieved in the
growth solution under poorly understood conditions and the growth proceeds in a more or less
uncontrolled manner.
In crystal growth from aqueous solutions, (the principal, if not only method, for
growing crystals of biological species) the driving force of nucleation is the supersaturation.
The supersaturation, c/s, where c is the actual solution concentration and s is the concentration
at the saturation point, provides the excess energy needed to form the solid surface in the
solution phase (homogeneous nucleation). The temperature-composition diagram in Fig. 8
illustrates the relationship between solubility and supersaturation. The solid line is the
solubility curve, which divides the diagram into two regions: unsaturated and supersaturated.

A secondcurve, the supersolubilitycurve, divides supersaturatedregion into labile and
metastableregions. The labile region is unstableand nuclei form readily by spontaneous
fluctuationsin composition.Solutionsarequite stablein themetastablestateandit is only in
thisregionwherecontrolledcrystalgrowthis possible.[5] Thewidth of themetastableregion
dependsonanumberof factors,includingpurity of thestartingmaterials.The supersaturation
neededfor homogeneousnucleationis often significantlygreaterthanthatneededfor growth
and that is why, after the initial nuclei are formed, growth normally proceedsin a rapid
uncontrolledmanner.The supersaturationnecessaryfor nucleationcanoften bereducedif a
foreign substanceis present upon which the speciesof interest prefers to nucleate
(heterogeneousnucleation).Startingfrom an undersaturatedcondition, themetastableregioncan be reachedin
principle by eitherchangingtemperatureat constantcompositionor compositionat constant
temperature. Most biological macromolecularcrystalsare grown by the latter techniquebecausethetemperaturedependentcoefficient of solubility (phaseequilibria) is usuallynot
known and,in somecases,is negligible. In Fig. 9, thephasediagramfor canavalinis given
showingregionsof both temperature dependent and independent solubility.[ 141
With respect to both nucleation and growth processes, temperature change methods are
usually easier to control with more precision than other techniques such as evaporation and
therefore, if possible, would be the method of choice.
One method for controlling nucleation without using seeds involves the localized
control of supersaturation in a specific region of a near-saturated bulk solution. By doing so,
nucleation will be confined to a small volume of the solution and the number of crystallites
which form will thus be severely limited. With the bulk of the solution near or just at
saturation, the crystals nucleated can then be grown in a controlled manner by changing the
solution temperature and hence the bulk supersaturation.
1. Preliminary Controlled Nucleation Experiments
The solubility diagrams of both lysozyme[ 10] and canavalin[ 141 show a
temperature dependence of the solubility. Based on this knowledge, preliminary controlled
nucleation experiments using lysozyme have been conducted. These initial experiments used a
small, temperature controlled spot to induce nucleation at a fixed position and to limit the
number of nuclei produced. These experiments used lysozyme (20mg/ml, pH 4.0, 0.1M
sodium acetate, and 4% sodium chloride). This solution will spontaneously nucleate in 4-5
days at room temperature. By using a cold spot temperature of 9°C, nucleation was
accomplished in 5 hours. The number of nuclei was less when compared to the isothermal
solutions, but they were not localized to the extent anticipated (Fig. 10).

2. Apparatus for Controlled Nucl¢ation
The results of the preliminary localized nucleation experiments has led to the
design and construction of the flu'st prototype space flight hardware. This design incorporates a
more sophisticated localized temperature gradient control as well as a means of controlling the
ambient temperature around the growth cell as an aid to localizing the nucleation as well as a
means of controlling subsequent growth. The apparatus (called the Thermonucleator) also has
provisions for in situ microscopy, the inclusion of schlieren optics, and the optical detection of
the onset of nucleation (Fig. 11). The actual apparatus is shown in Fig. 12.
The thermal environment in the cell was probed using a thermocouple mounted on a x-z
positioner. With this device, temperatures could be measured across the cell at various heights
above the bottom. A set of profiles taken with the temperature surrounding the cell set at 25°C
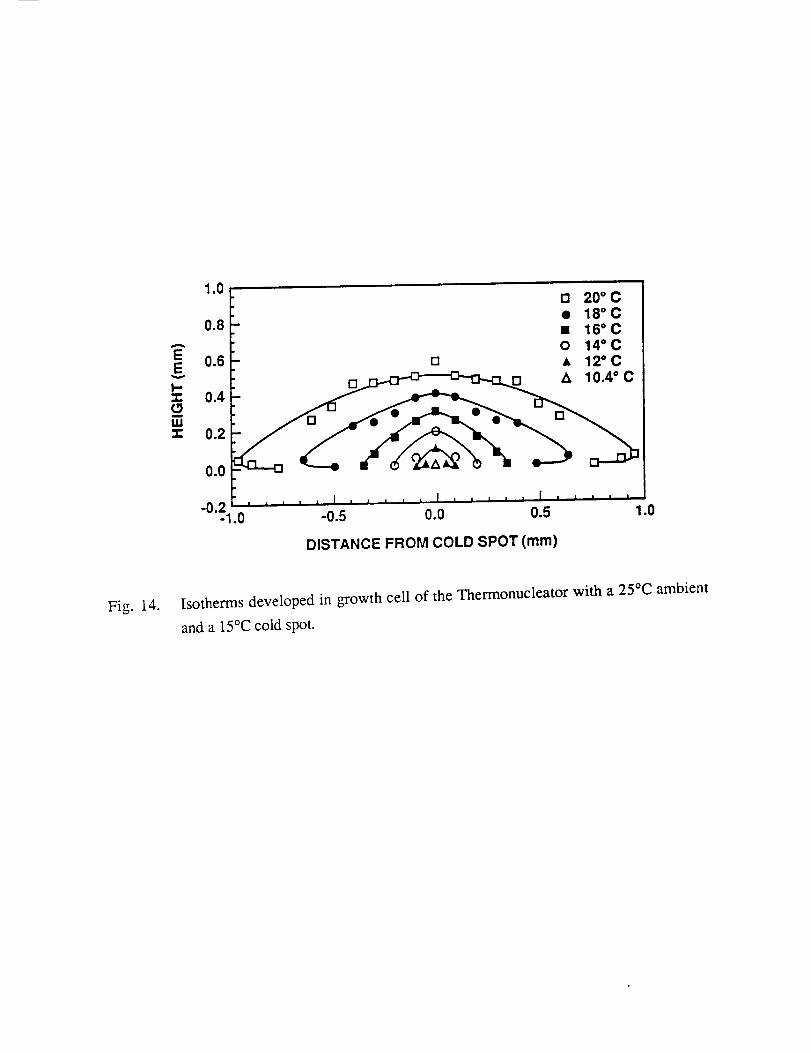
and the cold spot set at 15°C is shown in Fig. 13. The resulting isotherms are plotted in
Fig. 14. Two features should be noted in these figures (13 & 14). The bottom is warmer than
the adjacent layer at 0.04mm at distances greater than 0.4cm from the cold spot. This is due to
thermal convection in the volume above the cold spot and stagnation in these warmer regions.
Second, the cold spot temperature is lower than the set temperature due to the position and type
of thermocouple chosen for the control thermocouple. This will be changed in the near future.
The measured vertical temperature gradient above the cold spot is about 200°C/cm.
3. Qrowth of Materials with Normal Solubility
The procedure for nucleating a desired crystal is generally as follows: 1) The
bulk solution is set at a near saturation (Fig. 15a). Under these stable conditions, critical size
nuclei should not form. 2) Ts is adjusted so that the supersaturation is large enough to cause
nucleation on the exposed surface of the cold probe (Fig.15b). The amount of undercooling
should be such that the surface of the copper is at a temperature just inside the labile region
described in Fig. 8. If the phase equilibria data (solubility) is not known, it is a rather simple
matter to empirically find the appropriate temperature to cause nucleation to take place on the
cold finger. 3) After solid forms on the tip, Ts (and sometimes Te) is raised to try and
dissolve all but a few of the crystallltes which may form initially. In practice, this is difficult to
achieve because it is hard to see very small crystallites in the growth cell. Laser light scattering
techniques, when developed and incorporated into the system, should provide more control of
this process. 4) After dissolving back the initial crystalIites, Ts is decreased to that of the
bulk solution. 5) The temperature of both the bulk solution and the tip are slowly lowered to
cause growth to take place on the existing seed or seeds (Fig. 15c).
In this study, we report on preliminary results using the thermonucleator to control the
nucleation and growth of ice, Rochelle salt, and lysozyme.
10

TheRochellesaltsolutionwaspreparedby themethodof Holden andMorrison.[15]
The saltwasdissolvedin hotdeionizedwater(1.3gm/gmof water)andthencooledto 24°C so
that theexcesssolutewouldprecipitate,leaving ajust saturatedsolutionat that temperature.
Using a hypodermicsyringefitted with a 0.22_ filler, 1-2ml of the saturatedsolutionwas
transferredto thegrowthceil.
For the lysozymegrowth experiments,74 mg of commercialmaterial (Sigma) was
dissolvedin a 2ml of buffer solution(0.1M sodiumacetateat pH4.0) to give aconcentration
of 37 mg/ml. To this solution, 2% NaCI (20mg/ml) wasadded. The solution was thentransferredto thegrowthcell asdescribedabove. Thesolubility datausedto adjustTsandTe
was from Pusey.[10]
A Gyyr Time lapsevideo systemwasusedto monitor andrecordthegrowth process
andfor extractingdataongrowthrates.
Ice-Water System
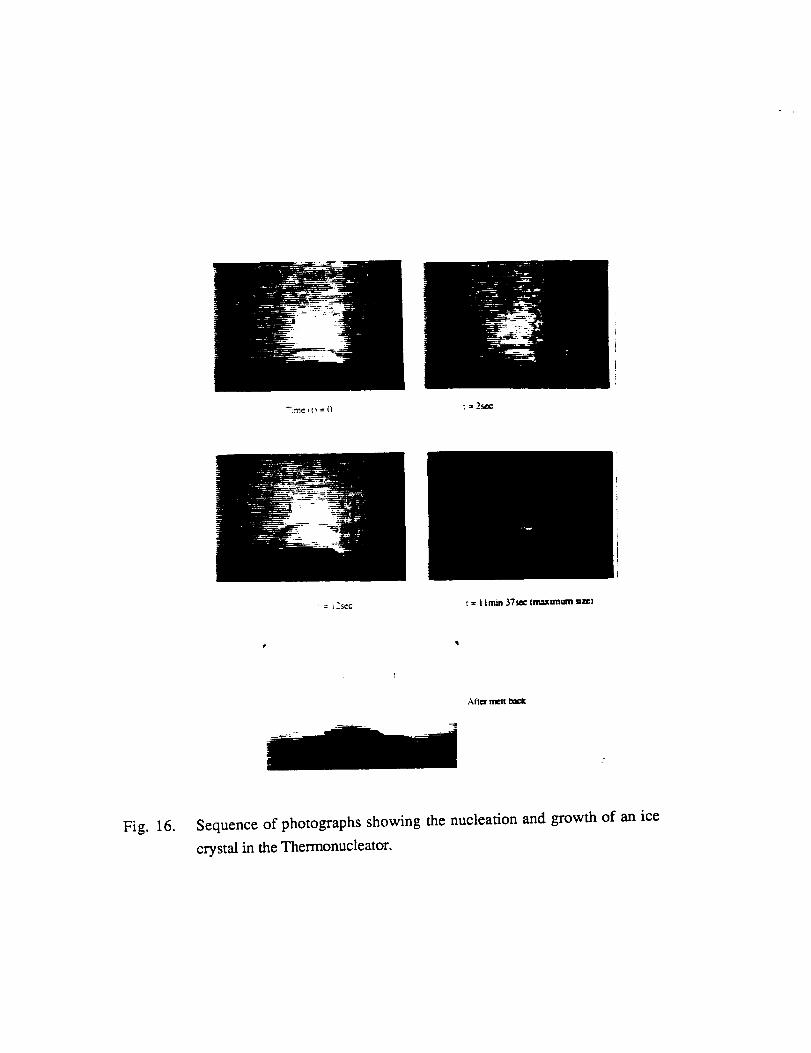
In the ice crystallization experiments, the ambient temperature was set at 30°C and Ts at
the nominal freezing point of water, 0°C. Figure 16 is a sequence of photographs showing the
growth of an ice crystal directly on the cold finger surface as a function of time. Note that the
shape of the crystal mimics the shape of the isotherms shown in Fig. 14. Unlike the growth of
Rochelle salt and lysozyme, the ice crystallization experiments are an example of melt growth.
The liquid-solid growth interface of course represents the freezing point isotherm. The last
frame in Fig. 16 shows that the process is reversible.
R0t;h¢ll¢ Salt
While the ice-water system was used to study the temperature profiles and temperature
control aspect of the thermonucleator apparatus, Rochelle salt was used as a model material to
study the nucleation and growth characteristics in a typical aqueous solution growth situation.
Figure 17 shows a sequence of photographs taken from a time lapse video monitor. The
solution initially saturated at 24°C was kept at 24°C in the enclosure, while Ts was lowered to
16°C. The first frame shows a small single crystal growing directly on the copper and
subsequent frames show the crystal growing. Between frames 2 & 3, and 3 & 4 Te was
manually lowered by 2°C each, causing the crystal to grow larger, with Ts allowed to reach Te
prior to cooling. A secondary crystallite can be seen growing to the right of the original
crystal. It is not clear whether this crystal was present initially or nucleated at a later time but
the former possibility is more likely. By programming the temperature at a slow, uniform rate,
the size and quality of the crystal should be improved significantly.
11

Lysozyme
Lysozyme was used as a model system representative of the growth of biological
macromolecules. The sequence of photographs shown in Fig. 18 represent the fh'st attempt to
nucleate a protein on the cold finger. Initially, T e was set at 25oC and Ts at 15°C. Within
approximately 4.5 hours, the first crystal of lysozyme could be observed. Three crystallites
can clearly be seen, even in the first photograph. After about 8 hours, Ts was allowed to equal
Te and Te was kept constant for another 15 hours. During this period, several additional
crystallites developed which can clearly be seen in the frame shot at 8:12 a.m. At this point, Te
was lowered in 2°C steps twice during a 26 hours period. One can see that under the cooling
rate regime used, a cluster of crystals developed. However, the cluster lies exactly on the
surface of copper cold finger.
In the latest lysozyme crystallization, the same crystallizing solution was used. The
bulk temperature (Te) was set at 22°C and the cold finger temperature (Ts) at 12°C. After
6.5 hrs, crystals appeared on the cold finger (Fig. 19) and Te and Ts were adjusted to 20°C.
Observation after an additional growth period of 15.5 hrs showed that there was a
polycrystalline mass on the cold finger. The temperatures were raised (Ts to 28oc and Te to
26°C) to dissolve all but a few of the crystals. When only a few crystals remained (after
7.5 hrs), the temperatures were lowered to continue the growth (Te=21°C, Ts=20°C). The
temperatures were lowered 2°C increments over the next few days as growth continued. The
final temperatures were Te =18°C and Ts =16°C. During this growth sequence (Fig. 19), one
large (270_t) crystal and several smaller crystals were formed on the cold finger. The change in
crystal size with time is plotted in Fig. 20. In spite of the cooling, the growth rate decreased,
as shown in Fig. 21.
4. Nucleation of Materials with Retrograde Solubility
In the case of materials exhibiting retrograde solubility, the nucleating probe
would have to be kept warmer than the surrounding solution and therefore significant thermal
convection would be expected. To determine whether strong convection would a) prevent
nucleation, b) cause nuclei to form away from the probe, c) cause the nuclei which form on the
probe to move away from the probe tip and/or d) effect nucleation density, two proteins which
have retrograde solubility were studied: 1) horse serum albumin (HSA) (MW -- 60,000), and
2) bovine pancreas o_--chymotrypsinogen A (aCA) (MW .---26,000). In addition, these two
proteins have another characteristic in common, while they are known to have retrograde
solubility,[16,10] their actual solubility-temperature relationships in solution are not well
characterized. The latter provided an excellent opportunity to study the ability of the
12

Thermonucleator to produce, within a short period of time, controlled crystallization in the
absence of phase equillibria information.
The general approach used to nucleate these proteins without the benefit of knowing
their solubility behavior was to prepare a near saturated to slightly supersaturated solution
based on the known crystallization procedures[17,18] and to slowly raise the probe temperature
until nucleation occurred. The ambient temperature was also increased to raise the saturation of
the bulk of the solution.
The horse serum albumin (HSA) solution used for our nucleation study was based on
the vapor equilibration crystallization outlined by McPherson. [17] In this work, the HSA
solution (10mg/ml) was equilibrated against 45% saturated ammonium sulfate (0.31grn/ml)
solution at room temperature. The HSA solution consisted of 10mg/ml HSA dissolved in
water with 0.28mg/ml of ammonium sulfate added to produce a small amount of
supersaturation.
The o_-chymotrypsinogen A (aCA) solution was the same as that used in the study by
Matthews.[ 18] The retrograde solubility was tested by comparing two solutions: one at 4°C
and the other at room temperature. The room temperature solution crystallized, but the 4°C
solution did not. The aCA solution was made up by dissolving 16mg/ml of aCA in a buffer
solution. The buffer solution contained 4% (v/v) ethanol and was 0.142M in dibasic
potassium phosphate and 0.129M in citric acid. The precipitant was 60% by volume of a
saturated ammonium sulfate solution.
The selected "retrograde" proteins (HSA and aCA) were successfully nucleated using
the Thermonucleation technique (Figs. 22 & 23). The horse serum albumin crystals were
nucleated on the probe at a temperature of 29°C, with the ambient temperature set at 16°C. The
HSA crystal in Fig. 22 was approximately 201z at the widest point and was the largest crystal
of this material observed in this series of experiments. The tx-chymotrypsinogen A crystals
were nucleated at a probe temperature of 20°C with the ambient temperature set at 9°C. Figure
23a shows three aCA crystals at an early stage of growth (the largest crystal is about 271x along
the base line). After a week of growth (Fig. 23b), the largest crystal is approximately 52_t.
The actual nucleation and growth conditions for these crystals were not optimized, but
represented a best estimate of the conditions based on the other growth techniques.[ 17,18]
These results clearly demonstrated that the Thermonucleation technique can be applied to
proteins whose solubility decreases with increasing temperature and to systems whose
solubility behavior is known only in a general way (i.e., more crystals are formed if the
temperature is lowered {raised }).
It has been suggested that the Thermonucleation technique could only be applied to
solutions that were "sufficiently viscous to suppress convection to the extent necessary to
13

prevent.nucleationin undesiredsites.''[19] The tendencyof a solution to convectdue to a
temperaturedifferenceisgivenbythethermalRayleighnumber(Ra)
Ra= g Cp 9 2 _ L 3 A T
_k1)
where g is the acceleration due to gravity, cp the specific heat, p the density, 13 the thermal
expansion coefficient, L the length (2cm), AT the temperature difference (13°C), I.t the
viscosity and k the thermal conductivity. Using equation 1 and the values for the material
properties at 20°C,[ 20] Ra was calculated to be 1.45 x 10⁶, which is well in excess of the
critical Rayleigh number for the occurrence of natural fluid convection in these water solutions
(-_ 300 [21]). Strong flows were indeed observed by the movement of small particles in the
growth cell. However, the results of the nucleation experiments indicated that crystals can be
nucleated even in the presence of these flows.
5. Summary_
An apparatus has for the first time been designed and built to control
supersaturation in a localized region of a bulk solution, thereby permitting a separation of the
nucleation and growth processes. The effectiveness of this "thermonucleating" device has been
demonstrated with the nucleation and growth of materials with normal solubility such as ice,
Rochelle salt, and lysozyme and also of materials with retrograde solubility such as horse
serum albumin and o_ chymotrypsinogen A. The method relies on the species to be grown
having a temperature dependent solubility which may or may not be well known, but an
alternative procedure could be devised to create the localized supersaturation by controlling
composition in a small region of the solution. A more precise means of detecting nucleation
must be developed to work in conjunction with localized supersaturation control.
6. New ADoaratus
The current apparatus has been a useful tool for the development of the
thermonucleation technique and will continue to be used to develop nucleation detection
techniques. However, the size of the apparatus and its reliance on liquid nitrogen as a cooling
source is not compatible with the use of the thermonucleator in _g. A new apparatus has been
designed that uses thermoelectric elements for heating and cooling. Figure 24 shows the new
apparatus which has dimensions of 4 x 3 x 3 inches and is designed to be plugged into a rack
which would provide electrical connections, coolant and lighting for observation. Figure 25
shows the internal construction with the ambient temperature control elements sandwiched
between the coolant plates and the plates which form the top and bottom of the temperature
14

controlled annulus. Control of the nucleation probe is provided by a similar sandwich
assembly using one large thermoelectric element. The new Thermonucleator is currently
under construction.
D. GROWTH OF LYSOZYME BY TEMPERATURE GRADIENT (_T)
If a crystallizing material has a solubility which is dependent on temperature, then
crystals can be grown by the transport of the material due to a temperature gradient. If Raoult's
law is applied to solutions, the ratio of the solubilities (s/s') at any two temperatures (T, T') is
given by
In (s/s') = AI-If ,1R tT'-T L) 2)
where AHf is the heat of fusion of the solute and R the gas constant.[ 22] In the temperature
gradient growth technique, the two solubilities occur in the same closed system which, in the
absence of any convection, causes the diffusion of the soluble material from the high solubility
region to the low solubility region due to the difference in chemical potential. This process is
summarized for the normal solubility case in Fig. 26 which illustrates the use of a solubility
curve and a temperature gradient to predict the movement of material from a source (at x+Ax,
T +AT and solubility c +Ac) to a growing crystal (at x, T and solubility c). This technique is
also applicable to systems with retrograde solubility, but the mass transport will be from Tcold
to Thot. The design of a crystallizer based on the temperature gradient technique and its
application to the growth of the protein lysozyme will be discussed.
Lysozyme below 30°C exhibits a normal solubility vs. temperature behavior[ 12] and
was chosen to test the feasibility of growing protein crystals by the temperature gradient
method. The cell designed for this experiment is shown in Fig. 27. It consists of two
microscope slides separated by a 0.0625 in spacer. The end temperatures were maintained by
circulating water from temperature controlled baths through the ends. A uniform gradient was
assured by the copper plate under the cell. The temperature gradient used and the resulting
solubility profile are shown in Fig. 28. Figure 29 is the size of the crystal vs. time. The initial
growth rate was 0.561Mhr which was about 10% higher than was predicted by Pusey and
Naumann's data[41 when the high and low temperature solubilities were used to calculate the
supersaturation. The growth rate drops to less than half the initial value (0.241a/hr) when the
crystal reaches about 1050_ in size. The reason for this behavior is unclear and it maybe
related to the "terminal size effect".
15

Figure 30 showstheresultantcrystal photographedin transmittedlight with crossed
polarizers. Theinitial seedcrystalappearsa light rectanglewithin the crystal. Thepictures
showboththeextensivesecondarynucleationwhichtookplaceandthesurfacestructm'ewhich
developedon thegrowingcrystal.
Onepossibleexplanationfor the secondarynucleationseenin Fig. 30wasthat small
particlesof lysozymeweredrifting downfrom thesourcematerialandgrowing in thecooledregions. In order to preventthis, the cell wasmodified with baffles as shownin Fig. 31,
which also shows the positions of the growing crystals. The temperaturegradientand
solubility profile of this cell wasslightly different (Fig. 32). Thegrowth behaviorof two of
thecrystalsis plottedin Fig. 33. Theyexhibit differentgrowthrates(0.351afarand0.271Hhr)
andbothof theserate arebelowthat which wouldbepredicted(0.441Hhr).Oneexplanationfor this is thatin thefirst casethecrystalwasgrowingunderthecontrol of interfacekineticsandin thesecondcasethereis mixedinterfaceanddiffusioncontrol.
Figure 34 showstwo of the crystal grown in the baffled cell. It is obviousthat the
baffleshavenot solvedtheproblemof secondarynucleation.
Brice[23]hasdevelopeda generalequationfor the growthrate (f) in the temperature
gradientmethodwhich includesboththekineticandtransportprocesses
[VmD D AnVmJ R Te 23)
where 8c,n are the diffusion boundary layer thicknesses at the crystal and the nutrient
(0.005cm [4]), Ac,n the areas of the crystal and the nutrient, A the kinetic coefficient
(1.11xl0-9cm/sec [4]), _e the supersaturation at the growth interface (Ce/Cs-1) (Cs-"
14.3mg/ml [24]), AH the heat of solution, AT the temperature difference (9°), Vm the molar
volume of the solute, D the diffusion coefficient (lxl0 -6 cm2/sec [4]), R the gas constant and Te
the temperature at the growth interface (16°C). The area of the crystal after 500 hrs of growth
was 0.05cm 2 and the area of the nutrient was 0.2cm 2. The heat of solution calculated from
Raoult's law using the solubilities oflysozyme [24] at 16°C and 25°C was 23,307cal/mole. The
molar volume of lysozyme in solution calculated from the solution densities using equation 16,
chapter VI of Shoemaker and Garland[ 25] was 18,934cm 3. Using these values and the
measured growth rate, the equilibrium concentration (Ce) was calculated to be 37.0mg/ml.
The preliminary study on the suitability of the temperature gradient method to the
crystal growth of biological materials has demonstrated that this technique can be used for these
materials. The results of this investigation pointed out the importance of the path dimensions
16

on the rate limiting stepfor the growth process. Futurecells canbe designedto maintain
growthin thekineticallycontrolledregime.
As illustratedin Fig. 35, theanalysisof thegrowthin atemperaturegradientinvolvesa
largenumberof variables. Theparameterseffecfingthe solubility of theproteinsuchassalt
concentration,pH andbuffershavenot beenincludedin this list but will bestudiedwith the
otherparameters.While theThermonucleatorcancontrolthenucleationphaseof thegrowthprocess,the
sizeof thecrystal thatcanbegrownin theapparatusis limited by thevolumeof the solution,
theconcentrationof theproteinandtheefficiency of crystallizingthe protein from solution.
Thecombinationof theThermonucleatorwith thetemperaturegradienttechniquewould give
thepossibilityof growingmuchlargerproteincrystalsunderwell controlledconditions.Thiscombinedtechniquecanbeappliedbothat 1-gandin amicrogravityenvironment.
E. GRAPHOEPITAXY
The widely used hanging (or sitting) drop vapor diffusion technique[ 26] for protein
crystal growth is not completely satisfactory. The growth of any crystal from solution
without seeding requires that a critical nucleus be formed which, in turn, requires that the
critical supersaturation be exceeded.[271 This critical supersaturation is in excess of that which
is necessary for well-controlled growth and it leads to two effects: multiple nucleation of many
small crystals and/or rapid growth leading to poor quality crystals. In addition, gravity
usually causes the crystals to settle in the drop, resulting in clusters of misoriented crystals
which are unsuitable for structure determinations.
A preliminary study on the use of graphoepitaxy (artificial epitaxy) to grow oriented
crystals of the proteins catalase, lysozyme and canavalin has been completed. Graphoepitaxy
employs a substrate patterned on a micron scale to induce an orientation to the growing
crystals. While the basic technique has been used for the growth of inorganic crystals
consisting of small molecules,[ 28] this study is the first successful application of artificial
epitaxy to the growth of protein crystals. The closest previous work is that of McPherson and
Shlichta[29, 30] in which protein crystals were grown on minerals.
The substrates for the growth of the protein crystals in this study were single-crystal
(100) -, (111) - or (211) - silicon (Si) wafers. A striated microrelief (51.tm+ 51.tin period,
1-2_tm depth grooves) was prepared on these substrates by anisotropic etching so that the
grooves were bounded by closely-packed (111) - faces typical of diamond-like crystals. The
striations had defined crystallographic directions: <110> and <100> on the (100) - substrates,
<110> and <211> on the (111) - substrates, and <110> on the (211) - substrates. In addition,
a regular two-dimensional array of hexagonal holes about 61.tin across and ll.tm in depth and
17

15_mcenter-to-centerdistanceswerecreatedon the(111)- substrates.After themicrorelief
wasmade,someof the substrateswere thermally oxidized sothat they were coatedby anamorphousSiO2layer 0.3 - 0.4_tmin thickness. In a givenexperiment,both oxidized andnon-oxidizedsubstrateswereused.
All crystallizationswere carriedout at roomtemperatureby variationsof thevapor
diffusion method.[26] In the caseof catalaseandlysozyme,crystalsweregrown in a Petri-
dish-basedapparatuscommonlyusedfor proteincrystallization.[26] Substrateswereplacedon
apedestalanda peripheralwell wasfilled by aprecipitantsolution. In thecaseof canavalin,
crystalswere grown in aplastic box (Crystal Plate)producedby Flow Laboratoriesfor thecrystallizationof proteins. Thecrystallizingsolutionfor catalasewas preparedfrom catalase
penicillum microfungusoctale,mol. weight300,000(300kDa). A fine-crystallinecatalase
suspensionpreparedaccordingto ref.[31] was centrifuged for 40 minutes at velocity 8,000 rpm
and the precipitate was dissolved in 0.05M sodium acetate buffer solution, pH 5.2, containing
0.5M ammonium sulfate. The solution containing 10 to 20mg/ml of the catalase was
centrifuged just before crystallization and 5 to 10t.tl droplets of the solution were pipetted onto
the substrates. The precipitant solution was usually 1.4M ammonium sulfate. In some
experiments, an initial precipitant solution contained only 0.8M ammonium sulfate and the
concentration was gradually increased up to 1.4M by introducing the sulfate via a hole in the
top cover of the crystallization chamber.
The crystallization solution for canavalin contained canavalin (30mg/ml) dissolved in a
pH 9.2 (ammonium hydroxide) solution with 1% sodium chloride (NaCI) added. In some
experiments, detergents such as n-octy113-D-glucopyranoside ([3-octylglucoside, 13-OG) and
sodium dodecyl sulfate (SDS) were used. Both were found to be effective in the sense that
more small crystallites were formed. As a counter-solution, an acetic acid (HAc) solution with
pH between 5 and 6 was used. It was found that, at pH = 4, crystallization was
uncontrollable, leading to precipitates, while at pH = 7 no crystallization occurred in a
reasonable length of time (1 week). Three configurations were used for crystallization:
standing droplet, hanging droplet (on a glass substrate without microrelief), and a droplet
"sandwiched" between the substrate and the cover glass plate. The sandwiched droplet was the
most effective for the crystallization of canavalin. This configuration also gave some insights
into the features inherent in crystallization of proteins by artificial epitaxy.
The crystallizing solution for lysozyme was made from a buffer solution containing
30mg/ml lysozyme, 0.1 M sodium acetate (pH 4) with an equal volume of a 8% NaC1 solution
added so that the final solution concentrations were 15 mg/ml lysozyme and 4% NaC1. As a
counter-solution, NaC1 solutions with concentrations of 8% or 14% were used. The 8%
18

solution did not give any results in a week's time, while with the 14% solution, the first
crystals appeared (as was observed at 100 x) in a day.
In situ-optical microscopy at magnifications from 50 x to 100 x was used to observe the
growing crystal. All crystals studied were transparent, which allowed the micro-relief to be
seen through them and thus it was possible to make conclusions on orientation effects.
The most valuable results were of a morphological nature and consisted of a
comparison of crystallite orientation (their principal elements such as edges, diagonals, etc.)
with respect to the microrelief.
As was noted above, the catalase crystals were grown in droplets. In this case, wetting
of the substrate by the solution was moderate so that the contact angles of the droplets had
some value between 60 ° and 90°C. Accordingly, the density of the crystal deposition on the
substrate was different for different areas under a given droplet, being higher at periphery,
where supersaturation (as a result of evaporation of the solvent) is larger, and lower in the
central part of the droplet. In both regions, the majority of crystals grew with their edges
parallel to the substrate striations (Fig. 36). In addition to the edge-parallel-to-striations
orientation, sometimes the diagonals of the crystals were parallel to the striations (Fig. 37).
Once deposited, the catalase crystals remained immobile and continued to grow preferentially in
width, but also in height and in depth.
Important information about growth of catalase crystals on substrates with micro-relief
is obtained by the investigation of the morphology of the face of the crystals resting on the
substrate (backside morphology). Figure 38 shows the backside morphology of a crystal
which was fu'st mechanically detached from the substrate and then overturned. The rib-type
structure of the backside indicates that the crystal had grown into the micro-relief after it was
attached to the substrate. A similar behavior was also observed for canavalin crystals (see
below).
One of the results obtained in this study was on the effect of reliefs of different
symmetry and/or different profiles on the orientation of the crystals. The ratio of the number of
oriented-to-nonoriented crystals in a given droplet in a given area, can serve as a quantitative
measure of this effect. Based on such a measurement, the best orientation of catalase crystals
was achieved, first, with striated micro-reliefs as opposed to the hexagonal-type holes, and,
secondly, with the striated reliefs on <100> - striped (100) - substrates and on (211) -
substrates (<110> stripes), as opposed to other directions of striations. For example, with
<110>/(100) substrates, about 80% of crystals had their edges parallel to the striations. The
advantage of the striated relief was evidently connected with the principle morphology of
catalase crystals, namely with the existence of rather distinctive edges (the crystals are bounded
19

asarule by simplerhombohedralfaceswith only twoof six facesbeingvisible, while theother
four facesform very narrowstripes).
In respectto theorientationrelationships,it must benotedthat althoughhexagonal-
shapedpits werenot effective for orientedcrystallization,sometimescatalasecrystalswere
orientedwith theiredgesparalleltorowsof thehexagonalpits.Theorientationmechanism(s)will bediscussedin moredetailbelowin relationto the
dataoncanavalinandlysozymecrystals.
Canavalincrystalswerealsoorientedon substrateswith micro-reliefandagainstriated
relief wasmosteffective. This is to beexpectedsincecanavalincrystalshavearhombohedralshapewith rathersharpedges(seeFig. 36)[3] underthe growthconditionsemployedin this
study.
Figure39demonstratestheeffectof themicro-reliefwhichorientsmany (althoughnot
all) of thecrystals.
As wasnotedabove,thecrystalswereobtainedin a"sandwich"systemwheresolution
canmove. At leastthreeeventsareinherentin suchasystem:a)crystalsformedcanchange
their orientation and position during relatively short time intervals, b) the crystalscan be
overturned,c) the crystals are often removedfrom the substrateto surroundingareasofsolution.
Theflu'sttypeof eventinvolvedbothmovementfrom nonoriented-to-orientedandfrom
oriented-to-nonorientedpositions(sometimesalsofromonenonorientedto anothernonoriented
one). Thechangesweremostremarkablefor relativelysmallcrystals,especiallyfor relatively
thinones.On theotherhand,thesmallest(of thevisible) crystalliteswhichfill a singlegroove
wereasarule in orientedpositionseventhoughtheysometimesmoved. This indicatedthatit
mightbepossibleto ensurebetterorientationby initially growingmoresmallcrystals. To testthis,detergentssuchas[3-OGandSDSwereaddedto thecrystallizationsolutionsand,in fact,
werefoundto beeffective. Thecrystalsformedwerein generalsmallerin size.
Anotherfeatureobservedin thesandwichversionwastheoverturningof crystals. Theperiodof thestriationson thebacksideof overturnedcrystalswasexactlyequalto theperiod
(grooveplus hill) of the micro-relief. This conf'u'medthat the backsidemorphologywasa
result of the crystalgrowing into the substrateduring thefirst stageof their formation. The
overturnedcrystalshadstriationsparallelto boththeir edgesandtheirdiagonal,aswell asnon-
parallelto anydistinctivedirection.Thefirst twocases(paraUelto edgesandto diagonal)onceagainiUustratestheeffectof thereliefin orientingthecrystaUites.
Only somepreliminaryresultsonartificial epitaxywereobtainedwith lysozyme.As is
seenin Fig. 40, thesecrystalliteshavesomeof their edgesparallelto thesubstratestriationsasademonstratingdepositionorientation.
20

It is possibleto distinguishat leastfive differentorientationmechanismsoperativein
artificial epitaxy. These mechanisms, which can operate both separately and
simultaneously[28,32] include: a) orientation by means of topographic micro-relief
("macroscopicKossel-Strankeimechanism"),b) orientationunderactionof capillaryforces,c)
orientationby periodicthermalrelief (indirectionalsolidificationof amelt), d) orientationby
symmetricanisotropicdeformation(mainlyfor solid-statecrystallization),ande)orientationby
cooperativerotationsof crystals.
In the case of protein crystallization from solution, mechanisms (a), (b) and (e) could
be operative. However, under conditions typical for these experiments, mechanism (e) which
operates mainly at the stage of coalescence of crystals should be excluded. Mechanisms (a)
and (b) remain and our results, as described above, indicate that both of these mechanisms are
active.
In the figures presented, the oriented crystals are confined by the stripes, which
supports the topographic mechanism. At the same time, there are many indications (especially
with canavalin) that capillary forces are active in the orientation of the crystals. Among these
are the phenomena of the "mooring" of relatively small crystals with larger ones and the
orientation of the smallest (visible) crystals with the relief. The latter fact is worth a more
detailed discussion. It is difficult to imagine that all these small crystals have a width exactly
equal to the width of the relief grooves. Most probably, the crystals have a width smaller than
that of the grooves and they take a symmetric position in respect to the grooves' wall due to the
capillary mechanism. [331 Thus, based on the experimental results, a combined orientation
mechanism including both topographic and capillary effects is operative in this case.
The action of detergents has an effect on these processes. When the protein solution
with the detergent was placed on a substrate as a droplet, far better wetting (in comparison with
a "normal" solution without detergent) was observed. This "macroscopic" effect is evidently
related to molecular interactions in the solution facilitating, first, the formation of a large
number of small crystallites and, second, the mobility of the crystallites in the solution. The
mechanisms of the effect remain unclear.
The issue of initial stages of protein crystallization is of principal importance. In
general, the specifics of protein crystallization in comparison with the classic ("small-
molecule") crystal growth was discussed by Feigelson.[ 34] It is clear that in view of the role
of the medium (in particular of water molecules) in formation of protein crystals, nucleation
here is a far more complicated process than that for usual (small-molecule) materials.
Nevertheless, for proteins, similarly to small-molecule materials, it is possible to distinguish
between homogeneous and heterogeneous nucleation. In particular in our experiments, we
were able to note a role of foreign particles in nucleation (at least for lysozyme). We compared
21

three cases: when the crystallization solution was filtered (0.5 Ixm filter), when it was
centrifuged, and when no special pretreatment was done. At some relatively small
supersaturations in the centrifuged and untreated solutions, the first observable crystals
appeared in a day (100 x optical microscope) and there were a large number of crystals which
were nonoriented. Under the same conditions, in the filtered solution, the f'n'st crystals
appeared in a week. Growth was rather sluggish and many of the crystals were oriented in
respect of the micro-relief. In general, it was noted that the relief was rather active in causing
crystallization. In a droplet covered area, with and without relief, nucleation under the same
conditions occurred far more readily on the relief. This means that the "artificial lattice"
inherent in artificial epitaxy (graphoepitaxy) serves as a heterogeneous catalyst for nucleation.
In this respect, some comments should be made on the results of McPherson and coworkers
concerning the heteroepitaxial growth of proteins on single-crystalline (mineral)
substrates.[29, 30] The authors reported the oriented growth of lysozyme on apophyllite,
noting the relationship of lattice parameters of the two materials as it is considered in classic
heteroepitaxy. An alternative explanation of their results can be found in the principles of
artificial epitaxy. Macroscopic (more than one-monolayer-height), oriented steps can be
present on cleaved or natural faces of crystals such as the minerals used in McPherson's
experiments. These steps can, in principle, orient depositing crystals, especially if the crystals
are relatively large as in the case of protein crystallization.
Finally, it should be noted that our experiments on oxidized and non-oxidized Si
substrates have shown no difference in results, indicating that no orienting effects from single-
crystalline substrates ("classic heteroepitaxy") take place.
Summary
The results of these preliminary studies show that in the case of catalase, lysozyme and
canavalin graphoepitaxy does cause orientation of the growing crystals. In most cases, the
orientation is such that an edge of the growing crystal is parallel to the relief. In a few
instances, the orientation is along the face diagonal of the growing crystal. The amount of
misorientation between individual macroscopically oriented crystals is not known, but it is
probably small. A cluster of such macroscopically oriented crystals which had grown
together could yield preliminary structural data.
The orientation of the growing crystals is the result of two mechanisms. The f'u'st
mechanism is a morphological one in which the edge of the crystal attaches the wall of edge of
the relief. Smaller crystals are oriented within the relief by capillary forces. Both mechanisms
may be active during growth.
22

There is evidence to suggest that the patterned substrates induce nucleation at lower
supersaturation than would be necessary without the substrate. This is advantageous because,
as was previously mentioned, it limits the number of nuclei and provides a slower growth rate
which can lead to better crystals. In some cases (Fig. 39), large (100 to 200 It) crystals grow
in isolation. These crystals can be used as seeds in one of two ways. If the space around the
crystal is large enough, more nutrient solution can be added and the crystal grown out to a size
suitable for diffraction studies. If there is not enough space to allow additional growth, the
substrate can be cleaned of extraneous crystals and the seed grown to the desired size. The
presence of the substrate facilitates the handling of the seed crystals.
23
11.
12.
13.
114.
15.
III. REFERENCES
1. Final Report, "Protein Crystal Growth in Low Gravity," NASA Grant NAG 8-489.
2. S. Durbin, Proc. of Third Int'l Conf, on the Crystallization of Biological
M_igromolecules, 13-19 August, 1989, Washington, D.C.
3. R. DeMattei and R. Feigelson, J. Crystal Growth 76, 333 (1989).
4. M. Pusey and R. Naumann, J. Crystal Growth 76, 593 (1986).
5. A.A. Chemov, Modern _rystallography III, Springer-Verlag, Berlin, 1984.
6. R.-F. Xiao, J. I. D. Alexander and F. Rosenberger, private communication.
7. L. Sibille and J. K. Baird, J. Crystal Growth 110.72 (1991).
8. L. Sibille, J. C. Clunie and J. K. Baird, J. Crystal Growth 110. 80 (1991).
9. D.P. Shoemaker and C. W. Garland, Experiments in Physical Chemistry, McGraw-Hill, NY 1962.
10. E. Cacioppo, S. Munson, and M. L. Pusey, J. Crystal GrowthllO, 66 (1991); and E.Cacioppo and M. L. Pusey, in submission to J. Crystal Growth..
L. J. Wilson, T. L. Bray and F. L. Suddath, J. Crystal Growth 110. 142 (1991).
M. Pusey, W. K. Withdrew and R. Naumann, J. Crystal Growth 90. 105 (1988).
H. E. Buckley, Crystal Growth, John Wiley & Sons, NY 1951.
R. C. DeMattei and R. S. Feigelson, J. Crystal Growth 110, 34-40 (1991).
A. Holden and P. Morrison, Crystal and Crystal Growing, The MIT Press,
Cambridge, MA, 02142 (1982).
16. E. Cacioppo, private communication.
17. A. McPherson, Preparation and Analysis of Protein Crystals. (John Wiley & Sons,NY, 1982) ch. 4, p 128.
18. B.W. Matthews, J. Mol. Biol. 33.499 (1968).
19 NASA Tech Briefs 15(9), 106 (1991).
20. B. Gebhart, Y. Jaluria, R. L. Mahajan, and B. Sammakia, Buoyancy Induced Flowsand Transport. (Hemisphere Publishing Corp., NY, 1988) Appendix F, p 946.
21. G. Homsy. private communication.
22. F.T. Wall, Chemical Thermodynamics. (W. H. Freeman & Co., San Francisco, CA,
1958) ch.15, p. 322
24

23. J.C. Brice, The GrQwth of Crystals from Liquids. (North-Holland, Amsterdam, 1973)ch. 9, p. 297.
24. E. Cacioppo and M. L. Pusey, J. Crystal Growth 114, 286 (1991).
25. D.P. Shoemaker and C. W. Garland, Experirrl_n_ in Physical Chemistry_. (McGraw-
Hill, NY, 1962) ch. VI, p 129.
26. A. McPherson, Preparation and Analysis of Protein Crystals, Wiley (1982).
27. H.A. Meirs and F. Issac, Proc. Roy. Soc. A79, 322, London (1907).
28. I. Givargizov, Oriented Cry_stallization on Amorphous Substrates. Plenum Press, NY(1990).
29. A. McPherson and P. Shlichta, J. Crystal Growth 85,206 (1987).
30. A. McPherson and P. Shlichta, J. Crystal Growth 90, 44 (1988).
31 M.F. Gulyi, L. V. Gudkova, R. G. Deghtyar, N. I. Mironenko, and N. V. Latyshko,Doklady of USSR Acad. Sci. 225, 211 (in Russian) (1975).
32. E.I. Givargizov and A. B. Limanov, Microelectronic Eng. 8,273 (1988).
33. V.I. Klykov and N. N. Sheftal, 52, 687 (1987).
34. R.S. Feigelson, J. Crystal Growth 90, I (1988).
25

o
.
.
.
PUBLISHED PAPERS
R. C. DeMattei and R. S. Feigelson, "The Solubility Dependence of Canavalin on pI-I
and Temperature," J. Crystal Growth 110, 34 (1991).
E. I. Givargizov, M. O. Kliya, V. R. Melik-Adamyan, A. I. Grebenko, R. C.DeMattei and R. S. Feigelson, "Artificial Epitaxy (Graphoepitaxy) of Proteins,"J.Crystal Growth 112, 758 (1991).
R. C. DeMattei and R. S. Feigelson, "Controlling Nucleation in Protein Solutions,"J.
Crystal Growth 122, 21 (1992).
Robert C. DeMattei, Robert S. Feigelson and Patricia C. Weber, "Factors Affecting the
Morphology of Isocitrate Lyase Crystals," J. Crystal Growth 122, 152 (1992).
R. C. DeMattei and R. S. Feigelson, "Thermal Methods in Protein Crystallization,"PrQ¢, 10Ih Int'l. Conf. on Crystal Growth, San Diego, CA, August, 1992.
26

V. FIGURES
Fig. 1. Isocitrate lyase crystal (ICL) grown from 30gl hanging drop (ICL concentration
lOmg/ml).
27

_ !_iii!iiil]ii:ii:iiziii!iiii!i
ii_iii!4iiii!ii!ililiiii!iiiiiii!iiii:ii
Fig. 2. Time lapse of ICL crystal grown from 41.tl hanging drop (ICL concentration
12mg/ml).

.... :!:i:
Fig. 3. ICL crystals grown in lmm x 3mm cell
(41.tl of 12mg/ml).

Fig. 4. ICL crystalsgrownin 1.88mmcapillary(12mg/ml)showinga) flat termination
bya (001)typeface,andb) awedgedshapedterminationby (101)typeface.

m
0>
g
_3
I
c-
1.0
0.9
0.8
0.7
I
0> 0.6
1Vol Ratio 20gl, 1.88mm capVol Ratio 20gl drop
0.50 100 200 300 400 500 600 700 800
Time (hrs)
Fig. 5.Volume ratio vs. time comparing 201.tl drop with 20_tl in a 1.88mm capillary.
Simulates ICL crystallization.

o_m.m
OCO
(J
0
0
10
8
6
4
2
¢
0
0
---.e--- 20_1 Drop
s 20_!, 1.88mm cap.
, ' | .... I ....
50O IOO0 1500
Time (hrs)
Fig. 6. Supersaturation vs. time for lysozyme comparing 20_1 drop with 201_1 in
1.88mm capillary. 10 crystals are nucleated at c/s = 4 and allowed to grow.

Fig. 7. ICL crystalgrownfrom 301.tldrop(10mg/ml)in I.tg.

_=
i--
'_Solubility curve
• _ UNSATURATION_.C" _B" A
labile_bleIC s----..
Supersolubili__ s -'--"_
cur_e - l_ID
Fig. 8.
_5 NAN03, decreasing
Schematic diagram of solubility for a substance whose solubility increases
with temperature.

E
E
t-O
.D
e-.
¢J
o(J
32
/
/28
/
/!24
/
/2O
/
/16
/
/12
//
8"
20
16
12
0
A
E
E
¢::0
o_
e-
(Jf-0
Fig. 9. Solubility diagram for canavalin showing dependence on temperature and
pH.

:i:!i
Fig. 10.
,• •:• + <!.•. .... _ i ......... •i{ii.'i'• I_I-I-.•..::::•::I:}._:}.!_::!:!IIII•'ZI!ZI_!Ii! I
Comparison of spontaneously nucleated (top) and temperature nucleated
lysozyme crystals. Index spacing is lO01.t.

THERMONUCLEATOR
lemperature |
Controller _--_,
Cell Bottom Detail
Glue Fillet
%__rowth Cell
Crystal
Cell Heat Sink (alumln_
Heat Exchanger
Cooling Rod (copper}
Liquid Nitrogen
Water
Bath
Fig. 11. Schematic of Thermonucleator showing growth cell, cold spot, cold spot
temperature control and ambient temperature control by heat exchanger.

Fig. 12. Thermonucleatorapparatusshowing;Top: Growth cell andcell heatsink (above
baseplate),andheatexchangerandcold spotcontrol(belowbaseplate)[ 19.5in(h)15 in (w)]. Bottom:Close-upof growthcell, cell heatsink control thermocouple,
heatexchangerandcold spotheater.

30
;25 <<: 20
u.lu.I _ /_ 0 BO'I-I'_Oi OF CELL [
_ iV" 0 +0.04 mm IV • +0.5 mm I
100 1 2 3 4 5
DISTANCE FROM COLD SPOT (mm)
Fig. 13. Temperature gradients measured at various distances from the bottom of the growth
cell in the Thermonucleator with a 25°C ambient and a 15°C cold spot.
1.0
I i"1 20_ C• 18C
0.8 • 16 ° C
0 14*C0.6 . [] • 12oc0.4 = C
i-1.0 -0.5 0.0 0.5 1.0
DISTANCE FROM COLD SPOT (mm)
Fig. 14. Isotherms developed in growth cell of the Thermonucleator with a 25°C ambient
and a 15°C cold spot.

Glass Celt _Icm_
Cryslall=zmg
Solullon Vol = lcc
I T> Tsot I
Cold Flnger_
T> Tsol
Cfyslal _T< Tsupersol
c,s>> I
T< Tsol
C/S> I
T< ]'sol
, ClS :" 1
a) b) c)
Fig. 15. Controlled nucleation using temperature control method (thermonucleation).
T!,'_C I t ) =0tz2_
: = _2scc = l Imm 37_ (max)mum ,a.,.)
Afta" _lt
Fig. 16. Sequence of photographs showing the nucleation and growth of an ice
crystal in the Thermonucleator.

Fig. 17. Sequenceof photographsshowingthenucleationandgrowthof Rochellesalt in the Thermonucleator. Conditions: Top: Te=24°C, Ts=16°C;
Te=24°C,Ts=16°C;Te=22°C,Ts=TeandBottom:Te=20°C,Ts=Te.

Fig. 18. Sequence of photographs showing the nucleation and growth of
lysozyme in the Thermonucleator. Conditions: Top row, left: Te=25°C,
Ts=15°C; Te=25°C, Ts=15°C; Te=25°C, Ts=Te and Bottom row, left:
Te=25°C, Ts=Te; Te=23°C, Ts=Te; Te=21 °C, Ts=Te.

Date 7-24Fime 1002Eiapsqd Tim_; (hrs) (]Spot Temperaturei_¢) {c/s) 2g (.5_1a,mbient Temperature(_q) (c/s) 28 (.531Sizv I/A)
7-24 7-25 7-25 7-25 7-26 7-29 g-I1,_(F.) 0,_0-* 1217 ]4 ._.5 16,B9 14_,_ ]6P_,2._. l "_ .0.0_ _4.a ,_,,_4 _2.31 119.21 193.03
12 (402) 22 fl.151 2$ (531 20 (1.50/ 20 (l.501 18 (1.98) 18 (1.98/
22 (!.15) 20 (1.50) 26 (.66t 21 (1.31/ 20 (1,501 20 (1.501 20 (I.50/.,4 269147 101 "_'_
07,57380.61
16 (2.57_
IS (I.99i269
Fig. 19. Photographs showing the results of the improved growth procedure for
the growth of lysozyme.

300
_. 250
b5 200
15o
100
[]
i
0
. ' ' ' I ' ' ' ' I ' ' ' ' I " ' ' ' I ' ' ' ' I ' ' ' '
50 100 150 200 250 300
Time (hrs)
Fig. 20. Crystal size vs. time for lysozyme crystal grown in latest experiment.

e"
--..a--
V
rr"
e--
o
1.0
0.5
0.0
0 50 100 150
Time (hrs)
2O0 250
Fig. 21. Growth rate vs. time for the lysozyme crystal in Fig. 19.

Fig. 22.Horse serum albumin crystal nucleated in the Thermonucleator. Textured area
shows location of a section of the temperature controlled probe. Apparent rough
surface is due to the presence of several smaller nuclei. Photographed from a "IVmonitor.

.- - :.
iiii: t i
ii+.... . i_i_ii i
i .... ....................................................!iFig. 23. ot-chymotrypsinogen A crystals nucleated in the Thermonucleator; a) shortly
after appearance of the crystals, b) after one week of growth. Textured area
shows location of a section of the temperature controlled probe. Photographed
from a TV monitor.

Fig. 24. Latestdesignof the Thermonucleatorshowing:top) front view and bottom)rearview with coolantandelectricalconnections,andport for illumination. Scaleis in
mm.

Fig. 25. Thermoelectric cooling module for controlling ambient in the Thermonucleator.

X
x+ _,_ h
Growing Crysta_
Heat'ql----I_
T
C+ &C
Solutionii1111 i
--Diffusion
Fig. 26. Relationship between temperature gradient and solubility for a theoretical material
exhibiting normal solubility.

AT GROWTH CELL
Seed
Crystals
i, i i i i | i i i ..... •
_Source
Material
_WaterChannel
TC* TC TC TC TC
_Copper, Acrylic Plastic Glass
* Thermocouple
Fig. 27. Temperature gradient cell. Thermocouples are indicated by TC.

O
t_h,.
_9
E
2824
22
18
Temperature16 Solubility
14 , i
0.0 1.0 2.0
Distance (in)
6o
5o
4o
3o
2o
10
E
E
"-1
009
Fig. 28. Temperature and solubility gradients developed in temperature gradient cell.

1400 I
1300
1280
1100
c_ 1000e-.
9OO
800
700
0 500 1000 1500 2000
Time (hrs)
Fig. 29. Size vs. time for a lysozyme crystal grown under the conditions of Fig. 28.

Fig. 30. Lysozymecrystalgrownunderconditionsof Fig. 28photographedin transmitted
light withcrossedpolarizers.Top)Secondarynucleationevident. Light areawastheseed.Bottom)Surfacemorphologydevelopedduringgrowth. Crystalsizewas1320g.

X
+ 900_t 110 crystalx 110, 011 crystals
• 600g, 110 crystal
O Thermocouples
1
2
I cm
o o
2 boundary for > 501.1,crystals(secondary nucleation)
1 boundary - secondary nucleatedcrystals touch
Fig. 31. Baffled cell design to eliminate drift of source material. Location of seeds,
secondary nucleation and thermocouple are indicated.

oOv
t,,-
CL
E
t--
Baffled Cell Growth Conditions
l
26
24
22
20
18
16
140
isozyme
B
Temperature
I I
1 2
Distance (in)
60
5o
4O
30
20
10
3
EC_
E
°m
.m
..Q
O03
Expected Growth Rate - 0.44uJhr (Pusey and Naumann)
Fig. 32. Temperature and solubility gradients developed in baffled cell.

E
¢-.
1000
8OO
6OO
40O
2OO0
y = 504.32 + 0.34702x R^2 = 0.996 _
, _°_._°:_3_*.__o:o_7... !500 1000 1500
time (hrs)
Fig. 33. Size vs. time for lysozyme crystals grown under the conditions of Fig. 32.

Fig. 34. Lysozymecrystalsgrownundertheconditionsof Fig. 32.
Top) 9221.tBottom)6171.t.

f/
X x+ ,'kX
-Growing Crystal
_x
T
C+ AC C
FSolution rSource Material
.,ql-_--Diflusion
Zone Motion
G-(O/&x) Ac
X
Heat T
-Source Material
X+ & X _,,.He_T+ &T
Variables: X, Y, G, A, T, T+ a, T, C, C+ .', C
Fig. 35. Parameters of temperature gradient growth technique.

Fig. 36. Catalasecrystalsdepositedatrelativelylow supersaturations.

Fig. 37. Diagonalof orientation.

Fig. 38. Backsideof acatalasecrystalsremovedfrom thesubstrate.Note
parallelstriation (with a period equalto that of striatedmicro-relief) asaresultof thecrystalgrowinginto thesubstrateafter a
longperiodof time(about3days)in a supersaturatedsolution.

Fig. 39. Crystalsof canavalinorientedparallel to striations(as indicated
by arrows)togetherwith crystalshavingdifferentorientations.

Fig. 40. Lysozymecrystalsdepositedin orientationpositionswith respectto striatedmicro-relief.