The Bike Industry: A Brief Business Overview
5
By: Jessie Hughes
-
Upload
jessie-hughes -
Category
Sports
-
view
68 -
download
2
Transcript of The Bike Industry: A Brief Business Overview
By: Jessie Hughes
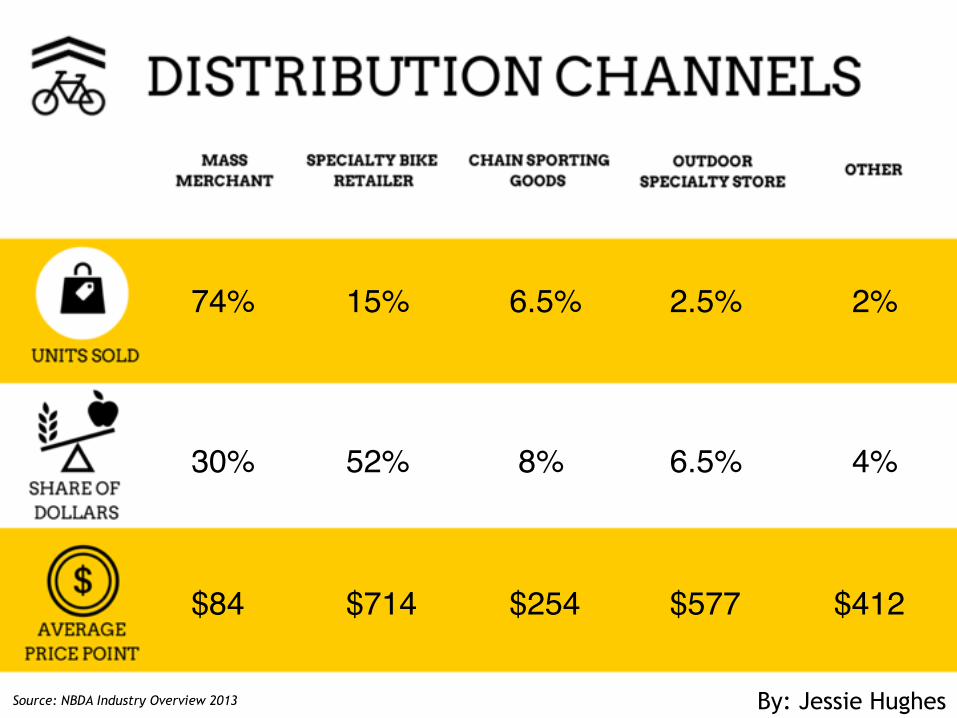
74% 15% 6.5% 2.5% 2%
30% 52% 8% 6.5% 4%
$84 $714 $254 $577 $412
Source: NBDA Industry Overview 2013 By: Jessie Hughes
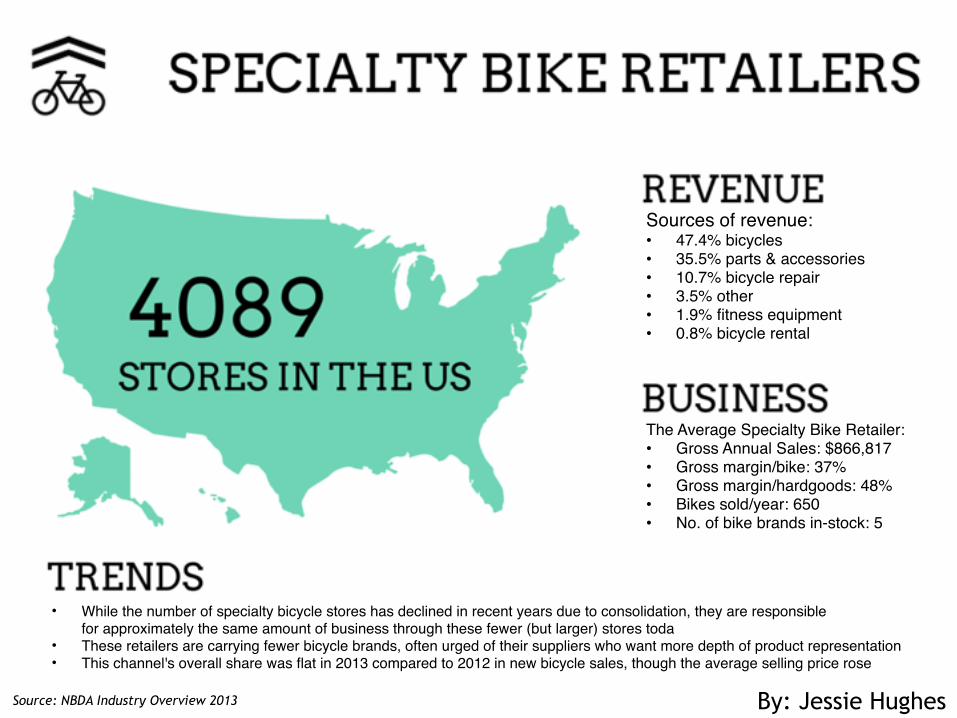
Sources of revenue:• 47.4% bicycles• 35.5% parts & accessories • 10.7% bicycle repair• 3.5% other• 1.9% fitness equipment • 0.8% bicycle rental
• While the number of specialty bicycle stores has declined in recent years due to consolidation, they are responsible for approximately the same amount of business through these fewer (but larger) stores toda
• These retailers are carrying fewer bicycle brands, often urged of their suppliers who want more depth of product representation • This channel's overall share was flat in 2013 compared to 2012 in new bicycle sales, though the average selling price rose
The Average Specialty Bike Retailer:• Gross Annual Sales: $866,817• Gross margin/bike: 37%• Gross margin/hardgoods: 48%• Bikes sold/year: 650• No. of bike brands in-stock: 5
Source: NBDA Industry Overview 2013 By: Jessie Hughes
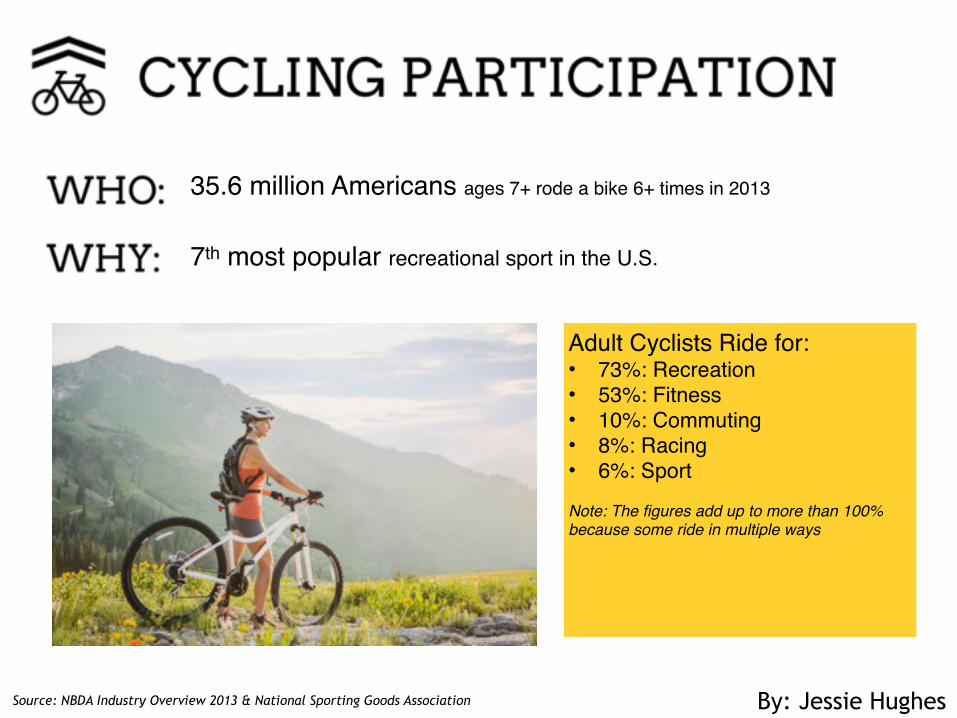
Source: NBDA Industry Overview 2013 & National Sporting Goods Association
Adult Cyclists Ride for:• 73%: Recreation• 53%: Fitness• 10%: Commuting• 8%: Racing • 6%: Sport
Note: The figures add up to more than 100% because some ride in multiple ways
35.6 million Americans ages 7+ rode a bike 6+ times in 2013
7th most popular recreational sport in the U.S.
By: Jessie Hughes
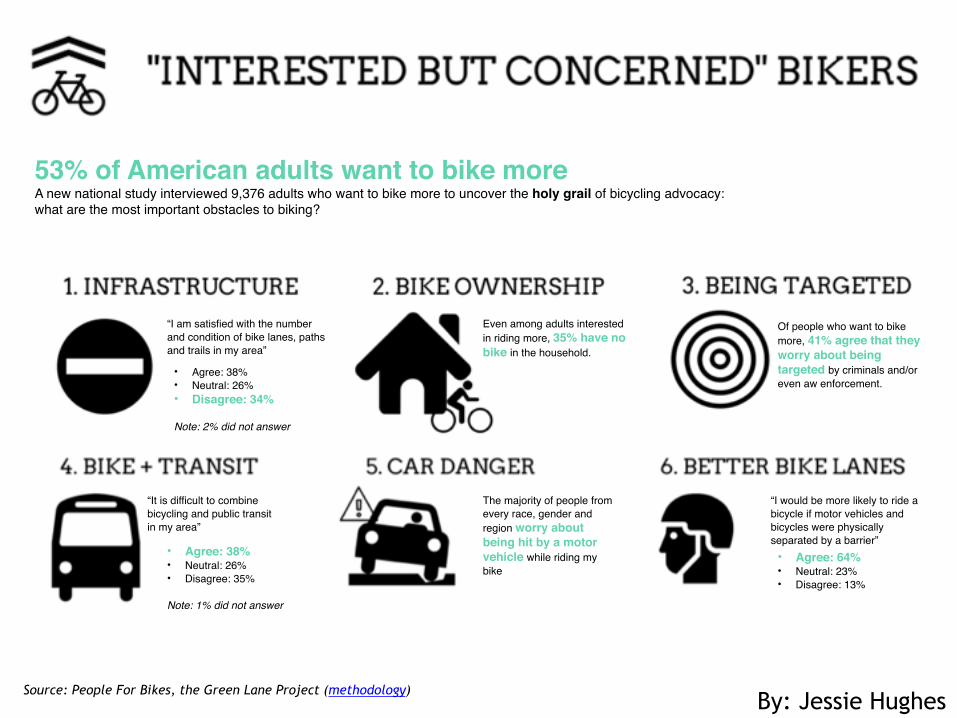
Source: People For Bikes, the Green Lane Project (methodology)
“I am satisfied with the number and condition of bike lanes, paths and trails in my area”
• Agree: 38%• Neutral: 26%• Disagree: 34%
Note: 2% did not answer
Even among adults interested in riding more, 35% have no bike in the household.
Of people who want to bike more, 41% agree that they worry about being targeted by criminals and/or even aw enforcement.
53% of American adults want to bike moreA new national study interviewed 9,376 adults who want to bike more to uncover the holy grail of bicycling advocacy: what are the most important obstacles to biking?
“It is difficult to combine bicycling and public transit in my area”
• Agree: 38%• Neutral: 26%• Disagree: 35%
Note: 1% did not answer
The majority of people from every race, gender and region worry about being hit by a motor vehicle while riding my bike
“I would be more likely to ride a bicycle if motor vehicles and bicycles were physically separated by a barrier”• Agree: 64%• Neutral: 23%• Disagree: 13%
By: Jessie Hughes