THE BIA REPORT ON CONSUMER CONFIDENCE … Hampshire adults continue to think it is a good time to...
17
THE BIA REPORT ON CONSUMER CONFIDENCE THE UNIVERSITY OF NEW HAMPSHIRE SURVEY CENTER August 3, 2016 GRANITE STATERS OPTIMISTIC ABOUT BUSINESS CONDITIONS IN NEW HAMPSHIRE By: Andrew E. Smith, Ph.D. Zachary S. Azem, M.A. UNH Survey Center www.unh.edu/survey-center 603/862-2226 DURHAM, NH – New Hampshire residents are increasingly optimistic about state business conditions and remain optimistic about the national economy. The majority of Granite Staters say their household financial condition is better or about the same since last year and most don’t expect it to change over the next year. These findings are based on the latest Business and Industry Association (BIA) Report on Consumer Confidence, conducted by the University of New Hampshire Survey Center. Five hundred (500) randomly selected New Hampshire adults were interviewed by landline and cellular telephone between July 19 and August 1, 2016. The margin of sampling error for the survey is +/- 4.4 percent. N.H. Business Conditions New Hampshire residents’ expectations about economic conditions in the state continue to improve. When asked how New Hampshire businesses will do over the upcoming year, over half of Granite Staters (63%) think state businesses will enjoy good times financially, only 15% think they will experience bad times, and 22% anticipate mixed conditions. The percentage predicting good times is at an all-time high. Optimism about New Hampshire business conditions is bipartisan – 70% of Democrats, 59% of Republicans and 52% of Independents believe the state will enjoy good financial times. “The latest report reveals confidence is up in all state and national categories surveyed. This is an excellent sign regarding anticipated economic growth in New Hampshire and beyond. As we enter the election season, we urge our current and future policy leaders to support initiatives that will keep this momentum going,” said BIA President Jim Roche. We ask that this copyrighted information be referred to as the BIA Report on Consumer Confidence, sponsored by the New Hampshire Business and Industry Association, and conducted by the University of New Hampshire Survey Center. Business Conditions in NH – Next 12 Months 0% 10% 20% 30% 40% 50% 60% 70% 80% 90% 100% Good Times Mixed Bad Times
Transcript of THE BIA REPORT ON CONSUMER CONFIDENCE … Hampshire adults continue to think it is a good time to...

THE BIA REPORT ON CONSUMER CONFIDENCE THE UNIVERSITY OF NEW HAMPSHIRE SURVEY CENTER
August 3, 2016 GRANITE STATERS OPTIMISTIC ABOUT BUSINESS CONDITIONS IN NEW HAMPSHIRE By: Andrew E. Smith, Ph.D. Zachary S. Azem, M.A. UNH Survey Center www.unh.edu/survey-center 603/862-2226 DURHAM, NH – New Hampshire residents are increasingly optimistic about state business conditions and remain optimistic about the national economy. The majority of Granite Staters say their household financial condition is better or about the same since last year and most don’t expect it to change over the next year.
These findings are based on the latest Business and Industry Association (BIA) Report on Consumer Confidence, conducted by the University of New Hampshire Survey Center. Five hundred (500) randomly selected New Hampshire adults were interviewed by landline and cellular telephone between July 19 and August 1, 2016. The margin of sampling error for the survey is +/- 4.4 percent.
N.H. Business Conditions
New Hampshire residents’ expectations about economic conditions in the state continue to improve. When asked how New Hampshire businesses will do over the upcoming year, over half of Granite Staters (63%) think state businesses will enjoy good times financially, only 15% think they will experience bad times, and 22% anticipate mixed conditions. The percentage predicting good times is at an all-time high. Optimism about New Hampshire business conditions is bipartisan – 70% of Democrats, 59% of Republicans and 52% of Independents believe the state will enjoy good financial times. “The latest report reveals confidence is up in all state and national categories surveyed. This is an excellent sign regarding anticipated economic growth in New Hampshire and beyond. As we enter the election season, we urge our current and future policy leaders to support initiatives that will keep this momentum going,” said BIA President Jim Roche.
We ask that this copyrighted information be referred to as the BIA Report on Consumer Confidence, sponsored by the New Hampshire Business and Industry Association, and conducted by the University of New Hampshire Survey Center.
Business Conditions in NH – Next 12 Months
0%
10%
20%
30%
40%
50%
60%
70%
80%
90%
100%
Good Times Mixed Bad Times
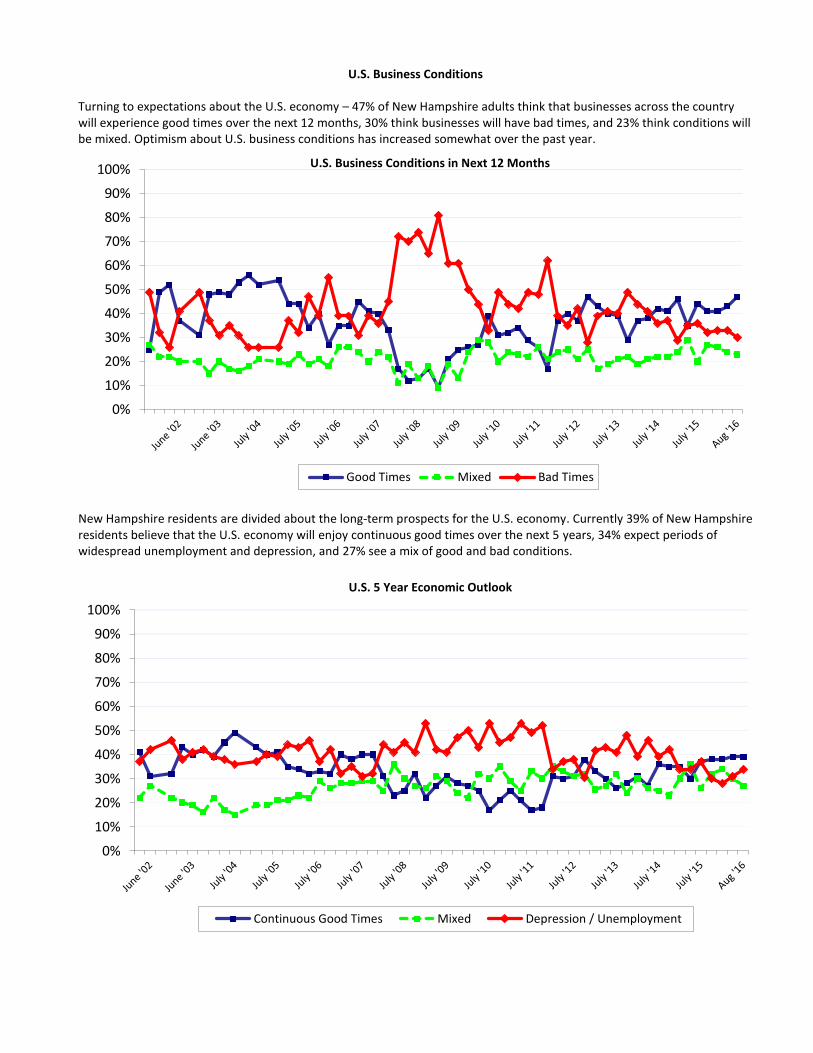
U.S. Business Conditions Turning to expectations about the U.S. economy – 47% of New Hampshire adults think that businesses across the country will experience good times over the next 12 months, 30% think businesses will have bad times, and 23% think conditions will be mixed. Optimism about U.S. business conditions has increased somewhat over the past year.
New Hampshire residents are divided about the long-term prospects for the U.S. economy. Currently 39% of New Hampshire residents believe that the U.S. economy will enjoy continuous good times over the next 5 years, 34% expect periods of widespread unemployment and depression, and 27% see a mix of good and bad conditions.
U.S. Business Conditions in Next 12 Months
0%
10%
20%
30%
40%
50%
60%
70%
80%
90%
100%
Good Times Mixed Bad Times
U.S. 5 Year Economic Outlook
0%
10%
20%
30%
40%
50%
60%
70%
80%
90%
100%
Continuous Good Times Mixed Depression / Unemployment

Personal Financial Conditions When asked about their household finances, most New Hampshire adults think they are financially better off or about the same as they were a year ago -- 39% say they are better off now than they were a year ago, 25% say they are worse off, and 35% say things are about the same. The percentage who say they are worse off is the lowest it has been since July 2004.
Looking forward, a majority of Granite Staters think their households will be in about the same financial condition next year as they are today. Currently, 31% think their family will be better off financially a year from now, only 8% think they will be worse off and 61% think their families will be about the same.
Household Financial Condition – Compared to 1 Year Ago
0%
10%
20%
30%
40%
50%
60%
70%
80%
90%
100%
Better Off About the Same Worse Off
Household Financial Condition – 12 Months from Now
0%
10%
20%
30%
40%
50%
60%
70%
80%
90%
100%
Better Off About the Same Worse Off

New Hampshire adults continue to think it is a good time to buy major items for their home. Two in three New Hampshire residents (68%) think now is a good time to buy major household items, 22% think it is a bad time, and 9% think it depends on a person’s finances. This measure has stayed steady since April.
Subgroup Analysis
There are a few demographic differences in the economic expectations of New Hampshire residents. Democrats and younger residents are consistently more optimistic about the state and national economy than Republicans and Independents. Younger residents are also more likely to be optimistic about their household’s financial condition over the past year and over the next year.
Good Time to Buy Major Household Item?
0%
10%
20%
30%
40%
50%
60%
70%
80%
90%
100%
Good Time Pro-Con Bad Time

Business and Industry Association Report on Consumer Confidence Methodology
These findings are based on the latest Business and Industry Association (BIA) Report on Consumer Confidence, conducted by the University of New Hampshire Survey Center. Five hundred (500) randomly selected New Hampshire adults were interviewed in English by landline and cellular telephone between July 19 and August 1, 2016. The margin of sampling error for the survey is +/- 4.4 percent. These MSE’s have not been adjusted for design effect. The design effect for the survey is 1.1%. The random sample used in the BIA Report on Consumer Confidence was purchased from Marketing Systems Group (MSG), Horsham, PA. MSG screens each selected telephone number to eliminate non-working numbers, disconnected numbers, and business numbers to improve the efficiency of the sample, reducing the amount of time interviewers spend calling non-usable numbers. The data have been weighted to adjust for numbers of adults and telephone lines within households. Additionally, data were weighted by respondent sex, age, and region of the state to targets from the most recent American Community Survey (ACS) conducted by the U.S. Census Bureau. In addition to potential sampling error, all surveys have other potential sources of non-sampling error including question order effects, question wording effects, and non-response. Due to rounding, percentages may not sum to 100%. The number of respondents in each demographic below may not equal the number reported in cross-tabulation tables as some respondents choose not to answer some questions. For more information about the methodology used in the BIA Report on Consumer Confidence, contact Dr. Andrew Smith at (603) 862-2226 or by email at [email protected].
BIA Report on Consumer Confidence, Summer 2016 Demographics
Sex
N %
Region N %
Male 245 49%
North Country 46 9%
Female 255 51%
Central/Lakes 93 19%
Connecticut Valley 72 14%
Age N % Mass Border 115 23%
18 to 34 124 27%
Seacoast 82 17%
35 to 49 125 27% Manchester Area 92 18%
50 to 64 132 29%
65 and Over 83 18%
Party Registration N %
Democrat 108 23%
Highest Level of Education N %
Undeclared/Not Registered 255 53%
High School or Less 102 21%
Republican 117 24%
Some College 102 21%
College Graduate 164 34%
Party Identification N %
Post-Graduate 111 23% Democrat 206 44%
Independent 83 18%
Years Lived in NH N %
Republican 179 38%
10 yrs. Or less 62 13%
11-20 yrs. 104 22%
> 20 yrs. 304 65%

Business Conditions in New Hampshire in 12 Months
“Turning to business conditions in the New Hampshire as a whole – do you think that during the next twelve months we’ll have good times financially, or bad times, or what?”
Good Times Mixed Bad Times (N=) Aug ‘16 63% 22% 15% (408) May ‘16 54% 26% 19% (430) Feb ‘16 46% 30% 23% (451) Oct ‘15 49% 31% 20% (490) July ‘15 49% 25% 26% (463) May ‘15 49% 28% 23% (521) Feb. ‘15 55% 26% 19% (454) Oct. ‘14 49% 23% 28% (480) July ‘14 51% 25% 24% (454) Apr. ‘14 54% 20% 26% (451) Feb. ‘14 52% 20% 27% (502) Oct. ‘13 34% 29% 37% (540) July ‘13 46% 27% 27% (461) Apr. ‘13 50% 24% 25% (454) Feb. ‘13 49% 22% 29% (523) Oct. ‘12 48% 25% 27% (511) July ‘12 48% 26% 26% (456) Apr. ‘12 51% 24% 25% (488) Feb. ‘12 47% 27% 27% (484) Oct. ‘11 30% 28% 42% (498) July ‘11 36% 32% 32% (469) Apr. ‘11 39% 25% 36% (478)
Feb. ‘11 44% 28% 28% (481) Sept. ‘10 41% 26% 33% (475) July ‘10 36% 25% 39% (458) Apr. ‘10 39% 26% 35% (473) Feb. ‘10 33% 26% 40% (460) Oct. ‘09 34% 26% 41% (479) July ‘09 29% 17% 54% (522) Apr. ‘09 27% 25% 48% (472) Feb. ‘09 13% 15% 71% (586) Sept. ‘08 28% 22% 50% (480) July ‘08 22% 19% 59% (481) Apr. ‘08 15% 23% 62% (455) Feb. ‘08 23% 19% 57% (494) Sept. ‘07 44% 25% 31% (433) July ‘07 50% 30% 20% (442) Apr. ‘07 49% 27% 24% (458) Feb. ‘07 51% 28% 21% (462) Sept. ‘06 48% 25% 27% (453) July ‘06 49% 28% 23% (444) Apr. ‘06 41% 25% 34% (457) Feb. ‘06 53% 26% 22% (432) Oct. ’05 48% 22% 31% (431) July ’05 54% 22% 25% (429) Apr. ’05 56% 19% 25% (433) Feb. ‘05 60% 21% 19% (453) July ’04 59% 21% 20% (444) Apr. ’04 58% 20% 22% (457) Feb. ’04 54% 17% 29% (448) Oct. ’03 52% 19% 28 % (449) June ’03 50% 17% 32% (485) Apr. ’03 48% 16% 35% (462) Feb. ’03 41% 19% 40% (577) June ‘02 52% 21% 27% (588) Apr. ‘02 58% 20% 22% (462)

Business Conditions in U.S. in 12 Months
“Turning to business conditions in the country as a whole – do you think that during the next twelve months we’ll have good times financially, or bad times, or what?”
Good Times Mixed Bad Times (N=) Aug ‘16 47% 23% 30% (407) May ‘16 43% 24% 33% (422) Feb ‘16 41% 26% 33% (471) Oct ‘15 41% 27% 32% (508) July ‘15 44% 20% 36% (480) May ‘15 35% 29% 35% (544) Feb. ‘15 46% 24% 29% (476) Oct. ‘14 41% 22% 37% (512) July ‘14 42% 22% 36% (480) Apr. ‘14 38% 21% 41% (474) Feb. ‘14 37% 19% 44% (524) Oct. ‘13 29% 22% 49% (563) July ‘13 39% 21% 40% (469) Apr. ‘13 40% 19% 41% (480) Feb. ‘13 43% 17% 40% (548) Oct. ‘12 47% 25% 28% (513) July ‘12 37% 21% 42% (464) Apr. ‘12 40% 25% 35% (492) Feb. ‘12 37% 24% 39% (493) Oct. ‘11 17% 21% 62% (517) July ‘11 26% 26% 48% (490) Apr. ‘11 29% 22% 49% (483) Feb. ‘11 34% 23% 42% (495) Sept. ‘10 32% 24% 44% (479) July ‘10 31% 20% 49% (473) Apr. ‘10 39% 28% 33% (483) Feb. ‘10 27% 29% 44% (475) Oct. ‘09 26% 24% 50% (481) July ‘09 25% 13% 61% (546) Apr. ‘09 21% 19% 61% (471) Feb. ‘09 9% 9% 81% (594) Sept. ‘08 17% 18% 65% (508) July ‘08 13% 13% 74% (500) Apr. ‘08 12% 19% 70% (482) Feb. ‘08 17% 11% 72% (529) Sept. ‘07 33% 22% 45% (464) July ‘07 40% 24% 36% (456) Apr. ‘07 41% 20% 39% (479) Feb. ‘07 45% 24% 31% (486) Sept. ‘06 35% 26% 39% (473) July ‘06 35% 26% 39% (454) Apr. ‘06 27% 18% 55% (467) Feb. ‘06 40% 21% 39% (445) Oct. ’05 34% 19% 47% (459) July ’05 44% 23% 32% (438) Apr. ’05 44% 19% 37% (450) Feb. ‘05 54% 20% 26% (488) July ‘04 52% 21% 26% (446) Apr. ‘04 56% 18% 26% (468) Feb. ‘04 53% 16% 31% (461) Oct. ‘03 48% 17% 35% (455) June ‘03 49% 20% 31% (491) Apr. ‘03 48% 15% 37% (477) Feb. ‘03 31% 20% 49% (606) June ‘02 37% 22% 41% (599) Apr. ‘02 52% 22% 26% (484) Feb. ‘02 49% 19% 32% (300) Oct. ‘01 25% 27% 49% (493)

5 Year Economic Outlook - U.S.
“Looking ahead, which would you say is more likely – that in the country as a whole we will have continuous GOOD TIMES during the next FIVE YEARS or so, or that we will have periods of WIDESPREAD UNEMPLOYMENT or DEPRESSION, or what?”
Continuous Good Times
Mixed
Depression/ Unemployment
(N=)
Aug ‘16 39% 27% 34% (399) May ‘16 39% 30% 31% (405) Feb ‘16 38% 34% 28% (428) Oct ‘15 38% 32% 30% (490) July ‘15 37% 26% 37% (444) May ‘15 30% 36% 34% (514) Feb. ‘15 35% 30% 34% (460) Oct. ‘14 35% 23% 42% (493) July ‘14 36% 25% 39% (460) Apr. ‘14 27% 26% 46% (461) Feb. ‘14 31% 30% 39% (529) Oct. ‘13 28% 24% 48% (552) July ‘13 26% 32% 41% (485) Apr. ‘13 30% 27% 43% (471) Feb. ‘13 33% 26% 42% (562) Oct. ‘12 38% 32% 30% (490) July ‘12 31% 31% 38% (453) Apr. ‘12 30% 33% 37% (465) Feb. ‘12 31% 35% 34% (479) Oct. ‘11 18% 30% 52% (515) July ‘11 17% 33% 49% (484) Apr. ‘11 21% 25% 53% (479) Feb. ‘11 25% 29% 47% (482) Sept. ‘10 21% 35% 45% (486) July ‘10 17% 30% 53% (477) Apr. ‘10 25% 32% 43% (472) Feb. ‘10 27% 22% 50% (472) Oct. ‘09 28% 24% 47% (463) July ‘09 31% 29% 41% (538) Apr. ‘09 27% 31% 42% (479) Feb. ‘09 22% 26% 53% (590) Sept. ‘08 32% 27% 41% (484) July ‘08 25% 30% 45% (485) Apr. ‘08 23% 36% 41% (439) Feb. ‘08 31% 25% 44% (502) Sept. ‘07 40% 29% 32% (443) July ‘07 40% 29% 31% (432) Apr. ‘07 38% 28% 35% (472) Feb. ‘07 40% 28% 32% (478) Sept. ‘06 32% 26% 42% (473) July ‘06 33% 29% 37% (447) Apr. ‘06 32% 22% 46% (471) Feb. ‘06 34% 23% 43% (444) Oct. ’05 35% 21% 44% (460) July ’05 41% 21% 39% (461) Apr. ’05 40% 19% 40% (455) Feb. ‘05 43% 19% 37% (497) July ‘04 49% 15% 36% (431) Apr. ‘04 45% 17% 38% (467) Feb. ‘04 39% 22% 39% (454) Oct. ‘03 42% 16% 42% (457) June ‘03 40% 19% 41% (479) Apr. ‘03 43% 20% 38% (470) Feb. ‘03 32% 22% 46% (607) June ‘02 31% 27% 42% (603) Apr. ‘02 41% 22% 37% (463)

Household Financial Condition Compared to 12 Months Ago
"We are interested in how people are getting along financially these days. Would you say that you and your family living there are BETTER OFF or WORSE OFF financially than you were a year ago?"
Better Off About the Same Worse Off (N=) Aug ‘16 39% 35% 25% (495) May ‘16 37% 37% 26% (495) Feb ‘16 33% 40% 28% (525) Oct ‘15 36% 35% 29% (578) July ‘15 34% 37% 30% (527) May ‘15 42% 31% 27% (562) Feb. ‘15 37% 34% 29% (499) Oct. ‘14 37% 31% 33% (532) July ‘14 34% 35% 31% (510) Apr. ‘14 30% 35% 35% (506) Feb. ‘14 28% 38% 34% (559) Oct. ‘13 26% 34% 40% (584) July ‘13 33% 37% 30% (507) Apr. ‘13 26% 38% 36% (503) Feb. ‘13 28% 36% 36% (575) Oct. ‘12 26% 38% 36% (583) July ‘12 22% 40% 38% (516) Apr. ‘12 24% 33% 42% (533) Feb. ‘12 24% 33% 43% (518) Oct. ‘11 15% 39% 47% (553) July ‘11 20% 32% 48% (509) Apr. ‘11 18% 29% 53% (502) Feb. ‘11 22% 30% 48% (518) Sept. ‘10 19% 37% 44% (510) July ‘10 19% 38% 44% (497) Apr. ‘10 22% 38% 40% (505) Feb. ‘10 15% 36% 49% (497) Oct. ‘09 11% 36% 53% (499) July ‘09 12% 27% 61% (550) Apr. ‘09 14% 31% 55% (502) Feb. ‘09 12% 30% 58% (615) Sept. ‘08 16% 27% 57% (543) July ‘08 16% 23% 60% (517) Apr. ‘08 20% 27% 53% (495) Feb. ‘08 24% 29% 47% (550) Sept. ‘07 33% 35% 32% (498) July ‘07 38% 30% 32% (514) Apr. ‘07 36% 33% 30% (507) Feb. ‘07 40% 30% 30% (531) Sept. ‘06 34% 35% 31% (508) July ‘06 31% 34% 35% (504) Apr. ‘06 38% 31% 32% (500) Feb. ‘06 39% 31% 30% (492) Oct. ’05 40% 29% 31% (503) July ’05 34% 35% 31% (500) Apr. ’05 41% 29% 30% (493) Feb. ‘05 37% 36% 27% (537) July ‘04 40% 34% 25% (495) Apr. ‘04 45% 32% 23% (538) Feb. ‘04 34% 38% 28% (503) Oct. ‘03 36 % 32 % 32% (496) June ‘03 35% 28% 36% (514) Apr. ‘03 36% 30% 34% (504) Feb. ‘03 30% 29% 40% (647) June ‘02 38% 33% 29% (650) Apr. ‘02 40% 29% 31% (507)

Household Financial Condition 12 Months from Now
“Now, looking ahead – do you think that a year from now you and your family will be better off financially … or worse off … or just about the same?”
Better Off About the Same Worse Off (N=) Aug ‘16 31% 61% 8% (441) May ‘16 28% 64% 8% (466) Feb ‘16 27% 64% 10% (492) Oct ‘15 33% 59% 9% (551) July ‘15 25% 64% 11% (514) May ‘15 31% 53% 16% (552) Feb. ‘15 30% 57% 13% (498) Oct. ‘14 30% 59% 11% (512) July ‘14 29% 60% 10% (503) Apr. ‘14 27% 57% 16% (486) Feb. ‘14 24% 57% 19% (546) Oct. ‘13 27% 49% 24% (569) July ‘13 29% 54% 17% (495) Apr. ‘13 28% 52% 20% (487) Feb. ‘13 28% 48% 24% (563) Oct. ‘12 35% 51% 14% (519) July ‘12 23% 59% 18% (473) Apr. ‘12 26% 55% 18% (493) Feb. ‘12 25% 60% 15% (486) Oct. ‘11 16% 63% 21% (532) July ‘11 20% 58% 22% (499) Apr. ‘11 21% 50% 29% (484) Feb. ‘11 23% 61% 16% (500) Sept. ‘10 26% 57% 17% (497) July ‘10 20% 59% 22% (487) Apr. ‘10 27% 54% 18% (492) Feb. ‘10 24% 57% 20% (473) Oct. ‘09 27% 54% 19% (482) July ‘09 26% 51% 23% (531) Apr. ‘09 33% 50% 17% (483) Feb. ‘09 24% 56% 19% (568) Sept. ‘08 22% 57% 21% (486) July ‘08 18% 50% 32% (483) Apr. ‘08 20% 49% 31% (470) Feb. ‘08 26% 52% 22% (518) Sept. ‘07 29% 58% 13% (489) July ‘07 26% 62% 12% (442) Apr. ‘07 30% 54% 16% (492) Feb. ‘07 31% 57% 13% (515) Sept. ‘06 25% 59% 15% (495) July ‘06 25% 58% 17% (484) Apr. ‘06 26% 51% 23% (492) Feb. ‘06 33% 52% 15% (488) Oct. ’05 30% 52% 18% (481) July ’05 29% 56% 16% (489) Apr. ’05 32% 52% 15% (485) Feb. ‘05 36% 55% 9% (524) July ‘04 37% 54% 9% (477) Apr. ‘04 38% 54% 8% (509) Feb. ‘04 37% 52% 10% (488) Oct. ‘03 32% 59% 9% (486) June ‘03 35% 54% 10% (501) Apr. ‘03 42% 49% 9% (489) Feb. ‘03 34% 55% 11% (622) June ‘02 33% 57% 10% (625) Apr. ‘02 38% 55% 7% (479) Feb. ‘02 35% 56% 10% (305) Oct. ‘01 26% 62% 13% (500)

Good Time to Buy Major Household Item
“Now thinking about the big things people buy for their home – such as furniture, a refrigerator, a stove, television and things like that. Generally speaking, do you think now is a good time or a bad time for people to buy major household items?”
Good Time Pro-Con Bad Time (N=) Aug ‘16 68% 9% 22% (430) May ‘16 68% 13% 19% (443) Feb ‘16 60% 16% 24% (480) Oct ‘15 59% 16% 25% (521) July ‘15 62% 13% 25% (466) May ‘15 56% 23% 22% (519) Feb. ‘15 61% 17% 22% (458) Oct. ‘14 55% 12% 33% (495) July ‘14 58% 16% 26% (460) Apr. ‘14 58% 14% 29% (460) Feb. ‘14 56% 13% 31% (498) Oct. ‘13 46% 18% 36% (552) July ‘13 53% 16% 32% (467) Apr. ‘13 54% 21% 25% (468) Feb. ‘13 52% 17% 31% (515) Oct. ‘12 48% 17% 35% (551) July ‘12 48% 20% 32% (468) Apr. ‘12 45% 24% 31% (503) Feb. ‘12 46% 16% 38% (487) July ‘11 47% 20% 33% (479) Apr. ‘11 44% 19% 37% (475) Feb. ‘11 45% 20% 35% (478) Sept. ‘10 45% 22% 33% (491) July ‘10 48% 19% 33% (469) Apr. ‘10 57% 16% 27% (471) Feb. ‘10 45% 20% 35% (469) Oct. ‘09 47% 17% 36% (472) July ‘09 44% 19% 37% (548) Apr. ‘09 42% 20% 39% (491) Feb. ‘09 40% 23% 37% (591) Sept. ‘08 27% 16% 56% (495) July ‘08 32% 18% 51% (487) Apr. ‘08 28% 16% 56% (465) Feb. ‘08 40% 15% 45% (517) Sept. ‘07 50% 13% 37% (433) July ‘07 54% 19% 28% (430) Apr. ‘07 58% 17% 26% (458) Feb. ‘07 64% 15% 22% (488) Sept. ‘06 58% 14% 28% (452) July ‘06 49% 18% 34% (453) Apr. ‘06 52% 14% 34% (448) Feb. ‘06 59% 15% 26% (442) Oct. ’05 51% 14% 35% (456) July ’05 63% 14% 22% (441) Apr. ’05 64% 15% 21% (446) Feb. ‘05 70% 13% 18% (478) July ‘04 67% 12% 21% (456) Apr. ‘04 71% 9% 20% (487) Feb. ‘04 58% 15% 28% (462) Oct. ‘03 65% 14% 21% (468) June ‘03 63% 14% 23% (475) Apr. ‘03 60% 12% 28% (487) Feb. ‘03 53% 16% 31% (600) June ‘02 68% 10% 22% (613) Apr. ‘02 71% 11% 18% (480) Feb. ‘02 65% 10% 26% (298) Oct. ‘01 63% 15% 22% (506)

Household Financial Condition Compared to 12 Months Ago About Better Off the Same Worse Off (N) STATEWIDE 39% 35% 25% 495 Democrat 54% 29% 17% 204 Independent 39% 33% 28% 82 Republican 23% 43% 34% 176 Liberal 51% 27% 22% 130 Moderate 45% 34% 20% 173 Conservative 19% 46% 36% 133 Support Tea Party 26% 44% 30% 62 Neutral 41% 29% 30% 184 Oppose Tea Party 43% 36% 21% 200 Employed Full Time 44% 32% 24% 279 Employed Part Time 54% 29% 17% 60 Retired/Not Working 21% 50% 28% 97 Union household 59% 22% 19% 56 Non-union 37% 37% 26% 412 Read Union Leader 26% 35% 39% 94 Read Boston Globe 39% 47% 14% 51 Read Local Newspapers 38% 36% 27% 162 Watch WMUR 37% 38% 25% 264 Listen to NHPR 44% 31% 25% 166 Listen to Conserv. Radio 29% 40% 31% 51 10 yrs or less in NH 43% 41% 16% 61 11 to 20 years 37% 27% 36% 103 More than 20 years 40% 36% 24% 300 18 to 34 54% 21% 24% 124 35 to 49 36% 38% 26% 125 50 to 64 38% 35% 27% 129 65 and over 26% 50% 24% 90 Male 40% 37% 23% 244 Female 39% 34% 28% 250 High school or less 31% 35% 34% 102 Some college 39% 32% 29% 100 College graduate 45% 31% 24% 162 Post-graduate 38% 45% 17% 109 Less than $30K 31% 36% 33% 41 $30K to $60K 37% 30% 32% 73 $60K to $75K 48% 25% 27% 46 $75K to $100K 44% 34% 21% 52 $100K or more 48% 38% 14% 138 North Country 45% 21% 34% 46 Central / Lakes 49% 31% 21% 91 Connecticut Valley 32% 33% 35% 72 Mass Border 36% 47% 17% 113 Seacoast 38% 35% 26% 82 Manchester Area 37% 36% 27% 90 First Cong. Dist 39% 35% 25% 252 Second Cong. Dist 39% 36% 25% 242

HH Financial Condition 12 Months from Now
About Better Off Worse Off the Same (N) STATEWIDE 31% 8% 61% 441 Democrat 28% 5% 67% 190 Independent 31% 16% 53% 70 Republican 32% 9% 59% 154 Liberal 30% 8% 62% 119 Moderate 33% 6% 61% 160 Conservative 29% 11% 60% 112 Support Tea Party 38% 5% 58% 49 Neutral 27% 9% 64% 164 Oppose Tea Party 31% 7% 61% 189 Employed Full Time 35% 7% 59% 247 Employed Part Time 22% 9% 69% 53 Retired/Not Working 22% 11% 67% 89 Union household 34% 1% 65% 51 Non-union 30% 9% 60% 369 Read Union Leader 28% 14% 59% 83 Read Boston Globe 38% 2% 59% 46 Read Local Newspapers 27% 9% 63% 137 Watch WMUR 27% 11% 62% 234 Listen to NHPR 31% 7% 62% 154 Listen to Conserv. Radio 28% 5% 67% 40 10 yrs or less in NH 39% 0% 61% 55 11 to 20 years 30% 11% 59% 94 More than 20 years 30% 8% 62% 265 18 to 34 37% 5% 58% 119 35 to 49 34% 7% 58% 112 50 to 64 32% 6% 62% 112 65 and over 17% 14% 69% 75 Male 37% 7% 56% 221 Female 25% 8% 66% 219 High school or less 27% 7% 66% 87 Some college 35% 6% 60% 85 College graduate 32% 11% 57% 149 Post-graduate 29% 7% 64% 103 Less than $30K 33% 7% 60% 37 $30K to $60K 37% 4% 59% 70 $60K to $75K 19% 12% 69% 42 $75K to $100K 47% 7% 46% 44 $100K or more 28% 7% 64% 131 North Country 33% 0% 67% 36 Central / Lakes 27% 9% 64% 83 Connecticut Valley 27% 9% 64% 60 Mass Border 31% 9% 61% 105 Seacoast 27% 8% 65% 73 Manchester Area 41% 8% 51% 83 First Cong. Dist 33% 6% 61% 227 Second Cong. Dist 29% 10% 61% 214

Business Conditions in NH 12 Months
Good Times Mixed Bad Times (N) STATEWIDE 63% 22% 15% 408 Democrat 70% 17% 13% 168 Independent 52% 27% 21% 64 Republican 59% 25% 16% 154 Liberal 69% 18% 13% 113 Moderate 70% 16% 13% 145 Conservative 49% 32% 19% 106 Support Tea Party 53% 36% 10% 47 Neutral 61% 21% 18% 161 Oppose Tea Party 70% 16% 14% 168 Employed Full Time 63% 23% 13% 232 Employed Part Time 67% 7% 26% 54 Retired/Not Working 60% 26% 14% 77 Union household 65% 25% 10% 42 Non-union 62% 22% 16% 347 Read Union Leader 58% 17% 26% 78 Read Boston Globe 83% 10% 7% 40 Read Local Newspapers 66% 20% 14% 137 Watch WMUR 66% 20% 14% 226 Listen to NHPR 65% 22% 14% 138 Listen to Conserv. Radio 40% 41% 19% 41 10 yrs or less in NH 69% 24% 8% 45 11 to 20 years 60% 20% 20% 86 More than 20 years 64% 21% 15% 253 18 to 34 73% 17% 10% 103 35 to 49 55% 28% 17% 105 50 to 64 60% 21% 19% 111 65 and over 66% 19% 15% 69 Male 62% 25% 14% 201 Female 64% 20% 16% 206 High school or less 59% 24% 18% 77 Some college 63% 22% 14% 90 College graduate 63% 21% 16% 141 Post-graduate 67% 20% 13% 85 Less than $30K 42% 21% 38% 33 $30K to $60K 66% 20% 13% 56 $60K to $75K 74% 18% 7% 40 $75K to $100K 59% 17% 24% 41 $100K or more 70% 18% 12% 122 North Country 72% 25% 3% 30 Central / Lakes 72% 11% 16% 79 Connecticut Valley 53% 27% 20% 58 Mass Border 56% 24% 20% 95 Seacoast 76% 12% 12% 67 Manchester Area 54% 35% 10% 77 First Cong. Dist 64% 24% 13% 210 Second Cong. Dist 62% 21% 17% 198

Business Conditions in US in 12 Months
Good Times Mixed Bad Times (N) STATEWIDE 47% 23% 30% 407 Democrat 57% 19% 24% 167 Independent 32% 33% 35% 70 Republican 41% 22% 37% 149 Liberal 54% 21% 25% 106 Moderate 48% 24% 28% 147 Conservative 39% 22% 40% 113 Support Tea Party 35% 35% 30% 53 Neutral 41% 23% 36% 157 Oppose Tea Party 57% 18% 25% 166 Employed Full Time 46% 24% 29% 233 Employed Part Time 47% 20% 33% 48 Retired/Not Working 50% 21% 29% 79 Union household 40% 34% 26% 43 Non-union 48% 21% 31% 348 Read Union Leader 48% 11% 41% 80 Read Boston Globe 45% 13% 42% 41 Read Local Newspapers 46% 24% 30% 131 Watch WMUR 47% 20% 33% 228 Listen to NHPR 57% 22% 20% 133 Listen to Conserv. Radio 37% 26% 37% 38 10 yrs or less in NH 55% 16% 29% 50 11 to 20 years 42% 24% 34% 86 More than 20 years 48% 23% 29% 250 18 to 34 51% 24% 25% 106 35 to 49 42% 23% 35% 107 50 to 64 45% 22% 33% 108 65 and over 55% 20% 25% 67 Male 48% 23% 29% 202 Female 45% 23% 32% 205 High school or less 40% 17% 43% 84 Some college 46% 22% 32% 88 College graduate 52% 23% 24% 133 Post-graduate 47% 26% 27% 90 Less than $30K 45% 6% 49% 34 $30K to $60K 41% 23% 36% 54 $60K to $75K 39% 41% 20% 42 $75K to $100K 47% 20% 32% 42 $100K or more 56% 17% 28% 124 North Country 50% 24% 26% 33 Central / Lakes 60% 11% 29% 75 Connecticut Valley 40% 34% 27% 60 Mass Border 40% 25% 35% 99 Seacoast 49% 17% 34% 69 Manchester Area 43% 29% 28% 73 First Cong. Dist 43% 23% 34% 208 Second Cong. Dist 50% 23% 27% 200

5 Year Economic Outlook – U.S.
Widespread Continuous Unemployment/ Good Times Mixed Depression (N) STATEWIDE 39% 27% 34% 399 Democrat 49% 25% 26% 163 Independent 15% 29% 56% 63 Republican 38% 30% 33% 152 Liberal 53% 20% 27% 104 Moderate 34% 37% 29% 141 Conservative 36% 25% 39% 110 Support Tea Party 30% 26% 44% 54 Neutral 32% 28% 39% 151 Oppose Tea Party 50% 26% 24% 161 Employed Full Time 36% 31% 33% 228 Employed Part Time 24% 20% 57% 49 Retired/Not Working 52% 28% 20% 77 Union household 40% 45% 15% 44 Non-union 38% 25% 37% 339 Read Union Leader 36% 24% 40% 80 Read Boston Globe 47% 24% 29% 42 Read Local Newspapers 43% 31% 26% 129 Watch WMUR 43% 29% 28% 222 Listen to NHPR 48% 24% 28% 133 Listen to Conserv. Radio 34% 21% 46% 39 10 yrs or less in NH 42% 15% 43% 50 11 to 20 years 39% 22% 39% 86 More than 20 years 39% 32% 30% 242 18 to 34 35% 19% 45% 107 35 to 49 29% 34% 37% 102 50 to 64 44% 27% 29% 108 65 and over 56% 30% 14% 63 Male 39% 28% 33% 204 Female 39% 26% 35% 195 High school or less 31% 21% 48% 87 Some college 32% 31% 36% 82 College graduate 45% 26% 28% 130 Post-graduate 43% 32% 25% 88 Less than $30K 36% 19% 45% 33 $30K to $60K 38% 26% 35% 57 $60K to $75K 30% 35% 35% 39 $75K to $100K 45% 30% 25% 44 $100K or more 41% 30% 29% 115 North Country 49% 20% 31% 36 Central / Lakes 40% 29% 31% 74 Connecticut Valley 42% 27% 31% 52 Mass Border 31% 25% 44% 96 Seacoast 43% 33% 24% 67 Manchester Area 39% 26% 35% 75 First Cong. Dist 38% 29% 33% 205 Second Cong. Dist 40% 25% 35% 195

Good Time to Buy Major Household Item
Good Time Pro-Con Bad Time (N) STATEWIDE 68% 9% 22% 430 Democrat 73% 6% 21% 178 Independent 59% 9% 33% 66 Republican 65% 14% 21% 162 Liberal 73% 5% 22% 115 Moderate 70% 11% 19% 156 Conservative 60% 12% 27% 116 Support Tea Party 54% 18% 28% 56 Neutral 66% 10% 24% 171 Oppose Tea Party 76% 6% 18% 171 Employed Full Time 69% 8% 23% 246 Employed Part Time 69% 6% 25% 58 Retired/Not Working 64% 15% 21% 80 Union household 77% 9% 14% 49 Non-union 66% 10% 24% 361 Read Union Leader 58% 8% 34% 85 Read Boston Globe 68% 3% 30% 46 Read Local Newspapers 66% 14% 21% 141 Watch WMUR 68% 11% 21% 239 Listen to NHPR 69% 9% 22% 148 Listen to Conserv. Radio 49% 19% 32% 46 10 yrs or less in NH 57% 8% 35% 52 11 to 20 years 71% 9% 20% 94 More than 20 years 68% 10% 22% 262 18 to 34 71% 3% 26% 109 35 to 49 61% 14% 26% 114 50 to 64 68% 12% 20% 112 65 and over 73% 10% 17% 73 Male 70% 11% 18% 215 Female 67% 8% 26% 214 High school or less 65% 8% 27% 90 Some college 57% 11% 31% 89 College graduate 71% 8% 21% 140 Post-graduate 74% 12% 13% 94 Less than $30K 55% 11% 34% 36 $30K to $60K 62% 5% 33% 67 $60K to $75K 81% 12% 7% 41 $75K to $100K 81% 3% 16% 44 $100K or more 71% 10% 19% 126 North Country 63% 10% 27% 39 Central / Lakes 71% 7% 22% 83 Connecticut Valley 60% 11% 29% 58 Mass Border 65% 13% 21% 103 Seacoast 73% 7% 20% 72 Manchester Area 74% 7% 19% 75 First Cong. Dist 71% 10% 19% 218 Second Cong. Dist 66% 9% 25% 212