The Better Obstetrics in Rural Nigeria (BORN) · PDF file · 2015-09-15The Better...
85
C O R P O R A T I O N Research Report The Better Obstetrics in Rural Nigeria (BORN) Study An Impact Evaluation of the Nigerian Midwives Service Scheme Edward N. Okeke, Peter Glick, Isa Sadeeq Abubakar, A.V. Chari, Emma Pitchforth, Josephine Exley, Usman Bashir, Claude Messan Setodji, Kun Gu, Obinna Onwujekwe
-
Upload
truongkhue -
Category
Documents
-
view
214 -
download
0
Transcript of The Better Obstetrics in Rural Nigeria (BORN) · PDF file · 2015-09-15The Better...

C O R P O R A T I O N
Research Report
The Better Obstetrics in Rural Nigeria (BORN) Study
An Impact Evaluation of the Nigerian Midwives Service Scheme
Edward N. Okeke, Peter Glick, Isa Sadeeq Abubakar, A.V. Chari, Emma Pitchforth, Josephine Exley, Usman Bashir, Claude Messan Setodji, Kun Gu, Obinna Onwujekwe

Limited Print and Electronic Distribution Rights
This document and trademark(s) contained herein are protected by law. This representation of RAND intellectual property is provided for noncommercial use only. Unauthorized posting of this publication online is prohibited. Permission is given to duplicate this document for personal use only, as long as it is unaltered and complete. Permission is required from RAND to reproduce, or reuse in another form, any of its research documents for commercial use. For information on reprint and linking permissions, please visit www.rand.org/pubs/permissions.html.
The RAND Corporation is a research organization that develops solutions to public policy challenges to help make communities throughout the world safer and more secure, healthier and more prosperous. RAND is nonprofit, nonpartisan, and committed to the public interest.
RAND’s publications do not necessarily reflect the opinions of its research clients and sponsors.
Support RANDMake a tax-deductible charitable contribution at
www.rand.org/giving/contribute
www.rand.org
For more information on this publication, visit www.rand.org/t/rr1215
Published by the RAND Corporation, Santa Monica, Calif.
© Copyright 2015 RAND Corporation
R® is a registered trademark.

iii
Preface
Limited availability of skilled providers, particularly in rural areas, is thought to be an important constraint to increasing rates of use of maternal and child health services in low- and middle-income countries. There are, however, few well-identified studies of the relationship between the supply of skilled workers and outcomes. In this project, we studied the effects of a government program in Nigeria that sought to alleviate supply-side constraints by deploying skilled midwives to primary health facilities in rural communities to provide round-the-clock access to skilled care.
The contents of this report will be of interest to policymakers and public health professionals interested in improving maternal and child health.
This work was supported by the International Initiative for Impact Evaluation (3ie). The research was produced within RAND Health, a division of the RAND Corporation.

iv
Contents
Preface ........................................................................................................................................................................... iii Figures.............................................................................................................................................................................v Tables ............................................................................................................................................................................ vi Summary ...................................................................................................................................................................... vii Abbreviations and Acronyms ..................................................................................................................................... viii Acknowledgments ......................................................................................................................................................... ix 1. Introduction .................................................................................................................................................................1 2. Program Description ...................................................................................................................................................4
2.1 Context .................................................................................................................................................................4 2.2 The Midwives Service Scheme ............................................................................................................................4 2.3 Theory of Change ................................................................................................................................................6
3. Study Design ...............................................................................................................................................................8 3.2 Study Sample .......................................................................................................................................................9
4. Data ...........................................................................................................................................................................11 4.1 Household Surveys ............................................................................................................................................11 4.2 Clinic Surveys ....................................................................................................................................................12 4.3 Semi-Structured Interviews ................................................................................................................................12 4.4 Focus Group Discussions ...................................................................................................................................15
5. Analytical Strategy ....................................................................................................................................................16 5.1 Analysis of Qualitative Data ..............................................................................................................................18 5.2 Integration of Qualitative and Quantitative Findings ........................................................................................18
6. Study Findings: Impacts ...........................................................................................................................................19 6.1 Effect of the MSS on Access to Skilled Care ....................................................................................................21 6.2 Effect of the MSS on Utilization .......................................................................................................................21 6.3 Effect of the MSS on Maternal and Child Health ..............................................................................................32 6.4 Heterogeneous Effects .......................................................................................................................................33
7. Study Findings: Mechanisms of Action ....................................................................................................................39 8. Discussion and Policy Recommendations ................................................................................................................52
8.1 Near-Term Strategies .........................................................................................................................................53 8.2 Longer-Term Policy Recommendations ............................................................................................................58
Appendix A: Survey Instruments ..................................................................................................................................60 Appendix B: Pre-Analysis Plan ....................................................................................................................................64 Appendix C: Sample Size and Power Calculations ......................................................................................................68 References .....................................................................................................................................................................71

v
Figures
Figure 1: Theory of Change ............................................................................................................ 7 Figure 2: Overview of Study Design .............................................................................................. 8 Figure 3: Graphical Illustration of Design ...................................................................................... 9 Figure 4: Effect of the MSS on Antenatal Use in Study Clinics ................................................. 22 Figure 5: Effect of the MSS on Overall Antenatal Care Use ........................................................ 23 Figure 6: Effect of the MSS on Delivery in the Study Clinic ....................................................... 24 Figure 7: Effect of the MSS on Institutional Deliveries ............................................................... 25 Figure 8: Effect of the MSS on Skilled Birth Attendance ............................................................ 26 Figure 9: Program Effects over Time: Antenatal Care ................................................................. 28 Figure 10: Program Effects over Time: Delivery ......................................................................... 30 Figure 11: Program Effects over Time: Postnatal Care and Immunizations ................................ 32 Figure 12: Heterogeneous Program Effects for Utilization Outcomes by Region ....................... 37 Figure 13: Number of MSS Midwives in MSS Clinics in 2014 ................................................... 39 Figure 14: Number of Midwives and Midwife Tenure by Zone ................................................. 40 Figure 15: Median Number of Months’ Salary Owed .................................................................. 43 Figure 16: Average Ratings Given by Midwives ......................................................................... 55 Figure 17: Ranking of Potential Improvements ............................................................................ 56
vi
Tables
Table 1: Distribution of Health Facilities ....................................................................................... 5 Table 2: Overview of Interviews and Focus Groups .................................................................... 10 Table 3: Sample Distribution ........................................................................................................ 11 Table 4: Participant Characteristics (Midwives) ........................................................................... 14 Table 5: Participant Characteristics (women who gave birth in the last 6 months) ..................... 14 Table 6: Focus Groups .................................................................................................................. 15 Table 7: Baseline Characteristics and Balance ............................................................................. 19 Table 8: Testing for Equality of Pre-Trend ................................................................................... 20 Table 9: Effect of the MSS on Access .......................................................................................... 21 Table 10: Effect of the MSS on Antenatal Care ........................................................................... 27 Table 11: Effect of the MSS on Institutional Delivery and Skilled Birth Attendance ................. 29 Table 12: Effect of the MSS on Postnatal Care and Child Immunizations .................................. 31 Table 13: Effect of the MSS on Health Outcomes ....................................................................... 33 Table 14: Heterogeneous Program Effects by Region .................................................................. 35 Table 15: Heterogeneous Program Effects by Individual-Level Characteristics .......................... 38 Table A.1. Overview of Selected Characteristics of MSS Clinics ............................................... 61 Table A.2: Detailed Participant Characteristics (Semistructured Interviews with Eligible
Women) ................................................................................................................................. 62 Table C.1: Detectable Effect Sizes for Utilization Outcomes ...................................................... 68 Table C.2: Detectable Effect Sizes for Maternal Complications .................................................. 69 Table C.3: Detectable Effect Sizes for Neonatal Mortality .......................................................... 69
vii
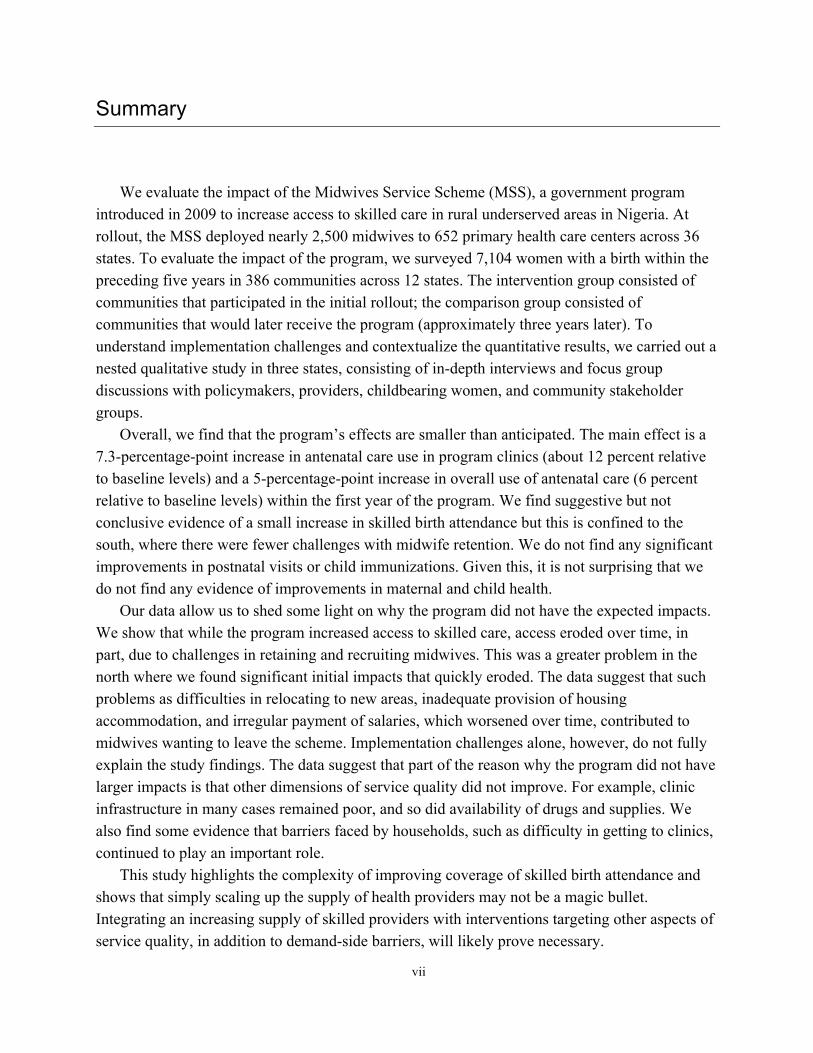
Summary
We evaluate the impact of the Midwives Service Scheme (MSS), a government program introduced in 2009 to increase access to skilled care in rural underserved areas in Nigeria. At rollout, the MSS deployed nearly 2,500 midwives to 652 primary health care centers across 36 states. To evaluate the impact of the program, we surveyed 7,104 women with a birth within the preceding five years in 386 communities across 12 states. The intervention group consisted of communities that participated in the initial rollout; the comparison group consisted of communities that would later receive the program (approximately three years later). To understand implementation challenges and contextualize the quantitative results, we carried out a nested qualitative study in three states, consisting of in-depth interviews and focus group discussions with policymakers, providers, childbearing women, and community stakeholder groups.
Overall, we find that the program’s effects are smaller than anticipated. The main effect is a 7.3-percentage-point increase in antenatal care use in program clinics (about 12 percent relative to baseline levels) and a 5-percentage-point increase in overall use of antenatal care (6 percent relative to baseline levels) within the first year of the program. We find suggestive but not conclusive evidence of a small increase in skilled birth attendance but this is confined to the south, where there were fewer challenges with midwife retention. We do not find any significant improvements in postnatal visits or child immunizations. Given this, it is not surprising that we do not find any evidence of improvements in maternal and child health.
Our data allow us to shed some light on why the program did not have the expected impacts. We show that while the program increased access to skilled care, access eroded over time, in part, due to challenges in retaining and recruiting midwives. This was a greater problem in the north where we found significant initial impacts that quickly eroded. The data suggest that such problems as difficulties in relocating to new areas, inadequate provision of housing accommodation, and irregular payment of salaries, which worsened over time, contributed to midwives wanting to leave the scheme. Implementation challenges alone, however, do not fully explain the study findings. The data suggest that part of the reason why the program did not have larger impacts is that other dimensions of service quality did not improve. For example, clinic infrastructure in many cases remained poor, and so did availability of drugs and supplies. We also find some evidence that barriers faced by households, such as difficulty in getting to clinics, continued to play an important role.
This study highlights the complexity of improving coverage of skilled birth attendance and shows that simply scaling up the supply of health providers may not be a magic bullet. Integrating an increasing supply of skilled providers with interventions targeting other aspects of service quality, in addition to demand-side barriers, will likely prove necessary.
viii
Abbreviations and Acronyms
3ie International Initiative for Impact Evaluation ANC Antenatal Care BEOC Basic Emergency Obstetric Care CEOC Comprehensive Emergency Obstetric Care CHEW Community-Health Extension Worker DID difference-in-difference HOD Head of Department IMNCH Integrated Maternal, Newborn and Child Health JSY Janani Suraksha Yojana LGA Local Government Authority LSS Life Saving Skills MCH maternal and child health MDG Millennium Development Goals MHVS Maternal Health Voucher Scheme MMR Maternal Mortality Ratio MNCH Maternal, Newborn and Child Health MOH Ministry of Health MSS Midwives Service Scheme NPHCDA National Primary Health Care Development Agency OIC Officer-in-Charge PHC Primary Health Care Clinic SDIP Safe Delivery Incentives Program SURE-P Subsidy Reinvestment Program TBA Traditional Birth Attendant WDC Ward Development Committee WHO World Health Organisation

ix
Acknowledgments
We are grateful to the International Initiative for Impact Evaluation (3ie) for funding this evaluation. We are also grateful to Dr. Muhammad Pate, the former Minister of State for Health, Federal Ministry of Health, Nigeria and former Executive Director of the National Primary Health Care Development Agency (NPHCDA), who first told us about the Midwives Service Scheme and introduced us to the relevant people at the agency, and to the current Executive Director of the NPHCDA, Dr. Ado Muhammad, and his staff who have all been very supportive of this study. We are especially grateful to Dr. Nnenna Ihebuzor, Director of Primary Health Care Systems Development, whose support has been invaluable. We also thank Mrs. Ifeyinwa Onwudinjo and Dr. Usman Abdulkadir, both Assistant Directors at the NPHCDA who patiently answered our questions, provided relevant background information and helped to facilitate the data collection. We also acknowledge Dr. Ugo Okoli, Director of the Subsidy Reinvestment Program Maternal and Child Health (SURE-P MCH) program, for her willingness to share data and provide additional information. Finally, we thank the study participants who gave generously of their time, and all the field staff who did the actual work, sometimes traveling great distances to collect the data required for this evaluation.

1
1. Introduction
One of the major global health challenges of the 21st century is reducing the approximately 3 million newborn deaths, 7 million under-five deaths, and 300,000 maternal deaths that occur globally each year.1 This health burden is not uniformly distributed, with most deaths occurring in the poorest regions of the world; 87 percent of maternal deaths and 37 percent of neonatal deaths, for example, occur in sub-Saharan Africa (Wang, Alva, Wang, & Fort, 2011). The startling difference in a woman’s risk of dying during pregnancy or childbirth—1 in 6 in some parts of Africa compared to about 1 in 2,400 in developed countries—has been referred to as the “largest discrepancy of all public-health statistics” (Mahler, 1987).
Pregnancy-related morbidity and mortality have serious economic and social consequences, with estimates of the global productivity losses attributable to maternal and newborn deaths reaching approximately US $15 billion annually (USAID, 2001). Maternal ill health and death have far-reaching effects on child and household welfare. Research shows that surviving children in a household experiencing a maternal death are more likely to be stunted, less likely to attend school, and more likely to have higher incidences of depression (Beegle, De Weerdt, Friedman, & Gibson, 2010; Case & Ardington, 2006; Islam & Gerdtham, 2006).
It is widely believed that many maternal and neonatal deaths are preventable (Ronsmans et al., 2003; WHO, ICM, & FIGO, 2004).2 Simulation-based studies, for example, have estimated that up to a third of maternal deaths, and up to half of newborn deaths, may be prevented by increasing coverage rates for skilled attendance at delivery (Bhutta et al., 2014; Goldie et al., 2010; Graham, Bell, & Bullough, 2001).3 There is therefore a strong global push to increase rates of use of maternal and child health services; in particular antenatal care, institutional deliveries, and postnatal care. Many well-known indices now track these indicators. There is, however, still uncertainty about how best to achieve these policy goals.
A significant amount of effort has been devoted to eliminating demand-side barriers, with a growing number of countries implementing programs that provide financial incentives to use maternal and child health services (Murray et al., 2014). The Janani Suraksha Yojana (JSY) in India, the Safe Delivery Incentives Program (SDIP) in Nepal, and the Maternal Health Voucher
1 This is the focus of two of the eight Millennium Development Goals (MDG). 2 A Lancet series on the Millennium Development Goals has argued that MDG will best be achieved “by adopting a core strategy of health center-based intrapartum care” (Filippi et al., 2006). 2 A Lancet series on the Millennium Development Goals has argued that MDG will best be achieved “by adopting a core strategy of health center-based intrapartum care” (Filippi et al., 2006). 3 This is important given that nearly 60 million births worldwide take place outside of health facilities (Darmstadt et al., 2009). In sub-Saharan Africa and South Asia, the two regions that account for most deaths, nearly 60 percent of all births take place at home (Montagu et al., 2011).

2
Scheme (MHVS) in Bangladesh are examples of such programs. The impact of these programs is still unclear. Recent evaluations however find surprisingly little evidence of health effects (Debnath, 2013; Mazumdar, Mills, & Powell-Jackson, 2011; Mohanan et al., 2014; Randive, Diwan, & De Costa, 2013). Attention is increasingly being turned to the supply side, as studies continue to document significant problems with care delivery, including a lack of skilled providers, suboptimal provider effort, provider absenteeism, and lack of necessary infrastructure to provide high-quality care (Barber & Gertler, 2009; Das, Hammer, & Leonard, 2008; Harvey et al., 2007; Leonard & Masatu, 2010).
In this project, we study the effects of a unique government program in Nigeria that sought to alleviate supply-side constraints by deploying skilled midwives to primary health facilities in rural communities to provide round-the-clock access to skilled obstetric care.4 This program, known as the Midwives Service Scheme (MSS), was rolled out in 2009 and involved the deployment of nearly 2,500 midwives to 652 primary health care clinics. The goal was to double the rate of skilled birth attendance in intervention areas by 2015. To evaluate the impact of the program, we undertook a mixed-methods evaluation in 2014. We collected data on outcomes for nearly 10,000 births within the preceding five years in 386 communities, split equally between MSS (intervention) and non-MSS (comparison) areas. To understand implementation challenges and contextualize the quantitative results, we carried out a nested qualitative study in three states, consisting of in-depth interviews and focus group discussions with policymakers, providers, childbearing women, and community stakeholder groups.
This study makes an important contribution to a growing literature evaluating the effects of policies and programs designed to increase use of maternal and child health services and improve outcomes in developing countries. Much of this literature has focused on demand-side initiatives such as conditional cash transfers (Lim et al., 2010; Powell-Jackson & Hanson, 2012), transportation subsidies (Ekirapa-Kiracho et al., 2011), voucher schemes (Bellows, Bellows, & Warren, 2011; Nguyen et al., 2012; Obare et al., 2013), and negative incentives or penalties (Godlonton & Okeke, 2015).5 Supply-side studies are considerably less common (Kumar & Dansereau, 2014). Limited availability of skilled providers, particularly in rural areas, is thought to be an important supply-side constraint, but there are few well-identified studies of the relationship between the supply of skilled workers and outcomes. Existing studies are often cross-sectional in nature (Anand & Bärnighausen, 2004; Sousa, Dal Poz, & Boschi-Pinto, 2013), making causal inference challenging. In this study, we leverage the increase in skilled worker
4 A majority of these health facilities were staffed by lower-level health workers prior to implementation of the program. 5 This literature generally finds increased demand for services but little evidence of improvement in health outcomes.

3
supply provided by the MSS to generate important evidence about the relationship between supply of skilled providers, use of services, and health outcomes.6
In Section 2, we provide institutional detail about the Midwives Service Scheme, in Section 3 we outline the study design, in Section 4 we discuss data collection, in Section 5 we present the analytical strategy, in Section 6 we present the impact findings, in Section 7 we discuss potential mechanisms of action, and in Section 8 we outline policy recommendations and our conclusions.
6 This study is also related to the economic literature that studies how changes in physical access to health providers affect health outcomes. Examples of this literature include Buchmueller et al., who study the effect of hospital closures in California on adult mortality, and Valente who studies the effect of the opening of abortion centers on neonatal outcomes in Nepal (Buchmueller, Jacobson, & Wold, 2006; Valente, 2014).

4
2. Program Description
2.1 Context
Every year, more than 50,000 Nigerian women die from pregnancy-related complications (National Primary Care Development Agency (NPHCDA), 2010). The chance of a woman dying during pregnancy and childbirth in Nigeria is approximately 1 in 30 compared to about 1 in 2,400 in developed countries. In 2008, the maternal mortality ratio (MMR) was estimated at 545 per 100,000 live births, increasing to over 800 per 100,000 births in rural areas (National Population Commission (NPC) [Nigeria] and ICF Macro, 2009). Infants also experience poor health outcomes, with an estimated 250,000 newborn deaths annually and a neonatal mortality rate of about 37 per 1,000 live births. These high rates of mortality have been attributed in part to low utilization of maternal, neonatal, and child health (MNCH) services: Only 39 percent of births in Nigeria are attended by a skilled health provider, and only about 35 percent of deliveries occur in health facilities. Similar patterns are found for use of prenatal and postnatal care. In many health facilities across the country, there is a shortage of skilled providers (doctors, nurses, and midwives), and this has been reported to impact negatively on utilization of MNCH services: According to a baseline survey, 50 percent of rural health facilities did not have a single midwife (National Primary Care Development Agency (NPHCDA), 2010). There are large systematic differences between geographic regions in use of maternal and child health services: Only 10 percent of births were assisted by a skilled provider in the northwest, compared to 82 percent in the southeast. There are also systematic differences by socioeconomic status: Only 7 percent of births among households in the poorest quintile took place in a health facility (67 percent in a public facility), compared to 80 percent of births among the richest households (47 percent in a public facility).
2.2 The Midwives Service Scheme The Midwives Service Scheme (MSS) was created by the Nigerian government in 2009 to
reduce maternal and infant mortality in rural underserved areas in Nigeria. Funded by debt relief funds under a 2009 Appropriations Act, its key feature was the recruitment and deployment of newly qualified, unemployed, and retired midwives to public primary health facilities.7 The program was designed to be a collaborative effort between all three tiers of government—federal, state, and local—formalized in a memorandum of understanding (MOU): The federal
7 Approximately 45 percent of the midwives hired were previously unemployed, 44 percent were newly trained, and 11 percent were in retirement (Abimbola et al., 2012).

5
government recruited and deployed the midwives, paid their monthly salary (N30,000—approximately 200 USD)8 and provided health insurance, and supplied clinics with midwifery kits, basic equipment and drugs, and health registers; state governments paid additional allowances to midwives (N20,000 per month), provided support to general hospitals to serve as referral facilities,9 and provided monitoring and supervision; local governments paid a supplementary allowance of N10,000 and provided free accommodation for the midwives in the local community.
The MSS was rolled out nationally in 652 rural health facilities in 2009. Participating clinics met a minimum set of criteria. They had to be in hard-to-reach areas or among underserved populations (defined as facilities serving a catchment area population of 10,000–30,000 people), have a potable water supply and offer 24-hour basic health services, and have a minimum set of equipment and basic laboratory facilities for malaria and anemia (NPHCDA, 2010). The distribution of MSS facilities was determined largely by geographic location. States in the northeast and northwest zones (classified as very high maternal mortality zones) were assigned 24 facilities each, states in the north-central and south-south (classified as high mortality zones) were assigned 16 facilities each, and states in the southwest and southeast (classified as moderate mortality zones) were assigned 12 facilities each. See Table 1.
Table 1: Distribution of Health Facilities
Region Number of States/Region Number of Clinics/State
Northeast 6 24
Northwest 7 24
North-Central 7 16
South-South 6 16
Southeast 5 12
Southwest 6 12
Recruitment and hiring of midwives was managed by the NPHCDA. Following recruitment,
midwives underwent a brief period of training before being deployed to health facilities. In total, 2,488 midwives were deployed.10 Midwives signed initial one-year contracts, renewable subject to satisfactory performance.
8 According to the World Bank Databank, Nigeria’s GDP per capita in 2008 was 1,376 USD. 9 Each MSS clinic was linked to a general hospital to facilitate referral of more serious cases. Four clinics were linked to a general hospital in a cluster model. 10 Even though the MSS was officially launched in December 2009, clinics started receiving midwives as early as October, with most clinics receiving midwives in November. Each clinic was supposed to receive four midwives (four was the number chosen to allow midwives to run shifts to provide 24-hour coverage).

6
To create awareness, the program was extensively publicized. Program communication targeted political leaders, decision-makers, and clients through radio and TV ads, billboards and posters, and community outreach. In each participating community, a ward development committee (WDC) was also established. WDCs were made up of influential people in the community and were intended to provide support to the midwives, enhance community participation, and promote demand for services. MSS midwives took part in monthly WDC meetings where they briefed the community on their work, including any challenges they faced, and addressed any concerns raised by the community.
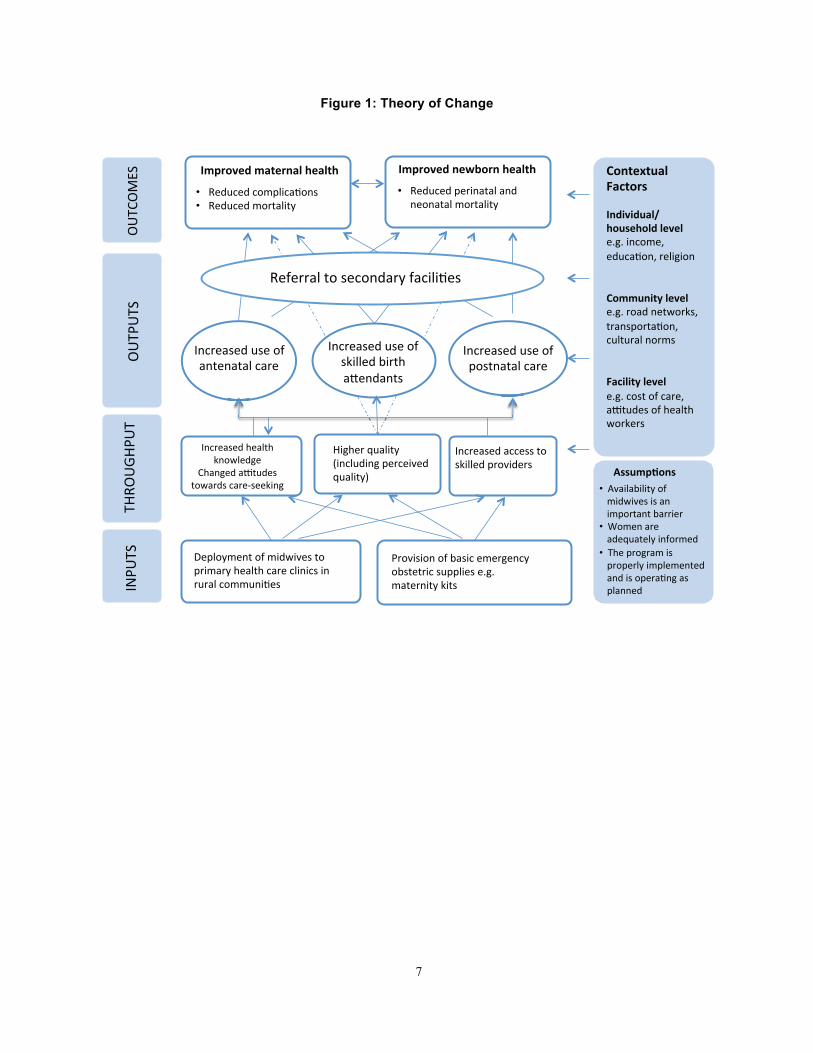
2.3 Theory of Change In Figure 1, we lay out our hypothesized theory of change. As we have already noted, the
MSS was designed to improve access to skilled care. Pregnant women and young children are the target group for the intervention. The intervention is expected to increase rates of antenatal care (measured by number of visits and fraction of women completing the WHO recommended four or more visits), intra-partum care (measured by rates of skilled birth attendance and rates of institutional deliveries), and postnatal care (measured by postnatal check-ups and child vaccinations). Potential mechanisms of action include improved access, improvements in the quality of services provided (including perceived quality), and changes in knowledge and attitudes towards care seeking. Improvements in access, perceived quality, and changes in attitudes are expected to lead to greater demand for services, which in turn is expected to lead to reductions in pregnancy-related complications and mortality.
It is worth pointing out that increasing provider supply is a necessary, but not sufficient, condition for improving access. Numerous studies, for example, have highlighted the problem of health worker absence and its impact on utilization (Banerjee & Duflo, 2008; Goldstein et al., 2013), and Nigerian Demographic and Health Survey data suggests that this is an important consideration—33 percent of Nigerian women cited provider availability as a serious problem in accessing health services (National Population Commission (NPC) [Nigeria] and ICF Macro, 2009). If the MSS midwives are not (always) available in the clinics, then access may not necessarily improve, and thus one might see small impacts on utilization despite the increase in supply of midwives.
As with all complex interventions, program effects assume successful implementation and operation of the intervention. Figure 1 also highlights important contextual variables that may not be directly affected by the program but which may nevertheless mediate its impact. These include households and individual-level variables, such as income and education; community-level variables, such as the road and transportation networks in the community; and clinic-level variables, such as user charges and health worker attitudes.
7
Figure 1: Theory of Change
Deployment$of$midwives$to$primary$health$care$clinics$in$rural$communi=es$
Provision$of$basic$emergency$obstetric$supplies$e.g.$maternity$kits$IN
PUTS$
THRO
UGH
PUT$
OUTPUTS$
OUTCOMES$
Contextual)Factors)
Higher$quality$(including$perceived$quality)$
Increased$use$of$$antenatal$care$
Increased$use$of$skilled$birth$aSendants$
Increased$use$of$$postnatal$care$
Referral$to$secondary$facili=es$
Improved)maternal)health)) Improved)newborn)health))
Assump=ons)
• Reduced$complica=ons$• Reduced$mortality$
• Reduced$perinatal$and$neonatal$mortality$
Increased$access$to$$skilled$providers$$
Increased$health$$knowledge$
Changed$aTtudes$towards$careUseeking$
Individual/household)level)e.g.$income,$educa=on,$religion$$$Community)level)e.g.$road$networks,$transporta=on,$cultural$norms$$$Facility)level)e.g.$cost$of$care,$aTtudes$of$health$workers$$
• Availability$of$midwives$is$an$important$barrier$$• Women$are$adequately$informed$$• The$program$is$properly$implemented$and$is$opera=ng$as$planned$
8
3. Study Design
3.1 Overview
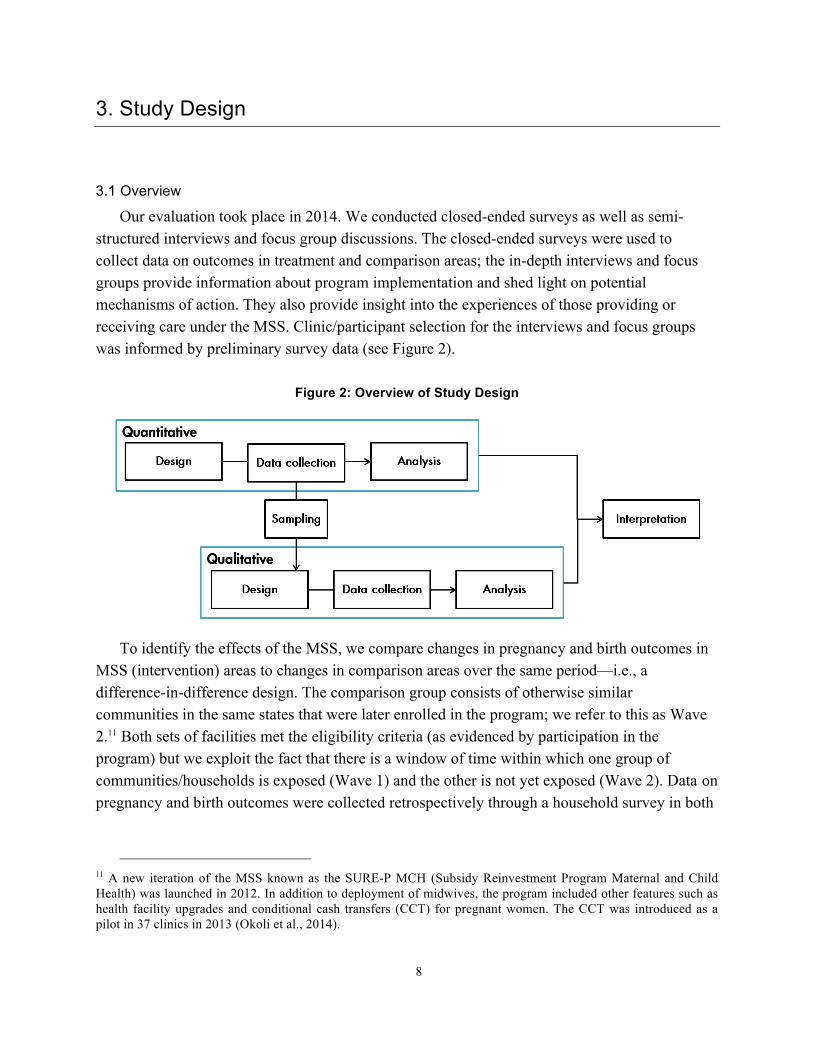
Our evaluation took place in 2014. We conducted closed-ended surveys as well as semi-structured interviews and focus group discussions. The closed-ended surveys were used to collect data on outcomes in treatment and comparison areas; the in-depth interviews and focus groups provide information about program implementation and shed light on potential mechanisms of action. They also provide insight into the experiences of those providing or receiving care under the MSS. Clinic/participant selection for the interviews and focus groups was informed by preliminary survey data (see Figure 2).
Figure 2: Overview of Study Design
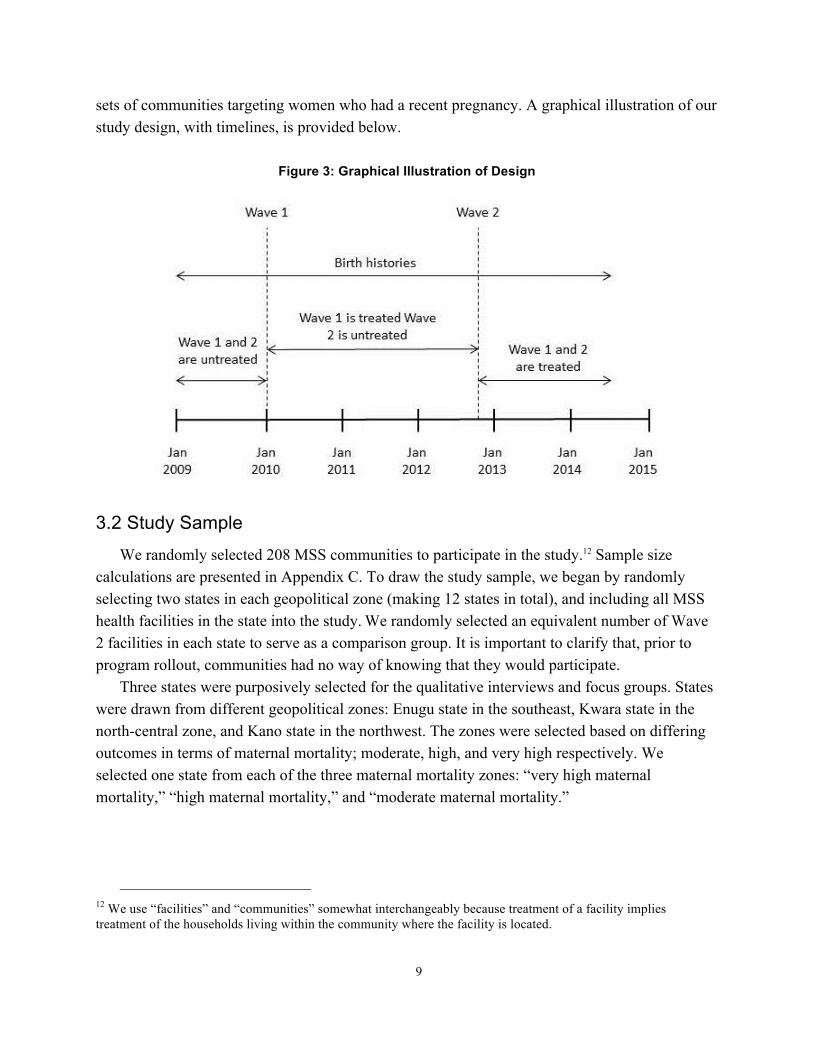
To identify the effects of the MSS, we compare changes in pregnancy and birth outcomes in MSS (intervention) areas to changes in comparison areas over the same period—i.e., a difference-in-difference design. The comparison group consists of otherwise similar communities in the same states that were later enrolled in the program; we refer to this as Wave 2.11 Both sets of facilities met the eligibility criteria (as evidenced by participation in the program) but we exploit the fact that there is a window of time within which one group of communities/households is exposed (Wave 1) and the other is not yet exposed (Wave 2). Data on pregnancy and birth outcomes were collected retrospectively through a household survey in both
11 A new iteration of the MSS known as the SURE-P MCH (Subsidy Reinvestment Program Maternal and Child Health) was launched in 2012. In addition to deployment of midwives, the program included other features such as health facility upgrades and conditional cash transfers (CCT) for pregnant women. The CCT was introduced as a pilot in 37 clinics in 2013 (Okoli et al., 2014).
9
sets of communities targeting women who had a recent pregnancy. A graphical illustration of our study design, with timelines, is provided below.
Figure 3: Graphical Illustration of Design
3.2 Study Sample
We randomly selected 208 MSS communities to participate in the study.12 Sample size calculations are presented in Appendix C. To draw the study sample, we began by randomly selecting two states in each geopolitical zone (making 12 states in total), and including all MSS health facilities in the state into the study. We randomly selected an equivalent number of Wave 2 facilities in each state to serve as a comparison group. It is important to clarify that, prior to program rollout, communities had no way of knowing that they would participate.
Three states were purposively selected for the qualitative interviews and focus groups. States were drawn from different geopolitical zones: Enugu state in the southeast, Kwara state in the north-central zone, and Kano state in the northwest. The zones were selected based on differing outcomes in terms of maternal mortality; moderate, high, and very high respectively. We selected one state from each of the three maternal mortality zones: “very high maternal mortality,” “high maternal mortality,” and “moderate maternal mortality.”
12 We use “facilities” and “communities” somewhat interchangeably because treatment of a facility implies treatment of the households living within the community where the facility is located.

10
Table 2: Overview of Interviews and Focus Groups
Detail Focus
Interviews
Policymakers Policymakers at federal, state and local levels
Perceived barriers and facilitators to implementation, focusing on areas of single and shared responsibility Sustainability of the scheme Experiences and understanding of how the MSS will lead to improved outcomes and its success in doing this
Midwives
MSS midwives deployed to PHCs
Barriers and facilitators to implementation as perceived by midwives How midwives are able to contribute to improvements in maternal health, particularly through improved accessibility, quality of care and information spillover
Women
Given birth in the last six months
To understand women’s ‘journey of care’ Interaction with the MSS and other care services throughout pregnancy and childbirth Views and experiences relating to accessibility and quality Subsequent MNCH care seeking
Focus Groups
WDC Key community members (includes village elders and ward leaders)
Awareness and knowledge of the MSS Perceptions and experience of the scheme including community outreach Factors influencing MNCH care seeking
Men Married men with and without children
Women Women with and without children
NOTE: PHC = Primary Health Care Clinic.
Within each state, three MSS clinics that appeared to be having differing success in terms of recruitment/retention of midwives and uptake of services were selected, based on preliminary survey data. Clinics were chosen with contrasting characteristics or based on a striking feature, for example a very high infant mortality rate, in order to capture a range of conditions. Additionally, clinics were selected within reasonable travel distance of researchers.

11
4. Data
Data collection took place between June 2014 and January 2015. Ethical review and approval for the study was provided by institutional review boards at RAND, Bayero University Kano, and the University of Nigeria, Enugu.
4.1 Household Surveys
Within each study community, trained interviewers visited 20 randomly sampled households having a woman who was pregnant between January 2009 and the date of interview.13 Since a comprehensive list of eligible households in each community was unavailable, we randomly generated 20 GPS coordinates within each community using a GPS-enabled tablet and special software and selected the dwelling nearest this point for interview.
Table 3: Sample Distribution
State Households Clinics
Bauchi 897 48
Bayelsa 281 15
Delta 625 32
Ebonyi 390 23
Ekiti 386 20
Enugu 419 22
Gombe 877 48
Kano 870 48
Kwara 525 28
Niger 584 32
Ogun 484 24
Zamfara 684 46
Total 7022 386
If there was no eligible household within the dwelling (i.e., a household with a woman who was pregnant between January 2009 and the date of interview), the interviewer visited the dwelling on either side until one was found. If there were multiple eligible households within the dwelling, one was randomly chosen for interview. All eligible women within each selected
13 In practice this was usually defined as the community where the primary health care clinic was located.

12
household were interviewed.14 We interviewed a total of 7,104 women in 386 communities with a recent birth.15 The survey instrument included a household module where we collected information about household characteristics, including household assets; an individual module where we collected information about each birth since January 2009, including use of antenatal and postnatal care, place of delivery, and pregnancy and delivery complications; and a mortality module where we asked about household deaths within the preceding ten years, including age and gender of the deceased household member (for females we also asked whether the death occurred during pregnancy, delivery, or within six weeks of delivery). A copy is provided in the Appendix.
Given that birth information is collected retrospectively, one might be concerned about recall error, but we note that retrospective birth data are commonly used in this literature and their validity is generally accepted (Beckett et al., 2001). In addition, any measurement error resulting from faulty maternal recall is unlikely to be systematically different between the treatment and comparison groups.
4.2 Clinic Surveys At each study clinic, we collected data on clinic characteristics, including staffing and
availability of supplies from the officer-in-charge (or another knowledgeable individual if the officer-in-charge was unavailable). The survey instrument also included an observation module where the interviewer recorded the physical state of the clinic using a categorical scale—good, fair, or poor; and a health worker module. The respondent for the latter was a randomly selected midwife (where no midwife was available, a randomly chosen health worker was interviewed). Respondents were asked about their qualifications, length of time employed at the clinic, and satisfaction with various aspects of their job. MSS midwives in particular were asked about compensation, including whether any salaries had been delayed or not paid, accommodation, and aspects of their working environment they would like to see improved. We have data from 368 clinics (182 in the treatment group and 186 in the comparison group).16 A copy of the instrument is provided in the Appendix.
4.3 Semi-Structured Interviews
The focus of the interviews differed by stakeholder group, as shown in Table 2. Interview guides were pretested in the selected states to ensure cultural sensitivity. Interviews were
14 The refusal rate was less than 2 percent. 15 We selected 416 clusters for the study, but we were unable to visit 30 of the selected communities (7 percent of the sample) for various reasons. In a few cases, this was because of security concerns, but generally it was due to logistical constraints. 16 We have household survey data for 18 clinics but are missing clinic data.
13
undertaken in English or the local language, which varied by site. Participants provided verbal consent for participating in the study, recorded in the interview sheet (see Appendix). Policymaker interviews were conducted in their respective offices; for midwives and women, interviews were conducted in the vicinity of the clinic, although an effort was made to hold them in a space away from the clinic to reduce interruptions and allow the participants to speak freely. With the consent of the respondents, interviews were recorded and later transcribed and translated verbatim.
Potential participants for the interviews were sampled purposively where possible. Policymakers were identified based on their involvement in the MSS, using official websites and the study authors’ professional networks. MSS midwives and eligible women (those who had given birth in the last six months both at MSS clinics and elsewhere) were identified through the quantitative survey. As noted earlier, we conducted interviews around three MSS clinics in each state, with two midwives interviewed per clinic.17 In total, we interviewed 17 policymakers at all levels, 16 midwives, and 43 women with a birth in the last six months. Participants were selected to include a range of characteristics: For midwives this included, for example, varying age, length of time since qualified, and length of time employed by the MSS; for women, place of birth, age, number of children, occupation, and place of residence. Participant characteristics are summarized in Tables 4 and 5.
17 In Enugu state, one comparison group clinic was included to provide contrast. Clinic characteristics are provided in Table A.1.

14
Table 4: Participant Characteristics (Midwives)
Midwife State PHC Level of Experience Prior to
Program Entry Length of Time Employed
by Program
E1M1 Enugu 1* In retirement 1 year 8 months
E1M2 Enugu 1* Worked for a year in private clinic 9 months
E2M1 Enugu 2 Year compulsory youth service 5 years
E2M2 Enugu 2 In retirement 3 years 9 months
E3M1 Enugu 3 Newly qualified 4 months
E3M2 Enugu 3 Year compulsory youth service 1 year 4 months
K1M1 Kano 1 Over 18 years 4 years 7 months
K1M2 Kano 1 Newly qualified 4 years
K2M1 Kano 2 Newly qualified 10 months
K2M2 Kano 2 Newly qualified 4 years
K3M1 Kano 3 In retirement 4 years
Kw1M1 Kwara 1 In retirement 5 years 3 months
Kw1M2 Kwara 1 Year compulsory youth service 3 years
Kw2M1 Kwara 2 In retirement 5 years
Kw3M1 Kwara 3 In retirement 4 years
Kw3M2 Kwara 3 In retirement 2 years
NOTE: This table shows summary characteristics of midwives that participated in the semi-structured interviews. * Comparison group clinic.
Table 5: Participant Characteristics (women who gave birth in the last 6 months)
PHC State Mean Age Mean Number of Children
E1 Enugu 29.5 4.8
E2 Enugu 25 2.6
E3 Enugu 23.5 2.4
K1 Kano 24 5.6
K2 Kano 23.8 3.5
K3 Kano 24.4 4.8
KW1 Kwara 26.3 4.5
KW2 Kwara 24.5 1
KW3 Kwara 29.2 3.4
NOTE: This table shows summary characteristics of women residing in study communities that participated in the semi-structured interviews. For a complete overview of individual participants characteristics see Table A.2.

15
4.4 Focus Group Discussions The focus groups were organized by type of participant (i.e., women, men, community
leaders) to help ensure that participants were able to talk freely. Each group consisted of five to nine participants (see Table 6). Potential participants were identified with help from a village guide, who was also responsible for convening the groups. The focus groups also followed a semi-structured format; the focus of the discussions is shown in Table 2. Two facilitators moderated the focus group discussions to ensure smooth running and also to record interactions within the group. Focus groups were held at a time and place convenient for participants. Participants were compensated for their travel and refreshments were provided. With permission from participants, focus group discussions were recorded and later transcribed and translated. In total, we conducted three focus groups in each state.
Table 6: Focus Groups
Focus Group Discussion State Clinic Participant Number of Participants
E1FG1 Enugu 1 WDC 7
E2FG2 Enugu 2 Men 7
E3FG3 Enugu 3 Women 8
K1FG1 Kano 1 WDC 9
K3FG2 Kano 3 Men 5
K2FG3 Kano 2 Women 5
KW1FG1 Kwara 1 WDC 8
KW3FG2 Kwara 3 Men 8
KW2FG3 Kwara 2 Women 8

16
5. Analytical Strategy
To identify the impact of the MSS, we estimate difference-in-difference (DID) models that examine the relative change in outcomes in intervention relative to comparison areas. The basic econometric specification is as follows:
𝑦𝑦!"# = 𝛼𝛼 + 𝛽𝛽!𝑇𝑇𝑇𝑇𝑇𝑇𝑇𝑇𝑇𝑇𝑇𝑇𝑇𝑇! + 𝛽𝛽!𝑃𝑃𝑃𝑃𝑃𝑃𝑃𝑃! + 𝛽𝛽!𝑇𝑇𝑇𝑇𝑇𝑇𝑇𝑇𝑇𝑇𝑇𝑇𝑇𝑇! ∗ 𝑃𝑃𝑃𝑃𝑃𝑃𝑃𝑃! + 𝜂𝜂! + 𝑒𝑒!"# (𝟏𝟏)
where 𝑦𝑦!"# denotes the outcome of interest for birth i in community j in month t (starting in January 2009); 𝑇𝑇𝑇𝑇𝑇𝑇𝑇𝑇𝑇𝑇𝑒𝑒𝑒𝑒! is an indicator that takes the value 1 if the study clinic in community j is a Wave 1 (MSS) clinic; 𝑃𝑃𝑃𝑃𝑃𝑃𝑃𝑃! is a binary indicator that takes the value 1 after the MSS is introduced; 𝜂𝜂! is a community fixed effect; and 𝑒𝑒!"# is an unobserved error term. In this specification, our interest centers on the coefficient 𝛽𝛽!, which measures the differential change in the outcome in treated communities relative to control communities. Standard errors are clustered at the level of the community given correlation in the outcomes within this level.
The main identifying assumption of the DID model is that the evolution of outcomes in treated areas would have followed the same pattern as in comparison areas in the absence of the treatment (this is known as the parallel trends assumption).18 While this counterfactual cannot be known, we can test whether this assumption holds for each of the outcome variables of interest prior to the introduction of the program using the following regression specification:
𝑦𝑦!"# = 𝛼𝛼 + 𝛽𝛽𝑇𝑇𝑇𝑇𝑇𝑇𝑇𝑇𝑇𝑇𝑇𝑇𝑇𝑇! + 𝛾𝛾𝛾𝛾 + 𝛿𝛿𝑇𝑇𝑇𝑇𝑇𝑇𝑇𝑇𝑇𝑇𝑇𝑇𝑇𝑇! ∗ 𝑡𝑡 + 𝜂𝜂! + 𝑒𝑒!"# (𝟐𝟐)
where the regression sample is restricted to baseline births (those that occurred before introduction of the MSS), t denotes monthly pre-trends, and where interest centers on the interaction coefficient δ (the parallel trends assumption implies that δ=0).
In addition to estimating the overall effect of the program, we are also interested in examining whether program effects vary over time and whether program effects vary by various household and maternal characteristics, e.g., socioeconomic status. To estimate these heterogeneous effects, we modify specification (1) to interact Treated*Post with each of the full set of control variables. Because this is technically a triple-interaction specification, we also control for interactions between each of the control variables and the Post variable and interactions between each of the control variables and the Treated variable. The main outcomes of interest include access to skilled care, utilization of care, and maternal and child health.
18 Alternatively, that there is no unobserved heterogeneity affecting both program participation and outcomes.
17
Access to Skilled Care
One could look at how the program affected perceived access, as measured by the probability that lack of availability of nurses/doctors was cited as a reason for not delivering in a health facility. Although perceived access is arguably as important as actual access, a limitation of this measure is that it applies only to the sample of women who did not deliver in a health facility: As such, the estimated effects may also capture the effect of selection as the “compliers” (i.e., the set of women who take advantage of the MSS to deliver in clinics) leave this sample. The resulting bias is difficult to sign, because the MSS may have raised the perceptions of availability of all women, but to a greater extent for compliers than for “never-takers” (i.e. those who continued to deliver at home even after the introduction of the MSS in their local clinic). We therefore focus instead on actual availability of a skilled provider in the clinic. We construct an indicator for whether a doctor/nurse was present at the time a woman arrived at the clinic to deliver.19 While it is true that the set of women who deliver in a health facility may be different after the MSS is introduced, whether or not a doctor/nurse was present is unlikely to be related to the characteristics of the respondent, and therefore is less likely to suffer from selection bias. There are some caveats worth noting about this measure: First, it captures one dimension of access, i.e., whether the provider was there when the woman got to the facility, so in that sense it measures provider absence and not provider availability in general;20 second, it is likely to be a lower bound on provider absence to the extent that women adjust their behavior to take into account known patterns of provider absence.
Utilization of Care
We are primarily interested in use of antenatal care and skilled birth attendance. We consider the following measures for antenatal care: (1) an indicator for any antenatal care use, (2) an indicator for whether a mother had four or more antenatal care visits (per WHO recommendations), and (3) an indicator for antenatal care obtained in the study clinic. For skilled birth attendance our measures are (1) an indicator for whether a birth took place in the study clinic, and (2) an indicator for whether a birth was attended by a doctor, nurse, or midwife. We also study the effect of the MSS on use of postnatal care, measured by an indicator for whether the mother received a post-natal check, and on child immunization, measured by indicators for whether the child received BCG, DPT, measles and polio vaccines.
Health Outcomes
We examine the effect of the MSS on neonatal mortality (a child death within a month of being born) and on maternal birth complications (we look at the probability that a mother experienced at least one of the following complications: severe bleeding, convulsions, retained
19 The exact question asked was: “Was the doctor/nurse on site when you got to the facility?” 20 Cumulatively though, this gives us a good idea of provider availability more generally.

18
placenta, prolonged labor, loss of consciousness or high fever either during the delivery or within the postpartum period. We also look at the probability of a maternal death.
Control Variables
We include the following control variables in our models: (1) a staffing indicator which takes the value 1 if the MSS clinic had at least one midwife at the time of the endline survey, (2) a wealth variable which contains quintiles of an asset-based wealth index derived using principal component analysis, (3) indicators for whether the mother is married, literate, and Muslim, respectively, (4) the mother’s age at the time of the birth, (5) a binary indicator equal to one if the woman reported at least one pregnancy complication such as vaginal bleeding during the pregnancy, and (6) indicators for whether the child was male and whether the birth was a multiple birth.
An important part of the evaluation is looking at barriers and facilitators to program implementation, and measuring subjective perceptions of the program. For this, we rely primarily on the qualitative data.
5.1 Analysis of Qualitative Data The qualitative data analysis was based on the interview and focus group transcripts as well as
field notes collected by the interviewers. A systematic and rigorous analysis was undertaken using a method based on the constant comparative approach (Glaser & Strauss, 2009), supported by QSR Nvivo software. The data were read and re-read. Initially, “open codes” were applied to the data to represent the significance of sections of text. These were incrementally grouped into organizing categories, or “themes,” which were modified and checked constantly in order to develop a coding frame with explicit specifications. The coding frame, influenced partly by the research questions but particularly by ideas arising during the data collection, was used to systematically assign the data to the thematic categories (Boeije, 2002; Pitchforth et al., 2006). Anonymized quotes from participants have been used to illustrate the key themes and subthemes. Respondents and focus groups are identified first by the state and health clinic catchment area where the interview/focus group took place, and secondly by the participant type (E=Enugu, K=Kano, Kw=Kwara, FPm=Federal Policymaker, SPm=State Policymaker, LGA=Local Government, M=midwife, WH=woman who gave birth at home, WC=women gave birth in clinic, FG=focus group).
5.2 Integration of Qualitative and Quantitative Findings
The qualitative and quantitative data were initially analyzed separately and then systematically compared to identify areas of convergence and divergence with respect to the mechanisms of action. In our findings, we present quantitative data to examine the impact of the program and then integrate qualitative and quantitative data to try to understand why this impact may or may not have been achieved.

19
6. Study Findings: Impacts
The survey sample for the impact evaluation consists of 9,475 reported births born to 7,104 women over the period 2009–2014, of which 4,746 (50.3 percent) occurred in the intervention areas. We exclude births after the comparison group becomes exposed, leaving us with 5,295 births taking place between January 2009 and May 2012. Table 7 summarizes the variables used in the analysis at baseline and tests for balance across intervention and control areas. Even though the DID identification strategy does not require it, it is reassuring to note that the outcome variables as well as the covariates are relatively well balanced at baseline.
Table 7: Baseline Characteristics and Balance
Control Intervention
Mean Std. dev. Mean Std. dev. p-value Any antenatal care 0.801 0.400 0.834 0.372 0.281 4+ antenatal visits 0.504 0.500 0.506 0.500 0.953 Antenatal care in study clinic 0.539 0.499 0.622 0.485 0.054 Institutional delivery 0.541 0.499 0.570 0.496 0.496 Delivered in study clinic 0.344 0.475 0.420 0.494 0.058 Skilled birth attendance 0.533 0.499 0.540 0.499 0.876 Intra-partum complications 0.064 0.301 0.048 0.240 0.349 Post-partum complications 0.044 0.233 0.042 0.228 0.870
Breastfed for 6 months 0.417 0.493 0.376 0.485 0.342 Married 0.869 0.338 0.876 0.329 0.761 Age of mother 31.79 40.70 29.31 6.598 0.172 Illiterate 0.542 0.499 0.564 0.496 0.649 Muslim 0.591 0.492 0.574 0.495 0.773 Wealth index 2.934 1.468 2.936 1.431 0.989 Male child 0.512 0.500 0.532 0.499 0.503 Multiple birth 0.029 0.168 0.024 0.153 0.724
Low risk (no problems during pregnancy) 0.828 0.378 0.833 0.374 0.870 NOTE: p-values correspond to tests for differences in means, and allow for observations to be correlated within communities.
In Table 8, we test the parallel trends assumption for each of the outcome variables of
interest, using the specification shown in (2). As Table 8 shows, the null hypothesis cannot be rejected for any of the outcome variables, which lends credence to the identification strategy.

20
Table 8: Testing for Equality of Pre-Trend
Any
Antenatal Care
4+ Antenatal
Visits
Antenatal Care in
Study Clinic Institutional
Delivery
Delivery in Study Clinic
Skilled Birth
Attendance Postnatal
Check Treated*t 0.009 0.003 0.002 0.005 0.004 -0.001 0.014
(0.010) (0.012) (0.011) (0.012) (0.012) (0.011) (0.012)
t 0.001 0.009 0.001 0.012 0.003 0.019** -0.004
(0.007) (0.008) (0.008) (0.009) (0.009) (0.008) (0.009)
Constant 0.726*** 0.314*** 0.548*** 0.308*** 0.291*** 0.219** 0.318***
(0.090) (0.109) (0.102) (0.105) (0.104) (0.099) (0.110)
Observations 1,091 1,094 1,094 1,094 1,094 1,094 1,094 R-squared 0.433 0.390 0.526 0.513 0.531 0.564 0.450
DPT
Vaccine Polio
Vaccine Measles Vaccine
BCG Vaccine
Neonatal Mortality
Intrapartum Complications
Postpartum Complications
Treated*t -0.005 -0.004 -0.005 -0.003 0.003 0.014 0.008
(0.012) (0.011) (0.012) (0.011) (0.004) (0.009) (0.007)
t 0.011 0.015* 0.016* 0.016* -0.006* -0.008 0.001
(0.009) (0.008) (0.008) (0.008) (0.003) (0.008) (0.004)
Constant 0.431*** 0.425*** 0.360*** 0.349*** 0.082** 0.086 -0.049
(0.107) (0.100) (0.107) (0.101) (0.033) (0.082) (0.059)
Observations 1,094 1,094 1,094 1,094 1,094 1,094 1,094 R-squared 0.520 0.473 0.479 0.498 0.255 0.360 0.424

21
6.1 Effect of the MSS on Access to Skilled Care
In Table 9, we present the DID estimation results for the access measure, whether or not a skilled provider (a nurse, midwife, or doctor) was present when the woman arrived at the clinic to deliver. Note that the sample is smaller than the full set of births, as this information was only elicited for women who delivered in a clinic/hospital. Column 1 reports the results from specification (1). Column (2) expands the specification to look at whether program effects vary over time.
Table 9: Effect of the MSS on Access
(1) (2)
Treated*Post 0.049
(0.030)
Treated*Year1
0.044
(0.036)
Treated*Year2
0.060*
(0.033)
Treated*Year3 0.044 (0.036) Constant 0.805*** 0.806***
(0.051) (0.051)
Observations 2,535 2,535 R-squared 0.284 0.284 *** p<0.01, ** p<0.05, * p<0.1. Standard errors in parentheses are clustered at the level of catchment area. The dependent variable is an indicator for whether a doctor or nurse was present when the mother arrived at the clinic for delivery. All regressions include community fixed effects and year x month fixed effects. Treated is equal to 1 if the community clinic is an MSS clinic. All regressions control for maternal and child characteristics.
The results suggest that the MSS increased provider presence by, on average, about 5 percentage points (from a baseline rate of 90 percent), although the DID effect is only significant at 10 percent. This effect is largely constant over time. As we noted earlier, the low baseline rate of provider absence (≈10 percent) likely represents a lower bound. It is also possible that respondents interpreted the question as asking whether there was someone to attend to them when they arrived at the clinic, not specifically a doctor or nurse.
6.2 Effect of the MSS on Utilization To set the stage for the formal analysis, we examine graphically whether the MSS has had an
effect on use of care. For each outcome, we fit a smoothed local polynomial against time (measured in quarters from January 2009), separately for treated and control groups. Figures 4

22
and 5 presents the graphs for the antenatal care outcomes and Figures 6 through 8 present similar graphs for the delivery outcomes.
Figure 4: Effect of the MSS on Antenatal Use in Study Clinics 21
NOTE: The figure plots smoothed local polynomials to the rate of antenatal care obtained from the study clinic, separately for treated and control areas. Time is measured in quarters starting from January 2009. The vertical line indicates when the MSS was introduced.
21 In Figures 4–8, the darker line represents the Treated group.
.5.5
5.6
.65
.7.7
5
0 5 10 15Quarters
Treated Control

23
Figure 5: Effect of the MSS on Overall Antenatal Care Use
NOTE: The figure plots smoothed local polynomials to the rate of any antenatal care, separately for treated and control areas. Time is measured in quarters starting from January 2009. The vertical line indicates when the MSS was introduced.
.75
.8.8
5.9
0 5 10 15Quarters
Treated Control

24
Figure 6: Effect of the MSS on Delivery in the Study Clinic
NOTE: The figure plots smoothed local polynomials to the rate of delivery in the study clinic, separately for treated and control areas. Time is measured in quarters starting from January 2009. The vertical line indicates when the MSS was introduced.
.35
.4.4
5.5
.55
0 5 10 15Quarters
Treated Control
25
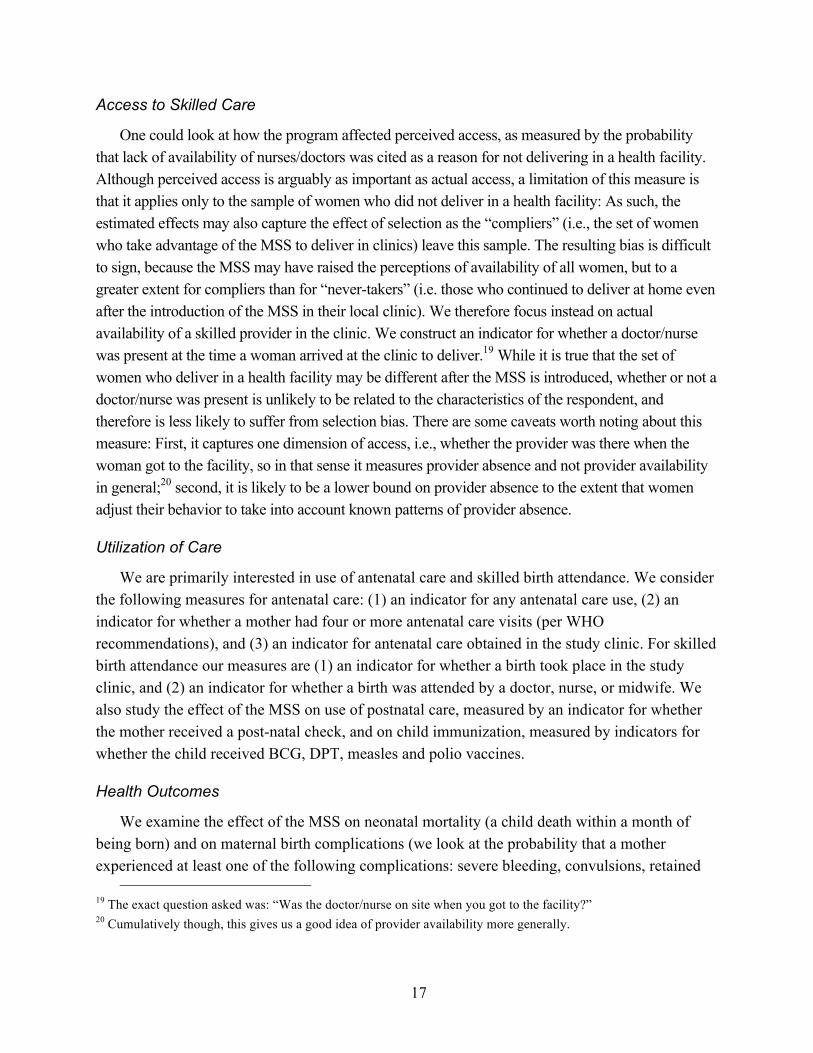
Figure 7: Effect of the MSS on Institutional Deliveries
NOTE: The figure plots smoothed local polynomials to the rate of delivery in a health facility, separately for treated and control areas. Time is measured in quarters starting from January 2009. The vertical line indicates when the MSS was introduced.
.5.5
5.6
.65
.7
0 5 10 15Quarters
Treated Control

26
Figure 8: Effect of the MSS on Skilled Birth Attendance
NOTE: The figure plots smoothed local polynomials to the rate of deliveries attended by a doctor, nurse or midwife, separately for treated and control areas. Time is measured in quarters starting from January 2009. The vertical line indicates when the MSS was introduced.
With the important caveat that these figures are only descriptive, there appears to be evidence
of an increase in use of antenatal care at the study clinic, particularly within the first year of the program. The impact on institutional deliveries and skilled birth attendance is not so clear. For a more formal analysis, we turn to the regression results.
Table 10 presents the DID results for each of the measures of antenatal care. As before, for each outcome we present first the plain DID estimates and then the estimates from the specification that allows the treatment effect to vary over time.
.45
.5.5
5.6
.65
0 5 10 15Quarters
Treated Control

27
Table 10: Effect of the MSS on Antenatal Care
Antenatal Care in Study Clinic Any Antenatal Care 4+ Antenatal Visits Treated*Post 0.023 0.018
-0.006
(0.031) (0.022)
(0.035) Treated*Year1 0.073**
0.050*
0.028
(0.036)
(0.027)
(0.039)
Treated*Year2 -0.007
-0.005
-0.036 (0.036) (0.026) (0.042) Treated*Year3 0.003 0.009 -0.011
(0.040)
(0.028)
(0.046)
Constant 0.434*** 0.432*** 0.573*** 0.571*** 0.511*** 0.509***
(0.056) (0.056) (0.046) (0.046) (0.058) (0.058)
Observations 5,295 5,295 5,287 5,287 5,295 5,295 R-squared 0.335 0.336 0.319 0.319 0.228 0.229 *** p<0.01, ** p<0.05, * p<0.1. Standard errors in parentheses are clustered at the community level. All regressions include community fixed effects and year x month fixed effects. Treated is equal to 1 if the community clinic is an MSS clinic. All regressions control for maternal and child characteristics.
The results in Table 10 are in line with the graphical evidence: The rate of antenatal care
usage at the study clinic appears to have increased by about 7.3 percentage points in the first year of the program (starting from a baseline rate of 62.2 percent), but thereafter we are not able to find any program effect. There is a less precisely estimated 5-percentage-point increase in the overall rate of antenatal care use, but little evidence of an increase in the number of visits as measured by the rate of four or more antenatal visits.
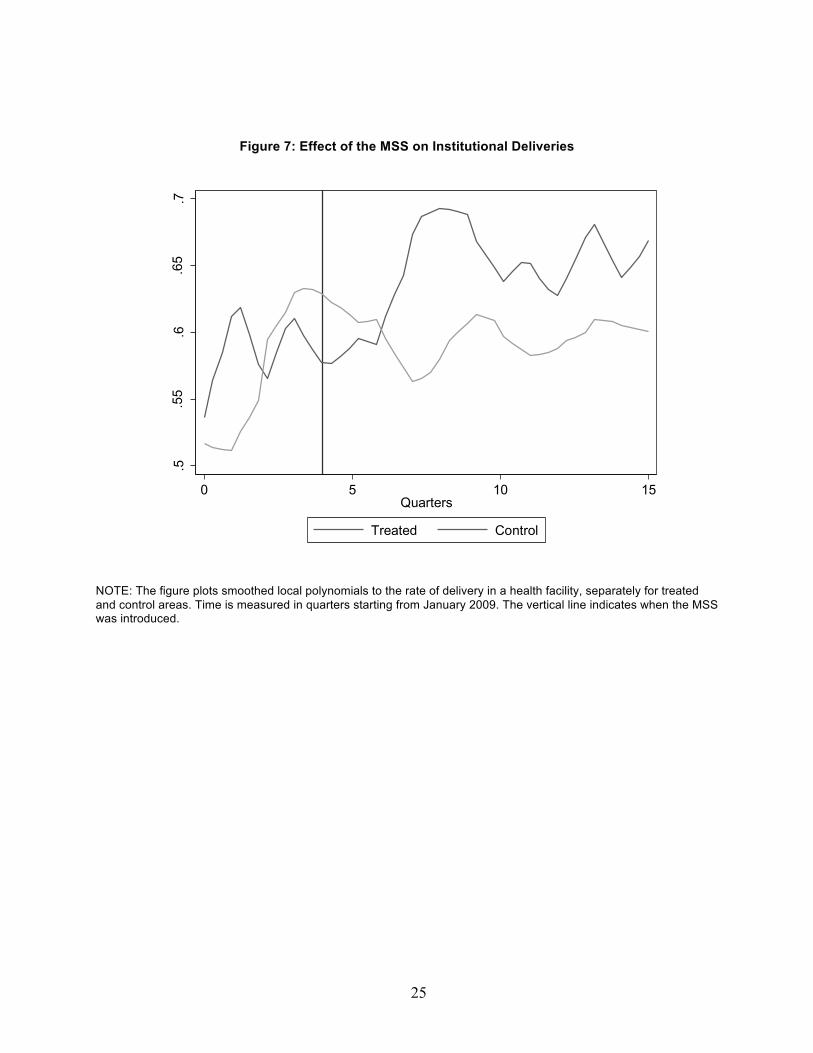
In Figure 9 below, we plot the coefficients from a more refined specification that allows program effects to vary by quarter. Prenatal care usage at the study clinic rises by more than 10 percentage points in the first three quarters following introduction of MSS, but thereafter drops off. In contrast with the results in Table 10, the graphs reveal that antenatal care usage at both extensive (i.e., rate of any antenatal care) and intensive margins (rate of four or more antenatal visits) went up during this period, but thereafter declined. Overall, the conclusion is that the MSS had a significant, but brief, impact on antenatal care utilization. This impact was not merely concentrated on women who would have utilized antenatal care even in the absence of the program, as evidenced by the increase in the rate of any antenatal care.
28
Figure 9: Program Effects over Time: Antenatal Care
NOTE The figures above plot the treatment effects (along with 95% confidence intervals) against quarters of exposure for each of the measures of antenatal care utilization.
Next, we consider the effects on institutional births and on skilled birth attendance. Table 11 presents the results.
-.4-.2
0.2
.4
Trea
tmen
t effe
ct
0 4 8 12Quarters in treatment
Any prenatal care
-.4-.2
0.2
.4
Trea
tmen
t effe
ct
0 4 8 12Quarters in treatment
At least 4 prenatal visits-.4
-.20
.2.4
Trea
tmen
t effe
ct
0 4 8 12Quarters in treatment
Prenatal care from study clinic

29
Table 11: Effect of the MSS on Institutional Delivery and Skilled Birth Attendance
Delivery in Study Clinic Institutional Delivery Skilled BirthAttendance Treated*Post -0.007 -0.016 -0.000
(0.032) (0.029) (0.028) Treated*Year1 -0.008 -0.035
-0.014
(0.037) (0.036)
(0.034)
Treated*Year2 0.005 0.000
0.025
(0.037) (0.034)
(0.033)
Treated*Year3 -0.022 -0.016 -0.015 (0.039) (0.035) (0.035) Constant 0.320*** 0.321*** 0.358*** 0.359*** 0.302*** 0.303***
(0.061) (0.061) (0.057) (0.057) (0.052) (0.052)
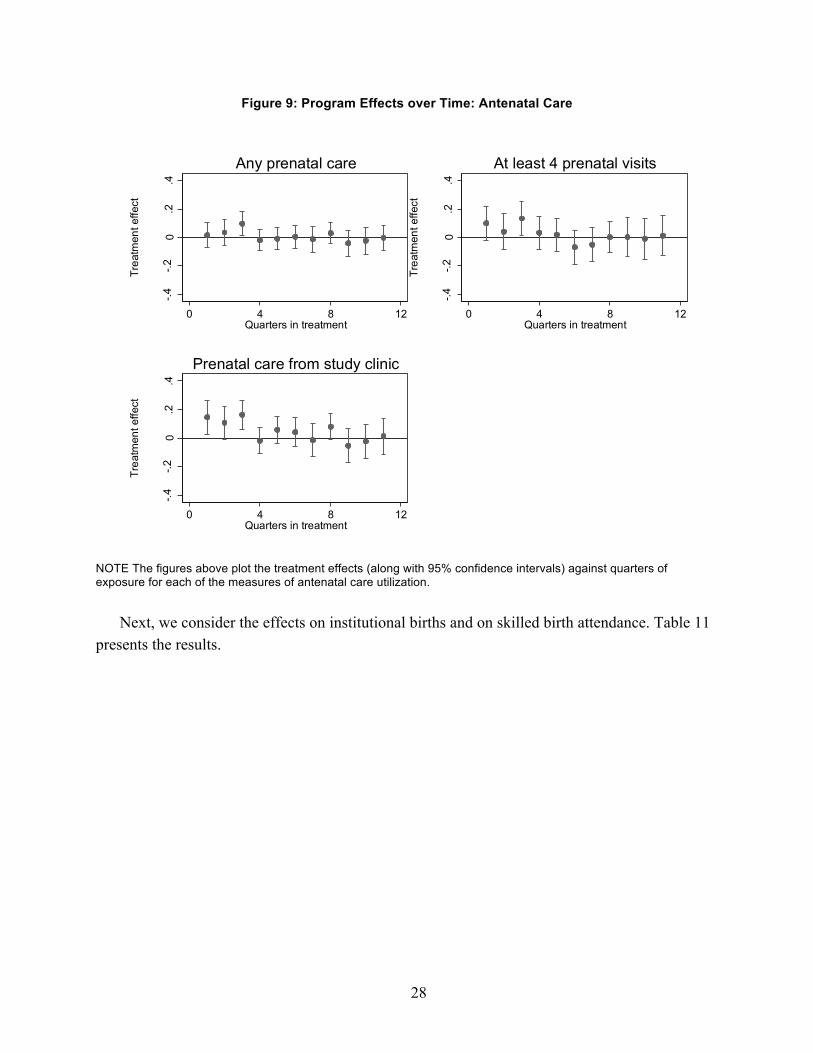
Observations 5,295 5,295 5,295 5,295 5,295 5,295 R-squared 0.351 0.351 0.379 0.379 0.409 0.409 *** p<0.01, ** p<0.05, * p<0.1. Standard errors in parentheses are clustered at the community level. All regressions include community fixed effects and year x month fixed effects. Treated is equal to 1 if the community clinic is an MSS clinic. All regressions control for maternal and child characteristics. Overall, the MSS appears to have had little impact on either institutional delivery or skilled birth attendance. The confidence intervals are tight enough that we can rule out economically significant effects on any of these outcomes. This conclusion is not significantly modified if we break out the time-varying effects by quarter (Figure 10 below).
30
Figure 10: Program Effects over Time: Delivery
NOTE: The figures above plot the treatment effects (along with 95% confidence intervals) against quarters of exposure for each of the postnatal care outcomes.
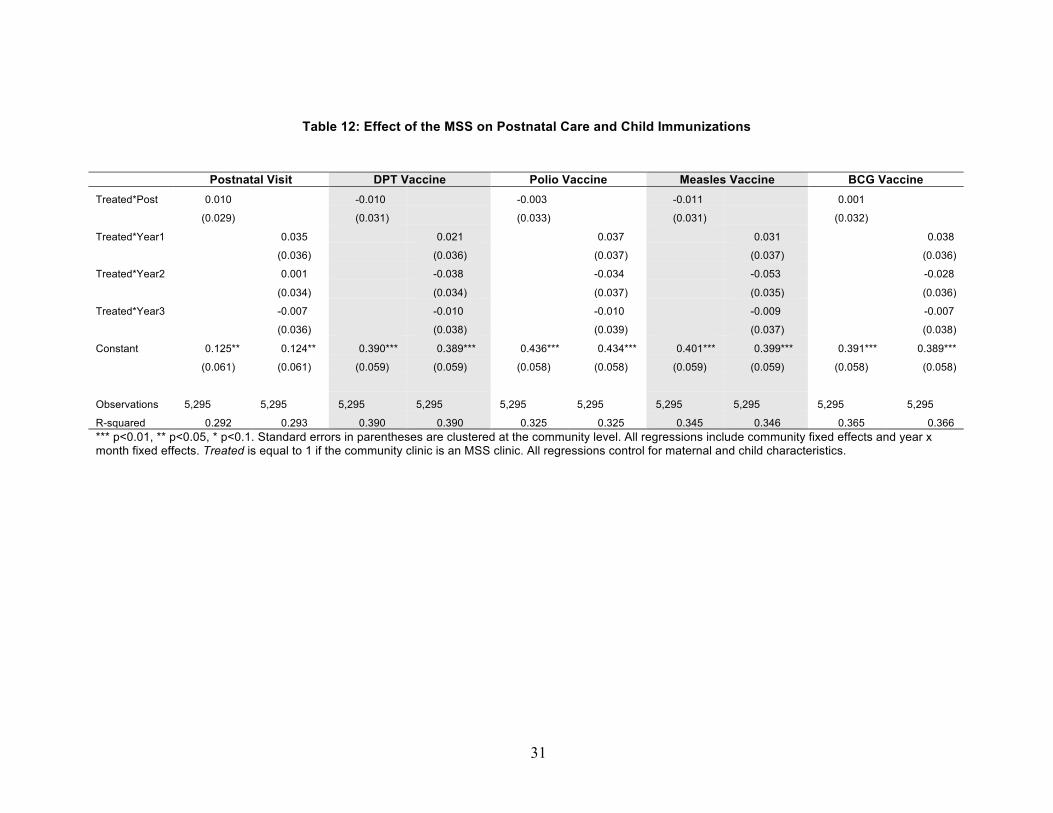
In Table 12, we examine the effect of the MSS on postnatal care and child immunization.
Once again, the overall effects are small and statistically insignificant. Figure 11 breaks out the treatment effects by quarters of exposure.
-.4-.2
0.2
.4
Trea
tmen
t effe
ct
0 4 8 12Quarters in treatment
Delivery in health facility
-.4-.2
0.2
.4
Trea
tmen
t effe
ct
0 4 8 12Quarters in treatment
Delivery assisted by doctor/midwife/nurse-.4
-.20
.2.4
Trea
tmen
t effe
ct
0 4 8 12Quarters in treatment
Delivered in study clinic
31
Table 12: Effect of the MSS on Postnatal Care and Child Immunizations
Postnatal Visit DPT Vaccine Polio Vaccine Measles Vaccine BCG Vaccine Treated*Post 0.010
-0.010
-0.003
-0.011
0.001
(0.029)
(0.031)
(0.033)
(0.031)
(0.032)
Treated*Year1
0.035
0.021
0.037
0.031
0.038
(0.036)
(0.036)
(0.037)
(0.037)
(0.036)
Treated*Year2
0.001
-0.038
-0.034
-0.053
-0.028
(0.034)
(0.034)
(0.037)
(0.035)
(0.036)
Treated*Year3 -0.007 -0.010 -0.010 -0.009 -0.007
(0.036) (0.038) (0.039) (0.037) (0.038)
Constant 0.125** 0.124** 0.390*** 0.389*** 0.436*** 0.434*** 0.401*** 0.399*** 0.391*** 0.389***
(0.061) (0.061) (0.059) (0.059) (0.058) (0.058) (0.059) (0.059) (0.058) (0.058)
Observations 5,295 5,295 5,295 5,295 5,295 5,295 5,295 5,295 5,295 5,295
R-squared 0.292 0.293 0.390 0.390 0.325 0.325 0.345 0.346 0.365 0.366 *** p<0.01, ** p<0.05, * p<0.1. Standard errors in parentheses are clustered at the community level. All regressions include community fixed effects and year x month fixed effects. Treated is equal to 1 if the community clinic is an MSS clinic. All regressions control for maternal and child characteristics.

32
Figure 11: Program Effects over Time: Postnatal Care and Immunizations
NOTE: The figures above plot the treatment effects (along with 95% confidence intervals) against quarters of exposure for each outcome.
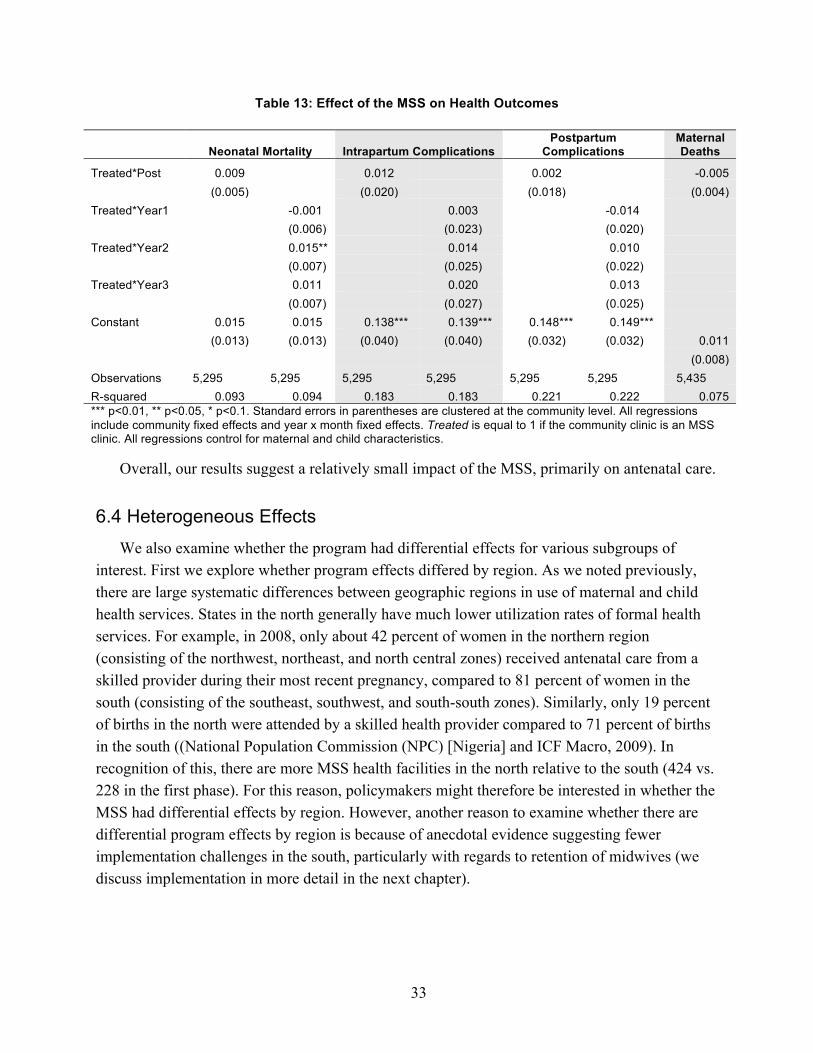
6.3 Effect of the MSS on Maternal and Child Health We now turn to the health outcomes. Table 13 presents the DID results. Not surprisingly, the
MSS did not reduce the rates of neonatal mortality or maternal complications. In fact, the point estimates indicate an increase in neonatal mortality in Year 2. Further analysis of the data suggests that this is likely a statistical anomaly—when we break out mortality separately by birth location we find that the overall increase in mortality in the treated areas is due to a differential increase in mortality associated with home births. There is, however, no corresponding decrease in mortality associated with clinic births in treated areas, as one might expect had the program altered the composition of home births in such a way as to move less-risky births to the institutional setting.22
22 We note as a caveat that we are dealing with small numbers and so the data are very noisy.
-.4-.2
0.2
.4Tr
eatm
ent e
ffect
0 4 8 12Quarters in treatment
Received post-natal check
-.4-.2
0.2
.4Tr
eatm
ent e
ffect
0 4 8 12Quarters in treatment
DPT vaccine
-.4-.2
0.2
.4Tr
eatm
ent e
ffect
0 4 8 12Quarters in treatment
Polio vaccine
-.4-.2
0.2
.4Tr
eatm
ent e
ffect
0 4 8 12Quarters in treatment
Measles vaccine
-.4-.2
0.2
.4Tr
eatm
ent e
ffect
0 4 8 12Quarters in treatment
BCG vaccine
33
Table 13: Effect of the MSS on Health Outcomes
Neonatal Mortality Intrapartum Complications
Postpartum Complications
Maternal Deaths
Treated*Post 0.009
0.012
0.002
-0.005
(0.005)
(0.020)
(0.018)
(0.004)
Treated*Year1
-0.001
0.003
-0.014
(0.006)
(0.023)
(0.020)
Treated*Year2
0.015**
0.014
0.010
(0.007)
(0.025)
(0.022)
Treated*Year3 0.011 0.020 0.013 (0.007) (0.027) (0.025) Constant 0.015 0.015 0.138*** 0.139*** 0.148*** 0.149***
(0.013) (0.013) (0.040) (0.040) (0.032) (0.032) 0.011
(0.008)
Observations 5,295 5,295 5,295 5,295 5,295 5,295 5,435 R-squared 0.093 0.094 0.183 0.183 0.221 0.222 0.075 *** p<0.01, ** p<0.05, * p<0.1. Standard errors in parentheses are clustered at the community level. All regressions include community fixed effects and year x month fixed effects. Treated is equal to 1 if the community clinic is an MSS clinic. All regressions control for maternal and child characteristics.
Overall, our results suggest a relatively small impact of the MSS, primarily on antenatal care.
6.4 Heterogeneous Effects We also examine whether the program had differential effects for various subgroups of
interest. First we explore whether program effects differed by region. As we noted previously, there are large systematic differences between geographic regions in use of maternal and child health services. States in the north generally have much lower utilization rates of formal health services. For example, in 2008, only about 42 percent of women in the northern region (consisting of the northwest, northeast, and north central zones) received antenatal care from a skilled provider during their most recent pregnancy, compared to 81 percent of women in the south (consisting of the southeast, southwest, and south-south zones). Similarly, only 19 percent of births in the north were attended by a skilled health provider compared to 71 percent of births in the south ((National Population Commission (NPC) [Nigeria] and ICF Macro, 2009). In recognition of this, there are more MSS health facilities in the north relative to the south (424 vs. 228 in the first phase). For this reason, policymakers might therefore be interested in whether the MSS had differential effects by region. However, another reason to examine whether there are differential program effects by region is because of anecdotal evidence suggesting fewer implementation challenges in the south, particularly with regards to retention of midwives (we discuss implementation in more detail in the next chapter).

34
In Table 14 we show average program effects for key utilization outcomes separately for north (Panel A) and south (Panel B) and we also show program effects by year in each region.23 First, we observe that a skilled provider was more likely to be present in the south. We also notice that average program effects are generally positive, and larger in magnitude, in the south. Of particular interest are the coefficients for the ‘delivery in the study clinic’ and ‘skilled birth attendance’ outcomes. While our previous analysis showed that mean program effects for the full sample are close to zero, there is some suggestive evidence of a small positive impact in the south. The point estimates imply approximately a 5–6-percentage-point increase (about 7 percent relative to the baseline mean) though they are not statistically significant (panel B, cols. 6 and 7). In Figure 12 we present a graph showing program effects by quarter for each region. In the north we observe that there is a fairly consistent pattern of substantial initial impacts that erode over time.24 In the south we do not see any increase in overall use of antenatal care (perhaps because baseline rates are already high at nearly 90 percent) but we observe that for institutional deliveries and skilled birth attendance there is weak evidence of a positive effect that largely persists over time—the point estimates are all positive though the confidence intervals include zero.
Next we explore whether there are differential impacts by various individual-level characteristics e.g. did the program have larger effects on women from poorer relative to richer households? The results are in Table 15. The regression models include triple interactions between Treat x Post and all included controls (they also include all two-way interactions between Treat and all included controls, and between Post and all included controls). Overall, we do not find any systematic evidence that the program impact differed for various subgroups of interest.
23 We also looked for heterogeneity for the other outcomes including child immunization and health outcomes. These yielded results similar to the main analyses so are not shown. 24 It is worth noting that the increase in use of antenatal care in the MSS clinic in the first year of the program corresponds to an identical increase in overall antenatal care use suggesting that the program is drawing in previous non-users (see Table 14).
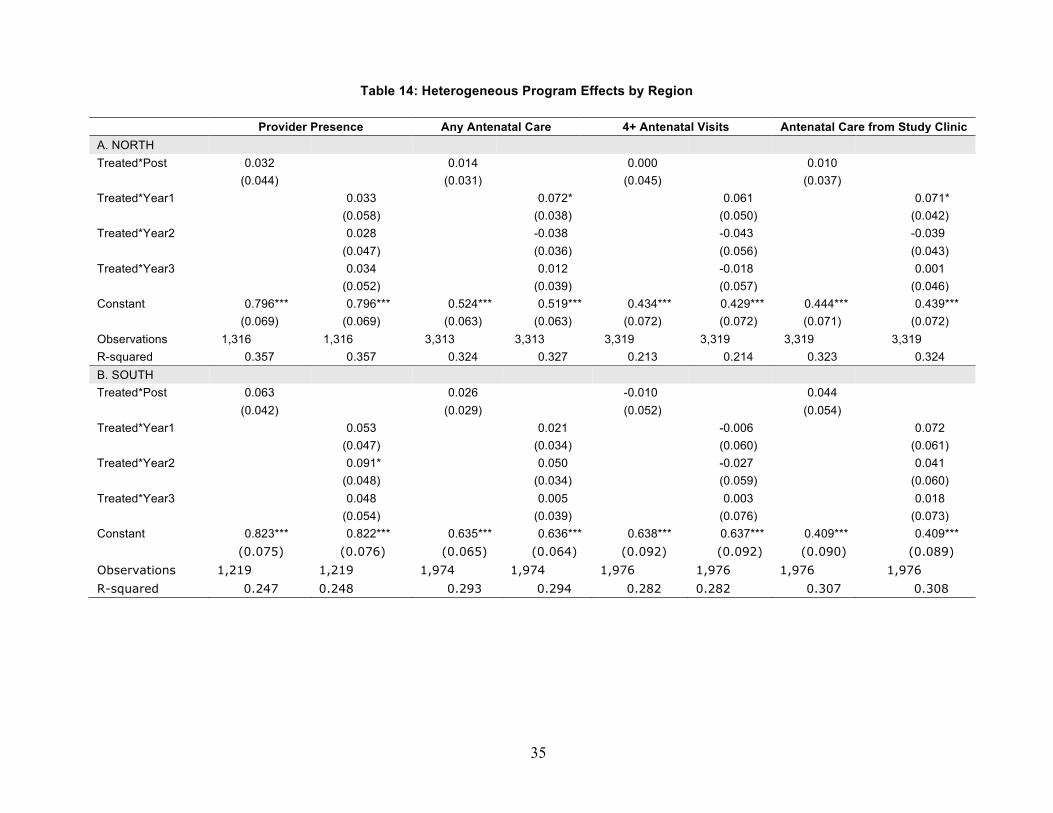
35
Table 14: Heterogeneous Program Effects by Region
Provider Presence Any Antenatal Care 4+ Antenatal Visits Antenatal Care from Study Clinic A. NORTH Treated*Post 0.032
0.014
0.000
0.010
(0.044)
(0.031)
(0.045)
(0.037)
Treated*Year1
0.033
0.072*
0.061 0.071*
(0.058)
(0.038)
(0.050) (0.042)
Treated*Year2
0.028
-0.038
-0.043 -0.039
(0.047)
(0.036)
(0.056) (0.043)
Treated*Year3
0.034
0.012
-0.018 0.001
(0.052)
(0.039)
(0.057) (0.046)
Constant 0.796*** 0.796*** 0.524*** 0.519*** 0.434*** 0.429*** 0.444*** 0.439***
(0.069) (0.069) (0.063) (0.063) (0.072) (0.072) (0.071) (0.072)
Observations 1,316 1,316 3,313 3,313 3,319 3,319 3,319 3,319 R-squared 0.357 0.357 0.324 0.327 0.213 0.214 0.323 0.324 B. SOUTH Treated*Post 0.063
0.026
-0.010
0.044
(0.042)
(0.029)
(0.052)
(0.054)
Treated*Year1
0.053
0.021
-0.006 0.072
(0.047)
(0.034)
(0.060) (0.061)
Treated*Year2
0.091*
0.050
-0.027 0.041
(0.048)
(0.034)
(0.059) (0.060)
Treated*Year3
0.048
0.005
0.003 0.018
(0.054)
(0.039)
(0.076) (0.073)
Constant 0.823*** 0.822*** 0.635*** 0.636*** 0.638*** 0.637*** 0.409*** 0.409***
(0.075) (0.076) (0.065) (0.064) (0.092) (0.092) (0.090) (0.089)
Observations 1,219 1,219 1,974 1,974 1,976 1,976 1,976 1,976 R-squared 0.247 0.248 0.293 0.294 0.282 0.282 0.307 0.308
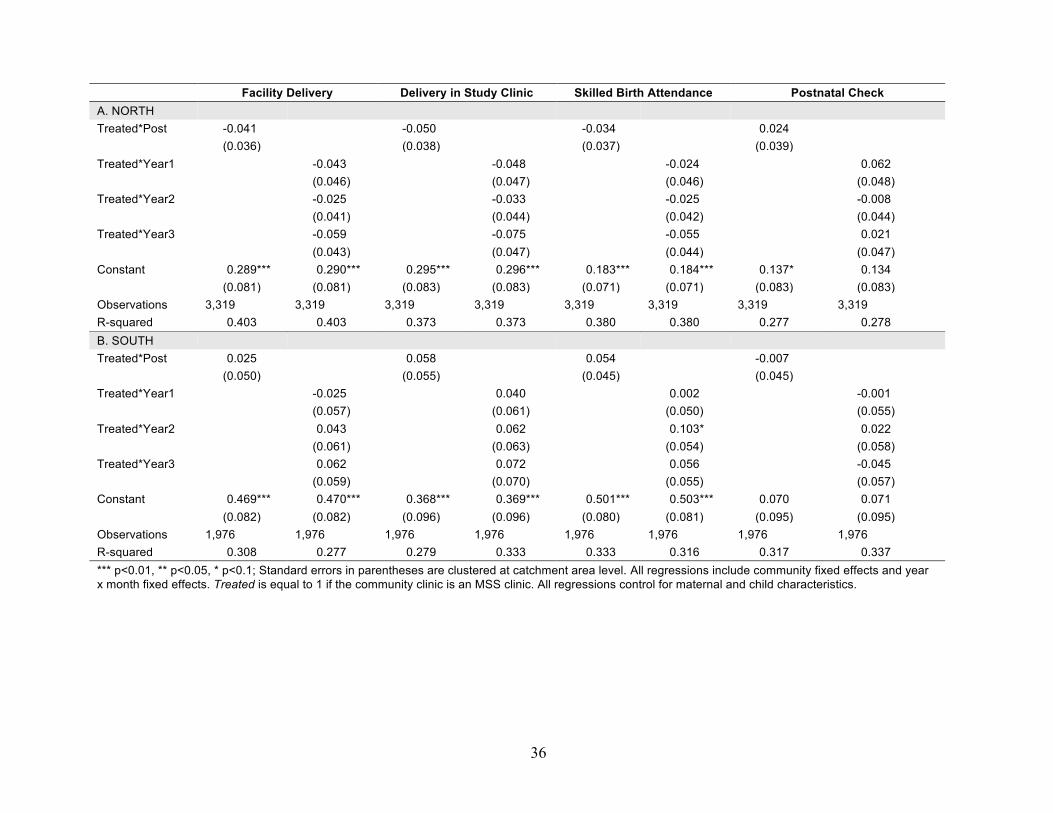
36
Facility Delivery Delivery in Study Clinic Skilled Birth Attendance Postnatal Check A. NORTH Treated*Post -0.041
-0.050
-0.034
0.024
(0.036)
(0.038)
(0.037)
(0.039)
Treated*Year1
-0.043
-0.048
-0.024 0.062
(0.046)
(0.047)
(0.046) (0.048)
Treated*Year2
-0.025
-0.033
-0.025 -0.008
(0.041)
(0.044)
(0.042) (0.044)
Treated*Year3
-0.059
-0.075
-0.055 0.021
(0.043)
(0.047)
(0.044) (0.047)
Constant 0.289*** 0.290*** 0.295*** 0.296*** 0.183*** 0.184*** 0.137* 0.134
(0.081) (0.081) (0.083) (0.083) (0.071) (0.071) (0.083) (0.083)
Observations 3,319 3,319 3,319 3,319 3,319 3,319 3,319 3,319 R-squared 0.403 0.403 0.373 0.373 0.380 0.380 0.277 0.278 B. SOUTH Treated*Post 0.025
0.058
0.054
-0.007
(0.050)
(0.055)
(0.045)
(0.045)
Treated*Year1
-0.025
0.040
0.002 -0.001
(0.057)
(0.061)
(0.050) (0.055)
Treated*Year2
0.043
0.062
0.103* 0.022
(0.061)
(0.063)
(0.054) (0.058)
Treated*Year3
0.062
0.072
0.056 -0.045
(0.059)
(0.070)
(0.055) (0.057)
Constant 0.469*** 0.470*** 0.368*** 0.369*** 0.501*** 0.503*** 0.070 0.071
(0.082) (0.082) (0.096) (0.096) (0.080) (0.081) (0.095) (0.095)
Observations 1,976 1,976 1,976 1,976 1,976 1,976 1,976 1,976 R-squared 0.308 0.277 0.279 0.333 0.333 0.316 0.317 0.337 *** p<0.01, ** p<0.05, * p<0.1; Standard errors in parentheses are clustered at catchment area level. All regressions include community fixed effects and year x month fixed effects. Treated is equal to 1 if the community clinic is an MSS clinic. All regressions control for maternal and child characteristics.

37
Figure 12: Heterogeneous Program Effects for Utilization Outcomes by Region
A. North
B. South
!!!!
!
-.4-.2
0.2
.4
Trea
tmen
t effe
ct
0 4 8 12Quarters in treatment
Any prenatal care
-.4-.2
0.2
.4
Trea
tmen
t effe
ct
0 4 8 12Quarters in treatment
At least 4 prenatal visits
-.4-.2
0.2
.4
Trea
tmen
t effe
ct
0 4 8 12Quarters in treatment
Prenatal care from study clinic
-.4-.2
0.2
.4
Trea
tmen
t effe
ct
0 4 8 12Quarters in treatment
Delivery in health facility-.4
-.20
.2.4
Trea
tmen
t effe
ct
0 4 8 12Quarters in treatment
Delivered in study clinic
-.4-.2
0.2
.4
Trea
tmen
t effe
ct
0 4 8 12Quarters in treatment
Delivery assisted by doctor/midwife/nurse
!!!!
!
-.4-.2
0.2
.4
Trea
tmen
t effe
ct
0 4 8 12Quarters in treatment
Any prenatal care
-.4-.2
0.2
.4
Trea
tmen
t effe
ct
0 4 8 12Quarters in treatment
At least 4 prenatal visits
-.4-.2
0.2
.4
Trea
tmen
t effe
ct
0 4 8 12Quarters in treatment
Prenatal care from study clinic
-.4-.2
0.2
.4
Trea
tmen
t effe
ct
0 4 8 12Quarters in treatment
Delivery in health facility
-.4-.2
0.2
.4
Trea
tmen
t effe
ct
0 4 8 12Quarters in treatment
Delivered in study clinic
-.4-.2
0.2
.4
Trea
tmen
t effe
ct
0 4 8 12Quarters in treatment
Delivery assisted by doctor/midwife/nurse

38
Table 15: Heterogeneous Program Effects by Individual-Level Characteristics
Provider Presence
Any Antenatal Care
4+ Antenatal Visits
Antenatal Care from Study Clinic
Facility Delivery
Delivery in Study Clinic
Skilled Birth Attendance Postnatal Check
Treated*Post 0.121 0.155 0.313* 0.162 0.082 0.013 0.042 0.101
(0.178) (0.107) (0.171) (0.157) (0.134) (0.155) (0.127) (0.147)
Treated*Post*Wealth -0.020 -0.019 -0.004 -0.024 0.003 -0.028 0.017 -0.015
(0.029) (0.018) (0.027) (0.024) (0.023) (0.025) (0.023) (0.023)
Treated*Post*Married -0.022 0.083 0.135 0.050 0.013 0.029 0.039 0.015
(0.142) (0.071) (0.093) (0.071) (0.082) (0.074) (0.082) (0.088)
Treated*Post*Literate -0.020 0.005 -0.057 0.071 0.016 0.107 -0.023 -0.108
(0.076) (0.051) (0.088) (0.075) (0.075) (0.075) (0.076) (0.068)
Treated*Post*Muslim -0.037 -0.020 0.007 -0.065 -0.046 -0.109 -0.041 -0.084
(0.067) (0.051) (0.083) (0.073) (0.070) (0.078) (0.073) (0.071)
Treated*Post*Male 0.089 -0.044 -0.050 -0.017 -0.093 0.015 -0.088 -0.027
(0.054) (0.052) (0.070) (0.061) (0.060) (0.061) (0.056) (0.061)
Treated*Post*Multiple birth 0.067 -0.200 -0.078 0.221 -0.038 0.231 0.022 0.288
(0.173) (0.167) (0.164) (0.187) (0.240) (0.226) (0.218) (0.244)
Treated*Post*Low risk 0.054 -0.042 -0.206** 0.010 -0.060 0.032 -0.052 0.009
(0.066) (0.048) (0.083) (0.073) (0.075) (0.078) (0.075) (0.082)
Treated*Post*Age at birth -0.001 -0.004 -0.009** -0.005* 0.000 -0.000 0.000 0.001
(0.004) (0.003) (0.004) (0.003) (0.003) (0.003) (0.003) (0.003)
Treated*Post*Autonomy -0.042 0.008 0.019 0.029 -0.025 0.023 -0.033 0.036
(0.054) (0.040) (0.060) (0.054) (0.053) (0.057) (0.049) (0.056)
Constant 0.710*** 0.559*** 0.511*** 0.355*** 0.346*** 0.214** 0.239*** 0.212**
(0.096) (0.059) (0.090) (0.086) (0.079) (0.088) (0.073) (0.086)
Observations 2,699 5,575 5,583 5,583 5,583 5,583 5,583 5,583 R-squared 0.284 0.318 0.231 0.334 0.378 0.351 0.407 0.298 *** p<0.01, ** p<0.05, * p<0.1; Standard errors in parentheses are clustered at catchment area level. All regressions include month and community fixed effects as well as all two-way interactions between Treated, Post and the included individual characteristics. Wealth contains the quintiles of an asset-based index. Married, Literate, and Muslim are indicators for whether the mother is (currently) married, literate, and Muslim, respectively. Male and Multiple birth are indicators for whether the child was male and one of multiple births, respectively. Low risk is an indicator for whether the mother had any pre-term complications. Age at birth is the mother’s age at birth. Autonomy is a dummy that takes the value 1 if the woman reports that she makes health decisions for herself (either solely or jointly with her partner).
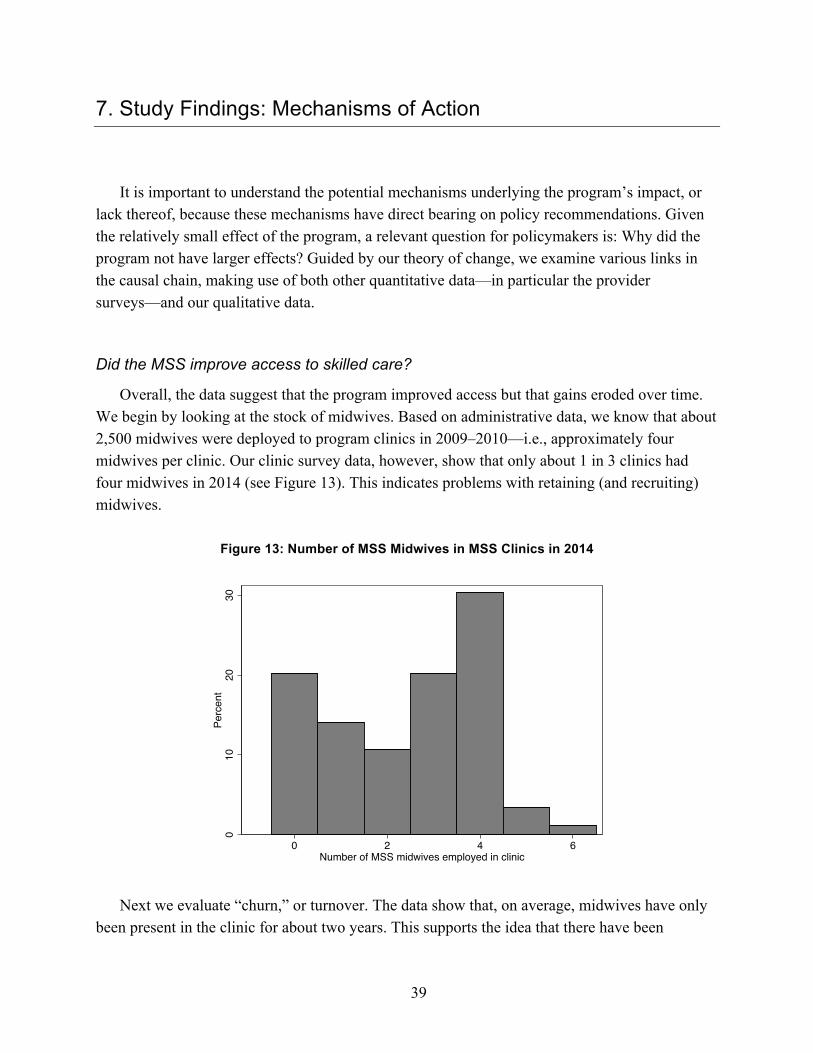
39
7. Study Findings: Mechanisms of Action
It is important to understand the potential mechanisms underlying the program’s impact, or lack thereof, because these mechanisms have direct bearing on policy recommendations. Given the relatively small effect of the program, a relevant question for policymakers is: Why did the program not have larger effects? Guided by our theory of change, we examine various links in the causal chain, making use of both other quantitative data—in particular the provider surveys—and our qualitative data.
Did the MSS improve access to skilled care?
Overall, the data suggest that the program improved access but that gains eroded over time. We begin by looking at the stock of midwives. Based on administrative data, we know that about 2,500 midwives were deployed to program clinics in 2009–2010—i.e., approximately four midwives per clinic. Our clinic survey data, however, show that only about 1 in 3 clinics had four midwives in 2014 (see Figure 13). This indicates problems with retaining (and recruiting) midwives.
Figure 13: Number of MSS Midwives in MSS Clinics in 2014
Next we evaluate “churn,” or turnover. The data show that, on average, midwives have only been present in the clinic for about two years. This supports the idea that there have been
010
2030
Perc
ent
0 2 4 6Number of MSS midwives employed in clinic

40
problems with retaining midwives. Figure 14 reveals some heterogeneity by region, with shorter tenures on average (indicating greater “churn”) in the north, and particularly in the northeast.25 By itself, more frequent turnover is not necessarily bad if departing midwives are replaced. To assess this we also graph the average number of MSS midwives employed in the clinic as of 2014. We see that the number of midwives in 2014 has decreased from 2009 levels across all zones but more so in the north, and especially so in the northeast. On average, there are three MSS midwives employed in each clinic in the south in 2014 (75 percent of 2009 levels) compared to two MSS midwives per clinic in the north (50 percent of 2009 levels).
Figure 14: Number of Midwives and Midwife Tenure by Zone
The qualitative data also support this conclusion, with many midwives reporting that they were looking to leave the MSS and community members and policymakers saying that retention posed a serious threat to the sustainability of the scheme. Our data shed some light on why there have been problems in retaining midwives.
1. Difficulties associated with being relocated to a new area
A feature of the MSS is that midwives are sent to underserved priority areas, which for some could mean moving considerable geographic distances to states with different predominant religions and culture. A number of comments by midwives suggested a degree of social isolation. For example one newly qualified midwife noted that ‘there is no market and social amenities in
25 This region has been plagued by conflict and insecurity, so this is perhaps not surprising.
1.8
2.9
.76.94
1.9
2.7 2.7
3.4
2.62.8
2.4
3
01
23
4
North Central North East North West South East South South South West
Mean number of years midwife employed in clinicMean number of MSS midwives per clinic in 2014

41
the village.’ (K1M2). For one midwife, the distance between her posting and her family was indicated as a reason for wanting to leave the scheme.
I’m looking for appointment somewhere [else] […] I’m not from here, I am from Niger state and my husband based there, and my children are there. So anytime that I have opportunity to work in Niger state… (K2M1)
This was supported by the accounts of women and some local policymakers who sympathized with the challenge of living a long way from home.
The nurses should be devoted to their work. Most of them are married and are not living with their husbands. They go to visit their husbands and as such are not usually around. But, they try the way they should. […] that while sending these midwives to the rural areas, they should be sent to their state or their local government where they will be close to their husbands, so that they will concentrate and do their work well. (E3FG3)
That is the problem we are facing now, related to our staff if you post somebody, any women, outside the Local Government, the husband will start complaining. It’s too far, […] this is the problem; she is taking care of my children and other things. So that is our main problem. (K3LGA3)
‘It is difficult for some of them to adapt to the cultural practices of the community despite availability of some basic social amenities e.g. Television, supply of electricity etc.’ (K1FG1)
2. Lack of Adequate Accommodation
In the clinic survey, only 63 percent of midwives reported being provided with accommodation through the MSS. When asked about their level of satisfaction with the accommodation provided, 37 percent of midwives reported being unsatisfied while 14 percent reported being very unsatisfied. Only 4 percent reported being very satisfied. The qualitative data provide additional insight. Midwives overwhelmingly reported that accommodation was either not provided or considered to be inadequate and/or in a state of disrepair.
You don’t expect me to be sharing a room with somebody, I have passed that stage. You don’t expect me to go to toilet and keep squatting now, I have passed that stage. At times, you’d see snake coming out because the place is not fenced. People will come and leave, even at night you are not safe, you wouldn’t know what will happen at night because a lot of people come here. They invade this place at any minute of the day. But, if they had made things to look good, it is our responsibility to stay at work because we know that deliveries normally come in the night. When they come and they don’t see midwives, it doesn’t tell well of us. (E2M2)
Their houses… really there are houses, not that there are none, but really they are in need of repairs. Because actually even ceiling there isn’t. Like during hot season, they really endure a lot of heat. There is no ceiling, no generator no fan that they can be using. (K3FG2)

42
The accommodation is not ok. With the Ebola problem, we are living with bats. So we complained, and they are promising. And up till now, nothing has been done. (Kw3M1)
Where accommodation was perceived to be inadequate, midwives reported that they had complained to local government officials but that this had no effect. Consequently, some midwives had resorted to living away from the health center, which in turn increased their travel burden and was reported to have had a negative financial impact. Community members and specifically ward development committees were reported in several cases to have been instrumental in providing or improving accommodation and enabling midwives to be able to afford to stay and work in the health centers.
I also thank them [the community] for providing us with this accommodation, because had it been that we rented apartment, based on what they are paying us, we couldn’t have coped or let alone paying for transportation to get here, we couldn’t have coped. If only this local government will be doing something by paying us, and possibly the state too, we will be very happy. (E3M2)
In addition to affecting midwife retention and longer-run supply, these problems appear to have negatively impacted access in the short run.
Since then the problem of accommodation has been serious it has hindered this project to improve very well. Because under normal circumstances we were supposed to be living in the community and us living in the community even if we don’t run night shift we could be woken up any time there’s a delivery. But this is not the case, and then the villagers too are saying that most of them give birth in the night, this is true and that is the period we are not around, so it supposed to be a beautiful program but it is not well run (Kw1M1)
In this our town, some of our midwives do not stay at the service of the women; especially when the women want to give birth because many of them do not live in this our this thing especially in emergency cases. A woman may be experiencing labor in the night, and she runs to this place, and sometimes. That’s why some when they come here and they don’t see some of them in the night, especially, the husband may rush her to any nearby…to some of these local this thing. I’m saying that if enough midwives will be provided here and they give them accommodation to see that some of them work…just like in the township, you know that some work in the night, and some work in the afternoon. Unlike in this place, they don’t do like that in this our area. When it is in the night, you will not get anybody. So in emergency cases, some of the pregnant women suffer. (E2FG2)
You know that when a woman in labor come to health center for delivery and it happens that the health center was locked, and there is nobody around, she will go outside and give birth or what do you expect her to do if not to look for a nurse around and go to her home and ask the nurse to conduct delivery for her. So that is why it is very important that health centers should be open at all times and the health workers should always be available. (E1FG1)
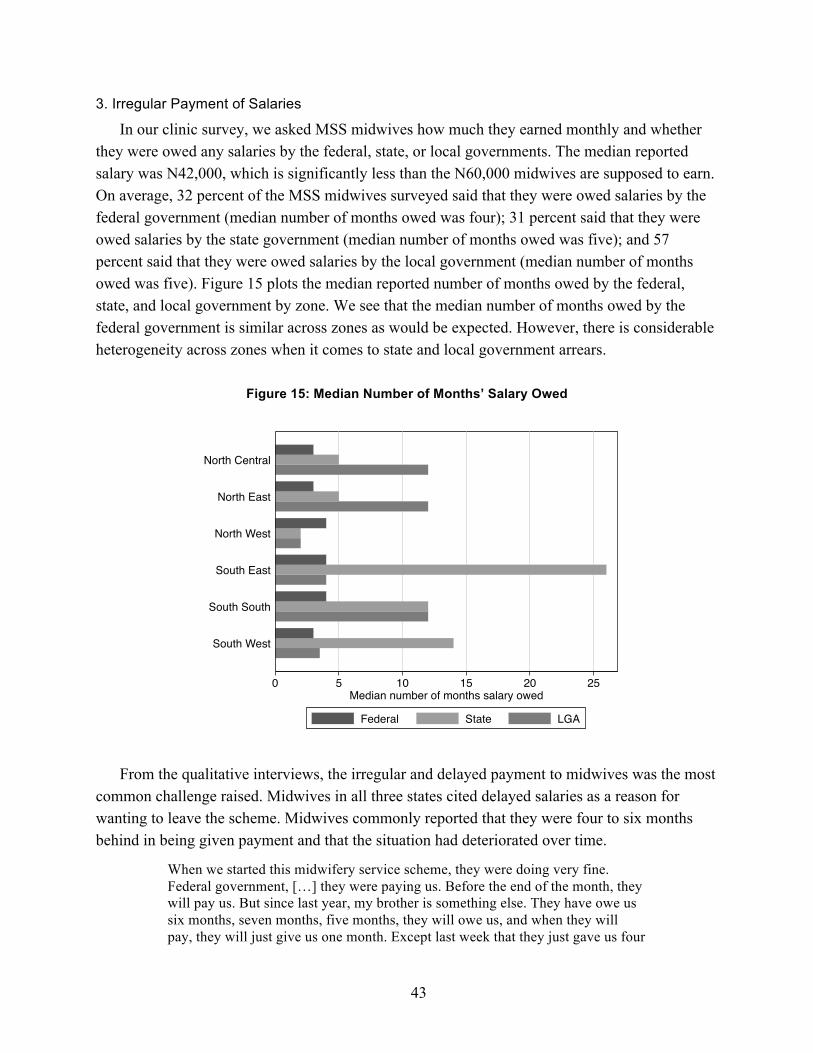
43
3. Irregular Payment of Salaries
In our clinic survey, we asked MSS midwives how much they earned monthly and whether they were owed any salaries by the federal, state, or local governments. The median reported salary was N42,000, which is significantly less than the N60,000 midwives are supposed to earn. On average, 32 percent of the MSS midwives surveyed said that they were owed salaries by the federal government (median number of months owed was four); 31 percent said that they were owed salaries by the state government (median number of months owed was five); and 57 percent said that they were owed salaries by the local government (median number of months owed was five). Figure 15 plots the median reported number of months owed by the federal, state, and local government by zone. We see that the median number of months owed by the federal government is similar across zones as would be expected. However, there is considerable heterogeneity across zones when it comes to state and local government arrears.
Figure 15: Median Number of Months’ Salary Owed
From the qualitative interviews, the irregular and delayed payment to midwives was the most common challenge raised. Midwives in all three states cited delayed salaries as a reason for wanting to leave the scheme. Midwives commonly reported that they were four to six months behind in being given payment and that the situation had deteriorated over time.
When we started this midwifery service scheme, they were doing very fine. Federal government, […] they were paying us. Before the end of the month, they will pay us. But since last year, my brother is something else. They have owe us six months, seven months, five months, they will owe us, and when they will pay, they will just give us one month. Except last week that they just gave us four
0 5 10 15 20 25Median number of months salary owed
South West
South South
South East
North West
North East
North Central
Federal State LGA

44
months’ salary, which they have been holding...getting six months, they now paid us four months. (E2M1)
We have problem with our... Federal […] they don’t pay us, sometimes 4 months, 5 months, 6 months, before them pay us . . . (K2M1)
We are not been paid our remuneration. We were last paid [7 months ago]… we were supposed to be given stipend by the local and state government but we have never been given a kobo by the Kwara state government.[…] The local government was given ten thousand naira before but after a year they stopped it so nothing, nothing. (Kw1M1)
Some midwives reported that they and their colleagues had complained to their local government but to no avail and perceived that it was a particular problem of the MSS rather than a general lack of funds because other health professionals were being paid.
I don’t know the kind of hatred they [the LGA] have for nurses. I have written to the chairman and written to the supervisory councilor. I have even talked with supervisory councilor one on one, he said I should go and put it on paper. I went, typed it and gave him. Maybe, the problem has to do with the head of department, he doesn’t like us. He doesn’t like the nurses at all. See the CHEW [community health extension worker] that came in the other day, they have started paying them and we were here before them. They refused to pay us the supplementary allowance the National Primary Healthcare asked them to pay us. For more than four years we have been here, but the CHEW that came in barely six months ago or one year ago, they are enjoying the supplementary allowance from the local government. […] Another challenge is on the part of the local government living up to their own responsibilities. Other LGAs are paying their staff, why wouldn’t they pay us? They are paying the junior ones but they are not paying us. What crime have we committed? (E2M2)
We are still protesting for the local government to be paying us. It is written in our deployment letter that they should be giving us supplementary allowances, and we have been going there for it. They keep asking us, ‘what is MSS?’ they said we are not their staff. The local government chairman even said that he is trying to pay those that he employed, let alone we. He said we are just here for supplementary, he was not the one that employed us. (E3M2)
Some of this appeared to be due to lack of funds, but there were other reasons as well. In Kano and Kwara states, for example, changes in administration were considered to have been disruptive, with incoming governments being unaware of their responsibility regarding the MSS.
Some local government don’t have the money to pay and they have not paid for a period of time. Most of them [midwives] have even finished their service and gone out without receiving any penny from the local government. […] when the HODs [heads of department] of health in Enugu state met, we discussed about it and found out that most local government don’t pay. When [name] was paying fifteen thousand per MSS, other local governments don’t even pay. So, at a certain stage, when the new chairman here came and saw that other local governments are not paying, he stopped paying. (E2LGA)
We tried all our possible means for the local government chairmen to reimburse this midwives but all our efforts was in vain […] the local government is not able

45
to pay their counterpart fund because of the little allocation that is send to them. (KwLGA1)
The problem is that we used to have frequent change of leadership at the LGA level. They are called Interim Management Officers and they use to be changed from one LGA to another. Now that new substantive chairmen have been elected, some of them do not know about the Scheme, but we are enlightening them to know it so that they can take up their responsibilities and live up to expectation. (KSPm1)
Irregular salaries were perceived to be having a negative impact on morale and policymakers considered that without payment midwives would not have the incentive to remain in post, while a number of midwives stated that they were actively looking for work elsewhere as a result of the “poor payment” (K1M1).
Regular payment of the stipends will make the scheme sustainable, but when they stop paying them the stipends, the morale of those involved will dampen. […] whatever you do is measured in terms of money, and the more money you are given the more work is expected of the person, so the present allowance should be improved. (E3LGA).
If I have like these federal jobs like...federal job in federal medical center. The MSS salary and that salary are not the same now! So I will join that one. So I will make the MSS know that I am no longer with them. (E2M1)
Because they are not paying us, regularly. […]. Nobody in Nigeria will work for six months, without payment! (K2M2)
If the salary is resumed normally definitely till my health says no but if it is not done I don’t think I can continue till the end of this year. (Kw1M1)
Irregular payments of allowances were not the only problem. One issue noted was that the current payment structure made no distinction between midwives’ level of experience, with experienced midwives being paid the same as newly qualified midwives, and in some cases an equivalent amount to community health extension workers, a less skilled cadre of health workers. Additionally, it was noted that the salary had not increased since the inception of the scheme, and as such there was no reward or recognition for those that continued to serve the scheme.
Did the MSS improve (perceived) quality?
Quality of services is an important determinant of demand (Dipankar Rao & Peters, 2007; Mariko, 2003). If households did not perceive quality to have improved, this might help to explain the small effect of the program on the use of services. Below we examine some indicators of quality that are observable to households.
1. Clinic Infrastructure
The MSS did not tackle physical infrastructure, which in many cases remained inadequate. Only 44 percent of facilities received a rating of “good” by field staff regarding the physical

46
condition of the building, and half of interviewed MSS midwives reported being dissatisfied with the physical condition of the health facility. Facilities in Enugu and Kano, where qualitative interviews were carried out, were reported to be “neat” by both midwives and community stakeholders; in Kwara, however, the condition of two of the facilities was perceived to be detrimental to their ability to deliver care.
That is supposed to be our office if you get there now half of it is just sand, even the doors to this clinic are not closing, they are eating up by termite. The structure itself is bad (Kw1M1)
It is not conducive for delivery because the roof of the delivery room has been blown off and there are not enough beds […] There is no room to keep patients for observation especially when it’s raining. We can’t admit for 24 hours. […]no toilets for patient use (Kw2M1)
Renovation of the hospital would make it look better and more attractive to women that deliver at home (Kw2WH2)
Lack of electricity and water were also frequently cited as problems. Of most concern, in all three of the facilities in Enugu and one in Kwara, was the lack of, or unreliable supply of, electricity. Thirty-five percent of MSS clinics in the clinic survey reported having no electricity. Even among clinics with electricity, the median reported number of days without power in the last month was 15, and nearly a third of clinics reported having no backup generator. Midwives reported that lack of electricity impacted their ability to deliver care.
You know, it is recently that they brought all the instruments needed for the delivery here. Could you believe that up till now that I am just seeing light for the first time? We conduct deliveries in the night with lantern. Where is it done in the modern world? How much does a generator cost? Yet, they find it difficult to provide a generator for this facility. How can you be delivering with lantern? (E2M2)
We have Sonic K (fetal monitor) here, but we don’t use it because we cannot charge the battery. (E1M2)
Community residents echoed these concerns:
They should make sure that there is regular power supply because we don’t have public power supply so that it will help preserve drugs given to children. (E2WC1)
Then another one concerning water, because there is supposed regular supply of water especially at the delivery room; because if there is no water, there are certain things that the nurses usually do immediately after conducting delivery; they will use water to take care of the person who just delivered. So water supply is very important in our community—and good water supply. This will help in doing things when they are supposed to be done; because a woman may come in the night and after delivery and it may be that there is no water, and you know is not good that after delivery, the woman will remain unclean till morning. (E1FG1)

47
We urge the government to provide a standby generator for us at the health facility. Because sometime when they are working and there is light failure it equally affect their work. (Kw1FG1)
Lack of clinic transportation was also seen as a problem, particularly with regards to transporting emergency cases to higher-level facilities.
The most challenges, one: they said that local government will provide bus, motor, vehicle for us in case of emergency or if we need referral, we can use our bus to transport the person. But after that promise, we have gone to local government to complain about that and nothing has been done about that. (E2M1)
Perhaps you will be assuming that the car is readily available here. Just as soon as they rush out a patient, she will be put in the car and they will go? Well, as a matter of fact, you have to go out and source for [a vehicle]! Don’t even be surprise that the patient will be in a critical situation that before you even secure a vehicle, her condition have deteriorated. (K3FG2)
The staff are working with nothing, no good equipment, no services like van or Maternal Child Health buses. The government of Enugu state bought Maternal Child Health buses and distributed to all the health departments, most of these buses have since been dilapidated and are no longer good to go on in the services. Somebody could be in labor and there will be no vehicle to transport that person to the next existing level of health care, so it is one of the big problems facing us. (E2LGA)
2. Drugs and Equipment
Medicines, functional equipment, and other consumables can be thought of as complementary inputs to skilled labor in the care production function. Field staff checked for the availability of 33 medicines ranging from antimalarials to antibiotics. On average, clinics had only about half of these medicines in stock, and 21 percent of clinics did not have availability of any of the drugs. They also checked the availability of basic equipment, such as blood pressure cuffs, weighing scales, midwifery kits, and incubators. For each piece of equipment, we assigned clinics a score of one if they had at least one that was functional. The median score out of 22 was 13.
Availability of drugs and equipment was noted as an important issue in the qualitative interviews. In cases where clinics had run out of drugs, women were required to personally purchase the drugs from the pharmacy. The lack of availability was considered by one midwife to create a negative perception of the clinic in the minds of the women, and it was evident from the accounts of midwives and community members that the lack of drugs had a direct effect on the care that could be provided at the facilities.
Yes, at time we have some problem. For example, we don’t have the MAMA (midwifery) kits and there is no place to even buy a pad in this village. Because we told them to come as everything is free. So they come without anything. In cases where they need fluid and drugs we prescribed for them to buy at the pharmacy. (K1M1)

48
I think that one other problem again is the supply of drugs; drugs, enough drugs. The availability of drugs! It is not that for instance, if there is no doctor, and if there other people that may be standing in place of doctor, when you come here, the problem will now be that there is no drug. (E2FG2)
My advice is that drug supply should be given adequate attention. Don’t let the health facility go without drugs. Please tell them to help us put enough drugs there. You know it will not be good for us to go to the facility and not get drugs. The mothers will be unhappy about that. (Kw3WC1)
Sometimes, they use to say that drugs are given free but when you come here sometimes, they will tell you that some drugs are free and some are not. So we want adequate supply of drugs to us and our children. (E1WC1)
3. Staff Availability
A challenge that midwives and community members, including recent mothers, all identified was that there was insufficient staff in the health clinics and that in some cases services were not provided 24 hours a day. For midwives in Enugu and Kano, this lack of staff resulted in feeling overstretched and having to work hours over the requirements of the post.
Wow! To God Almighty, sincerely my feeling towards this job is 150 percent not even 100 percent guarantee because even when I am off duty I come out to volunteer and do the job. There was a day I was preparing for church and I was off that day, I saw a woman on labor and nobody was in the hospital to assist her, I had to suspend the church and conduct the delivery. (E3M2)
If they don’t have enough nurses in case someone goes into labor in the night so they have nurses that are at work in the night, also have nurses available in the morning and afternoons too, so that whenever you come you will be able to see the nurses. That’s what I have to say […] Like from today if government will agree to bring in more nurses to this place if the nurses here are not many and also bring other thing that will help them in carrying out their duties effectively. If it is done, then we would also be coming to the health facility. (E2WH2)
Another issue is lack of enough staffs…for the run of 24 hours shift. […] they [midwives] are not enough to cater for the population.[…] We are seeking for additional staffs for the clinic as currently there are not enough health workers at the facility for a complete 24 hour shift […] the most important challenge is lack of adequate skilled health workers. […] (K1FG1)
It was also evident from midwives in Enugu and Kwara that lack of doctors was considered an important barrier to dealing with complications during pregnancy and labor was limited by the lack of a permanently stationed doctor at the clinic.
We also need medical personnel, that is, a medical doctor on regular basis, though there are corps members that come occasionally. (E1M1)
Probably if we have a doctor things would have been different. Even though we too we are trying our best but sometime in cases of referrer probably they would not have had the course to be referred. (Kw1M1)
Community members also noted that this affected their confidence in services at the clinic and the proper management of complications there.

49
‘The most important thing for us is doctor; to ensure that doctors are always around; because if they are always around, the challenges around childbirth will be reduced. If in case of complications during childbirth…if it was only the nurses were around (our nurse are trying really, they are very hard working in terms of delivery), but if a doctors is around, if it were cases that the nurses cannot handle, the doctor will handle it himself because he is more experienced than the nurses.’ (E1FG1)
You know that it is not all the illness that the midwives can handle. So the absence of doctor in this place is part of the drawbacks we are having here; because if there is doctor here, you will be confident that anytime you have illness, there is always a doctor to handle it. (E2FG2)
Did the MSS change knowledge/attitudes towards care seeking?
The survey data provide some evidence that low perceived value of MCH services continued to be an issue among women. For example, for 70 percent of births that did not take place in a health facility, the mother reported that it was not necessary. In contrast only 4 percent and <1 percent of the time did the mother give “facility not open” and “no female provider” as the reason why. This also comes across in the qualitative interviews. In Kano state the lack of awareness over the importance of being attended by a skilled attendant was cited as an important barrier to progress by local government and community stakeholders.
So the greatest challenge of this maternal child health, I can say…ahh…social mobilization in the first place, because many people, many client, they don’t know what is happening and related to this prenatal services. So it is when we were, they were informed what is the importance of this prenatal care, they normally try to be in the facilities with the conduct of these services. (K3LGA)
But before, I myself, the first childbirth of my wife, when she conceived and got some ailment and went to [named] Hospital, they said she should be coming for prenatal. When she came and said, they said, I should be going for prenatal, I said, what is prenatal? Sincerely speaking, I refused her (K3FG2)
Among women who reported a preference for home birth there was a low level of awareness of the importance of attending MCH service. For four of the seven women, all from Kano, their reason for wanting to give birth at home related to the fact that “it was the wish of God” (K1WH1). Another two women stated that “it was easier” (K1WH2) and “I found it more convenient delivering at home” (Kw1WH2), and the notion that it was less troublesome to give birth at home was cited as an advantage of home birth by the women interviewed more widely. Finally the seventh woman reasoned that “since there is no any problem that disturbed me, I used to plan of home delivery” (K2WH1).
Community stakeholders however reported that there has been some outreach by midwives and this has helped to at least create some awareness about the program.
Now people with the outreach being passed in the previous weeks, months or years, the villagers know that something is existing and they are sending their wives here to take care of them both in delivery and children and all worth not.

50
So people are attending here, the workers here were attending to the people. So there is improvement the way I see it. (E2FG2)
Yes they use to go round and give awareness talks. Even children that are sick. They use to give counseling, that they should come to the pediatric section. As for the women’s aspect, they use to warn women. They use to go from house to house. If you feel pains, or you notice that a problem is about occur, you should rush to the hospital. Even if we close from work, we are at our houses, close to you. Your husband’s know our houses. They can come and bring us over. (K3FG2)
The majority of women interviewed also reported that they had been counseled by the midwives to “come to the health center because that is the place I will deliver without any issue; and then that it is not good to give birth at home.” (E1WC3).
Taken together, the data suggest that while some progress was made towards changing knowledge and attitudes regarding seeking care during pregnancy and delivery, this continued to be an important barrier to use of services.
Other Barriers
Although there seemed to be a desire among women interviewed to give birth at a health facility, women cited a number of barriers to accessing care that led to their giving birth at home. This included the difficulty in getting to the clinic once labor had begun due to the lack of transportation, and the costs associated with giving birth at the clinic.
When labor started, we couldn’t get a machine [motorcycle] to bring us here and my husband doesn’t have any. And again, the labor has intensified, and as a result, I couldn’t walk. And so I have no option again than to give birth at home. So the people around me took care of me because our house is far from here [the clinic]. (E1WH1)
The second challenge is poverty, it will be the problem, because most of them, they don’t have means, number one, if you take this transportation, that is, the challenges that we have been facing. We have facilities, like here in [PHC name] but you have a lot of ahh….. patients/clients all over surrounded to the area, but they cannot have any means of transport to be here. So it is one of the greatest challenges. (K3LGA)
Really I would expect changes in the aspect of cost, the aspect of cost. If they were asking for N100, let them come down so that people will be attracted to it. Bring down the cost, and as they are bringing down the cost, they should ensure that these things are open, transparent, not hidden, so that everybody can come and see that this is the cost of assessing services here. (E2FG2)
Poverty is another thing. People are so poor. If you get to the rural areas you will discover that people cannot afford the former antenatal charge and deliver. They tend to deliver at home. Many at times, the few health facilities available they have to trek long distances before they get there. Lack of transportation is there. Someone in labor in the night, you have to carry the person to a very far place and transport is not there. (K3LGA)

51

52
8. Discussion and Policy Recommendations
The results in the previous section show that the MSS did not have the expected impacts. The main measured effect of the program is that it increased the use of antenatal care. These gains are concentrated in the first year of the program. On average, we do not find any evidence of an increase in institutional deliveries or skilled birth attendance. However we find some heterogeneity by region with suggestive but not conclusive evidence of a small increase in skilled birth attendance in the south (the coefficient is not statistically significant at conventional levels). To put these results into context, the goal of the MSS was to double the proportion of births attended to by skilled birth attendants by December 2015. We do not find any statistically significant improvements in postnatal visits or child immunizations. Given the above, it is not surprising that we do not find any evidence of improvement in maternal and child health.
Our rich quantitative and qualitative data allow us to shed some light on why the program did not have the expected impacts. We show that while the program increased access to skilled care (via the midwives), access eroded over time, in part, due to challenges in retaining and recruiting midwives. The data suggest that such problems as difficulties associated with relocating to new areas, inadequate provision of housing accommodation, and irregular payment of salaries (which worsened over time) contributed to midwives wanting to leave the scheme. Our analysis indicates that attrition was a more serious problem in the north,26 where we observe a pattern of substantial initial impacts (given low baseline rates) that then eroded over time. In the south where midwife attrition was less of a challenge we find suggestive evidence of small positive effects on deliveries in a health facility and deliveries attended by skilled personnel (though the confidence intervals include zero). Implementation challenges alone, however, do not fully explain the study findings. The data suggest that part of the reason why the program did not have larger impacts is that other dimensions of quality did not improve. For example, clinic infrastructure in many cases remained poor, as did availability of drugs and supplies. We also find some evidence that demand-side barriers, such as low valuation of services by mothers and households, and lack of transportation to clinics, continued to play an important role.
Globally, there is a strong push to increase coverage rates of skilled birth attendance as a means to reducing high rates of pregnancy- and childbirth-related mortality (Filippi et al., 2006). In many of the countries lagging behind MDG-related targets, poor access to skilled health providers, particularly in rural areas, is regarded as an important constraint (Koblinsky et al., 2006; Kesterton et al., 2010). There is, however, limited empirical evidence about the effects of
26 This has been attributed to the fact that many more midwives originate from the south and therefore when posted to communities in the north are less likely to stay there long term (personal communication with NPHCDA).

53
scaling up access to skilled care, a gap that this study helps to fill. Frankenberg et al. (2009), one of the few examples, find weak evidence that the village midwife program in Indonesia, a program that deployed nearly 50,000 midwives over seven years, increased use of antenatal care and the likelihood of delivering with the assistance of a medically trained provider. Fauveau et al. (1991) study a similar midwife program in Bangladesh and find that many home births were still not attended by midwives. Given the dearth of empirical evidence, researchers have attempted to use projection models to estimate the effects of scale-up (Homer et al., 2014; Bartlett et al., 2014). The results of this evaluation underline the need for caution in generalizing from these estimates.
A number of specific policy recommendations emerge from the data. We divide these into two groups. First, we consider approaches that can be implemented in the near term at relatively low cost; second, we consider longer-term strategies. We then conclude by drawing out more general lessons.
8.1 Near-Term Strategies
Engage with State and Local-Level Policymakers
Many of the problems noted, such as non-payment of salaries, can be traced back to a lack of engagement of state and local-level policymakers. The qualitative interviews revealed dissatisfaction with the perceived top-down management structure of the MSS. State and local policymakers in Enugu and Kano, for example, universally expressed disappointment at the lack of consultation during the design and development stages of the scheme. Among state policymakers - particularly in Enugu where they denied any knowledge of the scheme when asked a direct question regarding the MSS—there was resentment towards the federal government, whom they considered to have forced the scheme upon states without any consultation.
The concept is a good program but the implementation, the implementation I will tell you has jaundice […] if you want this scheme to be sustained, definitely you should involve the people that need it and therefore the design, and the implementation should be bottom-up approach, where even the communities are part of the design, the LGA is part of the design, the states are part of the design, but if you come to hang it at the national level, definitely the state will leave, it is not something that is designed at that level is sustaining, it is difficult to sustain anything that is hung at that level. (ESPm1)
Contrary to the role of the states outlined in the MOU, policymakers in Enugu state reported playing no role in the implementation of the scheme. One suggested that the division of responsibility drawn up in the MOU does not align with the setup of health care in Nigeria given that the state government has responsibility for secondary care only.
They [Federal government] do everything, as a matter of fact most states don’t even know what is happening in MSS, they hire, they pay, they supervise without

54
involving the state, I find. One still wonders how somebody in Abuja will be able to supervise an employee in Enugu or say any other state in Nigeria, […] so as a matter of fact we have no hands because we cannot supervise people you did not hire. (ESPm2)
State-level policymakers in Enugu and Kano considered that the homogeneous design of the scheme meant that it had not been suitably tailored to meet the needs of the individual states.
You cannot stay in Abuja and then take into consideration the peculiarities of different states and this design is designed in a generic form, so they designed it in a generic form without a recourse to the peculiarities to different states, different LGAs, different cultural background, different educational level, different socio economic level, they don’t have recourse, they just design it in generic form in Abuja and then force down the throat of states (ESPm1)
For it to go well, we have to return to the drawing table because it is a good scheme, it is a good scheme, we have to actually return to the drawing table and…emm… explain to the stakeholders what you are doing, explain to them how you are funding it, explain to them how you disbursing the funds, carry them along when you are doing the recruitment, because at the local government level where you are going to post those people to the community, there are indigenes there who I know will be better positioned to run those program, you can imagine posting somebody from Enugu to Adamawa state, do you think the person will go, she will just sign the acceptance letter and stay where she is, so there must be a proper planning, I don’t think they have planned enough in implementing the program. (ESPm3)
Ensure Adequate Compensation for Midwives
Compensation was clearly an issue of primary importance to midwives. When asked to rate their satisfaction on various work-related dimensions, midwives were most dissatisfied with their salary and employment benefits (see Figure 16).

55
Figure 16: Average Ratings Given by Midwives
NOTE: We converted the categorical ratings to a numerical scale by assigning scores to each rating (1 = very unsatisfied, 2= unsatisfied, 3 = neither satisfied nor unsatisfied, 4 = satisfied, and 5 = very satisfied)
Contrast these ratings with assigned ratings on more “neutral” dimensions, such as the level of midwives are accorded within the community and their relationship with other staff. To drive home this point, when presented with a list of potential improvements that could be made to their work conditions and asked to select the three most important (in order of importance), salaries were rated number two overall (see Figure 17). Interestingly, the top three requested improvements remain the same regardless of whether one ranks by total mentions or number of “most important” mentions.
12
34
5Av
erag
e ra
ting
Availability of medicinesCondition of health facilityYour training opportunitiesYour salary
Your employment benefitsYour safety and securityYour respect in the communityYour relationship with other staff

56
Figure 17: Ranking of Potential Improvements
NOTE: The overall length of each bar indicates how many times each factor was mentioned while the colored sections indicate how many times it was cited as the most important, second most important, or third most important (from left to right).
Create a “Career Ladder” and Opportunities for Professional Development
Based on the MOU, MSS midwives were supposed to be absorbed into state employment, but this was clearly not happening in many states. One consequence of not being on a permanent contract noted by a state-level policymaker in Kano was that the MSS midwives and state employed staff were not treated as equals by the government. For this reason, he explained that MSS midwives had not received additional training opportunities or promotions. In order to retain the midwives, he advised that states should be absorbing them into their employment.
If you look at these midwives, it is not possible for you to retain them for a long time on contract basis. Sustainability may be better if the States take over completely, since the midwives will now be absorbed as permanent staff in accordance with the MoU [memorandum of understanding]. It is there in the MoU that the midwives should be absorbed, but even in Kano State, when the scheme was started, there was no establishment of the Board, but now that there is establishment of the board, we will attempt to absorb them because the board is more technical than the Ministry. Employ rather than continue to use them as contract staff. If you leave them as contract staff for a long time, they are more likely to leave the service and go elsewhere. However, unfortunately many of the States do not have a policy for absorbing. Even in Kano. However, offering them
0 10 20 30 40 50 60 70 80 90
Emotional support for staff
Be3er working hours/flexible times
Other benefits
More support from supervisor
More supplies/stock
Less workload (more staff)
Be3er facility infrastructure
Increased security
Be3er quality equipment/supplies
Higher salary
More knowledge/updates training
Most important 2nd most important 3rd most important

57
full time employment will be a challenge since when we attempted to do so in Kano, the Ministry of Health was saying they will send them to secondary facilities, because they don’t have midwives there too. (KSPm1)
Many midwives perceived the MSS to be temporary. Factors noted as contributing to this included the lack of a pay structure, the fact that it was not pensionable, and the absence of opportunities for promotion.
I expect that the scheme should be permanent and pensionable and to create room for promotion and increase in salary for those who came earlier. If I’m working in other places like the state government or Federal, I could have gotten my promotion. But I’m still the same with the new comers. (K1M1)
Yes, for instance, like our allowance, we’ve been working for four years, and our allowance is….stagnant! (K2M2)
Except for one LGA in Kano and one in Kwara, midwives reported either that there was no ongoing professional development provided or that it had been discontinued. Midwives and policymakers highlighted the lack of training and resulting challenges in staying up to date in best practices.
The major problem is that since this people were posted most of them have not even undergone any training, trends are evolving and except this people are periodically trained and retrained they will just be doing the old practice. (ESPm3)
They have trained us in the beginning early years, but right now, frankly speaking, we don’t receive additional trainings since from the beginning, about the life saving skills. And that one, has been about two years old. (K3M1)
From Figure 17, it is clear that opportunity for professional development was the most frequently requested improvement requested by midwives.
Consider Local Recruitment and Hiring Where Possible
For the majority of state policymakers the requirement that midwives be relocated was considered to be one of the major threats to the long-term sustainability of the scheme, as midwives do not stay in post. State policymakers interviewed suggested that future efforts should focus on building up local capacity, a concept that was supported by community members in Kano.
Sustainability will affect especially in the north. In the north we do not have enough indigenous midwives, we rely on southerners and this creates a problem. Retention rate is higher in the south because they are at home there. Many of them working in the north after sometimes will tell you they want to go back home because they want to go back to their communities to marry or so. (KSPm1)
‘The way recruitment is structured, the thing was designed just like the volunteered teachers scheme that we developed in Enugu state, you work in the community were you retired from so that logistics problems will not arise, but
58
you will see one of the midwives being posted from Enugu state to Borno, Enugu state to Adamawa, how do you think they can function there defeating the aim you know using the catchment area.’ (ESPm3)
Our children in the community also need to be integrated into the scheme because they also have the educational qualification. So that they can comfortably posted and work in their community. We are working with the LGA towards these issues. (K1FG1)
In Kano, the potential for cultural clashes between the midwives and community was identified as a possible barrier to community acceptance of the midwives and to seeking care at the clinic. However, this was only reported to be an issue by midwives working in Kwara, who claimed that difficulties arose as a result of language barriers. In general, community members, including those in Kwara, recounted that in reality it had not been an issue; the majority of midwives were widely reported to have been well received and valued as a result of their hard work.
While local recruitment and hiring may not be possible in all states given the uneven distribution of human resources, taking into account midwives’ locational preferences is a measure that can be implemented in the short term at relatively little cost. This is likely to increase midwife retention.
8.2 Longer-Term Policy Recommendations
Address Demand-Side Factors
The MSS was intended to relieve perceived supply-side constraints and did not specifically target the demand side beyond trying to increase knowledge/awareness about use of maternal and child health services. Evidence from other settings suggests that demand-side factors are substantively important (Obare et al., 2013; Powell-Jackson & Hanson, 2012).27 We find some evidence that low perceived value attached to MCH services by households hindered uptake—in our household survey, for example, we found that for 70 percent of births that did not take place in a health facility, the mother reported that it was not necessary. Outreach activities carried out as part of the MSS were only partially successful in changing knowledge/attitudes regarding seeking care during pregnancy and delivery, suggesting that more intensive campaigns to change women’s (and men’s, given their critical role in household decisionmaking) valuation of these services will likely be important in the future.
We also found that other demand-side factors, such as costs associated with use of services and lack of adequate transportation, hindered uptake. In the longer term, we recommend that demand-side incentives be incorporated into the scheme. However this comes with its own
27 As we noted earlier, the new iteration of the MSS, the SURE-P MCH program incorporates a conditional cash transfer. The effects are as yet unknown (an evaluation by the World Bank is ongoing).

59
caveats: First, it is clear that cash incentives are not a magic bullet (Murray et al., 2014); second, while there is evidence that these incentives help to stimulate demand, there is very little evidence that increased use of services translates to mortality reductions (Godlonton & Okeke, 2015; Mazumdar et al., 2011; Okeke & Chari, 2015).
Address Other Supply-Side Factors
We highlighted the importance of a number of other supply-side factors, including physical infrastructure and availability of drugs and equipment. Addressing these factors should be a longer-term target of the program. Some of these factors are being addressed in the new iteration of the MSS (the SURE-P MCH program), and it will be interesting to see how this influences program effects.28
Our evaluation highlights the complexity of scaling up access to skilled care. As the evaluation shows, not only is scaling up provider supply a complex undertaking with significant implementation and operational hurdles that must be overcome, it also, by itself, may not be a sufficient condition for increasing utilization. Our findings provide valuable lessons for policymakers looking to increase utilization of maternal and child health services. First, they highlight the critical importance of identifying key barriers to utilization in a given setting; these barriers will likely vary from place to place, and achieving the desired impact largely depends on addressing the key rate-limiting constraints. Second, they underscore the need for interventions addressing both supply- and demand-side barriers simultaneously. Complementarities between the two mean that addressing one without the other may not lead to the desired outcomes (Godlonton and Okeke, 2015). It is true that budget and administrative constraints necessarily limit the scope of any intervention, but they reinforces the need for a rigorous needs assessment to ensure that the right trade-offs are being made.
We conclude by noting that high rates of maternal and child mortality are a first-order concern in global health but that the complex multi-dimensional nature of the problem will require similarly multi-faceted strategies.
28 It will be difficult, however, to tease out the effects of the individual components of the program.

60
Appendix A: Survey Instruments
Supplementary Tables See the following pages.

61
Table A.1. Overview of Selected Characteristics of MSS Clinics
State PHC Resources
Access (days open per week)
Number of Staff Number of Deliveries
(July–Dec 2013)
Number of infant deaths
(July to December)
Number of Maternal Deaths
(in last year) Surveyor’s Comments Doctors Nurses Nurse/
Midwives
Enugu 1 No reliable electricity
7 1 0 4 28 0 0 Unkept and busy environment. Has staff quarters behind facility.
2 Has electricity 7 0 2 4 20 0 0 No fence round health facility. The midwife is so dedicated.
3 Has electricity 7 1 0 1 27 1 0 The facility is clean and well kept.
Kano 1 No reliable electricity
5 0 0 4 - - 0 n/r
2 No reliable electricity
7 1 0 2 176 n/r n/r The midwives complained of the absence of some vital drugs and other consumables sometimes. This frustrates their effort of providing services.
3 No reliable electricity
7 0 0 3 108 4 0 The midwives are not paid their entitlements and there is too much workload. The facility needs rehabilitation. The community women come for both ANC and PNC but prefer home delivery.
Kwara 1 Has electricity
7 0 1 3 2 0 0 The health workers do not run night shift due to various logistics. Deliveries are said to be few and very occasional as most of the deliveries occur at night when the health facility is closed.
2 Has electricity
7 0 0 5 40 0 0 Poor condition of the health facility. Structure is in a dilapidated condition.
NOTE: For PHC 1 in Kano, the recorded values for the number of deliveries and infant deaths are outliers and were recoded to missing.

62
Table A.2: Detailed Participant Characteristics (Semistructured Interviews with Eligible Women)
Woman State PHC Age Number of
Pregnancies Number of Children
Where Planned to Give Birth
Where Gave Birth
E1WC1 Enugu 1 28 3 4 Clinic Clinic
E1WC2 Enugu 1 nr 2 1 Clinic Clinic
E1WC3 Enugu 1 30 nr 2 Clinic Clinic
E1WC4 Enugu 1 30 5 5 Clinic Hospital
E1WH1 Enugu 1 30 9 9 Clinic Home
E2WC1 Enugu 2 26 1 1 Clinic Clinic
E2WC2 Enugu 2 28 3 3 Clinic Clinic
E2WC3 Enugu 2 23 3 3 Clinic Clinic
E2WH1 Enugu 2 25 3 3 Clinic Home
E2WH2 Enugu 2 23 3 3 Clinic Home
E3WC1 Enugu 3 21 4 4 Clinic Clinic
E3WC2 Enugu 3 nr 2 2 Clinic Clinic
E3WC3 Enugu 3 24 3 3 Clinic Clinic
E3WH1 Enugu 3 26 1 1 Clinic Home
E3WH2 Enugu 3 23 2 2 Clinic Home
K1WC1 Kano 1 30 7 7 Clinic Clinic
K1WC2 Kano 1 20 4 2 Clinic Clinic
K1WC3 Kano 1 20 6 6 Clinic Clinic
K1WH1 Kano 1 25 5 5 Home Home
K1WH2 Kano 1 25 6 4 Home Home
K2WC1 Kano 2 20 1 1 Clinic Clinic
K2WC2 Kano 2 25 5 5 Home Clinic
K2WH1 Kano 2 25 7 5 Home Home
K2WH2 Kano 2 nr nr nr Clinic Home
K2WH3 Kano 2 25 1 1 Clinic Home
K3WC1 Kano 3 19 1 1 Clinic Clinic
K3WH1 Kano 3 30 7 7 Home Home
K3WH2 Kano 3 23 4 3 Home Home
K3WH3 Kano 3 25 5 3 Clinic Home
K3WH4 Kano 3 25 7 7 Clinic Home
Kw1WC1 Kwara 1 30 5 5 Clinic Clinic
Kw1WC2 Kwara 1 20 3 3 Clinic Clinic
Kw1WH1 Kwara 1 25 5 5 Clinic Home
Kw1WH2 Kwara 1 30 5 5 Home Home
Kw2WC1 Kwara 2 38 nr 3 Clinic Clinic

63
Woman State PHC Age Number of
Pregnancies Number of Children
Where Planned to Give Birth
Where Gave Birth
Kw2WC2 Kwara 2 15 1 1 Clinic Clinic
Kw2WH1 Kwara 2 25 1 1 Clinic Home
Kw2WH2 Kwara 2 20 nr 3 Clinic Home
Kw3WC1 Kwara 3 30 5 5 Clinic Clinic
Kw3WC2 Kwara 3 25 1 1 Clinic Hospital
Kw3WC3 Kwara 3 27 3 3 Clinic Clinic
Kw3WH1 Kwara 3 34 4 3 Clinic Home
Kw3WH2 Kwara 3 30 4 3 Clinic Home

64
Appendix B: Pre-Analysis Plan
We are interested in evaluating the effect of the MSS on (1) access to health care, (2) utilization of care, (3) quality of care, and (4) health outcomes. Because both the definition of the analysis sample and the econometric methodology vary across these broad outcome categories, we take up each of them in turn.
1. Access to Care
We start by examining whether the MSS increased access to midwife care. In the first part of this analysis, we utilize clinic-level data on staffing to obtain the number of midwives in each clinic. Because it was not possible to directly obtain retrospective staffing information,29 the analytical strategy is simply to compare the current number of midwives in treated and control catchment areas.
Perceived access is arguably at least as important as actual access, however. To measure perceived access, we construct an indicator for whether doctor/nurse availability was cited as a reason for not delivering in a clinic. Our analytical strategy is a difference-in-differences (DID) approach that examines the relative change in perceived access in treated areas (relative to control areas). The econometric specification is the following:
𝑦𝑦!"# = 𝛼𝛼 + 𝛽𝛽𝑇𝑇𝑇𝑇𝑇𝑇𝑇𝑇𝑇𝑇𝑇𝑇𝑇𝑇!" + 𝜂𝜂! + 𝜂𝜂! + 𝑒𝑒!"# (𝟏𝟏)
where 𝑦𝑦!"# is an access measure associated with woman i in catchment area j who gave birth at time t; 𝑇𝑇𝑇𝑇𝑇𝑇𝑇𝑇𝑇𝑇𝑇𝑇𝑇𝑇!" is an indicator that takes the value 1 if the study clinic in catchment area j received the MSS in 2009; 𝜂𝜂! is a month (of birth) fixed effect; 𝜂𝜂!is a catchment area fixed effect; and 𝑒𝑒!"# is an unobserved error term. In this specification, our interest centers on the coefficient β,which measures the differential improvement in the outcome in treated areas relative to control areas. Standard errors are clustered at the level of the catchment area in order to account for correlation in the outcomes within this level.
A potential shortcoming of the access measure above is that it was only elicited for the sample of women who did not deliver in the clinic: As such, the estimated DID effects may also capture the effect of selection, as the “compliers” (i.e., the set of women who take advantage of the MSS to deliver in clinics) leave this sample. The resulting bias is difficult to sign, because
29Although employment start dates for midwives were elicited in the clinic survey, we are hesitant to use these to construct retrospective staffing histories, given the well-documented high rates of midwife attrition in the MSS program.

65
the MSS may have raised the perceptions of availability of all women, but to a greater extent for compliers than for “never-takers” (i.e. those who continued to deliver at home even after the introduction of the MSS in their local clinic).
A second set of measures can be constructed based on the responses of those women who did deliver in the clinic: (i) whether a doctor/nurse was in attendance, and (ii) whether they had planned to deliver in the clinic. We applying the DID estimation strategy as above to these measures. It is important to note that even though these measures are only elicited from women who delivered in the clinic, the first measure (whether a doctor/nurse was in attendance) is arguably not related to the characteristics of the respondent and therefore is less likely to suffer from selection bias due to changes in the composition of institutional births as a result of the MSS.
2. Utilization
(a) Antenatal care
To analyze the effect of MSS on the utilization of antenatal care, we must contend with the complication that treatment exposure is not binary for all individuals. In particular, some mothers would have been partially exposed because the MSS was introduced at a point when they were already pregnant (but before they delivered). To address this issue, we restrict the analysis sample to exclude all births that occurred within the first nine months of introduction of the MSS (i.e. the first nine months of 2009), since the associated pregnancies would have been partially exposed.
We consider the following measures of utilization: (i) use of any antenatal care (binary indicator); (ii) number of antenatal care visits; (iii) antenatal care obtained in study clinic (binary indicator); and (iv) time of first antenatal care visit (measured in terms of number of months into pregnancy).
For the first three measures, we utilize the difference-in-differences (DID) specification outlined in (1). Next, we consider the time to first visit. Although a hazard analysis suggests itself, the DID analysis is more easily incorporated into a modeling approach that takes advantage of the discrete measurement of time to estimate a series of linear probability models of the following form:
𝑦𝑦!"#! = 𝛼𝛼! + 𝛽𝛽!𝑇𝑇𝑇𝑇𝑇𝑇𝑇𝑇𝑇𝑇𝑇𝑇𝑇𝑇!" + 𝜂𝜂!! + 𝜂𝜂!! + 𝑒𝑒!"#! (𝟐𝟐)
where 𝑦𝑦!"#! is a binary indicator that takes the value 1 if woman i had her first prenatal visit in
or before month k of her pregnancy. In this specification, 𝛽𝛽! is the program impact on the probability of success (i.e. having a prenatal visit) by month k of the pregnancy. An examination of how 𝛽𝛽! changes with k will indicate the effect of the MSS on the time to first visit: For

66
example, suppose the MSS had no effect on the propensity to obtain antenatal care but instead only brought forward the date of the first visit, we would then observe that 𝛽𝛽! rises (weakly) with k before gradually returning to 0 by the end of the pregnancy (i.e. month 9).
(b) Delivery
We use linear probability models with the specification in (1) to examine whether the MSS affected (i) the probability of institutional delivery; (ii) the probability of delivery in the study clinic; and (iii) probability of a midwife-assisted delivery.
(c) Post-natal care
We focus on the completion of vaccination routines for children. According to WHO guidelines, children should have completed their basic immunizations by the end of their first year. As in the case of antenatal care, partial exposure must be carefully dealt with. We utilize the DID specification as before, restricting the sample to include only those children who were either completely or not at all exposed to the MSS in their first year of life.
3. Quality of Care To provide a bridge between the analysis of utilization and the analysis of health outcomes,
we examine the effect of MSS in terms of the quality of care provided. We construct a quality index pertaining to antenatal care based on the survey responses of women to questions about the care they received. Women who obtained antenatal care were asked whether they received each of a number of routine antenatal procedures and checks. Because care quality is not related to the characteristics of the respondent, the restriction of the sample to women who obtained antenatal care is not expected to result in any bias. However, this measure of the quality of care received may be affected by partial exposure because the various health checks are normally spread over a number of visits during the course of the pregnancy. As in the case of antenatal care utilization, therefore, we restrict the sample to exclude all births that occurred within the first nine months of introduction of the MSS.
4. Health Outcomes
Lastly, we turn to an examination of the impact of the MSS on health outcomes. We focus on two summary measures: (i) neonatal mortality, and (ii) maternal mortality. Whereas neonatal mortality is thought to be largely related to intra-partum factors, maternal mortality is likely affected by antenatal as well as intra-partum care, and exposure to MSS must therefore once again be carefully accounted for when one is defining the analysis sample for the DID regression.

67
A unique feature of our data collection is that we are able to relate maternal mortality to the choice of delivery location. This allows for a secondary analysis in which we can examine the effect of the MSS on maternal mortality, conditional on delivery location. The estimates obtained should be interpreted carefully, however, because they capture not only the effects of the MSS working through increased utilization and improved care quality but also compositional effects due to the changing risk composition of women who select into institutional delivery.

73
Appendix C: Sample Size and Power Calculations
Power to detect the treatment effect is a function of the minimum detectable effect size (d), number of clusters (J ), cluster size (n), and intra-class correlation (ρ). We assume ρ = 0.2 for utilization. Intra-cluster correlations (ICCs) for health outcomes are substantially lower, ranging from 0.005 to 0.02 for pregnancy complications (Taljaard et al., 2008), and from 0.0005 to about 0.003 for neonatal mortality (Pagel et al., 2011; Taljaard et al., 2008). The following tables show the minimum detectable effect sizes for different outcomes under various scenarios. In all calculations, J is set equal to 208. We conservatively assume only one birth per household in our calculations. If households have had >1 birth, it increases our effective sample size and power.
Table C.1: Detectable Effect Sizes for Utilization Outcomes
Cluster Size ICC
Power=80% Power=90% Facility Delivery
(24.7%) Skilled Birth
(27.7%) Prenatal
Care (46.4%) Facility Delivery
(24.7%) Skilled Birth
(27.7%) Prenatal
Care (46.4%)
20
0.10 4.7% 4.8% 5.2% 5.4% 5.6% 6.1% 0.15 5.4% 5.6% 6.0% 6.3% 6.4% 7.0% 0.20 6.0% 6.2% 6.7% 7.0% 7.2% 7.8% 0.25 6.6% 6.8% 7.4% 7.7% 7.9% 8.5%
30
0.10 4.4% 4.5% 5.0% 5.1% 5.3% 5.7% 0.15 5.2% 5.3% 5.8% 6.0% 6.2% 6.7% 0.20 5.9% 6.0% 6.5% 6.8% 7.0% 7.6% 0.25 6.5% 6.7% 7.2% 7.5% 7.8% 8.3%
40
0.10 4.3% 4.4% 4.8% 5.0% 5.1% 5.6% 0.15 5.1% 5.2% 5.7% 5.9% 6.1% 6.6% 0.20 5.8% 5.9% 6.5% 6.7% 6.9% 7.5% 0.25 6.4% 6.6% 7.1% 7.4% 7.7% 8.2%
NOTE: Base rates shown in parentheses.

69
Table C.2: Detectable Effect Sizes for Maternal Complications
Cluster Size ICC Power=80% Power=90%
20
0.0050 1.36% 1.59%
0.0075 1.39% 1.62%
0.0100 1.42% 1.66%
30
0.0050 1.12% 1.31%
0.0075 1.16% 1.35%
0.0100 1.19% 1.39%
40
0.0050 0.98% 1.15%
0.0075 1.02% 1.20%
0.0100 1.07% 1.24%
NOTE: Illustrative calculations shown are for postpartum bleeding (assumed base rate = 4%).
Table C.3: Detectable Effect Sizes for Neonatal Mortality
Cluster Size ICC Power=80% Power=90%
20
0.0005 1.42% 1.66%
0.0010 1.43% 1.67%
0.0020 1.44% 1.68%
30
0.0005 1.15% 1.34%
0.0010 1.16% 1.35%
0.0020 1.17% 1.37%
40
0.0005 0.99% 1.15%
0.0010 1.00% 1.17%
0.0020 1.02% 1.19%
NOTE: Assumed base rate = 4.9%.
We are also interested in the variance of the treatment effect across groups and in the power
to detect variability in the treatment effect. We assume a random effects model. The power to detect effect size variability is a function of a noncentrality parameter 𝜆𝜆, which is given by the following expression:
𝜆𝜆 =𝐾𝐾𝛿𝛿!
𝜎𝜎!! + 4[𝜌𝜌 + (1 − 𝜌𝜌 𝑛𝑛)]/ 𝐽𝐽

70
where 𝛿𝛿 is the standardized main effect of the treatment,30 𝜎𝜎!! is the standardized effect size variability, 𝜌𝜌 is the intra-cluster correlation and n, J, and K represent the cluster size, the number of clusters, and the number of groups respectively (Spybrook et al., 2011). Power for treatment effect variability is therefore a function of the cluster size n, the number of clusters J, the number of groups K, the standardized effect size variability 𝜎𝜎!!, and the intra-class correlation, ρ. The null and alternative tests for the treatment effect variability are:
𝐻𝐻!: 𝜎𝜎!! = 0
𝐻𝐻!: 𝜎𝜎!! > 0
The test for the variance of the treatment effect is an F test. The F statistic follows a central F distribution with df = K–1, K(J–2) and is given by the following expression:
𝐹𝐹 =𝜎𝜎!! + 4 𝜌𝜌 + !!!
!/𝐽𝐽
4 𝜌𝜌 + !!!!
/𝐽𝐽
30 The standardized effect size is the difference in the mean of the outcome for the treatment and control groups divided by the standard error of the outcome. We follow Cohen’s definition for standardized effect sizes, with 0.2, 0.5, and 0.8 as small, medium, and large effect sizes (Cohen, 1988).

71
References
Abimbola, Seye, Ugo Okoli, Olalekan Olubajo, Mohammed J. Abdullahi, & Muhammad A. Pate. (2012). The Midwives Service Scheme in Nigeria. PLoS Medicine, 9(5), e1001211.
Anand, Sudhir, & Till Bärnighausen. (2004). Human resources and health outcomes: cross-country econometric study. Lancet, 364(9445), 1603-1609.
Banerjee, A. V., E. Duflo, & R. Glennerster. (2008). Putting a Band‐Aid on a corpse: Incentives for nurses in the Indian public health care system. Journal of the European Economic Association, 6(2‐3), 487-500.
Barber, Sarah L., & Paul J.Gertler. (2009). Health workers, quality of care, and child health: Simulating the relationships between increases in health staffing and child length. Health Policy, 91(2), 148-155.
Bartlett L., E. Weissman, R. Gubin, R Patton-Molitors, & I. K. Friberg. (2014). The impact and cost of scaling up midwifery and obstetrics in 58 low- and middle-income countries. PloS one. 2014;9(6):e98550.
Beckett, M., J. DaVanzo, N. Sastry, C. Panis, and C. Peterson, (2001). The quality of retrospective data: An examination of long-term recall in a developing country. Journal of Human Resources, 36(3):593–625.
Beegle, Kathleen, Joachim De Weerdt, Jed Friedman, & John Gibson. (2010). Methods of Household Consumption Measurement Through Survey: Experimental Results from Tanzania, World Bank Policy Research Working Paper 5501.
Bellows, Nicole M., Ben W. Bellows, & Charlotte Warren. (2011). Systematic Review: the use of vouchers for reproductive health services in developing countries: systematic review. Tropical Medicine & International Health, 16(1), 84-96.
Bhutta, Zulfiqar A., Jai K. Das, Rajiv Bahl, Joy E. Lawn, Rehana A. Salam, Vinod K. Paul, M. Jeeva Sankar, Hannah Blencowe, Arjumand Rizvi, Victoria B Chou, & Walker Neff. (2014). Can available interventions end preventable deaths in mothers, newborn babies, and stillbirths, and at what cost? Lancet, 384(9940), 347-370.
Boeije, Hennie. (2002). A purposeful approach to the constant comparative method in the analysis of qualitative interviews. Quality and Quantity, 36(4), 391-409.
Buchmueller, Thomas C., Mireille Jacobson, & Cheryl Wold. (2006). How far to the hospital? The effect of hospital closures on access to care. Journal of Health Economics, 25(4), 740-761.
72
Case, Anne, & Cally Ardington. (2006). The impact of parental death on school outcomes: Longitudinal evidence from South Africa. Demography, 43(3), 401-420.
Cohen, J. 1988. Statistical Power Analysis for the Behavioral Sciences. Hillsdale, New Jersey: Lawrence Erlbaum Associates.
Darmstadt, G. L., A. C. Lee, S. Cousens, L. Sibley, Z. A. Bhutta, F. Donnay, D. Osrin, A. Bang, V. Kumar, S.N. Wall, A. Baqui, and J.E. Lawn. (2009). 60 million non-facility births: Who can deliver in community settings to reduce intrapartum-related deaths? International Journal of Gynecology & Obstetrics, 107, Supplement(0):S89–S112.
Das, Jishnu, Jeffrey Hammer, & Kenneth Leonard. (2008). The Quality of Medical Advice in Low-Income Countries. Journal of Economic Perspectives, 22(2), 93-114.
Debnath, Sisir. (2013). Improving Maternal Health with Incentives to Mothers vs. Health Workers: Evidence from India: Dissertation, University of Virginia.
Dipankar Rao K., & David H. Peters. (2007). Quality improvement and its impact on the use and equality of outpatient health services in India. Health Economics, 16(8), 799-813.
Ekirapa-Kiracho, Elizabeth, Peter Waiswa, M. Rahman, N. Kiwanuka, O. Oku, E. Rutebemberwa, J. Bua, A. Mutebi, G. Nalwadda, D. Serwadda, G. W. Pariyo, & D. H. Peters. (2011). Increasing access to institutional deliveries using demand and supply side incentives: early results from a quasi-experimental study. BMC International Health and Human Rights, 11(Suppl 1), S11.
Fauveau, Vincent, Kate Stewart, S. A. Khan, & Jyotsnamoy Chakraborty. (1991). Effect on mortality of community-based maternity-care programme in rural Bangladesh. The Lancet, 338(8776), 1183-1186.
Filippi, V., C. Ronsmans, O. M. Campbell, W. J. Graham, A. Mills, J. Borghi, M. Koblinsky, & D. Osrin. (2006). Maternal health in poor countries: the broader context and a call for action. Lancet, 368(9546):1535–1541.
Frankenberg, Elizabeth, Alison Buttenheim, Bondan Sikoki, & Wayan Suriastini. (2009). Do women increase their use of reproductive health care when it becomes more available? Evidence from Indonesia. Studies in Family Planning, 40(1), 27-38.
Glaser, Barney G., & Anselm L. Strauss. (2009). The Discovery of Grounded Theory: Strategies for Qualitative Research, Piscataway, New Jersey: Transaction Publishers.
Godlonton, Susan, & Edward N.Okeke. (2015). Does a ban on informal health providers save lives? Evidence from Malawi. Santa Monica Calif.: RAND Corporation, WR-1073. As of Juy 12, 2015: http://www.rand.org/pubs/working_papers/WR1073.html

73
Goldie, Sue J., Steve Sweet, Natalie Carvalho, Uma Chandra Mouli Natchu, & Delphine Hu. (2010). Alternative strategies to reduce maternal mortality in india: a cost-effectiveness analysis. PLoS Med, 7(4), e1000264.
Goldstein, M., J. Graff Zivin, J. Habyarimana, C. Pop-Eleches, & H. Thirumurthy.(2013). The effect of health worker absence and health clinic protocol on health outcomes: the case of mother-to-child transmission of HIV in Kenya. American Economic Journal: Applied Economics, 5, 58-85.
Graham, Wendy J., Jacqueline S. Bell, & Colin H.W. Bullough. (2001). Can skilled attendance at delivery reduce maternal mortality in developing countries? Studies in Health Service Organisation and Policy, 17, 97-129.
Harvey, Steven A., Yudy C.W. Blandón, Affette McCaw-Binns, Ivette Sandino, Luis Urbina, C. Rodríguez, I. Gómez, P. Ayabaca, S. Djibrina, & The Nicaraguan maternal and neonatal health quality improvement group. (2007). Are skilled birth attendants really skilled? A measurement method, some disturbing results and a potential way forward. Bulletin of the World Health Organization, 85(10), 783-790.
Homer C. S., I. K. Friberg, M. A. Dias, et al. (2014). The projected effect of scaling up midwifery. Lancet. Sep 20 2014;384(9948):1146-1157.
Islam, M Kamrul, & Ulf-G. Gerdtham. (2006). The costs of maternal-newborn illness and mortality. World Health Organisation. As of July 12, 2015: http://whqlibdoc.who.int/publications/2006/9241594497_eng.pdf?ua=1
Kesterton A.J., J. Cleland, A. Sloggett. & and C. Ronsmans. (2010). Institutional delivery in rural India: the relative importance of accessibility and economic status. BMC Pregnancy and Childbirth 10:30.
Koblinsky M, Z. Matthews, J. Hussein, et al. (2006). Going to scale with professional skilled care. Lancet. Oct 14 2006;368(9544):1377-1386.
Kumar, Santosh, & Dansereau, Emily. (2014). Supply-Side Barriers to Maternity-Care in India: A Facility-Based Analysis. PloS one, 9(8), e103927.
Leonard, Kenneth L., & Melkiory C. Masatu. (2010). Using the Hawthorne Effect to examine the gap between a doctors best possible practice and actual practice. Journal of Development Economics, 93(2), 226-243.
Lim, Stephen S., Lalit Dandona, Joseph A. Hoisington, Spencer L. James, Margaret C. Hogan, & Emmanuela Gakidou. (2010). India’s Janani Suraksha Yojana, a conditional cash transfer programme to increase births in health facilities: an impact evaluation. Lancet, 375(9730), 2009-2023.
74
Mahler, H. (1987). The safe motherhood initiative: a call to action. (1987). Lancet, 329(8534), 668-670.
Mariko, M. M. (2003). Quality of care and the demand for health services in Bamako, Mali: the specific roles of structural, process, and outcome components. Social Science & Medicine, 56(6), 1183-1196.
Mazumdar, Sumit, Anne Mills, & Timothy Powell-Jackson. (2011). Financial Incentives in Health: New Evidence from India’s Janani Suraksha Yojana. As of July 12, 2015: http://www.researchgate.net/publication/255707981_Financial_Incentives_in_Health_New_Evidence_from_India%27s_Janani_Suraksha_Yojana
Mohanan, Manoj, SebastianBauhoff, Gerard La Forgia, Kimberly Singer Babiarz, Kultar Singh, & Grant Miller. (2014). Effect of Chiranjeevi Yojana on institutional deliveries and neonatal and maternal outcomes in Gujarat, India: a difference-in-differences analysis. Bulletin of the World Health Organization, 92(1), 187-194.
Montagu, Dominic, Gavin Yamey, Adam Visconti, April Harding, & Joanne Yoong. (2011). Where Do Poor Women in Developing Countries Give Birth? A Multi-Country Analysis of Demographic and Health Survey Data. PLoS ONE, 6(2), e17155.
Murray, Susan, Benjamin Hunter, Ramila Bisht, Tim Ensor, & Debra Bick. (2014). Effects of demand-side financing on utilisation, experiences and outcomes of maternity care in low- and middle-income countries: a systematic review. BMC Pregnancy and Childbirth, 14(1), 30.
National Population Commission (NPC) [Nigeria] and ICF Macro. (2009). Nigeria Demographic and Health Survey 2008. Abuja, Nigeria: National Population Commission and ICF Macro.
National Primary Care Development Agency (NPHCDA). (2010). Midwives Service Scheme—Baseline Survey Report.
Nguyen, Ha T.H., Laurel Hatt, Mursaleena Islam, Nancy L. Sloan, Jamil Chowdhury, Jean-Olivier Schmidt, Atia Hossain, & Hong Wang. (2012). Encouraging maternal health service utilization: An evaluation of the Bangladesh voucher program. Social Science & Medicine, 74(7), 989-996.
Obare, Francis, Charlotte Warren, Rebecca Njuki, Timothy Abuya, Joseph Sunday, Ian Askew, & Ben Bellows. (2013). Community-level impact of the reproductive health vouchers programme on service utilization in Kenya. Health Policy and Planning, 28(2), 165-175.
Okeke, Edward N., & A.V. Chari. (2015). Can Institutional Deliveries Reduce Newborn Mortality? Evidence from Rwanda. Santa Monica, Calif.: RAND Corporation, WR-1072. As of July 8, 2015: www.rand.org/pubs/working_papers/WR1072.html
75
Okoli, Ugo, Laura Morris, Adetokunbo Oshin, Muhammad A. Pate, Chidimma Aigbe, & Ado Muhammad. (2014). Conditional cash transfer schemes in Nigeria: potential gains for maternal and child health service uptake in a national pilot programme. BMC Pregnancy and Childbirth, 14(1), 408.
Pagel, C., A. Prost, S. Lewycka, S. Das, T. Colbourn, R. Mahapatra, K. Azad, A. Costello, D. Osrin, et al. (2011). Intracluster correlation coefficients and coefficients of variation for perinatal outcomes from five cluster-randomised controlled trials in low and middle-income countries: results and methodological implications. Trials, 12(1):151.
Pitchforth, Emma, Edwin van Teijlingen, Wendy Graham, Mary Dixon-Woods, & Mushtaque Chowdhury. (2006). Getting women to hospital is not enough: a qualitative study of access to emergency obstetric care in Bangladesh. Quality and Safety in Health Care, 15(3), 214-219.
Powell-Jackson, Timothy, & Kara Hanson. (2012). Financial incentives for maternal health: Impact of a national programme in Nepal. Journal of Health Economics, 31(1), 271 - 284.
Randive, Bharat, Vishal Diwan, & Ayesha De Costa. (2013). India’s Conditional Cash Transfer Programme (the JSY) to promote institutional birth: Is there an association between institutional birth proportion and maternal mortality? PLoS ONE, 8(6), e67452.
Ronsmans, C., J. F. Etard, G. Walraven, L. Hoj, A. Dumont, L. de Bernis, & B. Kodio. (2003). Maternal mortality and access to obstetric services in West Africa. Trop Med Int Health, 8(10), 940-948.
Sousa, Angelica, Mario R. Dal Poz, & Cynthia Boschi-Pinto. (2013). Reducing inequities in neonatal mortality through adequate supply of health workers: Evidence from newborn health in Brazil. PloS one, 8(9), e74772.
Spybrook, J., S. Raudenbush, X. Liu, & R. Congdon. (2011). Optimal Design for Longitudinal and Multilevel Research: Documentation for the Optimal Design Software Version 3.0. Available from www.wtgrantfoundation.org.
Taljaard, M., A. Donner, J. Villar, D. Wojdyla, A.Velazco, V. Bataglia, A. Faundes, A. Langer, A. Narváez, E. Valladares, et al. (2008). Intracluster correlation coefficients from the 2005 WHO global survey on maternal and perinatal health: Implications for implementation research. Paediatric and Perinatal Epidemiology, 22(2):117.
USAID. (2001). USAID Congressional Budget Justification FY2002: program, performance and prospects—the global health pillar: Washington DC: United States Agency for International Development.
Valente, Christine. (2014). Access to abortion, investments in neonatal health, and sex-selection: Evidence from Nepal. Journal of Development Economics, 107(0), 225-243.

76
Wang, Wenjuan, Soumya Alva, Shanxiao Wang, & Alfredo Fort. (2011). Levels and Trends in the Use of Maternal Health Services in Developing Countries: DHS Comparative Reports No. 26. Calverton, Maryland, USA: ICF Macro.
World Health Organisation (WHO), International Confederation of Midwives (ICM), & International Federation of Gynecology and Obstetrics (FIGO). (2004). Making pregnancy safer: the critical role of the skilled attendant. A joint statement by WHO, ICM and FIGO: World Health Organization (WHO), Geneva.