The Benefits of Public Protections
40
The Benefits of Public Protections: Ten Rules That Save Lives and Protect the Environment JULY 2014
-
Upload
center-for-effective-government -
Category
Documents
-
view
215 -
download
0
description
This report examines the public health, worker safety, and environmental benefits projected from ten proposed or final rules issued between 2009 and 2014 by five federal agencies (the U.S. Environmental Protection Agency, Occupational Safety and Health Administration, National Highway Traffic Safety Administration, Food and Drug Administration, and Department of Agriculture’s Food Safety and Inspection Service). These rules range from reducing toxic air pollutants from power plants and other large industrial sources, to reducing workers’ exposure to disease-causing silica, and to making vehicles safer.
Transcript of The Benefits of Public Protections
The Benefits of Public Protections: Ten Rules That Save Lives and Protect the Environment
JULY 2014
AUTHORS
July Tran, Regulatory Policy Intern
Ronald White, Director of Regulatory Policy
CONTRIBUTORS
Katherine McFate, President and CEO
Brian Gumm, Communications Director
Justin Santopietro, Regulatory Policy Intern
ABOUT THE CENTER FOR EFFECTIVE GOVERNMENT
The Center for Effective Government works to build an open, accountable government that invests in the common
good, protects people and the environment, and advances the national priorities defined by an active, informed
citizenry.
Individuals and organizations wishing to quote, post, reprint, or otherwise redistribute this report, in whole or
in part, are permitted to do so if they provide attribution to the Center for Effective Government as the original
publisher. To contribute to the Center for Effective Government, please visit http://www.foreffectivegov.org/donate.

The Benefits of Public Protections:
Ten Rules That Save Lives and Protect the Environment

TABLE OF CONTENTSExecutive Summary
Introduction
The Mandate to Use Benefit-Cost Analysis
Calculating the Benefits and Costs of Public Protections
The Social and Economic Benefits of Regulations
Report Methodology
Findings
Conclusion
Appendix A -- Summary of Rules Examined
1. Proposed Rule: Occupational Exposure to Respirable Crystalline Silica
2. Final Rule: Federal Motor Vehicle Safety Standards, Ejection Mitigation
3. Proposed Rule: Federal Motor Vehicle Safety Standards; Electronic
Stability Control Systems for Heavy Vehicles
4. Final Rule: Nutrition Labeling of Single-Ingredient Products and Ground or
Chopped Meat and Poultry Products
5. Final Rule: Prevention of Salmonella Enteritidis in Shell Eggs During
Production, Storage, and Transportation
6. Final Rule: National Ambient Air Quality Standards for Particulate Matter
7. Final Rule: Mercury and Air Toxics Standards
8. Final Rule: Control of Air Pollution from Motor Vehicles: Tier 3 Motor
Vehicle Emission and Fuel Standards
9. Proposed Rule: Hazardous and Solid Waste Management System;
Identification and Listing of Special Wastes; Disposal of Coal Combustion
Residuals from Electric Utilities
10. Proposed Rule: Effluent Limitations Guidelines and Standards for the
Steam Electric Power Generating Point Source Category
1
3
4
5
7
9
10
14
15
15
16
17
18
19
21
23
25
27
29
1
EXECUTIVE SUMMARY
In a democracy, citizens expect their government to enact laws that protect their health and
well-being. Starting with the Progressive Era in the early 1900s, this meant ensuring that unsafe
drugs and food could not be marketed to unsuspecting consumers and that workers in industrial
settings were not being forced to labor in unhealthy or high-risk workplaces. With the growth of
the consumer and environmental movements of the 1960s and 1970s, government responded to
citizen concerns about industrial pollution and chemical toxins with rules limiting the emissions
and contaminants that businesses are allowed to produce in their operations. As our knowledge of
the health risks of new substances has grown, so has public pressure to regulate their use.
However, the rules requiring private industry to reduce worker exposure to toxic substances or
reduce emission of hazardous contaminants are usually contested by affected industries. There
are costs to complying with new health and safety rules and some firms in some industries
bitterly fight these additional costs. In response to the arguments over regulatory standards, a
new analytic tool came into use. Benefit-cost analysis attempts to quantify and monetize the
societal value of new restrictions on corporate behavior (such as the use or emission of potentially
hazardous or poisonous materials), and to simultaneously estimate the costs of compliance
with these new rules by private commercial interests. We agree with many of the criticisms of
benefit-cost analysis, but since it has become enshrined as a key practice in the public policy rule
development process over the past 30 years, we use it in this report as a tool to help assess the
benefits of the rules discussed below.
This report examines the public health, worker safety, and environmental benefits projected
from ten proposed or final rules issued between 2009 and 2014 by five federal agencies (the U.S.
Environmental Protection Agency, Occupational Safety and Health Administration, National
Highway Traffic Safety Administration, Food and Drug Administration, and Department of
Agriculture’s Food Safety and Inspection Service). These rules range from reducing toxic air
pollutants from power plants and other large industrial sources, to reducing workers’ exposure to
disease-causing silica, and to making vehicles safer.
When fully implemented, results from benefit-cost analyses estimate that these rules will save
over 10,000 lives and prevent 300,000 cases of disease, illness, or injury each year. Using
standard benefit-cost analysis methodology (which consistently underestimates social benefits
and overestimates compliance costs), nine of the ten significant public health and environmental
standards examined here were estimated to have monetary social benefits that exceeded

2
estimated monetary compliance costs – even before taking into account the substantial qualitative,
unquantifiable improvements in public health and the environment that accrue from these rules.
Combined, traditional benefit-cost analyses for these ten rules projected net benefits of
between $46 billion to $122 billion per year. None of the rules were projected to have a
significant negative impact on the economy; in fact, three of the rules are projected to create net
new jobs.
In our modern, globalized world, innovations in science and technology will continue to occur at
an accelerating pace. In a democracy, it is government’s role to weigh the risks and rewards to the
public interest and society as a whole from the introduction of new products and enterprises. The
role of the public sector is to protect the common good and prioritize the public’s interest over
particular private interests. Rules to safeguard the public are an integral part of our democratic
process and are essential to providing an appropriate balance between public health and safety
and private profits.
3
INTRODUCTION
In a democracy, citizens expect their government to protect their health and well-being since both lawmakers
and public servants are ultimately accountable to “the people.” Starting with the Progressive Era in the early
1900s, this meant ensuring that unsafe drugs and food could not be marketed to unsuspecting consumers and
that workers in industrial work settings were not forced to labor in unhealthy or high-risk workplaces. The New
Deal brought more oversight of financial institutions and the associational and workplace rights of workers. With
the growth of the consumer and environmental movements of the 1960s and 1970s, government responded to
citizen concerns about industrial pollution and chemical toxins by establishing rules limiting the emissions and
contaminants that businesses are allowed to use or produce. Over time, as our expanding knowledge of medicine
and science has improved our ability to evaluate the health risks of hazardous substances, public pressure to
regulate their use has also grown.
In practice, however, demands for better protections for human health and the environment have always been
contested. There are costs to complying with new health and safety standards, and some firms in some industries
have bitterly fought rules that increase their costs or constrain their activities. Even after the catastrophic oil spill
in the Gulf of Mexico, the explosion in West, Texas, the contamination of the Elk River in West Virginia, and
the housing and economic collapse that resulted from deregulating financial institutions, some observers argue
that private firms are able to “self-regulate” and will respond to “the discipline of the market” and so need no
collective standards or external enforcement of responsible standards of corporate behavior.
In our democracy, the balance between the public’s interest in health and safety and commercial interests’ desire
for profits is hashed out in the political square – first, through laws passed by elected representatives of the
people (Congress and the president) that prioritize the value of human health and workplace safety, and next,
through the specific, detailed rules that allow executive branch agencies to implement and enforce the priorities
already written into law. For example, rules establish limits on the emissions or contaminants that commercial
enterprises are allowed to produce, the workplace conditions that employers are required to maintain for their
workers, and the information a bank has to provide a borrower.
Rules are created utilizing the expertise of agency scientists and technical staff and after extensive research and
consultation with scientists, engineers, industry-specific experts, workers, business owners and managers, and
the public. Congress allocates the funds to enact the rules that agencies establish in order to implement the laws
it passes. Rules are a critical manifestation of the democratic response to public demand. They are a reflection of
society’s values and are designed to achieve and protect the common good.

4
Rulemaking is our democracy’s way of balancing the interests of the public’s safety and well-being with the
profit-maximizing goals of the private sector. In fact, regulatory standards benefit private businesses as well. They
create a stable commercial environment, set the rules of competition, prevent a “race to the bottom,” and increase
consumer confidence in products. If a rule is contested, it is almost always because a particular private business
or industrial sector has a vested interest in maintaining the status quo.
Regulations are needed to provide the public with essential protections that we as individuals cannot secure
ourselves. Without regulations, we would not have the cleaner air and water quality or safer workplaces and
products that we now take for granted. In a society with no or too little regulation, only the wealthy and
privileged would be able to afford protections. This is not how a democratic society should function. Our
national duty is to ensure equitable protections for everyone, and rules that provide those protections are a vital
component of achieving that objective.
This report examines the public health, worker safety, and environmental benefits projected from ten proposed
or final regulations issued between 2009 and 2014 by five federal agencies (the U.S. Environmental Protection
Agency, Occupational Safety and Health Administration, National Highway Traffic Safety Administration,
Food and Drug Administration, and Department of Agriculture’s Food Safety and Inspection Service). These
rules range from reducing toxic air pollutants from power plants and other large industrial sources to reducing
workers’ exposure to disease-causing silica.
THE MANDATE TO USE BENEFIT-COST ANALYSIS
The use of benefit-cost analysis in the rulemaking process originated with an executive order issued by President
Ronald Reagan in 1981. The executive order required the development of a regulatory impact analysis (RIA) for
any “significant” regulatory action undertaken by executive branch agencies.1 A “significant” rule was defined
in a previous Carter administration executive order as having an annual economic impact, either positively or
negatively, of $100 million or more.2 In today’s dollars, the equivalent impact on the nation’s gross domestic
product would be $713 million.3 Since this figure has not been adjusted to reflect its relationship to the current
national economy, executive agencies are conducting impact analyses for rules that have substantially less impact
than they did more than 30 years ago. Rules that lead to a notable change in, or inconsistency with, existing
national policy are also considered “significant regulatory actions.” Under Reagan’s executive order, a rule’s 1 Executive Order 12291, issued by President Ronald Reagan. Exec Order No. 12291 (Feb. 17, 1981). Available at http://www.presidency.ucsb.edu/ws/?pid=43424.2 Executive Order 12044, issued by President Jimmy Carter, established the definition of a “significant” regulation as one having $100 million or more economic impact on the economy. Exec. Order No. 12044 (March 23, 1978). Available at http://www.presidency.ucsb.edu/ws/?pid=30539.3 Based on the ratio of $100 million to the 1978 U.S. GDP of $2.357 trillion as applied to the 2013 U.S. GDP of $16.803 trillion. Data source: http://useconomy.about.com/od/GDP-by-Year/a/US-GDP-History.htm.

5
monetized societal benefits had to outweigh the compliance costs to industry in order for the rule to go forward.4
In 1993, President Bill Clinton issued an executive order replacing the Reagan executive order and establishing
that the benefits of rules should “justify” their compliance costs. Clinton’s executive order notes that these rules
should be designed to maximize their cost effectiveness while recognizing that some costs and benefits are
difficult to quantify.5 This approach to designing rules and assessing their benefits and costs was reaffirmed by
President Barack Obama in 2011.6
The regulatory impact analysis for every major proposed rule prepared by an executive branch agency
identifies the issue being addressed, possible regulatory options, and the costs and benefits of each option. It
also establishes a baseline point for comparison and includes consideration of any side effects of the rule. The
proposed rule and RIA are submitted to the Office of Management and Budget’s (OMB) Office of Information
and Regulatory Affairs (OIRA) for review; this office can send the rule back for further analysis or reject the rule
and require the agency to substantially revise its proposal and/or RIA.7
CALCULATING THE BENEFITS AND COSTS OF PUBLIC PROTECTIONS
Though benefit-cost analysis has become a staple of regulatory analysis, its current methodology has significant
flaws and limitations. In addition to the ethical concerns about putting a price on human life or suffering from
disease, these analyses are highly dependent on the assumptions upon which projections are based.
Benefits are often underestimated for the following reasons: First, improvements in public health and the
environment are diffuse and often difficult to quantify. Additionally, there is often sufficient scientific evidence to
indicate a significant causal link between a problem and its impact (e.g., exposure to methylmercury and adverse
cardiovascular effects), but not enough information to quantify or monetize that relationship. When benefits are
too difficult to quantify, they are often dropped from the analysis entirely, meaning a significant societal benefit
is simply omitted.8 Agency analyses of the societal benefits of a new rule or standard often list the benefits that
are not able to be quantified and monetized, but it is essential that these unquantifiable benefits be considered in
estimating the level of protection provided by a regulatory action.
4 Op. Cit. 5 Executive Order 12866, issued by President Bill Clinton, established the current cost-benefit analysis requirements, 58 FR 51735 (Oct. 4, 1993). Available at http://www.reginfo.gov/public/jsp/Utilities/EO_12866.pdf. 6 Executive Order 13563, issued by President Barack Obama, 76 FR 3821 (Jan. 18, 2011). Available at http://www.gpo.gov/fdsys/pkg/FR-2011-01-21/pdf/2011-1385.pdf. 7 Office of Management and Budget Circular A-4, defines best practices for regulatory analysis. (Sept. 17, 2003), Available at http://www.whitehouse.gov/sites/default/files/omb/assets/omb/circulars/a004/a-4.pdf.See also OMB Circular A-4 “Regulatory Impact Analysis: A Primer.” (Aug. 15, 2011). Available at http://www.whitehouse.gov/sites/default/files/omb/inforeg/regpol/circular-a-4_regulatory-impact-analysis-a-primer.pdf. 8 Center for Progressive Reform “Saving Lives, Preserving the Environment, Growing the Economy: The Truth about Regulation.” White Paper #1109 (July 2011). Available at http://www.progressivereform.org/articles/RegBenefits_1109.pdf.

6
Societal benefits are further underestimated due to the practice of “discounting” future benefits. Discounting
is used to convert future costs and benefits into present values so that they are comparable (e.g., a business
would need to invest in new control equipment in the near term to adhere to a new pollution emissions
standard, but the benefits of a cleaner environment would accrue to the public over a long period of time in
the future). Discounting places greater value on benefits that are received closer to the present than those that
occur farther in the future. The choice of a discount rate is subjective, but federal agency economists usually
discount the future value of benefits and compliance costs by three percent or seven percent per year, as these
are the guidelines set by the Office of Management and Budget.9 For rules whose societal benefits emerge after
a long period of time (for example, rules that reduce the amount of greenhouse gases in the atmosphere to
address climate change), discounting the value of the benefit over long periods of time means that its estimated
benefits will eventually disappear, when of course the real benefits may in fact grow over time.10 This concern is
acknowledged by OMB as well.11
As societal benefits are often underestimated, compliance costs are often exaggerated. Estimates of the costs of
compliance typically come from survey data that regulatory agencies collect from the companies that will be
affected by a regulation. This practice introduces an incentive for companies to inflate their cost projections
in order to increase the estimated costs of a new rule. Companies typically claim confidentiality for their
cost information, which limits the ability of the public to verify the accuracy of the data.12 Moreover, if cost
information from these surveys is inadequate, agencies have to make educated estimates. In these situations,
agency staff tend to use high estimates of costs in order to avoid litigation by regulated companies asserting that
the cost information is inaccurate.13
In sum, benefit-cost analysis is an imperfect practice based on many assumptions and estimates that can alter
outcomes. Acknowledging that “some benefits and costs are difficult to quantify,” the executive orders governing 9 Environmental Protection Agency “Guidelines for Preparing Economic Analyses Ch 6 Discounting Future Benefits and Costs.” (December 2010). Available at http://yosemite.epa.gov/ee/epa/eerm.nsf/vwAN/EE-0568-06.pdf/$file/EE-0568-06.pdf. Also see OMB Circular A-4, op. cit. 10 Center for Progressive Reform “Saving Lives, Preserving the Environment, Growing the Economy: The Truth about Regulation.” (July 2011). Also see Ben Trachtenberg, “Health Inflation, Wealth Inflation, and the Discounting of Human Life” 89 Or. L. Rev. (2011) available at http://law.uoregon.edu/org/olrold/archives/89/Trachtenberg.pdf. 11 OMB Circular A-4 “Regulatory Impact Analysis: A Primer” noting “Discounting the welfare of future generations at 7 percent or even 3 percent could create serious ethical problems.”12 Public Citizen Foundation “Not Too Costly, After All: An Examination of the Inflated Cost Estimates of Health, Safety and Environmental Protections.” (February 2004). 13 Center for Progressive Reform “Saving Lives, Preserving the Environment, Growing the Economy: The Truth about Regulation.” (July 2011). Table 6, page 13 shows several studies that found overestimated costs for numerous regulations.See also Eban Goodstein & Hart Hodges, “Polluted Data: Overestimating Environmental Costs,” 8 Am. Prospect 64 (Nov./Dec. 1997) and Winston Harrington, Richard D. Morgenstern, & Peter Nelson, “On the Accuracy of Regulatory Cost Estimates” (Resources for the Future, Discussion Paper 99-18, 1999) available at http://www.rff.org/documents/RFF-DP-99-18.pdf.
Benefit-cost analysis is an imperfect practice based on many assumptions and estimates that can alter outcomes.
7
the development of regulations require that the benefits from the regulations “justify” the costs, but do not
require that the public benefits that can be monetized have to outweigh estimated costs to industry.14
Nonetheless, the monetary societal benefits from public protections almost always exceed compliance costs to
industry,15 and these monetary benefits are supplemented by substantial unquantifiable benefits in improvements
to health, welfare, and the environment. Even when public protections result in a small increase in costs to
consumers, both the monetary and societal benefits resulting from the rules far outweigh the minimal cost
increases.
THE SOCIAL AND ECONOMIC BENEFITS OF REGULATIONS
The ten regulations reviewed in this report have no significant impact on jobs and the economy, despite
conservative rhetoric about regulations “killing jobs.”16 None of the rules were projected to have a significant
negative impact on the economy; in fact, three of the rules are projected to create net new jobs. Overall, the
collective estimated impact of these rules on jobs is to slightly increase the overall number of jobs, as a result
of increased labor demand to comply with the rules. Three of the ten rules have the potential to affect small
businesses, but exemptions and provisions are included in the rules to alleviate these effects. Also, three of the
ten rules examined may slightly increase costs to consumers, but these increases are either negligible or very
small, especially compared to the size of the economy.
14 Executive Order 12866 (Oct. 4, 1993).See also Executive Order 13563, issued by President Barack Obama, “Improving Regulation and Regulatory Review.” Exec Order No. 13563. F.R 2011-1385. (Jan. 18, 2011). Available at http://www.gpo.gov/fdsys/pkg/FR-2011-01-21/pdf/2011-1385.pdf. 15 Center for Progressive Reform “Saving Lives, Preserving the Environment, Growing the Economy: The Truth about Regulation.” (July 2011).16 Eric Cantor, “Memo on Upcoming Jobs Agenda.” (Aug. 29, 2011). Available at http://majorityleader.gov/blog/2011/08/memo-on-upcoming-jobs-agenda.html.
The executive orders governing the development of regulations require that the benefits from the regulations “justify” the costs, but do not require that the public benefits that can be monetized have to outweigh estimated costs to industry.

8
Numerous studies negate the claim that regulations lead to significant job loss17 and stall the economy.18 No
evidence shows that regulations lead to significant overall losses in employment or that regulations cause
companies to move overseas. In fact, rules may increase employment and competitiveness by encouraging
industry to become more productive and innovative in response to the regulations.19 Pollution control
regulations result in jobs in areas such as construction and technology. For instance, the Manufacturers of
Emission Controls Association (MECA) estimated that in 2010, the economic activity that resulted from
emission control technology for new cars and trucks in the U.S. totaled $12 billion. Additionally, MECA member
companies provided 65,000 green jobs in the U.S.20 The Institute of Clean Air Companies (ICAC) forecasts
that the overall U.S. market for air pollution control and monitoring technology is around $5 billion a year (in
constant 2012 dollars) and is expected to increase to almost $6 billion by 2016.21 The EPA’s Mercury and Air
Toxics rule, which requires the installation of pollution control systems on power plants and large industrial
facilities, is projected to result in 46,000 short-term job years,22 as well as 8,000 long-term jobs.
A large body of literature exists demonstrating that regulations do not have a significant impact on the overall
economy and job availability. Although specific regulations may lead to job gains or losses in a particular
industry, the jobs effect of regulations overall is slightly positive or neutral.23 Key studies have shown that
environmental regulations in particular do not have a significant effect on employment. Berman and Bui
examined the impact that local air pollution regulations in Southern California had on local manufacturing
jobs, compared to other firms in the region over time and to firms outside the region. They found no significant
effect on employment.24 Morgenstern, et. al., further found that increased spending due to compliance with 17 See National Journal, “John Boehner’s Remarks at Economic Club of Washington.” (Sept. 15, 2011). Available at http://www.nationaljournal.com/congress/text-john-boehner-s-remarks-at-economic-club-of-washington-20110915 See also Eric Cantor, “Memo on Upcoming Jobs Agenda.” (Aug. 29, 2011). 18 Since 2007, the Bureau of Labor Statistics has asked firms that have had a mass layoff the reasons behind these layoffs. Only 0.2% to 0.4% of all mass layoffs were due to government regulation, as reported by the firms. Bureau of Labor Statistics (2012) “Extended Mass Layoffs in 2011.” United States Department of Labor, Report 1039. Also, randomized surveys of small business owners show that at most, 25% of small business owners are concerned about excessive government regulation. See also American Sustainable Business Council et al. (2012) “Small Business Owners’ Opinions on Regulations and Job Creation” (1 Feb). Hall, Kevin (2011) “Regulation, Taxes Aren’t Killing Small Business, Owners Say,” McClatchy Newspapers (Sept. 1). Dunkelberg, William C., and Holly Wade (2011) NFIB Small Business Economic Trends (August).19 Center for Progressive Reform “Saving Lives, Preserving the Environment, Growing the Economy: The Truth about Regulation.” (July 2011).20 Manufacturers of Emission Controls Association, “MECA Highlights Economic Benefits of Mobile Source Emission Control Industry.” (March 2011). http://www.meca.org/galleries/files/MECA_economic_benefits_press_release_031111.pdf. See also Institute of Clean Air Companies “Re: New Source Review Impact on Air Pollution Control (APC) Industry.” (February 2004). http://www.icac.com/?page=jobs&terms=%22re+and+new+and+source+and+review+and+impact+and+air+and+pollution+and+cont%22.21 Institute of Clean Air Companies. September 2013. Available at http://c.ymcdn.com/sites/www.icac.com/resource/resmgr/market_forecast/press_release_2013_market_fo.pdf. 22 A “job-year” is one job for one year. See http://www.whitehouse.gov/assets/documents/Job-Years_Revised5-8.pdf.23 Economic Policy Institute, “Regulation, Employment, and the Economy: Fears of job loss are overblown.” (April 12, 2011). Available at http://www.epi.org/publication/regulation_employment_and_the_economy_fears_of_job_loss_are_overblown/. 24 Berman and Bui. (2001) “Environmental Regulation and Labor Demand: Evidence from the South Coast Air Basin,” Journal of Public Economics 79: 265-95.
Overall, the collective estimated impact of these rules on jobs is to slightly increase the overall number of jobs, as a result of increased labor demand to comply with the rules.
9
environmental regulations was not correlated with changes in employment levels across four sectors of industry
from 1979 to 1991.25 Official data from the Bureau of Labor Statistics additionally illustrates this point with data
from their extended mass layoffs program. From 2007 to 2012, the bureau asked employers who have had mass
layoffs the reasons for those layoffs. During this time period, only 0.2 percent to 0.4 percent of all mass layoffs
were reported as due to government regulation.26 Given these pieces of evidence and numerous other studies, it
is clear that the overall effect of regulation on jobs is minimal.
REPORT METHODOLOGY
This report examined the regulatory impact analyses of ten rules that were proposed or finalized between
2009 and 2014. To provide a broad scope of federal agencies and public protections, rules issued by five federal
agencies covering a variety of public and worker health and safety issues were selected for review. Information
on the rule costs and benefits, as well as unquantifiable or non-monetized benefits and economic impacts, was
obtained from the proposed or final rules as published in the Federal Register or from the regulatory impact
analysis document prepared by the agency in conjunction with development of the rule. Annualized costs over
time using a seven percent discount rate and annualized benefits over time based on a three percent discount
rate are included in this report where both rates were provided, unless otherwise noted. Point estimates and
midpoint values were reported and used in calculations if they were given. Otherwise, ranges were used.
In calculating the total impact of the rules, all dollar amounts were converted to 2014 values using the GDP
deflator.27 The National Ambient Air Quality Standards for Particulate Matter rule was excluded from the cost
and benefit totals in order to avoid double-counting the costs and benefits associated with the reduction of
particulate matter from other rules examined.28
For proposed rules with multiple regulatory options or calculation methodologies, the lowest cost/benefit value
of all options was used as the low end of the cost and benefit ranges. Similarly, the highest cost/benefit value of
all options was used as the high end of the cost and benefit ranges. The net benefit of the option with the lowest
net benefit was used as the amount for the low end of the net benefit range, and the net benefit of the option with
the highest net benefit was used as the value for the high end of the net benefit range. Total low and high end
costs, economic benefits, and net benefits were calculated by summation of individual low and high end costs,
economic benefits, and net benefits for each of the nine rules in the combined analysis.
25 Morgenstern, et al. (2002) “Jobs Versus the Environment: An Industry-Level Perspective,” Journal of Environmental Economics and Management 43: 412-36. 26 Bureau of Labor Statistics, Mass Layoff Statistics. Available at http://www.bls.gov/mls/. See also Economic Policy Institute, “A Quick guide to the Evidence on Regulations and Jobs.” (Nov. 22, 2011). Available at http://www.epi.org/publication/quick-guide-evidence-regulations-jobs/.27 GDP deflator calculator. Available at http://stats.areppim.com/calc/calc_usdlrxdeflator.php. 28 This approach was used in OMB’s 2014 draft annual report to Congress. OMB, 2014 Draft Report to Congress on the Benefits and Costs of Federal Regulations and Unfunded Mandates on State, Local, and Tribal Entities. (May, 2014). Available at http://www.whitehouse.gov/sites/default/files/omb/inforeg/2014_cb/draft_2014_cost_benefit_report-updated.pdf.
10
FINDINGS
When fully implemented, these rules will result in over 10,000 fewer deaths and almost 300,000 avoided disease
cases, illnesses, or injuries each year.29 Based on the benefit-cost analyses prepared for these rules, the monetized
societal benefits are expected to be between $60 billion and $138 billion, while the total annual compliance costs
are estimated to be $14 billion to $16 billion, generating a net monetized benefit to society of between $46 billion
to $122 billion. As noted in Table 1, nine of the ten regulations projected greater monetized social benefits than
compliance costs. The one rule with a negative net benefit, EPA’s proposed Effluent Limitations Guidelines rule,
is projected to result in a multitude of significant ecological and health impacts critical to protecting public
health and conserving sensitive ecosystems, but agency analysts were unable to quantify and monetize these
benefits.
These rules will prevent a significant number of diseases, injuries, deaths, and lost worker productivity.
Additionally, substantial improvements in ecosystems, the climate, and the public’s health and welfare will also
result from these rules but cannot be adequately monetized. Table 2 summarizes the unquantifiable benefits
associated with five of the rules that provided this information. Overall, the total benefits substantially outweigh
their costs, and this net benefit would be even greater if all the benefits that are projected to accrue from these
rules were able to be monetized.
29 Includes data only from rules for which annual benefits were available.

11
Table 1. Annual Monetized Benefits, Costs, Net Benefits, and Economic Impacts of Ten Rules (2014$)
RuleEstimated Annual
Monetized Benefits*Estimated Annual
Compliance Costs**Estimated Annual
Net Benefits
Estimated Economic or Jobs
Impact
Occupational Exposure to Respirable Crystalline Silica– OSHA, proposed 9/12/2013
$5.65 billion $707.6 million $4.94 billion Increase of 8,625 job-years from 2014 - 2023
Federal Motor Vehicle Safety Standards, Ejection Mitigation – NHTSA, finalized 1/19/2011
$2.45 billion $545.2 million $1.91 billion No impact on small businesses, small organizations, small governmental jurisdictions, and small vehicle manufacturers
Federal Motor Vehicle Safety Standards; Electronic Stability Control Systems for Heavy Vehicles – NHTSA, proposed 5/23/2012
$363.3 million to $449.3 million
$120.7 million $242.3 million to $329.4 million
No impact on small businesses, small organizations, small governmental jurisdictions, and small vehicle manufacturers
Nutrition Labeling of Single-Ingredient Products and Ground or Chopped Meat and Poultry Products – FSIS, finalized 12/29/2010
$115.4 million $13.8 million $101.7 million No significant impact on a substantial number of small entities
National Ambient Air Quality Standards for Particulate Matter – EPA, finalized 1/14/2013
$4.25 billion to $9.67 billion
$56.3 million to $371.9 million
$3.93 billion to $9.56 billion
Mercury and Air Toxics Standards – EPA, finalized 2/16/2012
$40.9 billion to $99.44 billion
$10.6 billion $29.8 billion to $88.4 billion
Increase of 8,000 long-term jobs
Increase of 46,000 job-years in short term
Slight increase in utility rates
Potential significant impact on small entities

12
Control of Air Pollution from Motor Vehicles: Tier 3 Motor Vehicle Emission and Fuel Standards – EPA, finalized 4/28/2014
$7.71 billion to $19.8 billion
$1.6 billion(No discount)
$6.15 billion to $18.76 billion
Negligible increase in product and possible consumer costs
Negligible decrease in vehicle sales
Small jobs impact
Potential significant impact on small entities.
Hazardous and Solid Waste Management System; Identification and Listing of Special Wastes; Disposal of Coal Combustion Residuals From Electric Utilities – EPA, proposed 6/21/2010
$1.1 billion to $7.96 billion (7% discount)
$253.8 million to $1.59 billion
$821.6 million to $6.15 billion
Less than 1% increase in electricity prices
No significant impact on small businesses
Effluent Limitations Guidelines and Standards for the Steam Electric Power Generating Point Source Category – EPA, proposed 6/7/2013
$148.1 million to $512.7 million
$174.8 million to $971.9 million
-$459.2 million to -$26.7 million
Increase of 168 to 865 jobs
Minimal or negligible impacts on electricity market
Increase in consumer costs from 1 cent to $3.89
*Based on 3% discount rate**Based on 7% discount rate

13
Table 2. Unquantifiable (and Non-monetized) Benefits of Five Rules
Rule Benefits
National Ambient Air Quality Standards for Particulate Matter – EPA, finalized 1/14/2013
• Improved visibility• Improved ecosystem health• Reduction of negative effects on climate• Reduction of other adverse health effects
Mercury and Air Toxics Standards – EPA, finalized 2/16/2012
• Improved visibility• Improved ecological health • Reduction of other neurological effects of mercury• Reduction of non-neurological adverse health effects of mercury• Reduction of health effects due to ozone and direct exposure to sulfur
dioxide and nitrogen dioxide• Reduction of health effects from commercial and non-freshwater fish
consumption• Reduction of health risks from exposure to non-mercury hazardous air
pollutants
Control of Air Pollution from Motor Vehicles: Tier 3 Motor Vehicle Emission and Fuel Standards – EPA, finalized 4/28/2014
• Improved visibility• Improved ecological and vegetation health• Reduction in materials damage• Reduction of negative effects on climate
Hazardous and Solid Waste Management System; Identification and Listing of Special Wastes; Disposal of Coal Combustion Residuals From Electric Utilities – EPA, proposed 6/21/2010
• Prevention of non-cancer health effects• Prevention of ambient air pollution• Ecological protection• Surface water protection
Effluent Limitations Guidelines and Standards for the Steam Electric Power Generating Point Source Category – EPA, proposed 6/7/2013
Human health benefits• Reduced effects from exposure to lead from fish consumption• Reduced health effects from pollutants in recreational water
Ecological benefits• Reduced sediment contamination• Reduced bioaccumulation of metals• Reduction of other sub-lethal chronic effects of toxic metals on aquatic life• Reduced adverse effects on wildlife population diversity and community
dynamics• Reduction of potential for the formation of hazardous algal blooms• Enhanced recovery of endangered species vulnerable to change in water
quality
Market benefits• Reduced water treatment costs• Improved commercial fisheries yields• Increased tourism and water-based recreation• Increased property values from water quality improvement
14
Two of these rules, Mercury and Air Toxics Standards and Tier 3 Motor Vehicle Emission and Fuel Standards,
have the potential to affect small businesses. One rule, Prevention of Salmonella in Shell Eggs, will significantly
impact small business chicken farmers, but this is due to the fact that the majority of egg farms fall under
the legal definition of a small business, even though most are part of a large-scale poultry processing and
distribution system. Three rules may slightly increase consumer costs, but the increases are either minimal or
negligible. Effluent Limitations Guidelines have the potential to slightly increase jobs, while compliance with
Mercury and Air Toxics Standards has the potential to add almost 50,000 short-term job-years and 8,000 long-
term jobs. Data on job impacts were not available for every rule.
These results contribute to the body of evidence showing that the costs of regulations pale in comparison to
the magnitude of the societal benefits they provide, even given the limitations of current benefit-cost analysis
practices, which generally overestimate the costs of regulations and underestimates their benefits. This
observation is especially significant given that unquantified and non-monetized benefits also substantially
contribute to the societal benefits of a regulation.
CONCLUSION
The rules examined in this report represent only a few examples of the obvious benefits that society receives
from public standards and safeguards. Moreover, some regulations may actually result in a small net increase in
jobs. In our modern, globalized world, we should expect to see the decline or phase-out of some industries as
technological innovation and the human imagination create new growth areas. Workers in declining industries
need to be aided in the transition to new kinds of jobs, but society has a clear interest in encouraging cleaner
forms of energy and safer products. These priorities receive broad public support in survey after survey.30
Public rulemaking is the way we operationalize these priorities. The process of rulemaking allows us to gather
new scientific evidence and the input of affected industries, workers, and citizens to weigh the risks and
rewards of various paths forward. The information that goes into our assessments is imperfect, but the only
institution in society with the mission and capacity to protect the common good is government. The processes
of democratic deliberation and governance are our best hopes for ensuring that the public interest prevails.30 See http://environment.yale.edu/climate-communication/files/Climate-Policy-Support-April-2013.pdf and http://pos.org/documents/12368_national_key_findings_final.pdf as examples.
The costs of regulations pale in comparison to the magnitude of the societal benefits they provide, even given the limitations of current benefit-cost analysis practices, which generally overestimate the costs of regulations and underestimates their benefits.
15
APPENDIX A – SUMMARY OF RULES EXAMINED
Proposed Rule: Occupational Exposure to Respirable Crystalline Silica
Agency: Occupational Safety and Health Administration (OSHA)
Date Proposed: September 12, 2013
The current permissible exposure level for crystalline silica in occupational settings, adopted in 1971 based on
now-obsolete methods, ranges from 50 µg/m3 to 250 µg/m3 depending on the industry and the form of silica.
Exposure to silica at levels below these standards leads to a significant increased risk of lung cancer, silicosis,
kidney disease, autoimmune disease, chronic obstructive pulmonary disease, and other respiratory diseases.
This proposed rule will lower the current permissible exposure level to 50 µg/m3 for all types of crystalline
silica in order to reduce the significant health risks that workers currently face from exposure to silica. The
proposal provides for improved worker protections through the use of exposure controls, exposure assessments,
respiratory protection, medical surveillance, hazard communication, and record keeping.
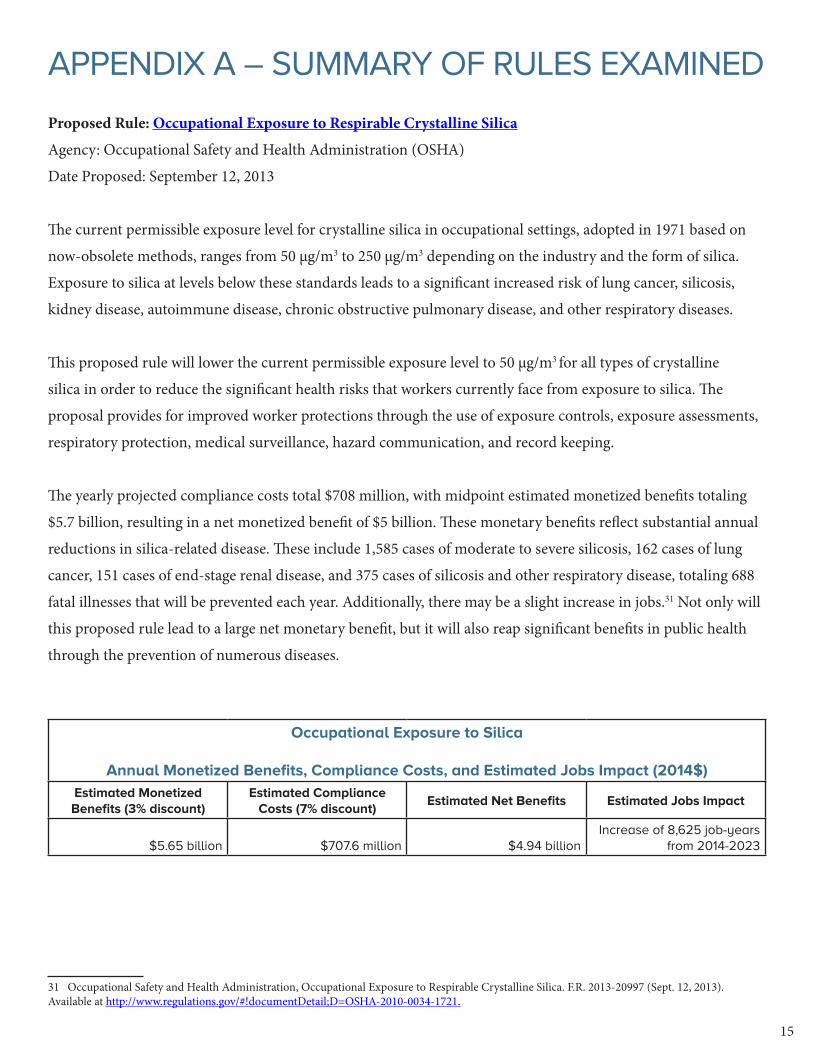
The yearly projected compliance costs total $708 million, with midpoint estimated monetized benefits totaling
$5.7 billion, resulting in a net monetized benefit of $5 billion. These monetary benefits reflect substantial annual
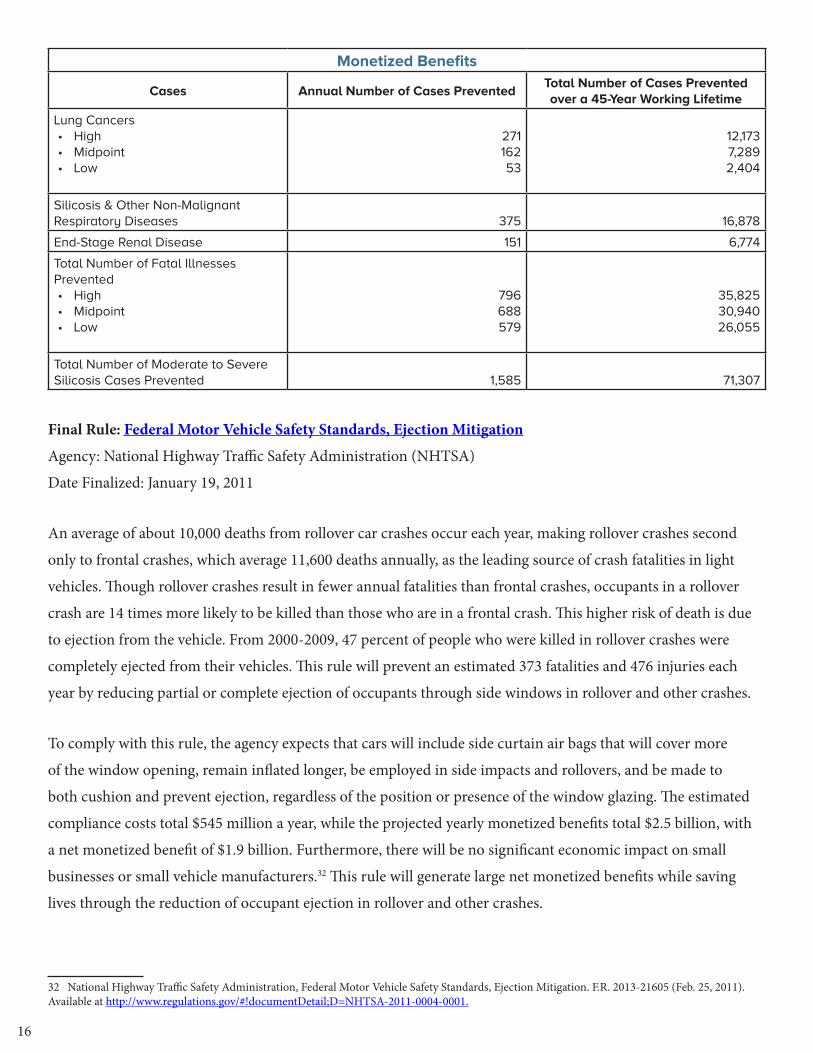
reductions in silica-related disease. These include 1,585 cases of moderate to severe silicosis, 162 cases of lung
cancer, 151 cases of end-stage renal disease, and 375 cases of silicosis and other respiratory disease, totaling 688
fatal illnesses that will be prevented each year. Additionally, there may be a slight increase in jobs.31 Not only will
this proposed rule lead to a large net monetary benefit, but it will also reap significant benefits in public health
through the prevention of numerous diseases.
Occupational Exposure to Silica
Annual Monetized Benefits, Compliance Costs, and Estimated Jobs Impact (2014$)Estimated Monetized Benefits (3% discount)
Estimated Compliance Costs (7% discount)
Estimated Net Benefits Estimated Jobs Impact
$5.65 billion $707.6 million $4.94 billionIncrease of 8,625 job-years
from 2014-2023
31 Occupational Safety and Health Administration, Occupational Exposure to Respirable Crystalline Silica. F.R. 2013-20997 (Sept. 12, 2013). Available at http://www.regulations.gov/#!documentDetail;D=OSHA-2010-0034-1721.
16
Monetized Benefits
Cases Annual Number of Cases PreventedTotal Number of Cases Prevented over a 45-Year Working Lifetime
Lung Cancers• High• Midpoint• Low
27116253
12,1737,2892,404
Silicosis & Other Non-Malignant Respiratory Diseases 375 16,878
End-Stage Renal Disease 151 6,774
Total Number of Fatal Illnesses Prevented• High• Midpoint• Low
796688579
35,82530,94026,055
Total Number of Moderate to Severe Silicosis Cases Prevented 1,585 71,307
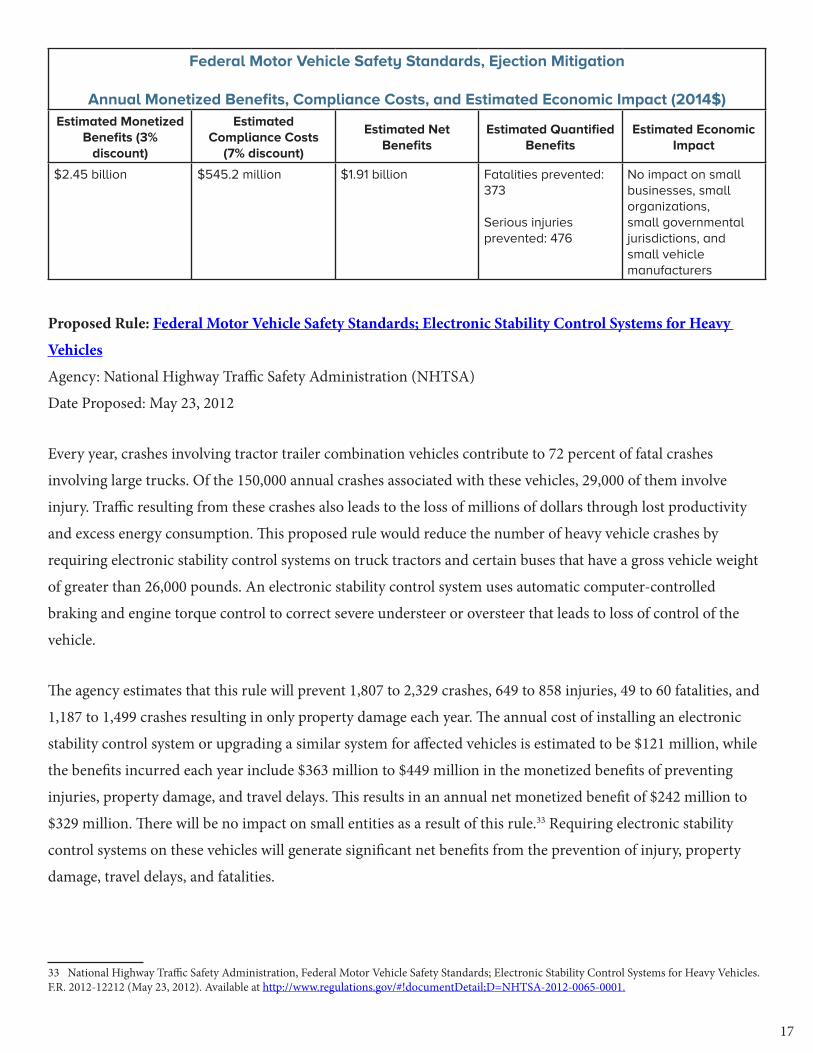
Final Rule: Federal Motor Vehicle Safety Standards, Ejection Mitigation
Agency: National Highway Traffic Safety Administration (NHTSA)
Date Finalized: January 19, 2011
An average of about 10,000 deaths from rollover car crashes occur each year, making rollover crashes second
only to frontal crashes, which average 11,600 deaths annually, as the leading source of crash fatalities in light
vehicles. Though rollover crashes result in fewer annual fatalities than frontal crashes, occupants in a rollover
crash are 14 times more likely to be killed than those who are in a frontal crash. This higher risk of death is due
to ejection from the vehicle. From 2000-2009, 47 percent of people who were killed in rollover crashes were
completely ejected from their vehicles. This rule will prevent an estimated 373 fatalities and 476 injuries each
year by reducing partial or complete ejection of occupants through side windows in rollover and other crashes.
To comply with this rule, the agency expects that cars will include side curtain air bags that will cover more
of the window opening, remain inflated longer, be employed in side impacts and rollovers, and be made to
both cushion and prevent ejection, regardless of the position or presence of the window glazing. The estimated
compliance costs total $545 million a year, while the projected yearly monetized benefits total $2.5 billion, with
a net monetized benefit of $1.9 billion. Furthermore, there will be no significant economic impact on small
businesses or small vehicle manufacturers.32 This rule will generate large net monetized benefits while saving
lives through the reduction of occupant ejection in rollover and other crashes.
32 National Highway Traffic Safety Administration, Federal Motor Vehicle Safety Standards, Ejection Mitigation. F.R. 2013-21605 (Feb. 25, 2011). Available at http://www.regulations.gov/#!documentDetail;D=NHTSA-2011-0004-0001.
17
Federal Motor Vehicle Safety Standards, Ejection Mitigation
Annual Monetized Benefits, Compliance Costs, and Estimated Economic Impact (2014$)Estimated Monetized
Benefits (3% discount)
Estimated Compliance Costs
(7% discount)
Estimated Net Benefits
Estimated Quantified Benefits
Estimated Economic Impact
$2.45 billion $545.2 million $1.91 billion Fatalities prevented: 373
Serious injuries prevented: 476
No impact on small businesses, small organizations, small governmental jurisdictions, and small vehicle manufacturers
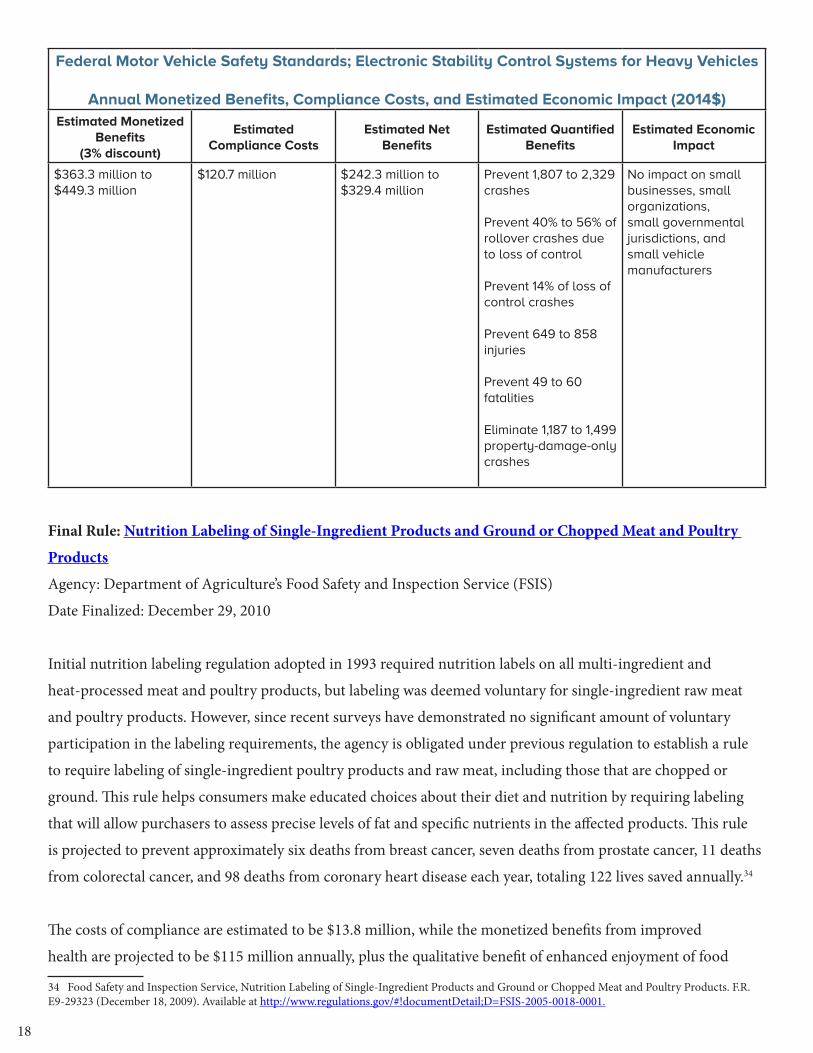
Proposed Rule: Federal Motor Vehicle Safety Standards; Electronic Stability Control Systems for Heavy
Vehicles
Agency: National Highway Traffic Safety Administration (NHTSA)
Date Proposed: May 23, 2012
Every year, crashes involving tractor trailer combination vehicles contribute to 72 percent of fatal crashes
involving large trucks. Of the 150,000 annual crashes associated with these vehicles, 29,000 of them involve
injury. Traffic resulting from these crashes also leads to the loss of millions of dollars through lost productivity
and excess energy consumption. This proposed rule would reduce the number of heavy vehicle crashes by
requiring electronic stability control systems on truck tractors and certain buses that have a gross vehicle weight
of greater than 26,000 pounds. An electronic stability control system uses automatic computer-controlled
braking and engine torque control to correct severe understeer or oversteer that leads to loss of control of the
vehicle.
The agency estimates that this rule will prevent 1,807 to 2,329 crashes, 649 to 858 injuries, 49 to 60 fatalities, and
1,187 to 1,499 crashes resulting in only property damage each year. The annual cost of installing an electronic
stability control system or upgrading a similar system for affected vehicles is estimated to be $121 million, while
the benefits incurred each year include $363 million to $449 million in the monetized benefits of preventing
injuries, property damage, and travel delays. This results in an annual net monetized benefit of $242 million to
$329 million. There will be no impact on small entities as a result of this rule.33 Requiring electronic stability
control systems on these vehicles will generate significant net benefits from the prevention of injury, property
damage, travel delays, and fatalities.
33 National Highway Traffic Safety Administration, Federal Motor Vehicle Safety Standards; Electronic Stability Control Systems for Heavy Vehicles. F.R. 2012-12212 (May 23, 2012). Available at http://www.regulations.gov/#!documentDetail;D=NHTSA-2012-0065-0001.
18
Federal Motor Vehicle Safety Standards; Electronic Stability Control Systems for Heavy Vehicles
Annual Monetized Benefits, Compliance Costs, and Estimated Economic Impact (2014$)Estimated Monetized
Benefits(3% discount)
Estimated Compliance Costs
Estimated Net Benefits
Estimated Quantified Benefits
Estimated Economic Impact
$363.3 million to $449.3 million
$120.7 million $242.3 million to $329.4 million
Prevent 1,807 to 2,329 crashes
Prevent 40% to 56% of rollover crashes due to loss of control
Prevent 14% of loss of control crashes
Prevent 649 to 858 injuries
Prevent 49 to 60 fatalities
Eliminate 1,187 to 1,499 property-damage-only crashes
No impact on small businesses, small organizations, small governmental jurisdictions, and small vehicle manufacturers
Final Rule: Nutrition Labeling of Single-Ingredient Products and Ground or Chopped Meat and Poultry
Products
Agency: Department of Agriculture’s Food Safety and Inspection Service (FSIS)
Date Finalized: December 29, 2010
Initial nutrition labeling regulation adopted in 1993 required nutrition labels on all multi-ingredient and
heat-processed meat and poultry products, but labeling was deemed voluntary for single-ingredient raw meat
and poultry products. However, since recent surveys have demonstrated no significant amount of voluntary
participation in the labeling requirements, the agency is obligated under previous regulation to establish a rule
to require labeling of single-ingredient poultry products and raw meat, including those that are chopped or
ground. This rule helps consumers make educated choices about their diet and nutrition by requiring labeling
that will allow purchasers to assess precise levels of fat and specific nutrients in the affected products. This rule
is projected to prevent approximately six deaths from breast cancer, seven deaths from prostate cancer, 11 deaths
from colorectal cancer, and 98 deaths from coronary heart disease each year, totaling 122 lives saved annually.34
The costs of compliance are estimated to be $13.8 million, while the monetized benefits from improved
health are projected to be $115 million annually, plus the qualitative benefit of enhanced enjoyment of food
34 Food Safety and Inspection Service, Nutrition Labeling of Single-Ingredient Products and Ground or Chopped Meat and Poultry Products. F.R. E9-29323 (December 18, 2009). Available at http://www.regulations.gov/#!documentDetail;D=FSIS-2005-0018-0001.

19
resulting from the use of the nutritional information. Small businesses that employ statements of percent fat
and percent lean on the label of their ground products are exempt from this rule if they do not make any other
nutrition claims or include other nutrition information on the product labels. This exemption ensures that
small businesses that produce a low amount of the product do not risk going out of business or reducing their
consumers’ options in order to comply with the rule. With the exemption, this rule will generate $102 million in
net monetized benefits without a significant impact on small businesses.35
Nutrition Labeling of Single-Ingredient Products and Ground or Chopped Meat and Poultry Products
Annual Monetized Benefits, Compliance Costs, and Estimated Economic Impact (2014$)Estimated Monetized
Benefits (3% discount)
Estimated Compliance Costs
(7% discount)
Estimated Net Benefits
Estimated Quantitative Benefits
Estimated Economic Impact
$115.4 million $13.8 million $101.7 million Prevention of:• 5.5 deaths from
breast cancer• 7.2 deaths from
prostate cancer• 10.8 deaths from
colorectal cancer• 97.8 deaths from
coronary heart disease
No significant impact on a substantial number of small entities
Final Rule: Prevention of Salmonella Enteritidis in Shell Eggs During Production, Storage, and
Transportation
Agency: Food and Drug Administration (FDA)
Date Finalized: July 9, 2009
Salmonella Enteritidis (SE) is one of the most common causes of foodborne illness in the United States.
Infection with Salmonella leads to diarrhea, fever, abdominal cramps, headache, nausea, and vomiting, and
may subsequently lead to hospitalization. In vulnerable populations, such as children, the elderly, and those
with a weak immune system, infection can cause death after spreading to the bone marrow or brain lining via
the bloodstream. In addition, two percent of those who recover from infection may develop reactive arthritis
or recurring joint pain later on as a result of infection. In 2004, there were 1,376,514 cases of salmonellosis,
resulting in 14,264 hospitalizations and 427 deaths. SE, the most common type of Salmonella contributing
to disease, led to 193,463 illnesses, 2,004 hospitalizations, and 60 deaths in 2001. Seventy-eight percent of
SE outbreaks where a contamination origin was identified were due to eggs. Since shell eggs are the primary
source through which humans contract SE, this rule will reduce the risk that eggs are contaminated with SE 35 Food Safety and Inspection Service, Nutrition Labeling of Single-Ingredient Products and Ground or Chopped Meat and Poultry Products. F.R. 2010-32485 (Dec. 29, 2010). Available at http://www.regulations.gov/#!documentDetail;D=FSIS-2005-0018-0036.
20
by establishing programs regarding biosecurity, pest control, environmental and egg testing, refrigeration and
storage practices, and the diversion of potentially infected eggs from the market. The rule additionally requires
producers to register with the FDA and maintain records regarding compliance.
Since some of the controls outlined in the rule, especially rodent and pest control measures, will take up to
four years to become fully effective, cost and benefit estimates were examined for two time frames: an initial
time frame assuming average effectiveness over the first four years, and an eventual time frame assuming full
effectiveness after four years. This rule will prevent 68,790 illnesses initially and 79,170 illnesses when fully
implemented. Compliance costs are estimated to be $103 million a year initially and $95 million when fully
implemented, while monetized benefits are projected to be $1.4 billion initially, eventually reaching $1.7 billion,
resulting in a net initial monetary benefit of $1.3 billion and an eventual monetary benefit of $1.6 billion.
Exempt from this rule are producers who have fewer than 3,000 layers (egg-producing chickens) and producers
who sell all their eggs directly to consumers. This exemption reduces costs by more than half while only reducing
benefits by less than one percent. Although over 90 percent of producers have fewer than 3,000 layers, less
than one percent of the eggs produced in the U.S. are produced on these small farms. Therefore, exempting
these small farms significantly reduces costs while maintaining both monetary and health benefits. Other small
entities, such as small chick and pullet farmers, trucking companies, and holding facilities, will be affected by
this rule. However, the exemption for farms with fewer than 3,000 layers saves cost for these entities as well, since
they will not be required to comply with the rule when dealing with eggs produced on these farms.36 This rule
contains costs while generating significant net monetary benefits and preventing tens of thousands of illnesses.
36 Food and Drug Administration, Prevention of Salmonella Enteritidis in Shell Eggs During Production, Storage, and Transportation. F.R. E9-16119 (July 9, 2009). Available at http://www.regulations.gov/#!documentDetail;D=FDA-2000-N-0190-0018.

21
Prevention of Salmonella Enteritidis in Shell Eggs During Production, Storage, and Transportation
Annual Monetized Benefits, Compliance Costs, and Estimated Economic Impact (2014$)
Time frame
Estimated Monetized
Benefits (3% discount)
Estimated Compliance
Costs (7% discount)
Estimated Net Benefits
Estimated Quantified
Benefits
Estimated Economic Impact
Initially $1.44 billion $102.9 million $1.34 billion 68,790 illnesses averted
Significant impact on more than 1,000 small farms and other entities such as small chick and pullet farms, trucking companies, and holding facilities
Eventually $1.66 billion $94.7 million $1.56 billion 79,170 illnesses averted
Final Rule: National Ambient Air Quality Standards for Particulate Matter
Agency: Environmental Protection Agency (EPA)
Date Finalized: January 14, 2013
This rule revises the previous primary health-based standard for particulate matter or PM2.5 (particles less
than or equal to 2.5 micrometers (µm) in diameter) from 15.0 µg/m3 to 12.0 µg/m3 in order to protect public
health and welfare from the adverse effects of outdoor air pollution. Long- and short-term exposure to high
levels of outdoor air pollution leads to numerous health effects, such as premature mortality, increased hospital
admissions and emergency room visits, and chronic respiratory diseases. This revised standard incorporates
new scientific evidence that includes extended analyses and supporting evidence that the adverse health effects
associated with PM2.5 exposure to air pollution occur at levels that are lower than the previous standard. The
revised standard additionally provides increased protection for at-risk populations, such as children, older
adults, and people with pre-existing heart and lung disease. When fully implemented, this revised standard will
prevent up to 1,000 deaths, 480 heart attacks, 250 hospital admissions for respiratory and heart disease, 230
asthma-related emergency room visits, and 40,000 asthma attacks in children each year, among other important
avoided health impacts.
The costs and benefits of this rule were estimated using two methodologies: the fixed-cost methodology,
which assumes that controls used in the future will have a similar cost to those used currently, and the
hybrid methodology, which assumes that future controls will be available at an increasing cost. The fixed-
cost methodology resulted in the lower estimate and the hybrid methodology resulted in the higher estimate.
With these methods, the compliance costs were estimated to range from $56 million to $372 million, while
the monetized benefits were estimated to be between $4.3 billion to $9.7 billion. These estimates result in net

22
monetary benefits of $3.9 billion to $9.6 billion, in addition to tens of thousands of health effects avoided.
Benefits that were not able to be quantified, such as improvements in visibility, ecosystem health, public health,
and climate change mitigation, further contribute to the benefits gained from this rule.
Given the body of scientific literature concluding that air quality regulation has a negligible overall effect on
jobs, this rule is not expected to have a significant impact on the overall economy. Furthermore, since this rule
is the revision of a national standard, the compliance control measures to be taken to meet this standard are
under the jurisdiction of state and local governments, giving them ultimate responsibility for assessing and
mitigating any negative economic impacts at the state or local levels, depending on the control measures they
choose to implement.37 This revision strengthens protections for public health in a way that reaps very significant
monetized benefits relative to compliance costs, even without the inclusion of substantial, meaningful benefits
that were unable to be quantified.
National Ambient Air Quality Standards for Particulate Matter
Annual Monetized Benefits, Compliance Costs, and Unquantified Benefits (2014$)
Methodology
Estimated Monetized
Benefits (3% discount)
Estimated Compliance
Costs (7% discount)
Estimated Net Benefits (3%
discount)
Estimated Quantified Benefits
Health Cases Avoided
Unquantified Benefits
Fixed-cost $4.25 billion $56.32 million $3.93 billion • Adult mortality: 460-1,000• Non-fatal heart attacks, age>18:
52-480• Hospital admissions –
respiratory, all ages: 110• Hospital admissions –
cardiovascular, age >18: 140• ER asthma visits, all ages: 230• Acute bronchitis, age 8-12: 870• Lower respiratory symptoms,
age 7-14: 11,000• Upper respiratory symptoms,
asthmatics age 9-11: 16,000• Asthma exacerbation, age 6-18:
40,000• Lost work days, age 18-65:
71,000• Minor restricted-activity days,
age 18-65: 420,000
Improvements in:• Visibility• Ecosystem
health• Public health• Climate
change mitigation
Hybrid $9.67 billion $371.9 million $9.56 billion
37 Environmental Protection Agency, National Ambient Air Quality Standards for Particulate Matter.F.R. 2012-30946 (Jan. 14, 2013) Available at http://www.regulations.gov/#!documentDetail;D=EPA-HQ-OAR-2007-0492-10110.

23
Final Rule: Mercury and Air Toxics Standards
Also known as: National Emission Standards for Hazardous Air Pollutants From Coal- and Oil-Fired Electric
Utility Steam Generating Units and Standards of Performance for Fossil-Fuel-Fired Electric Utility, Industrial-
Commercial-Institutional, and Small Industrial-Commercial-Institutional Steam Generating Units
Agency: Environmental Protection Agency
Date Finalized: February 16, 2012
This rule protects public health by establishing emissions standards for hazardous air pollutants that are
produced by coal- and oil-fired power plants. Exposure to hazardous pollutants, such as mercury (Hg), hydrogen
chloride, hydrogen fluoride, selenium, arsenic, nickel, and others, leads to numerous adverse health effects.
Depending on the degree of exposure, the health effects can include nausea, vomiting, central nervous system
damage, kidney damage, and lung, skin, and mucus membrane damage. Arsenic and hexavalent chromium
are classified as human carcinogens, or cancer-causing agents. Two other pollutants, cadmium and nickel, are
classified as probable human carcinogens. When fully implemented, this rule will prevent between 4,200 and
11,000 adult deaths, 20 infant deaths, 2,800 cases of chronic bronchitis, 4,700 heart attacks, more than 2,600
hospital admissions for lung and heart disease, 3,100 emergency room visits by children with asthma, and
130,000 asthma attacks in children each year, among other health impacts.
The electric power industry is the largest source of a number of hazardous air pollutants, particularly mercury.
Exposure to mercury in children has been linked to adverse neurodevelopment effects, including impairment of
brain function assessed using intelligence quotient (IQ) measurements. The controls that will be implemented to
comply with these mercury emission standards will also reduce the emissions of fine particles (PM2.5) and sulfur
dioxide, generating significant co-benefits. While the compliance costs of implementing this rule are estimated
to be $10.6 billion, the monetized benefits are expected to be between $41 billion to $99 billion, generating a net
monetary benefit of $30 billion to $88 billion. $40 billion to $98 billion of these benefits are due to the co-benefit
of PM2.5 reduction. Additional benefits that could not be monetized include those related to visibility, reduction
of other neurological effects of mercury, non-neurological health effects of mercury, effects of ozone and direct
exposure to sulfur dioxide and nitrogen dioxide, health effects from less consumption of mercury-tainted fish,
health risks from non-mercury air pollutants, and reduced damage to ecosystems.
This rule will have a number of potential impacts on jobs, electricity costs, and small businesses. In the short
term, due to the high demand for new pollution control equipment, 46,000 job-years are expected to be created.
In the long term, it is estimated that this rule will result in an increase of 8,000 jobs, the central estimate of a
range between an estimated loss of 15,000 jobs to an estimated gain of 30,000 jobs.

24
In 2016, natural gas prices are expected to increase by less than one percent and electricity rates are expected to
increase about three percent. This three percent is equal to the average change expected in electricity rates each
year. In the past 50 years, annual changes in electricity rates have fluctuated broadly by as much as 23 percent.
Electricity rates in 2015 and 2020 are projected to be lower than in 2010, even with implementation of this rule.
The increase in utility costs that could result from this rule is estimated to be small and near the historical yearly
average rate change.
Though this rule may raise utility costs, the flexibility in compliance options outlined in the rule allow for
implementation in a manner that will maximize benefits and contain costs for both small and large businesses.
The significant amount of monetary, health, and unquantified benefits this rule will produce and the potential it
holds for job creation more than justify the compliance costs.38
Mercury and Air Toxics Standards
Annual Monetized Benefits, Compliance Costs, and Estimated Economic Impact (2014$)Estimated Monetized Benefits
Estimated Compliance Costs
(7% discount)
Estimated Net Benefits
(3% discount)Unquantified Benefits
Estimated Economic Impact
$40.9 billion to $99.44 billion
$10.6 billion $29.8 billion to $88.4 billion
• Improved visibility• Improved ecological health• Reduction of other
neurological effects of Hg• Reduction of non-
neurological adverse health effects of Hg
• Reduction of health effects due to ozone and direct exposure to sulfur dioxide and nitrogen dioxide
• Reduction of health effects from commercial and non-freshwater fish consumption
• Reduction of health risks from exposure to non-mercury hazardous air pollutants
-15,000 to +30,000 long-term jobs Central estimate: +8,000 jobs
+46,000 job-years created in the short term
Average 3.1% increase in electricity rates in 2016Range: 1.3% to 6.3%
Less than 1% increase in natural gas prices in 2016
Potential significant impact on substantial number of small entities
Monetized Benefits Components (3% discount) (2014$)Partial Hg-related benefits $4.42 million to $6.63 million
PM2.5-related co-benefits $39.78 billion to $98.33 billion
Climate-related co-benefits $397.8 million
38 Environmental Protection Agency, National Emission Standards for Hazardous Air Pollutants From Coal- and Oil-Fired Electric Utility Steam Generating Units and Standards of Performance for Fossil-Fuel-Fired Electric Utility, Industrial-Commercial-Institutional, and Small Industrial-Commercial-Institutional Steam Generating Units. F.R. 2012-00806 (Feb. 16, 2012). Available at http://www.regulations.gov/#!documentDetail;D=EPA-HQ-OAR-2009-0234-20147.

25
Monetized Benefits
Estimated Reductions in Mercury and PM2.5-Related Health Effects in 2016Health Effect Cases Reduced
Point Estimate Range
Adult premature mortality• Pope et al., (2002) (age >30)• Laden et al., (2006) (age >25)
4,20011,000
1,200 to 7,2005,000 to 17,000
Infant premature mortality (<1 year) 20 -22 to 61
Chronic bronchitis 2,800 88 to 5,600
Non-fatal heart attacks (age >18) 4,700 1,200 to 8,300
Hospital admissions – respiratory (all ages) 830 330 to 1,300
Hospital admissions – cardiovascular (age >18) 1,800 1,200 to 2,200
Emergency room visits for asthma (age <18) 3,100 1,600 to 4,700
Acute bronchitis (age 8-12) 6,300 -1,400 to 14,000
Lower respiratory symptoms (age 7-14) 80,000 31,000 to 130,000
Upper respiratory symptoms (asthmatics age 9-11) 60,000 11,000 to 110,000
Asthma exacerbation (asthmatics 6-18) 130,000 4,500 to 450,000
Lost work days (ages 18-65) 540,000 460,000 to 620,000
Minor restricted-activity days (ages 18-65) 3.2 million 2.6 million to 3.8 million
IQ loss 511 point loss avoided
Final Rule: Control of Air Pollution from Motor Vehicles: Tier 3 Motor Vehicle Emission and Fuel Standards
Agency: Environmental Protection Agency
Date Finalized: April 28, 2014
More than 149 million Americans are currently exposed to unhealthy levels of air pollution. These pollutants are
linked to respiratory issues, cardiovascular problems, and other health effects and lead to increases in medication
use, hospital admissions, emergency room visits, and premature death. Since motor vehicles are a major source
of air pollution, particularly in urban areas, this rule treats the vehicle and its fuel as a system and establishes
guidelines regarding vehicle emissions and the sulfur content of gasoline. These stricter vehicle emission
standards reduce both tailpipe and evaporative emissions from various types of vehicles, leading to reductions in
nitrogen oxides, volatile organic compounds, particulate matter (PM), carbon monoxide, ozone, and air toxics
such as benzene. The new standard for the sulfur content of gasoline will be 10 parts per million (ppm), on
average, lowered from the previous 30 ppm.
When fully implemented, this rule will prevent 770 to 2,000 deaths, 81,000 lost work days, 210,000 lost school
days, and 1.1 million minor restricted activity days each year. Most of the monetized benefits are generated
by the health savings from the reduction of particulate matter, which contributes $6 billion to $14.6 billion of
the monetized benefits. Monetary benefits from ozone reduction comprise $1.2 billion to $5.2 billion of the

26
monetized benefits. The projected costs of compliance via changing technology, design, and production total
$1.6 billion, while the monetary benefits from improved health total $7.7 billion to $19.8 billion. Thus, the
net benefits of this rule are estimated to be $6.2 billion to $18.8 billion, which do not include the numerous,
significant benefits that were unable to be quantified, such as improvements in air visibility and reductions in
material, ecological, vegetation, and climate damage.
As a result of this rule, the costs of production in vehicle manufacturing and petroleum refining industries
will slightly increase, and this increase may be passed on to consumers. If consumer costs increase, sales may
decline. However, these changes in price and sales are small and negligible in both the short and long term.
Although the jobs impact was unable to be determined, it is expected to be small and insignificant since the
changes in costs and sales are negligible. Because this rule applies to all cars sold in the U.S. regardless of where
they are produced, it does not create an incentive for manufacturers to move their production overseas.39 While
the economic impacts of this rule will be negligible, the net monetary, quantified, and numerous unquantified
benefits generate significant economic gain and protections for public health.
Control of Air Pollution from Motor Vehicles: Tier 3 Motor Vehicle Emission and Fuel Standards
Annual Monetized Benefits, Compliance Costs, and Estimated Economic Impact (2014$)
Estimated Monetized Benefits
Estimated Compliance
Costs (No discount)
Estimated Net Benefits
Estimated Quantified Benefits
Cases prevented
Unquantified Benefits
Estimated Economic Impact
$7.71 billion to $19.8 billion
(PM benefits:$6.25 billion to $14.59 billion
Ozone benefits:$1.15 billion to $5.21 billion)
$1.6 billion $6.15 billion to $18.76 billion
• 660 – 1,500 PM-related premature deaths
• 110 – 500 ozone-related premature deaths
• 81,000 work days lost
• 210,000 school days lost
• 1.1 million minor restricted-activity days
Improved visibility
Reductions in damage of:• Materials• Ecosystems• Vegetation • Climate
Negligible increase in production costs, possible consumer costs, and decrease in vehicle sales
Negligible increase in cost of gas production and potential consumer costs
Jobs impact expected to be small since changes in cost and sales will be small
39 Environmental Protection Agency, Control of Air Pollution from Motor Vehicles: Tier 3 Motor Vehicle Emission and Fuel Standards, F.R. 2014-06954. (April 28, 2014). Available at http://www.regulations.gov/#!documentDetail;D=EPA-HQ-OAR-2011-0135-5096.
27
Proposed rule: Hazardous and Solid Waste Management System; Identification and Listing of Special
Wastes; Disposal of Coal Combustion Residuals From Electric Utilities
Agency: Environmental Protection Agency
Date proposed: June 21, 2010
This proposed rule seeks to protect public health and the environment by subjecting coal combustion residuals,
commonly called coal ash, generated by electric utility and independent power producers to first-time
regulations under the Resource Conservation and Recovery Act (RCRA). Coal ash is the byproduct of electricity
production using coal. Large amounts of residual materials are disposed of in surface impoundments, which are
areas of land designated for disposal. Coal ash contains a number of toxic materials, such as antimony, arsenic,
barium, beryllium, cadmium, chromium, lead, mercury, nickel, selenium, silver, and thallium. These toxins
can contaminate surface water after a release and may also leach into the ground and contaminate groundwater
during storage. In 2008, the failure of a surface impoundment retaining wall at an electric utility plant in
Kingston, Tennessee led to a catastrophic release of coal ash into the surrounding environment.40 The release of
these toxins endangers public health and damages properties and ecosystems.
Two alternative regulatory actions are proposed: listing combustion residual materials as a special waste to be
regulated under subtitle C of RCRA, or regulating them as non-hazardous solid waste under subtitle D of RCRA.
Under subtitle C, coal ash would be listed as a special waste and would be subject to regulations spanning from
generation to disposal. Units where combustion coal residuals are disposed of, treated, or stored would require
permits. Alternatively, under subtitle D, coal ash would be regulated as non-hazardous solid waste and would
only be subject to regulations regarding disposal. National criteria would be established to ensure safe disposal,
but only states or citizens, not the EPA, would be able to enforce these requirements. Both of these alternatives
include provisions regarding dam safety in order to improve the structural integrity of disposal areas and prevent
catastrophic releases.
Under subtitle C, the costs of improving the treatment and handling of coal ash would be $1.6 billion, while the
monetized benefits would be $6.8 billion to $8 billion, generating a net monetized benefit of $5.2 billion to $6.2
billion. Under subtitle D, the compliance costs would be $631 million and the monetized benefits would be $2.7
billion to $3.2 billion, creating $2 billion to $2.6 billion in net monetized benefits. One possible version of the
subtitle D proposal, called “D prime,” differs only in its allowance for existing impoundments to operate for their
useful life, instead of closing to install liners. Option D prime has estimated compliance costs of $254 million
and estimated monetized benefits from $1.1 billion to $1.4 billion, resulting in an annual net monetized benefit
of $822 million to $1.2 billion. Depending on the final option selected, the rule is estimated to prevent between
148 and 726 bladder and lung cancer cases over a 50-year period.
40 Shaila Dewan, New York Times, “At Plant in Coal Ash Spill, Toxic Deposits by the Ton.” (December 29, 2008). Available at http://www.nytimes.com/2008/12/30/us/30sludge.html?_r=1&em.
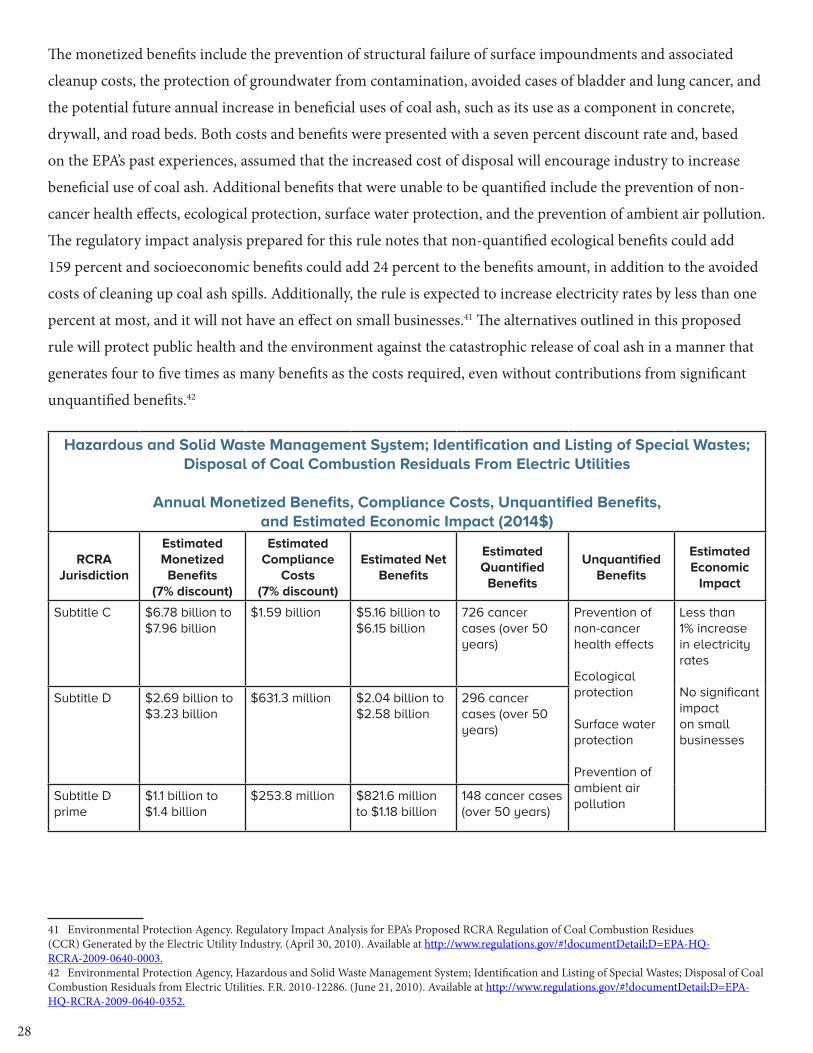
28
The monetized benefits include the prevention of structural failure of surface impoundments and associated
cleanup costs, the protection of groundwater from contamination, avoided cases of bladder and lung cancer, and
the potential future annual increase in beneficial uses of coal ash, such as its use as a component in concrete,
drywall, and road beds. Both costs and benefits were presented with a seven percent discount rate and, based
on the EPA’s past experiences, assumed that the increased cost of disposal will encourage industry to increase
beneficial use of coal ash. Additional benefits that were unable to be quantified include the prevention of non-
cancer health effects, ecological protection, surface water protection, and the prevention of ambient air pollution.
The regulatory impact analysis prepared for this rule notes that non-quantified ecological benefits could add
159 percent and socioeconomic benefits could add 24 percent to the benefits amount, in addition to the avoided
costs of cleaning up coal ash spills. Additionally, the rule is expected to increase electricity rates by less than one
percent at most, and it will not have an effect on small businesses.41 The alternatives outlined in this proposed
rule will protect public health and the environment against the catastrophic release of coal ash in a manner that
generates four to five times as many benefits as the costs required, even without contributions from significant
unquantified benefits.42
41 Environmental Protection Agency. Regulatory Impact Analysis for EPA’s Proposed RCRA Regulation of Coal Combustion Residues (CCR) Generated by the Electric Utility Industry. (April 30, 2010). Available at http://www.regulations.gov/#!documentDetail;D=EPA-HQ-RCRA-2009-0640-0003. 42 Environmental Protection Agency, Hazardous and Solid Waste Management System; Identification and Listing of Special Wastes; Disposal of Coal Combustion Residuals from Electric Utilities. F.R. 2010-12286. (June 21, 2010). Available at http://www.regulations.gov/#!documentDetail;D=EPA-HQ-RCRA-2009-0640-0352.
Hazardous and Solid Waste Management System; Identification and Listing of Special Wastes; Disposal of Coal Combustion Residuals From Electric Utilities
Annual Monetized Benefits, Compliance Costs, Unquantified Benefits, and Estimated Economic Impact (2014$)
RCRA Jurisdiction
Estimated Monetized Benefits
(7% discount)
Estimated Compliance
Costs(7% discount)
Estimated Net Benefits
Estimated Quantified
Benefits
Unquantified Benefits
Estimated Economic
Impact
Subtitle C $6.78 billion to $7.96 billion
$1.59 billion $5.16 billion to $6.15 billion
726 cancer cases (over 50 years)
Prevention of non-cancer health effects
Ecological protection
Surface water protection
Prevention of ambient air pollution
Less than 1% increase in electricity rates
No significant impact on small businesses
Subtitle D $2.69 billion to $3.23 billion
$631.3 million $2.04 billion to $2.58 billion
296 cancer cases (over 50 years)
Subtitle D prime
$1.1 billion to $1.4 billion
$253.8 million $821.6 million to $1.18 billion
148 cancer cases (over 50 years)
29
Proposed Rule: Effluent Limitations Guidelines and Standards for the Steam Electric Power Generating
Point Source Category
Agency: Environmental Protection Agency
Date Proposed: June 7, 2013
This proposed rule will reduce the amount of pollutants discharged into surface water by revising standards
for these types of plants and guidelines for effluent, which is waste that is discharged into surface water. The
electric power industry generates 50 percent to 60 percent of the toxic pollutants discharged into surface water
by industries regulated under the Clean Air Act. This amount is expected to increase since recent air pollution
controls capture pollutants and transfer them to wastewater discharge. These toxic pollutants, which include
mercury, arsenic, selenium, nitrogen, and total dissolved solids, pose risks to human health, aquatic life, wildlife,
and may contaminate sediment. A number of regulatory options were examined, with four preferred regulatory
alternatives presented in the proposed rule. These alternatives differ in the requirements for discharge associated
with two waste streams from existing sources.
Depending on the regulatory options, compliance costs are estimated to range from $175 million to $972
million, while monetized benefits may range from $148 million to $513 million, generating net monetary costs
of $27 million to $459 million. Although the monetary costs are greater than the monetized benefits, this rule
will produce substantial benefits that are unable to be quantified. The monetized benefits included most of the
benefits that were quantified and listed in the table below, plus reductions in IQ loss in children exposed to lead
via fish consumption, in utero mercury exposure via maternal fish consumption, mortality from air pollutants,
and avoided climate change impacts from carbon dioxide emissions. Reductions in non-cancer health effects due
to arsenic via fish consumption were quantified but not monetized.
Significant, substantial benefits regarding human health, ecological, and market benefits were not able to be
quantified, but they are projected to provide significant benefits. The overall benefits of this rule are further
underestimated because not all sources of exposure were examined. Reductions in exposure to toxins through
cleaner drinking water, as well as less consumption of contaminated vegetation and contaminated animals other
than fish, would further increase the health benefits of the rule. Additionally, the benefits resulting from the
establishment of best management practices were not included in the benefits analysis, but they were included in
the cost estimate.
The preferred alternatives outlined in this proposed rule will result in significant improvements for the
environment, ecosystem, wildlife, and public health in an economically achievable manner. Electric utility
companies are unlikely to face economic impacts since compliance costs are estimated to be one percent or less
of their revenue. A very small number of companies are projected to incur the highest costs, up to three percent
30
of revenue. Given the low compliance costs, minimal or negligible impacts are expected for the electricity market
and no significant effects are expected for small businesses. Consumer costs may increase from one cent to
$3.89 per household, depending on the degree of cost passed on to the consumer and the region of the U.S. Jobs
are estimated to increase by 168 to 865, depending on the regulatory option, although these figures are likely
overestimated.43
This proposal and other standards will make large strides in the conservation of the environment, ecosystem,
and human and animal health while having little effect on the economy, and will possibly generate a small
number of jobs. Despite the monetary costs outweighing the monetary benefits, the rule is justified because of
the substantial unquantifiable benefits it will produce, which are the crux of the regulation’s purpose.
43 Environmental Protection Agency, Effluent Limitations Guidelines and Standards for the Steam Electric Power Generating Point Source Category. F.R. 2013-10191. (June 7, 2013). Available at http://www.regulations.gov/#!documentDetail;D=EPA-HQ-OW-2009-0819-0068.
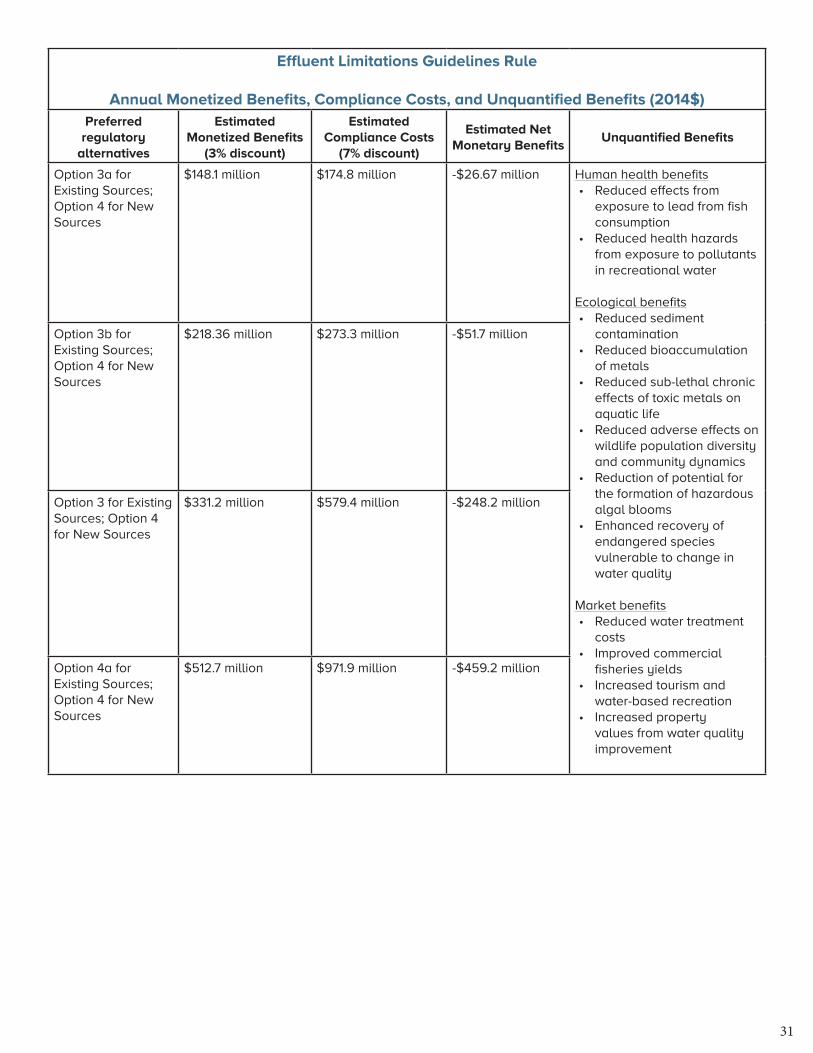
31
Effluent Limitations Guidelines Rule
Annual Monetized Benefits, Compliance Costs, and Unquantified Benefits (2014$)Preferred
regulatory alternatives
Estimated Monetized Benefits
(3% discount)
Estimated Compliance Costs
(7% discount)
Estimated Net Monetary Benefits
Unquantified Benefits
Option 3a for Existing Sources; Option 4 for New Sources
$148.1 million $174.8 million -$26.67 million Human health benefits• Reduced effects from
exposure to lead from fish consumption
• Reduced health hazards from exposure to pollutants in recreational water
Ecological benefits• Reduced sediment
contamination• Reduced bioaccumulation
of metals• Reduced sub-lethal chronic
effects of toxic metals on aquatic life
• Reduced adverse effects on wildlife population diversity and community dynamics
• Reduction of potential for the formation of hazardous algal blooms
• Enhanced recovery of endangered species vulnerable to change in water quality
Market benefits• Reduced water treatment
costs• Improved commercial
fisheries yields• Increased tourism and
water-based recreation• Increased property
values from water quality improvement
Option 3b for Existing Sources; Option 4 for New Sources
$218.36 million $273.3 million -$51.7 million
Option 3 for Existing Sources; Option 4 for New Sources
$331.2 million $579.4 million -$248.2 million
Option 4a for Existing Sources; Option 4 for New Sources
$512.7 million $971.9 million -$459.2 million
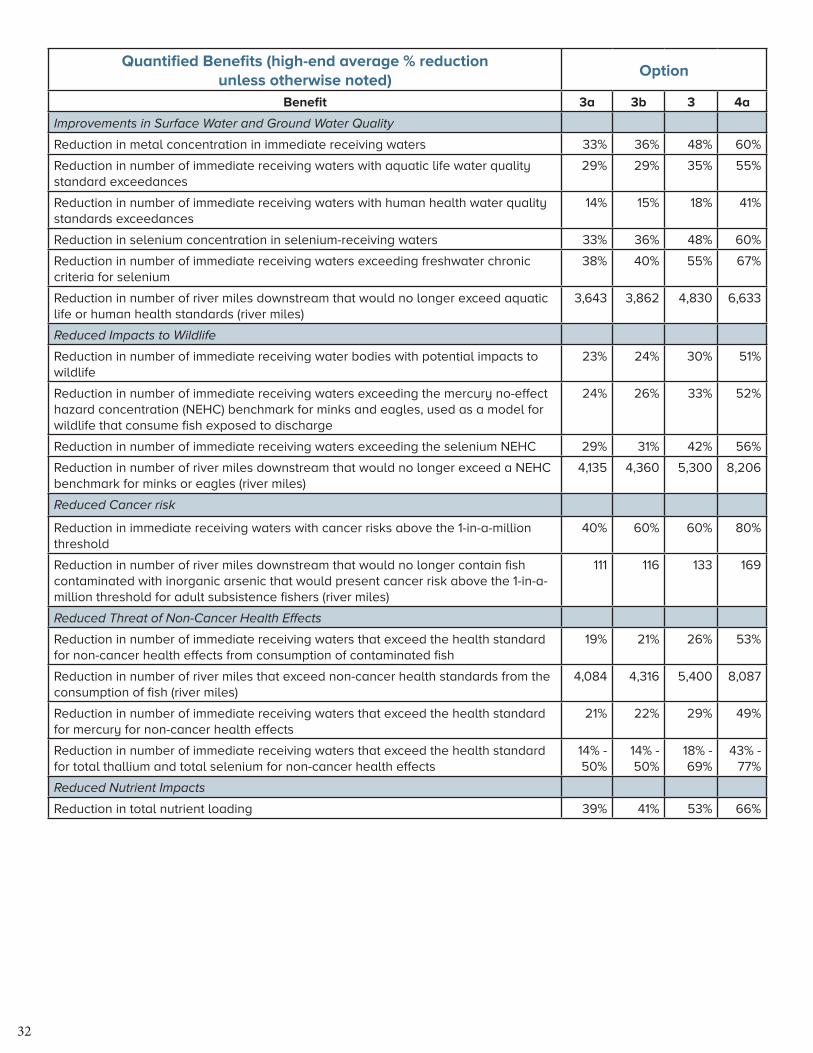
32
Quantified Benefits (high-end average % reduction unless otherwise noted)
Option
Benefit 3a 3b 3 4a
Improvements in Surface Water and Ground Water Quality
Reduction in metal concentration in immediate receiving waters 33% 36% 48% 60%
Reduction in number of immediate receiving waters with aquatic life water quality standard exceedances
29% 29% 35% 55%
Reduction in number of immediate receiving waters with human health water quality standards exceedances
14% 15% 18% 41%
Reduction in selenium concentration in selenium-receiving waters 33% 36% 48% 60%
Reduction in number of immediate receiving waters exceeding freshwater chronic criteria for selenium
38% 40% 55% 67%
Reduction in number of river miles downstream that would no longer exceed aquatic life or human health standards (river miles)
3,643 3,862 4,830 6,633
Reduced Impacts to Wildlife
Reduction in number of immediate receiving water bodies with potential impacts to wildlife
23% 24% 30% 51%
Reduction in number of immediate receiving waters exceeding the mercury no-effect hazard concentration (NEHC) benchmark for minks and eagles, used as a model for wildlife that consume fish exposed to discharge
24% 26% 33% 52%
Reduction in number of immediate receiving waters exceeding the selenium NEHC 29% 31% 42% 56%
Reduction in number of river miles downstream that would no longer exceed a NEHC benchmark for minks or eagles (river miles)
4,135 4,360 5,300 8,206
Reduced Cancer risk
Reduction in immediate receiving waters with cancer risks above the 1-in-a-million threshold
40% 60% 60% 80%
Reduction in number of river miles downstream that would no longer contain fish contaminated with inorganic arsenic that would present cancer risk above the 1-in-a-million threshold for adult subsistence fishers (river miles)
111 116 133 169
Reduced Threat of Non-Cancer Health Effects
Reduction in number of immediate receiving waters that exceed the health standard for non-cancer health effects from consumption of contaminated fish
19% 21% 26% 53%
Reduction in number of river miles that exceed non-cancer health standards from the consumption of fish (river miles)
4,084 4,316 5,400 8,087
Reduction in number of immediate receiving waters that exceed the health standard for mercury for non-cancer health effects
21% 22% 29% 49%
Reduction in number of immediate receiving waters that exceed the health standard for total thallium and total selenium for non-cancer health effects
14% - 50%
14% - 50%
18% - 69%
43% - 77%
Reduced Nutrient Impacts
Reduction in total nutrient loading 39% 41% 53% 66%

33
Estimated Economic ImpactsOption Jobs Increased Other Economic Impacts
Option 3a 168 • No significant effects on small businesses• Minimal or negligible impacts on electricity market• Affected entities unlikely to face economic impacts due to compliance
costs of 1% or less of revenue• Increased consumer costs of less than 1 cent to $3.89 depending on
degree of cost passed to consumer
Option 3b 255
Option 3 519
Option 4a 865


2040 S STREET NW, 2ND FLOOR
WASHINGTON, DC 20009
202-234-8494202-234-8584
[email protected]@foreffectivegovfacebook.com/foreffectivegov
phonefax
web www.foreffectivegov.org