The benefits of integrating European electricity · PDF fileThe benefits of integrating...
23
The benefits of integrating European electricity markets EPRG Working Paper 1504 Cambridge Working Paper in Economics David Newbery, Goran Strbac and Ivan Viehoff Abstract The European Commission’s Target Electricity Model aims to integrate EU electricity markets. This paper estimates the potential benefit to the EU of coupling interconnectors to increase the efficiency of trading day-ahead, intra-day and sharing balancing services efficiently across borders. Further gains are possible by eliminating unscheduled flows and avoiding the curtailment of renewables with better market design. In the short run the gains could be as high as €3.3 billion/yr, more than 100% of the current gains from trade. About one-third of this total comes from day-ahead coupling and another third from shared balancing. Keywords electricity market coupling, interconnectors, balancing, benefits JEL Classification D61, F15, L51, L94 Contact dmgn @ cam.ac.uk Publication February 2015 Financial Support This paper builds on and extends work under contract ENER/B1/491-1/2012 www.eprg.group.cam.ac.uk
Transcript of The benefits of integrating European electricity · PDF fileThe benefits of integrating...
The benefits of integrating European electricity markets EPRG Working Paper 1504
Cambridge Working Paper in Economics
David Newbery, Goran Strbac and Ivan Viehoff Abstract The European Commission’s Target Electricity Model aims to integrate EU electricity markets. This paper estimates the potential benefit to the EU of coupling interconnectors to increase the efficiency of trading day-ahead, intra-day and sharing balancing services efficiently across borders. Further gains are possible by eliminating unscheduled flows and avoiding the curtailment of renewables with better market design. In the short run the gains could be as high as €3.3 billion/yr, more than 100% of the current gains from trade. About one-third of this total comes from day-ahead coupling and another third from shared balancing. Keywords electricity market coupling, interconnectors, balancing, benefits JEL Classification D61, F15, L51, L94
Contact dmgn @ cam.ac.uk Publication February 2015 Financial Support This paper builds on and extends work under contract
ENER/B1/491-1/2012 www.eprg.group.cam.ac.uk

1
The benefits of integrating European electricity markets1
David Newbery,2 Goran Strbac
3 and Ivan Viehoff
4
9 January 2015
Abstract
The European Commission’s Target Electricity Model aims to integrate EU electricity
markets. This paper estimates the potential benefit to the EU of coupling interconnectors
to increase the efficiency of trading day-ahead, intra-day and sharing balancing services
efficiently across borders. Further gains are possible by eliminating unscheduled flows
and avoiding the curtailment of renewables with better market design. In the short run
the gains could be as high as €3.3 billion/yr, more than 100% of the current gains from
trade. About one-third of this total comes from day-ahead coupling and another third
from shared balancing.
Keywords: electricity market coupling, interconnectors, balancing, benefits
Classification codes: D61, F15, L51, L94
1 This paper builds on and extends work under contract ENER/B1/491-1/2012, published as
Newbery et al (2013). We would like to thank Martin Godfried for providing some of the data
supporting ACER (2014a), commenting on an earlier draft and correcting some of the units in
which the original published ACER tables were presented, but he should not be held responsible
for any remaining errors in this paper. 2 EPRG, University of Cambridge and Control and Power Research Group, Imperial College
London, email [email protected] 3 Control and Power Research Group, Imperial College London, email [email protected] .
4 CEPA, London

2
1. Introduction
The European Commission’s Target Electricity Model (TEM) aims to integrate EU
electricity markets by coupling interconnectors so that all electricity is (moderately)
efficiently allocated across the EU by a single auction platform, Euphemia. By mid-2014
the day-ahead coupling objective had been achieved from Finland to Portugal, including
Great Britain. Coupling means that wholesale electricity prices should be equalized
across boundaries unless the interconnector is constrained, in which case prices can
diverge but the interconnector should be fully utilised. Before market coupling, capacity
on interconnectors was sold before the day-ahead markets opened, and traders had to
predict the price differences across interconnectors and bid for that capacity. Traders
faced the risk that on the day the trade would no longer be profitable, in which case the
option to flow power would be abandoned and the interconnector would be under-used,
or, worse, the power would flow from the high price to the low price zone.
Member States and the European Commission are understandably interested to
know the size of the benefits of market coupling, as market design changes are costly,
and for each country could amounts to tens of millions of euros. As a perhaps extreme
example, when Britain replaced the Electricity Pool by the New Electricity Trading
Arrangements (NETA) in 2001, the UK’s National Audit Office cited Ofgem’s estimate
“that market participants could incur total costs of up to £580 million in implementing
NETA over the first 5 years, and then operating costs of £30 million a year.” (NAO,
2003).
In December 2012 the authors started work on a project commissioned by the
European Commission’s Directorate General for Energy to estimate the benefits of an
integrated European energy market (gas and electricity). They delivered a near final draft
in March 2013 (Newbery et al, 2013, hereafter our report), after which ACER started
publishing estimates of the costs of not completing the integrated market in its
subsequent reports (ACER, 2013, 2014). ACER had the advantage of direct access to
some of the detailed Vulcanus data needed to make more accurate estimates (although
they are still hampered by that lack of powers to request relevant data), while the pressure
of time and the scarcity of data meant that our original report had of necessity to take
short cuts. By mid-2015 the Transparency Regulation No 543/2013 (EC, 2013) should
make more data public and available for more detailed academic and regulatory study.
This paper makes use of the additional data supplied by ACER (2014) to update
estimates of the benefits of integration, using the original methodology of Newbery et al.
(2013). That allows a comparison between the approximate methods of that report with
calculations based on more accurate and extensive data. It also recalculates the way in
which the gains from coupling should be extrapolated to EU-wide net benefits, and
discusses what can be learned from the fuller information that ACER has been able to

3
analyze. It adds to the ACER estimates by attempting to extrapolate ACER’s partial
coverage to the EU-28, and although these are necessarily somewhat speculative, they
identify more clearly the sources of some of the major integration gains, although they do
not include possible additional gains from increased competition.
1.1 Previous literature
Newbery et al (2013) surveyed the existing and rather sparse literature on the quantitative
benefits of market integration up to early 2013, and only the briefest summary is given
here, as a fuller account is available in that report. Neuhoff et al (2011) explored the
benefits of the most efficient form of market integration via nodal pricing (as in PJM5)
but including a large volume (125GW) of predicted future wind connection. They found
savings of 1.1-3.6% of variable operating costs. If variable (mainly fuel) costs are
roughly half total wholesale market value then the gains from full integration would be
0.6-1.8% of that value. Leuthold et al (2005) simulated the benefits of adding 8GW of
offshore wind to Germany and moving to nodal pricing, estimating that gains of 0.6-1.3%
came just from a move to nodal pricing and an additional 1% would come from nodally
pricing the additional wind. Mansur and White (2009) compared before and after PJM
expanded its nodally priced market area and found incremental gains of $3.6 million/GW
capacity, which if applied to the EU with 820 GW capacity would deliver $3 billion per
year (roughly €(2013) 2.3 billion) or 1.6% of wholesale value. Ott (2010) found that the
total benefits of efficiently pricing PJM were $2.2 billion per year. However, these
estimates are the benefits of moving to nodal pricing, whereas the TEM stops short at
zonal pricing and so would not realize the full potential gains.
When it comes to the benefits of market coupling the literature was even sparser.
De Jong, Hakvoort and Sharma (2007) simulated a simplified model of France, Germany,
The Netherlands and Belgium to estimate the welfare effects that flow-based market
coupling (FBMC) would have on those countries, which they found to be about €200m
per year. Meeus (2011) studied the history of the 600 MW Kontek HVDC cable from
East Denmark to Germany, first from the period of no coupling, through two
implementations of approximate coupling, ending with one-way market coupling, still
imperfect as it resulted in flows against the price differential (FAPD) of about 5%. The
estimated welfare gain was about €10m per year on that one cable or about
€17,000/MWyr.
SEM Committee (2011) estimated the social costs of not using the two
interconnectors between GB and the Single Electricity Market (SEM) of the island of
Ireland (which had a combined capacity of 950/910MW imports, 580MW exports) for
2010. The estimates included price responses and a dead band (with no trade) of €5/MWh
5 Originally the Pennsylvania-New Jersey-Maryland interconnection, since expanded
considerably.

4
to allow for various losses and transmission access charges. The social welfare gains
from coupling were estimated at €30 million per year for an average import capacity of
930 MW,6 or €32,000/MWyr, more than twice that of the Kontek cable.
In summary, simulation studies of FBMC find modest efficiency benefits that
may underestimate the potential for two reasons. The models lack sufficient richness to
identify all of the transmission difficulties that FBMC may relieve, and they are
calibrated to earlier generation portfolios with less renewable generation, and which
therefore probably congest transmission systems less than now. They indicate substantial
value to increasing transmission capacity, and that FBMC will then be of even greater
value in efficiently managing that capacity. A before-and-after study of the Kontek cable
finds modest welfare benefit of (imperfectly implemented) FBMC on that cable but
coupling the SEM-GB interconnectors would seem to deliver larger gains.
Since our report several new studies have been published, as well as the ACER
annual reports discussed below. Böckers et al (2013) measure the extent to which market
integration can share peak demand more efficiently, and find that about half of
neighbouring countries peak demands are non-coincident and so the capacity needed to
supply them jointly could be reduced. They report studies of price convergence that
shows in some pair-wise comparisons that considerable convergence preceded coupling.
They also report earlier studies that simulate the gains from improved competition and
hence lower deadweight losses that our report did not explore. They roughly estimated
gains from harmonizing PV support schemes and found large benefits (more than €700
million per year just be reallocating support from Germany to Spain). Our report looked
forward to 2030 and found very large gains from harmonizing all renewables support, but
these potential gains are not discussed in this paper.
Pellini’s (2014) doctoral dissertation used a power simulation model of Italy with
an econometric estimates of price formation in neighbouring markets (FR, CH, AT, SL
and GR) to examine the benefits of coupling the Italian market for 2012. She found that
in the reference scenario for 2012 and allowing for continued market power, market
coupling increased net welfare (the arithmetic sum of changes in producer, consumer and
transmission surpluses) by €33 million/year (M€/yr), but if coupling credibly increased
competition on the northern border, the net welfare gain rose to 396 M€/yr, although this
is still 278 M€/yr below that theoretically achievable under perfect competition. In the
high scenario in which the economy recovered relative to 2010 and oil prices were
higher, the welfare gain from coupling increased to 132 M€/yr without more competition,
and to 742 M€/yr with more competition, although still 326 M€/yr short of perfect
competition. These simulation results show that the gains from integration can be highly
sensitive to relative fuel prices (which clearly can affect the gains from trade), the level of
6 The export capacity is lower but exports are much less common.

5
demand in the importing country (Italy) particularly in the presence of market power and
hence rapidly rising prices as demand tightens, and of course the impact that coupling has
on market power.
1.2 Gains from integrating balancing markets
The aim of the TEM is to integrate markets at all timescales, from contracting ahead, to
day-ahead, intraday and balancing. DG ENER commissioned a report (Mott MacDonald,
2013) in support of ACER’s Impact Assessment for the development of Electricity
Balancing Framework Guidelines, which estimated the potential gains from integrating
the European Balancing markets. The report found annual benefits from balancing energy
trade between GB and France are potentially of the order of € 51 million. The estimated
annual savings of integrating the Nordic countries are approximately € 221 million
compared to individual “stand alone” balancing. Looking ahead to 2030 under
“hypothetical” scenarios of the future European Power System the estimated benefits
increase with wind penetration factor of wind generation and which justify the cost of
investment for enhanced interconnectivity, integrating Balancing Markets and
exchanging and sharing of reserves could achieve operational cost savings of about €
3bn/year and reduced (up to 40% less) requirements for reserve capacity.
2. The estimated gains from integration
Estimating the benefits of integration is not straightforward, as it inevitably involves
either comparing the status quo ex ante with a counterfactual, or comparing the situations
before and after, in which many other factors may have changed, including the whole
pattern of generation and cross-border flows and with that the pattern of price differences
across interconnectors. In addition, as well as directly observable impacts, primarily
increased flows and price changes as interconnectors are more efficiently used, there are
harder to identify indirect benefits that may flow from increased cross-border
competition, such as pressures to reduce cost, innovate, improve market functioning
through increased liquidity, and improved sustainability if the volume of low-carbon
electricity that can be delivered to final consumers increases and displaces more polluting
sources. Security of supply should improve, although the full benefits of reducing EU-
wide reserve capacity needed requires those responsible for assuring security to make
changes in the way they assess system security and adjust domestic capacity.7
7 Thus in the preparations for the UK 2014 capacity auction designed to deliver the specified
security standard of a Loss of Load Expectation of 3 hours per year, the minister responsible, on
the advice of the Transmission System Operator, set a standard that ignored any net contribution
that the interconnectors might supply – see DECC (2014), National Grid (2014) and Newbery and
Grubb (2014).

6
In the longer run, the economics of building interconnectors should improve,
encouraging further investment and allowing a more efficient location of generation
across the EU to exploit the gains from improved trade. Finally, and of direct concern to
Member States, as prices are expected to change, there will be winners and losers,
although the US experience supports the view that a suitable allocation of Financial
Trading Rights can in principle and to a large extent in practice, adequately compensate
potential losers (Newbery and Strbac, 2011).
The methodology for estimating the gains from coupling interconnectors at the
day-ahead stage (which were largely complete by the end of 2014) is explained in Figure
1.
Figure 1 Benefits of market coupling: a) assuming no adverse flows and b) with flow
originally against price differential
Figure 1a shows one possible configuration of the interconnector before and after
coupling. Volume A is the amount used before coupling with the net supply in the
direction of trade, EG, and the net demand, DH, shown. Market coupling then leads to the
full utilization of the interconnector to volume B, narrowing the price difference as
shown. The benefit of coupling is then the darker green coloured trapezium, on the
(competitive market) assumption that the net supply represents the marginal cost
(including any scarcity rents) and the net demand represents the willingness to pay for
power. In algebraic terms the benefit is the average of the price differences before and
after coupling times the increase in the volume of trade or the area of the trapezium
DEGH. If coupling eliminated the price difference, as it does in Figure 1b, the benefit of
coupling is only one half the rectangle assuming no price change.
Figure 1b shows the case in which the interconnector is flowing power in the
wrong direction. In this case point A corresponds to, say, importing a volume 0A when
the efficient coupled solution would be exporting an amount 0C (the capacity of the

7
interconnector is 0B in each direction, although there is no reason why export and import
capacity should be the same). In this case the benefit is half the initial price difference ED
times the volume AC, or the area DEH, which is half the area DEGF that assumes prices
do not change.
ACER makes the simplifying assumption that the prices do not change, which is
probably valid for most Continental interconnectors embedded within the meshed AC
network, but not for DC links such as IFA, where ignoring price changes would tend to
over-estimate the gains by measuring the area DEFK if the estimate is made before
coupling, but underestimate the gains if the post-coupled price difference is used.
Newbery et al (2013) estimated that in the case of the England-France interconnector,
IFA, a change of trade of 1 GW into GB would change prices by €1/MWh. In figure 1 it
is necessary to correct the measured loss DEFK by subtracting the areas DKH and EFG,
where the sum of KH and GF is given by the slope €1/MWh/GW and the change AB.
This is half times the change in volume times the change in price, or equivalently ½ x 1 x
AB2.
In 2011 exports from FR→UK used 58% of total capacity and from UK→FR a
further 12%, making the overall utilization of IFA 71%. In 2012 exports from FR→UK
used 74% of total capacity and from UK→FR a further 10%, making the overall
utilization of IFA 83%. The average NTC in both 2011 and 2012 was roughly 1.25 GW
in each direction (i.e. only 63% of its rated capacity), so an underutilisation of 29% in
2011 would be on average is 0.36 GW and the price change might be €0.36/MWh on
average over the underutilization, half of which is €0.18/MWh. The extent of
underutilization was 14 TWh so the overstatement is €2.5 million, reducing the total 2011
loss from €22.4 million to €20 million or by 10% (so not insignificant). In 2012 the
underutilization was 12.7 TWh so the overstatement was €2.3 million, reducing the total
2012 loss from €20.8 million to €18.5 million or by 12% (Newbery et al, 2013, tables 8.2,
8.4). The error in ignoring price impacts increases as the square of the shortfall and so
becomes smaller as interconnectors are more fully used. At the other extreme, if coupling
eliminates the price difference, then the actual gain would be only half the measured gain
assuming no price change.
3. Comparing the various measures of welfare losses
The results of comparing the original rough estimates in Newbery et al (2013) with the
presumably more accurate ACER (2014) estimates are illuminating. The estimates in
Newbery et al (2013) concentrated on a few interconnectors for which there was good
data and which were not then coupled. The social welfare losses adjusted for price
changes on England-France interconnector IFA were 22% of potential trade in 2011
(30% of actual trade) and 12% of a higher value of potential trade in 2012 (14% of actual

8
trade), averaging 16% of potential trade (20% of actual trade).8 The Germany-France
interconnection became coupled in Q4 2010 so the loss on the German-France
interconnection was estimated for Q1-Q3 2010. The estimated loss was 26% of potential
trade, ignoring resistive losses as these interconnectors were short (in theory infinitely
short) AC links. The losses for France-Spain 2011 and 2013 (not given in our report but
given in the Appendix to this paper) were 11 and 12%, again ignoring resistive losses.
In conclusion the report estimated the social losses of not coupling for these
examples at 10-20% of the gains from trade, depending on the year, the interconnector,
and market prices. After coupling, these losses should fall to zero. To put this into
context, EU exports (and imports) in 2011 were about 315 TWh out of 3,080 TWh
supplied (or about 10%). The original report then argued that if losses were 10-20% of
interconnector trade, and trade were 10% of total EU demand, then the losses would be
about 1-2% of total demand.
However, the welfare losses on the interconnectors were estimated as a
percentage of the gains from trade, which is the arbitrage gain from the price difference,
not the standard measure of the value of trade, which is the price of the product times the
volume traded. Thus to scale up the evidence from a few interconnectors one needs this
measure of the gains from total EU-29 trade, which is difficult to estimate as it depends
on the price difference across the borders. One way to derive a very rough estimate is to
note that the average absolute price difference across IFA for 2011-12 was €11/MWh.9
Additional estimates come from the incremental value of expanding interconnectors,
which ACER (2014, fig 48) provides for a sample of such links. The values are given in €
million per 100 MW extra capacity assuming no change in prices at each end, from which
one can estimate the average initial price difference across each, assuming 100%
utilization of the extra 100 MW. The average is €6/MWh with a range from €0-25/MWh
and a standard deviation of €6/MWh.
As prices have been converging over time (ACER, 2014) it might be more
reasonable to take a value closer to €10/MWh as a rough estimate of the pre-integration
price difference (and arguably an underestimate), in which case this average value of the
gains from trade would have been €3.15 billion/yr, compared to the value of total
wholesale demand of €150 billion at an average wholesale price of €50/MWh.10
If the
estimated 10-20% welfare loss as a percentage of the gains from trade were to hold
across the whole EU, the gains from efficient market coupling compared to the 2004 case
of no coupling would be €315-630 million per year, or 0.2-0.4% of wholesale market
8 Newbery et al (2013) tables 8.2 and 8.4 but correcting for the price change.
9 Newbery et al (2013, tables 8.2, 8.4) assuming an average of 1,250MW for 8,760 hours.
10 That was the estimate for 2011 and equal to the measured price in 2012, which fell slightly to
€46/MWh in 2013, see ACER (2014b, fig 35).

9
value, one fifth of the 1-2% of rough estimates (as the arbitrage price difference is only
one fifth of the average price).
ACER (2014) adopted the simpler form of our methodology, ignoring price
changes and measuring the initial price difference times the change in volume, valid for
most AC interconnections. This estimate of the ‘loss in social welfare’ due to the absence
of market coupling is presented in Table 1. The total loss for these remaining uncoupled
interconnectors averaged €365 m/yr, which is towards the lower of the estimate given
above, but as many interconnectors had been coupled by this time, this figure is an under-
estimate of the pre-coupling period.
Table 1 Estimated ‘loss in social welfare’ 2012–2013
Border
2012
€ million
2013
€ million
average
share
NTC
MW
Loss
€’000/MWY loss/trade
CH-FR € 66.36 € 68.81 21% 2,300 € 29.92 37%
NI-GB € 21.82 € 21.07 7% 500 € 42.14 54%
CH-DE € 39.25 € 41.81 12% 4,000 € 10.45 13%
CH-IT € 33.45 € 17.64 8% 4,000 € 4.41 8%
CZ-DE € 32.98 € 35.13 10% 1,600 € 21.96 27%
AT-CZ € 23.28 € 16.21 6% 800 € 20.26 31%
FR-IT € 18.85 € 18.13 6% 2,700 € 6.71 9%
AT-SI € 18.37 € 18.73 6% 900 € 20.81 26%
AT-HU € 17.69 € 14.56 5% 800 € 18.20 25%
FR-GB € 14.03 € 15.85 5% 2,000 € 7.93 9%
AT-CH € 13.24 € 14.54 4% 900 € 16.16 19%
NL-GB € 12.53 € 10.06 3% 1,000 € 10.06 14%
ES-FR € 8.34 € 7.25 2% 1,000 € 7.25 10%
IE-GB (EWIC) € 0.32 € 33.58 5% 500 € 67.16 42%
Total € 321 € 333 100% 23,000 € 14.49 18%
Source: ACER (2014b, fig 47) and ENTSO-E for estimated NTCs
The first two columns in Table 1 give the ACER data. Column 3 gives the
contribution of each interconnector to the total measured loss as a percentage. Column 4
gives the Net Transfer Capacity (NTC) based on the 2012 data used by Newbery et al
(2013), updated for some interconnectors from web searches. These figures should be
treated as rough estimates as the variation on some interconnectors is from zero to several
times the value shown in the table, and the weighted average standard deviation (SD) of
the hourly 2012 NTCs on these borders was 42%.
Some of the individual values in the originally published ACER Report were
implausibly high, particularly those between the Single Electricity Market (SEM, the
combined markets of NI and IE) and GB). After discussions with ACER, these figures
have been revised in the latest version placed on the website in December 2014. They are
still high in relation to capacity, even though they have been minimized by putting the

10
links in at their full nominal value when NI-GB has been at only 50% capacity for some
time. A quick calculation for 2012 for NI-GB in Appendix Table A2 suggests a loss of
€7.5 million in 2012, which is very different from the original value of €43.6 m and even
the revised value of €21.82 m shown in Table 1. SEM Committee (2011) estimated the
2010 welfare loss of both SEM-GB cables together at €30 million. If the two SEM-GB
interconnectors are ignored, the social welfare loss falls to €290 million, 16% of trade
value.
The data allow one estimate of the loss by comparing it to interconnector
capacity, which in Table 1 is €16,870/MWyear, or excluding the rather high value for
SEM-GB, is €12,670/MWyr. Scaling this up by the lower of import and export capacity
of 83 GW gives €1,052 million/yr. The final column takes the estimated loss and divides
it by the value of potential arbitrage trade for 8,000 hours per year at 100% utilization
and assuming an arbitrage gain of €10/MWh, and this welfare loss as a proportion of the
potential arbitrage gains from trade falls from 20% to 16%, right in the middle of the
range estimated above. One caveat is that if all interconnectors are efficiently coupled,
then the gains over each interconnector may fall, so scaling up to the whole of the EU
may overestimate the total gains.
4. Other measures of the gains from improved market integration
The Target Electricity Model aims to integrate markets not just at the day-ahead stage,
but intra-day and real-time, or via sharing balancing services, as well as sharing reserve
capacity and allowing more efficient cross-border trading up to three years before
delivery. Newbery et al (2013, §5.3) estimated the additional gains that could come from
efficiently moving away a Baseline case of national self-security, in which the only gains
are short-term arbitrage of the kind discussed above. In the less optimistic case in which
only half the socially beneficial transmission investment is completed and under
Continuing Policy (not the most ambitious renewables targets also considered) the EU-28
gains above Baseline could be €10-€16 billion by 2020 or 7-11% current wholesale
market value, and possibly to €8-€36 billion by 2030. Sharing balancing, reserves and
demand side response under a fully smart EU-wide grid could almost double the lower
values and increase the top of the range by 20%. Such gains would take substantial
investment and considerable institutional change, as well as trust, to deliver, which will
take time - the TEM has already taken nearly two decades since the initial steps with the
first Electricity Directive 96/92/EC. In the shorter run it is worth estimating the more
realizable gains from better intraday and balancing, both addressed in ACER (2014).
4.1 Intra-day trading benefits
Since 2010, day-ahead utilization of interconnectors has risen from 32.1% to 39.0% in
2013 or by 20%, and intra-day commercial (i.e. not TSO led) trading from 1.8% to 2.9%

11
of NTC, or by 61% (ACER, 2014, fig 50). On borders with continuous trading, almost
half of this is requested less than three hours before delivery and is thus delivering a
valuable service in responding to improved forecasts of intermittent power and demand
near to dispatch.
It is difficult to estimate the benefits from better integration across the EU-28.
Data provided in ACER (2014) give some indication, and are reproduced as Appendix
Table A3. They suggest that the benefits from more efficient intra-day trading over the
borders sampled might be €2.56/MWh (SD = €0.6) averaged over every hour of the year
per interconnector. If interconnectors are only 40% fully utilized (ACER, 2014, fig 50)
and if the total interconnector capacity is 83 GW,11
and if the volume of intraday trading
might double from its 2012 low level of 3%, an extra 2,400 MW might be available on
average perhaps 6,000 hours per year12
with a total value of €37 million/yr. This is
consistent with scaling up the data in table A3 to the total interconnector capacity level,
and assuming 200 MW are traded on the days when significant price differences are
observed,13
which would give a value of €37 million/yr.
4.2 Balancing benefits
Most countries are currently reluctant to share balancing services, but the aim is to create
the institutions and trust to enhance the efficiency of balancing interconnected systems.
Switzerland, for example currently procures over half its reserves from abroad (ACER,
2014, fig 54). However, as with the gains from trade, one needs to be careful in
estimating the gains from shared balancing services.
ACER (2014) provides estimates of the potential gains transcribed in Table 2. The
simplest benefit to be gained is the netting of imbalances, in which one side of the border
is short and the other side long, so that together they can reduce imbalances on each side.
The other obvious benefit is to be derived from procuring balancing energy from abroad
when it is cheaper. Table 2 gives estimates of each for a selection of borders in 2013. The
total value for FR-GB is €39 m/yr, which can be compared with the estimates given in
Mott MacDonald (2013) of full unconstrained Common Merit Order shared balancing
between France and GB of €51 m/yr, which is of comparable size, given the difficulties
of properly modelling the potential benefits. If one takes the balancing benefit as
€33,000/MWyr (from the bottom right average) and if that is scaled up to the 2 GW, FR-
11
Data in convenient matrix form is available at
https://www.entsoe.eu/fileadmin/user_upload/_library/ntc/archive/NTC-Values-Winter-2010-
2011.pdf but post 2011 data does not seem to be available in convenient matrix form. The totals
are the lower of import or export values limited by maxima. 12
NTCs vary by season and for other reasons so this is a guesstimate of availability of 68%. 13
The hours recorded in Table A3 assume at least 100 MW were free, so the assumption here is
that as that was a de minimis cut-off, the actual is twice as high.
12
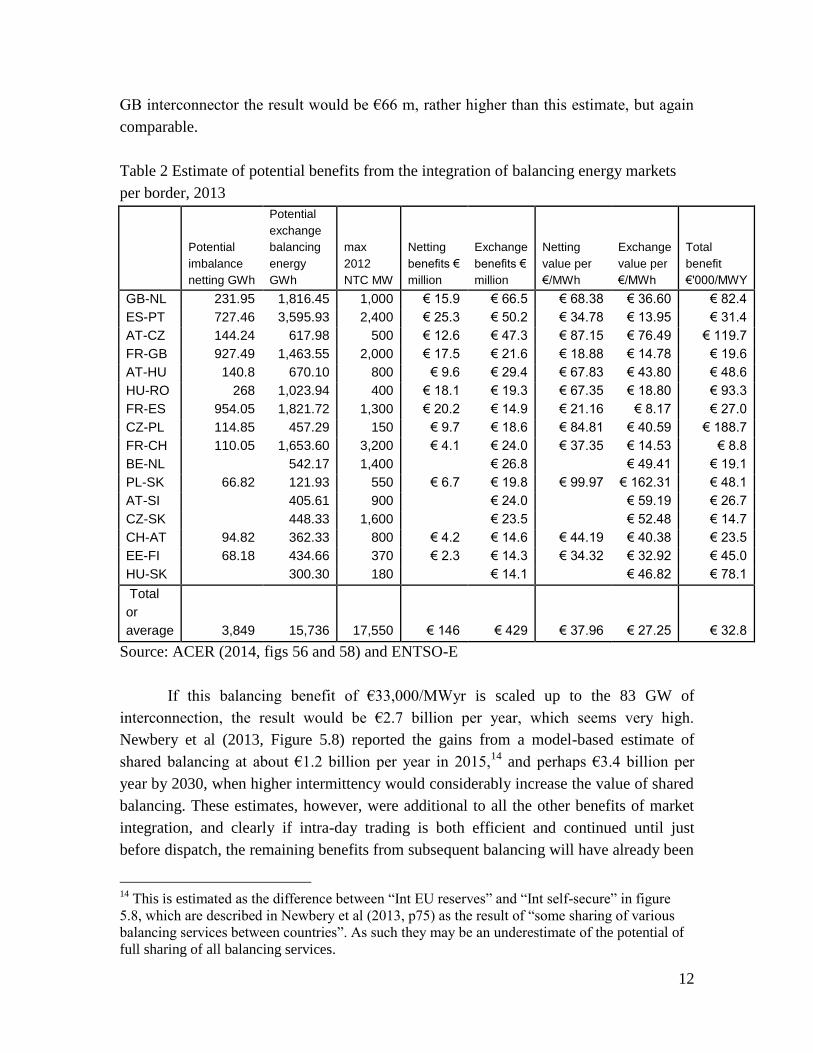
GB interconnector the result would be €66 m, rather higher than this estimate, but again
comparable.
Table 2 Estimate of potential benefits from the integration of balancing energy markets
per border, 2013
Potential
imbalance
netting GWh
Potential
exchange
balancing
energy
GWh
max
2012
NTC MW
Netting
benefits €
million
Exchange
benefits €
million
Netting
value per
€/MWh
Exchange
value per
€/MWh
Total
benefit
€'000/MWY
GB-NL 231.95 1,816.45 1,000 € 15.9 € 66.5 € 68.38 € 36.60 € 82.4
ES-PT 727.46 3,595.93 2,400 € 25.3 € 50.2 € 34.78 € 13.95 € 31.4
AT-CZ 144.24 617.98 500 € 12.6 € 47.3 € 87.15 € 76.49 € 119.7
FR-GB 927.49 1,463.55 2,000 € 17.5 € 21.6 € 18.88 € 14.78 € 19.6
AT-HU 140.8 670.10 800 € 9.6 € 29.4 € 67.83 € 43.80 € 48.6
HU-RO 268 1,023.94 400 € 18.1 € 19.3 € 67.35 € 18.80 € 93.3
FR-ES 954.05 1,821.72 1,300 € 20.2 € 14.9 € 21.16 € 8.17 € 27.0
CZ-PL 114.85 457.29 150 € 9.7 € 18.6 € 84.81 € 40.59 € 188.7
FR-CH 110.05 1,653.60 3,200 € 4.1 € 24.0 € 37.35 € 14.53 € 8.8
BE-NL
542.17 1,400 € 26.8 € 49.41 € 19.1
PL-SK 66.82 121.93 550 € 6.7 € 19.8 € 99.97 € 162.31 € 48.1
AT-SI
405.61 900 € 24.0 € 59.19 € 26.7
CZ-SK
448.33 1,600 € 23.5 € 52.48 € 14.7
CH-AT 94.82 362.33 800 € 4.2 € 14.6 € 44.19 € 40.38 € 23.5
EE-FI 68.18 434.66 370 € 2.3 € 14.3 € 34.32 € 32.92 € 45.0
HU-SK 300.30 180 € 14.1 € 46.82 € 78.1
Total
or
average 3,849 15,736 17,550 € 146 € 429 € 37.96 € 27.25 € 32.8
Source: ACER (2014, figs 56 and 58) and ENTSO-E
If this balancing benefit of €33,000/MWyr is scaled up to the 83 GW of
interconnection, the result would be €2.7 billion per year, which seems very high.
Newbery et al (2013, Figure 5.8) reported the gains from a model-based estimate of
shared balancing at about €1.2 billion per year in 2015,14
and perhaps €3.4 billion per
year by 2030, when higher intermittency would considerably increase the value of shared
balancing. These estimates, however, were additional to all the other benefits of market
integration, and clearly if intra-day trading is both efficient and continued until just
before dispatch, the remaining benefits from subsequent balancing will have already been
14
This is estimated as the difference between “Int EU reserves” and “Int self-secure” in figure
5.8, which are described in Newbery et al (2013, p75) as the result of “some sharing of various
balancing services between countries”. As such they may be an underestimate of the potential of
full sharing of all balancing services.

13
largely captured. In short, there are problems in allocating the gains from integration over
different time-scales, particularly as forecasting improves, and so one should not attach
particular weight to one part of the total gains. There is the additional point that by its
nature it is difficult to properly model future imbalances in an optimizing engineering
model, as these rely on imperfections that the model may be designed to ignore, as well
as estimating the scarcity costs given the many short-run constraints limited their
delivery.
ACER (2014, p140) admits that it is very difficult to properly value the potential
benefits of sharing balancing services as that could “be obtained only through having
access to (and the ability to process) all the data corresponding to the bids and offers
submitted by all BSPs from all the imbalance areas”. Instead the estimate is based on “the
imbalance price differences across imbalance price areas in Europe.” Using the data from
fig 56 shown in Table 2 one can calculate the value of netting and exchanging energy in
€/MWh (the penultimate last two columns) which show netting values of €32/MWh and
€27/MWh respectively, substantially higher than the day-ahead arbitrage values, but not
implausible for balancing markets.
Given the very high total value based on a simple extrapolation from the data in
Table 2, it is worth exploring how better to extrapolate to the EU-28 from data covering
only one-fifth of cross-border interconnection. From the data in table 2, the coefficients
of variation (CVs) of netting and energy trading per MWh are 72% and 134% and the CV
of the total benefits per MW is 146%, while the average of the two least valuable borders
is one third the average value. If the remaining interconnectors are one-third as valuable
per MW NTC, given that the potential benefits identified in the subset of interconnectors
amounts to €575 million, (larger for this subset than all the other potential gains), the
total would be €1.3 billion per year, or 41% of the total estimated gains from trade (and
double the upper end of the estimated arbitrage gains from coupling). If so, then the
benefits from integrating cross-border balancing are considerably larger than those from
coupling at the day-ahead stage, and if to realize these gains more spare capacity has to
be held back to facilitate balancing, that would seem worthwhile.
On the other hand, sharing balancing across borders is just one way of delivering
flexibility at short notice, and as dispatch becomes smarter, and as more Demand Side
Resources and storage are made available, so the marginal value of any one source of
flexibility is likely to fall. Offsetting that will be the growth in need for flexibility with
the growth in intermittent wind and solar PV generation.

14
4.3 Welfare impact of unscheduled flows
Acer (2014, figure 62) distinguishes between loop flows and unscheduled transit flows,
which together are classified as unscheduled flows that arise because of imperfect
coordination between TSOs, and the desire to treat each dispatch zone as a copper plate,
instead of the US Standard Market Design of nodal pricing. The costs of this inefficiency
has risen from €324 million in 2011 to €469 million in 2013 for the 20 borders studied
totaling 35 GW out of a total of 83 GW. The gains in 2013 are thus €13 million/GW
NTC, and if the remaining borders are only half as valuable, the potential gains would be
€790 million/year.
4.4 Costs of curtailment at borders
Acer (2014, fig 65) gives the costs of curtailment at a selected set of borders, reproduced
with NTC data in Table A4. For the 26 GW of borders for which data are available for
both 2012 and 2013 the total cost averaged €670/MWyr. As several borders have been
curtailed in both directions one can scale up in two ways. The higher estimate would be
to take the higher value direction only for those for which we have values in both
directions, for which there are 6.350 GW with data for both years, for which the average
cost was €1,771/MWyr, but only include export interconnector capacity. Scaling this up
to 83 GW total would give an annual cost of €147 million/yr. The lower value would be
to scale up the overall average of €891/MWyr by the sum of export and import capacities
of 132GW, which would give €117 million/yr. Finally, as a compromise, one can take the
total value for both years and the total capacities and scale up to 179 GW (total import
plus export) to give €140 million/yr. The resulting range from €117-€147 million/yr is
reassuringly tight.
5. Conclusion
The high value of increasing the efficiency of interconnector use is clear at a number of
critical borders. The earlier estimate of the gains from increasing cross-border trade from
10% of demand (315 TWh) to 15% of demand (i.e. by 158 TWh) assumed an average
price difference before and after trade of €10/MWh and gives the benefit as €1.58
billion/yr or 1% of the value of wholesale demand. This might be an under-estimate if
some fraction of trade is in a perverse direction. Just improving the existing day-ahead
arbitrage trade on interconnectors through coupling is worth 10-20% of the potential
gains from trade, which at €10/MWh is 10-20% of €3.15 billion/yr or €315-630
million/yr, or less than half the figure of 1% of the value of wholesale demand. This
lower figure seems consistent with the day-ahead arbitrage gains estimated by ACER
(2014), although the figures reported in summary table 3 are based on the gains per MW
of capacity and are then considerably larger at €1 billion/yr.

15
However, in addition to these arbitrage gains from market integration, intraday
trading might be worth €40 million/yr, balancing benefits which might be €1.3 billion/yr
or could be as large as €2.7 billion/yr, with proportionate scaling. These short-term
realizable gains amount to €2.4 billion/yr and are itemized and subtotaled in Table 3.
If unscheduled flows could be prevented (which might require a significant design
change to nodal pricing) then somewhere between €500 – €900 million might be gained.
Finally, the cost of curtailment might be €50-150 million. Including these longer-term
potential benefits gives €3.4 billion/yr, which is 2.3% of the value of wholesale demand,
but more than 100% of the current gains from trade over the interconnectors, which is a
more relevant metric.
Table 3 Potential gains from market integration
ACER sample 2013 EU-28
estimate
Newbery et al (2013) EU-28
estimate
€M NTC
2012
value
€'000/MWY
or MWh
€M €M NTC value
€'000/MWY
or MWh
€M
increase trade by
50%
€ 50 € 1,575
Day-ahead
market coupling
€ 279 22,000 € 12.7 € 1,052 € 63 4,300 € 14.6 € 1,208
Intraday coupling 10,050 € 2.6 € 37
Balancing € 575 17,550 € 32.8 € 1,343
subtotal € 2,432
Unscheduled
flows
€ 469 34,900 € 13.4 € 790
curtailment € 41 52,385 € 0.8 € 140
Total € 3,362
Note: the values for increased trade and intraday coupling (highlighted and italicized) are
based on values per MWh, curtailment is based on import and export flows
together.
Specifically, if the value of interconnectors is increased by 100%, then already
commercially attractive investments in interconnectors become even more so, and
perhaps a large number of currently marginal investments would look attractive.
Certainly the case studies considered suggested that expanding transmission links that are
severely congested is also already likely to be very cost effective. The conclusion is that
market coupling delivers total benefits that should substantially exceed the costs of the
required market design changes, and that the delays in market integration since the
market integration project started in 1997 have been large. Further gains could be reaped
from a move to nodal pricing but these would have to be counterbalanced against the

16
claimed loss of liquidity and scope for market manipulation that such a move might risk.
What emerges very strongly is the growing need for more interconnection.

17
References
ACER (2012) ACER/CEER Annual Report on the Results of Monitoring the Internal
Electricity and Natural Gas Markets in 2011 29 November 2012, Ljubljana,
available at
http://www.acer.europa.eu/Official_documents/Publications/Documents/ACER%
20Market%20Monitoring%20Report.pdf
ACER (2013). ACER/CEER Annual Report on the Results of Monitoring the Internal
Electricity and Natural Gas Markets in 2012, November, Ljubljana at
http://www.acer.europa.eu/Official_documents/Acts_of_the_Agency/Publication/
ACER%20Market%20Monitoring%20Report%202013.pdf
ACER (2014a). ACER/CEER Annual Report on the Results of Monitoring the Internal
Electricity and Natural Gas Markets in 2013, October, Ljubljana available at
http://www.acer.europa.eu/Official_documents/Acts_of_the_Agency/Publication/ACER_
Market_Monitoring_Report_2014.pdf
ACER (2014b). Public data underlying the figures of Annual Report on the Results of Monitoring
the Internal Electricity and Natural Gas Markets in 2013 at
http://www.acer.europa.eu/Events/Launch-of-the-ACERCEER-Monitoring-report-on-
the-internal-electricity-and-gas-markets-
/Documents/Public%20data%20underlying%20the%20figures%20published%20on%20
ACER%20CEER%20Annual%20Market%20Monitoring%20Report%202013.pdf (this
version accessed 16 Dec 2014)
Barth, R., Apfelbeck, J., Vogel, P., Meibom, P. & Weber, C. (2009). “Load-flow based market
coupling with large-scale wind power in Europe“, In Proceedings of the 8th International
Workshop on Large Scale Integration of Wind Power into Power Systems as well as on
Transmission Networks for Offshore Wind Farms. 14-15 October 2009, Energynautics
Bremen.
Böckers, V., J. Haucap and U. Heimeshoff (2013). Benefits of an integrated European
electricity market: the role of competition, Annex IV to Cost of Non-Europe in the
Single Market for Energy, report requested by the General Secretariat of the
European Parliament. at
http://www.europarl.europa.eu/RegData/etudes/etudes/join/2013/504466/IPOL-
JOIN_ET%282013%29504466%28ANN04%29_EN.pdf
De Jong, H, Hakvoort, R and Sharma, M (2007). “Effects of Flow-based Market Coupling for the
CWE region”, pp. 1-9, Proceedings of the 4th European Congress Economics and
Management of Energy in Industry (ECEMEI2007).
EC (2013) Commission Regulation (EU) No 543/2013 on submission and publication of data in
electricity markets and amending Annex I to Regulation (EC) No 714/2009 of the
European Parliament and of the Council at at http://eur-lex.europa.eu/legal-
content/EN/TXT/?uri=CELEX:32013R0543
DECC (2014). EMR Panel of Technical Experts’ Final Report on National Grid’s Electricity
Capacity Report at

18
https://www.gov.uk/government/uploads/system/uploads/attachment_data/file/252743/Ca
pacity_Market_Impact_Assessment_Oct_2013.pdf
Glachant, J-M (2010). “The Achievement of the EU Electricity Market through Market
Coupling”, EUI Working Paper RSCAS 2010/87, Robert Schuman Centre for Advanced
Studies, Florence Institute of Regulation
Green, R. (2007). “Nodal Pricing of Electricity: How Much Does it Cost to Get it Wrong?",
Journal of Regulatory Economics 31 (2): 125‐149.
Kristiansen, T (2007a). “A preliminary assessment of the market coupling arrangement on the
Kontek cable”, Energy Policy 35 pp3247–3255.
Kristiansen, T (2007b). “An assessment of the Danish–German cross-border auctions”, Energy
Policy 35 pp3369–3382.
Leuthold, F., Rumiantseva, I., Weigt, H., Jeske, T. & Hirschhausen, C. von (2005). “Nodal
Pricing in the German Electricity Sector – A Welfare Economics Analysis, with
Particular Reference to Implementing Offshore Wind Capacities”, Working Paper WP‐
EM‐08a, Dresden University of Technology, Chair for Energy Economics and Public
Sector Management.
Mansur, E. T. & White, M. W. (2009). “Market organization and efficiency in electricity
markets”, (2012 revised version) at
http://www.dartmouth.edu/~mansur/papers/mansur_white_pjmaep.htm
Meeus, L., (2011). “Implicit auctioning on the Kontek Cable: third time lucky?” Energy
Economics, 33(3), pp. 413-418
Mott MacDonald (2013). Impact Assessment on European Electricity Balancing Market, March,
report EC DG ENER/B2/524/2011 at
http://ec.europa.eu/energy/gas_electricity/studies/doc/electricity/20130610_eu_balancing
_master.pdf.
National Grid (2014). Electricity Capacity Report at
http://www2.nationalgrid.com/UK/Our%20company/Electricity/Market%20Reform/Ann
ouncements/June%202014%20Auction%20Guidelines%20publication/
NAO (2003). The New Electricity Trading Arrangements in England and Wales at
http://www.nao.org.uk/report/the-new-electricity-trading-arrangements-in-england-and-
wales/
Neuhoff, K., R. Boyd, T. Grau, J. Barquin, F. Echabarren, J. Bialek, C. Dent, C. von
Hirschhausen, B. F. Hobbs, F. Kunz, H. Weigt, C. Nabe, G. Papaefthymiou and C. Weber
(2011). “Renewable Electric Energy Integration: Quantifying the Value of Design of
Markets for International Transmission Capacity”, DIW Berlin Discussion Papers 1166.
Newbery, D.M., G. Strbac , D. Pudjianto, P. Noël, Booz & Co. and LeighFisher, (2013) Benefits
Of An Integrated European Energy Market Final report for DG ENER, July at
http://ec.europa.eu/energy/infrastructure/studies/doc/20130902_energy_integration_benef
its.pdf
Newbery, D.M. and M. Grubb (2014). “The Final Hurdle? Security of supply, the Capacity
Market and the role of interconnectors” EPRG working paper 1412 at
http://www.eprg.group.cam.ac.uk/wp-content/uploads/2014/09/1412-PDF1.pdf
19
Newbery, D.M. and G. Strbac (2011). Physical and Financial Capacity Rights for Cross-Border
Trade, for DG-ENER at
http://ec.europa.eu/energy/gas_electricity/studies/doc/electricity/2012_transmission.pdf
Oggioni, G and Smeers, Y (2010). “Degree of Coordination in Market Coupling and Counter-
trading”, EUI Working Paper RSCAS 2010/24, Robert Schuman Centre for Advanced
Studies, Loyola de Palacio Programme on Energy Policy
Ott, A. (2010). “PJM ‐ LMP Market Overview”, Presented at CPI/Re‐shaping workshop in
Brussels.
Pellini, E. (2014) Essays on European Electricity Market Integration Submitted for the degree of
Doctor of Philosophy in Energy Economics, Surrey, at
http://www.seec.surrey.ac.uk/PGProgs/PhDTheses/2014ElisabettaPelliniThesis.pdf
SEM Committee (2011) Proposed Costs and Estimation of Benefits of the Introduction of
additional Intra Day Gate Closures in the SEM - Information Paper, SEM -11-023, 21st
April 2011 at http://www.allislandproject.org/en/sem_publications.aspx?year=2011
TradeWind (2009), Integrating Wind, at http://www.trade-wind.eu

20
Appendix
Using the same methods set out in Newbery et al (2013) it is straightforward to compute
the social welfare losses on the Spanish-French interconnection for 2011 and 2012,
ignoring resistive losses as this is an AC interconnection, and similarly for the Moyle
interconnector between GB and NI.
Table A1 Social welfare loss on the Spain-France interconnection
FR-ES trade data 2011
Potential value exports FR=>ES € 53,697,430 68%
Potential value exports ES=>FR € 25,517,523 32%
Potential total value trade € 79,214,953 100%
Loss underexport FR=>ES € 3,486,071 4%
Loss underexport ES=>FR € 3,331,524 4%
FAPD FR=>ES € 1,265,000 2%
FAPD ES=>FR € 260,053 0%
Total loss € 8,342,650 11%
FR-ES trade data 2012
Potential value exports FR=>ES € 56,482,617 55%
Potential value exports ES=>FR € 45,810,192 45%
Potential total value trade € 102,292,810 100%
Loss underexport FR=>ES € 5,648,860 6%
Loss underexport ES=>FR € 3,621,960 4%
FAPD FR=>ES € 986,480 1%
FAPD ES=>FR € 1,538,622 2%
Total loss € 11,795,923 12%
Table A2 Social welfare loss on the Northern Ireland – GB Moyle interconnector 2012
Potential value of trade € 44,285,421 100%
Value of actual imports € 36,814,378 83%
Value of actual exports € 9,418 0%
total value of trade € 36,823,797 83%
Losses under-importing € 3,001,142 7%
Losses under-exporting € 219,209 0%
Loses FAPD € 4,244,833 10%
total losses € 7,465,185 17%
The potential benefits from more efficient intra-day trading are shown in Table A3, using
data from ACER (2014). The estimated value assumes that if the price difference is greater
than €10/MWh it is worth on average €15/MWh, if between €5-10/MWh then it is worth
€7/MWh, and if €1-5 then it is worth €3/MWh. Using these values the average over the 8760
hours per year are as shown in the final column in Table A3.
Table A3 Potential for intraday cross-border trade and efficiency in the use of cross-border
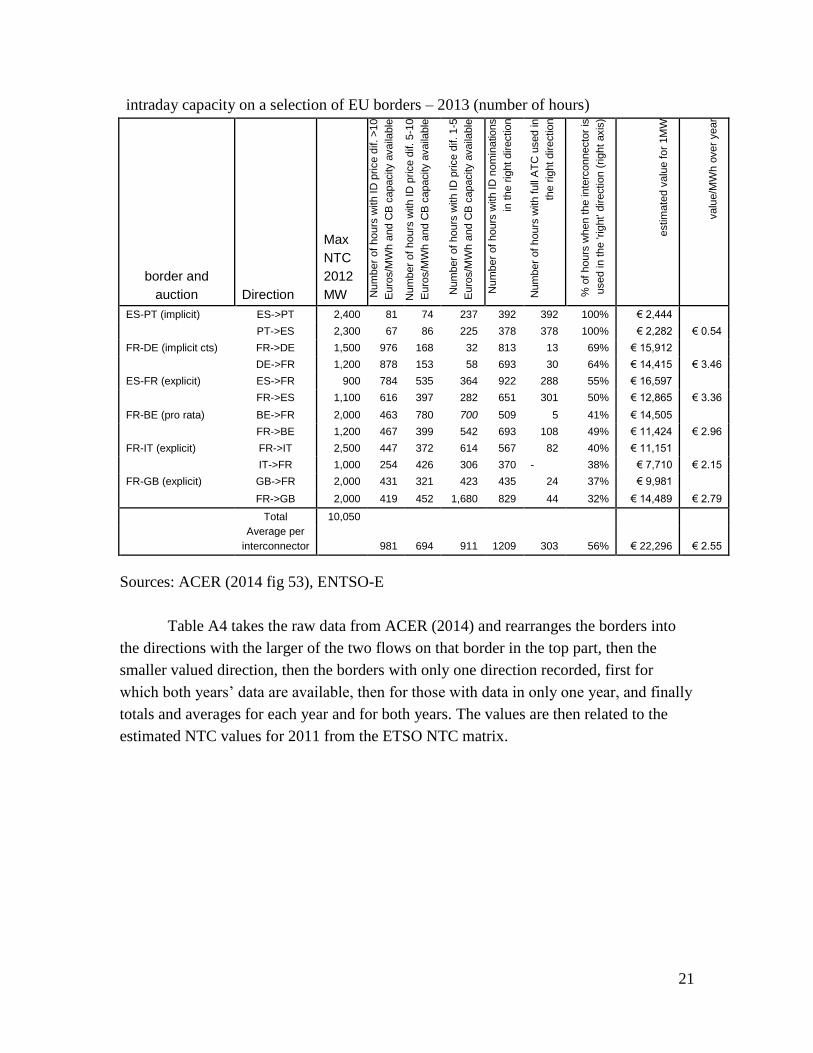
21
intraday capacity on a selection of EU borders – 2013 (number of hours)
border and
auction Direction
Max
NTC
2012
MW Num
ber
of
hours
with I
D p
rice d
if. >
10
Euro
s/M
Wh a
nd C
B c
apacity a
vaila
ble
Num
ber
of
hours
with I
D p
rice d
if. 5
-10
Euro
s/M
Wh a
nd C
B c
apacity a
vaila
ble
Num
ber
of
hours
with I
D p
rice d
if. 1
-5
Euro
s/M
Wh a
nd C
B c
apacity a
vaila
ble
Num
ber
of
hours
with I
D n
om
inations
in t
he r
ight
directio
n
Num
ber
of
hours
with f
ull
AT
C u
sed in
the r
ight directio
n
% o
f hours
when t
he in
terc
onnecto
r is
used in
the 'r
ight'
directio
n (
rig
ht axis
)
estim
ate
d v
alu
e f
or
1M
W
valu
e/M
Wh o
ver
year
ES-PT (implicit) ES->PT 2,400 81 74 237 392 392 100% € 2,444
PT->ES 2,300 67 86 225 378 378 100% € 2,282 € 0.54
FR-DE (implicit cts) FR->DE 1,500 976 168 32 813 13 69% € 15,912
DE->FR 1,200 878 153 58 693 30 64% € 14,415 € 3.46
ES-FR (explicit) ES->FR 900 784 535 364 922 288 55% € 16,597
FR->ES 1,100 616 397 282 651 301 50% € 12,865 € 3.36
FR-BE (pro rata) BE->FR 2,000 463 780 700 509 5 41% € 14,505
FR->BE 1,200 467 399 542 693 108 49% € 11,424 € 2.96
FR-IT (explicit) FR->IT 2,500 447 372 614 567 82 40% € 11,151
IT->FR 1,000 254 426 306 370 - 38% € 7,710 € 2.15
FR-GB (explicit) GB->FR 2,000 431 321 423 435 24 37% € 9,981
FR->GB 2,000 419 452 1,680 829 44 32% € 14,489 € 2.79
Total 10,050
Average per
interconnector 981 694 911 1209 303 56% € 22,296 € 2.55
Sources: ACER (2014 fig 53), ENTSO-E
Table A4 takes the raw data from ACER (2014) and rearranges the borders into
the directions with the larger of the two flows on that border in the top part, then the
smaller valued direction, then the borders with only one direction recorded, first for
which both years’ data are available, then for those with data in only one year, and finally
totals and averages for each year and for both years. The values are then related to the
estimated NTC values for 2011 from the ETSO NTC matrix.

22
Table A4 Total curtailment costs per border €
border 2012 2013 NTC average/MW
GR->IT € 659,035 € 2,418,188 500 € 3,077.2
BG->GR € 2,400 € 24,068 550 € 24.1
AT->IT € 57,179 € 328,270 220 € 876.0
DE->CH € 35,115 € 12,643 1,500 € 15.9
FR->UK € 9,239,274 € 8,942,479 2,000 € 4,545.4
ES->FR € 328,482 € 211,612 580 € 465.6
NL->UK € 88,026 € 139,902 1,000 € 114.0
major pair € 10,409,511 € 12,077,162 6,350 € 1,770.6
IT->AT € 589 € 301 285 € 1.6
CH->DE € 8,205 € 2,681 3,500 € 1.6
IT->GR € 33,825 € 111,359 500 € 145.2
UK->FR € 3,326,577 € 807,553 2,000 € 1,033.5
FR->ES € 114,263 € 69,357 1,300 € 70.6
UK->NL € 271 € 197,946 1,000 € 99.1
minor pair € 3,483,730 € 1,189,197 8,585 € 272.2
all pairs € 13,893,241 € 13,266,359 14,935 € 909.3
FR->IT € 19,816 € 3,022,625 2,575 € 590.8
FR->CH € 146,186 € 82,229 3,200 € 35.7
CH->AT € 2,081 € 783 1,200 € 1.2
CH->IT € 2,660,783 € 1,832,740 4,165 € 539.4
subtotal € 2,828,866 € 4,938,377 11,140 € 348.6
DKw->DE € 13,690 585 € 23.4
PL->SK € 31,288 500 € 62.6
DE->NL € 4,700 3850 € 1.2
subtotal € 49,678 4935 € 10.1
IT->CH € 2,564 1810 € 1.4
SL->IT
€ 502,712 160 € 3,142.0
IE->UK € 6,033 500 € 12.1
UK->IE € 5,661,833 750 € 7,549.1
subtotal € 6,173,142 3,220 € 1,917.1
Total 2012 € 16,771,785 23,090 € 726.4
Total 2013 € 24,377,878 23,090 € 1,055.8
Total all € 16,771,785 € 24,377,878 23,090 € 891.07
Sources: ACER (2014 fig 65), ENTSO-E
Note: there are no data for PL=>SK so the NTC is from SK=>PL