The Behavior of Ordinary and Geosynthetic Encased Stone ...
27
The Behavior of Ordinary and Geosynthetic Encased Stone Columns in Collapsible Soil: A Numerical Study Author, Henok Lemma Belayneh Addis Ababa Science and Technology University Department of Civil Engineering College of Architecture and Civil Engineering Po. Box;1000-21281 Addis Ababa, Ethiopia Email; [email protected] Abstract This paper examines the basic assumptions, procedures and results of the numerical analysis in simulating the behaviour of un-encased versus geotextile encased stone column for collapsible soils to support an embankment dam, using commercially available finite element method software PLAXIS 3D. Input parameters of numerical modelling were estimated using different correlation techniques based on SPT N values of soil. Soil data for this thesis were adopted from the SPT results. The data for stone column and geosynthetic material were adopted from a research work of Iman Hossein Pour Babei. The results of this study show that, geosynthetic encased stone column (GESC) has a remarkable influence on decreasing settlements and accelerate the consolidation time. The use of GESC decreases the amount of settlement of unreinforced soil from 338mm to 257mm. It also accelerates the consolidation end time from 9719 days to 653 days. The research also recommends to conduct further study on the response to bulging effect of GESC in relation to geotextile stiffness. KEYWORDS; Finite Element Analysis, Consolidation, Collapsible soil, PLAXIS, SPT, GESC GSJ: Volume 8, Issue 12, December 2020 ISSN 2320-9186 978 GSJ© 2020 www.globalscientificjournal.com GSJ: Volume 8, Issue 12, December 2020, Online: ISSN 2320-9186 www.globalscientificjournal.com
Transcript of The Behavior of Ordinary and Geosynthetic Encased Stone ...
The Behavior of Ordinary and Geosynthetic Encased Stone
Columns in Collapsible Soil: A Numerical Study Author, Henok Lemma Belayneh
Addis Ababa Science and Technology University
Department of Civil Engineering
College of Architecture and Civil Engineering
Po. Box;1000-21281 Addis Ababa, Ethiopia Email; [email protected]
Abstract This paper examines the basic assumptions, procedures and results of the numerical analysis in
simulating the behaviour of un-encased versus geotextile encased stone column for collapsible
soils to support an embankment dam, using commercially available finite element method
software PLAXIS 3D. Input parameters of numerical modelling were estimated using different correlation techniques
based on SPT N values of soil. Soil data for this thesis were adopted from the SPT results. The
data for stone column and geosynthetic material were adopted from a research work of Iman
Hossein Pour Babei.
The results of this study show that, geosynthetic encased stone column (GESC) has a remarkable
influence on decreasing settlements and accelerate the consolidation time. The use of GESC
decreases the amount of settlement of unreinforced soil from 338mm to 257mm. It also
accelerates the consolidation end time from 9719 days to 653 days.
The research also recommends to conduct further study on the response to bulging effect of
GESC in relation to geotextile stiffness.
KEYWORDS; Finite Element Analysis, Consolidation, Collapsible soil, PLAXIS, SPT, GESC
GSJ: Volume 8, Issue 12, December 2020 ISSN 2320-9186 978
GSJ© 2020 www.globalscientificjournal.com
GSJ: Volume 8, Issue 12, December 2020, Online: ISSN 2320-9186 www.globalscientificjournal.com
Chapter One
Introduction
1.1 General Collapsible soils are problematic soils that make the construction of foundations extremely
difficult in its natural state. Such soils are moisture sensitive; and exhibit relatively rapid volume
compressions on the action of loading and wetting. If the foundations rest on collapsible soil,
several ground improvement techniques needs to be considered in order to avoid foundation
failure.
Stone columns are widely used globally as structural elements due to the simplicity, short
duration, and cheap cost of their construction. The purposes of this technique are to increase the
bearing capacity and reduce the total settlement of soft soils. Stone columns derive their strength
and stiffness primarily from the confinement stress provided by the surrounding soil (Guetif etal.
2007).
A cited literature revealed that when these stone columns are used to improve collapsible soil,
the materials (stone pieces) of stone column get into the surrounding soil due to inadequate
lateral confinement, particularly at depths closer to the ground. However, to overcome these
limitations, stone columns can be encased using geosynthetics (Al-Obaidy, 2000).
The main purpose of this study is to investigate the behaviour of encased stone column in
collapsible soil numerically using commercially available finite element software PLAXIS 3D.
1.2 Objective of the Study 1.2.1 General Objective
The main objective of this study is to evaluate the behaviour of stone columns (ordinary and
geosynthetic encased) in collapsible soil by numerical analysis.
1.2.2 Specific Objectives
• To examine the collapse potential of soil.
• To determine input parameters for numerical simulation from SPT results.
GSJ: Volume 8, Issue 12, December 2020 ISSN 2320-9186 979
GSJ© 2020 www.globalscientificjournal.com

• To validate the FEM model with actual field test results.
• To evaluate the improvement achieved in treating collapsible soil with ordinary and
geosynthetic encased stone column.
1.3 Scope of the Study This research is intended to assess the behavior of GESC in collapsible soils under a 5m
embankment dam by using PLAXIS 3D, FE method software. The study is supported by
different types of literatures and series of laboratory and field experiments.
However, the findings of the research are limited to one soil sample which is collapsible soil that
is found in SNNPR, Hawassa near the airport. Therefore, findings of this thesis should be
considered as indicative rather than definitive for application.
1.4 Structure of the Study This paper is organized in six chapters.
The first chapter gives a brief description of the thesis background, statement of the problem,
objectives, scope and limitation of the study. Chapter two presents literature review on
collapsible soil, stone column and related studies on OSC and GESC. Chapter three, briefly
discuses about the materials, methods and procedures. The fourth chapter deals with modelling.
This chapter concerns about finite element modelling and model validation. The fifth chapter
discussed about analysis, results and discussions. The last chapter, chapter six presents the
conclusions and recommendations drawn from this research.
Chapter Two
Literature Review
2.1 Collapsible Soils
Collapsible soils are mainly wind-deposited sand and/or silts and volcanic dust deposits. These
deposits are characterized by relatively low unit weights, low natural moisture contents, high
void ratios and are cohesion less or slightly cohesive (Das, 2007).
GSJ: Volume 8, Issue 12, December 2020 ISSN 2320-9186 980
GSJ© 2020 www.globalscientificjournal.com
Collapsible soils exhibit high apparent strength in natural state. But when there is an increase in
saturation ratio or loading condition, collapse occurred as the bonds between the grains
breakdown (Khaled, 2012).
2.1.1 Examination of Collapse Potential of Soil
A. Geological Reconnaissance
Geological and geomorphological reconnaissance together with the experience of the
geotechnical engineer can be very helpful in predicting collapsible potential of soil deposits
(Beckwith,1995).
B. Indirect Evaluation of Collapse Potential
Several collapse criteria have been proposed for predicting the collapse behavior of collapsible
soils. Qualitative and semi-quantitative correlations between collapse potential and various index
properties have been developed and reported as listed below.
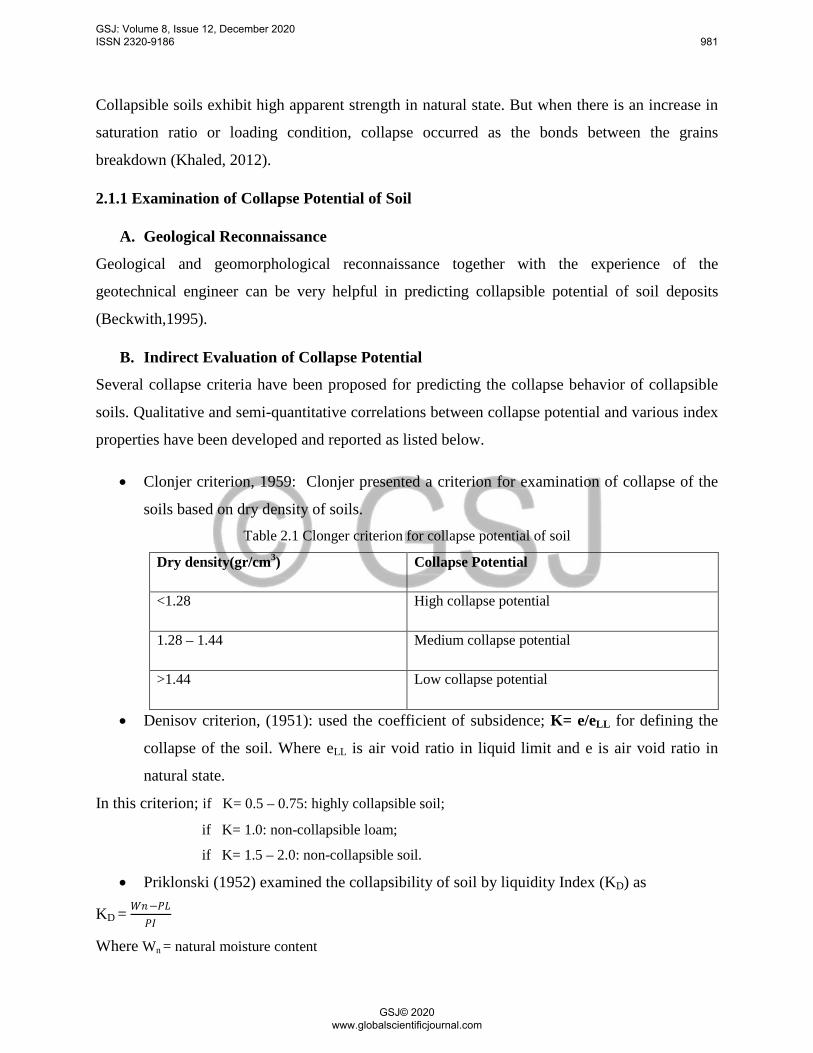
• Clonjer criterion, 1959: Clonjer presented a criterion for examination of collapse of the
soils based on dry density of soils. Table 2.1 Clonger criterion for collapse potential of soil
Dry density(gr/cm3) Collapse Potential
<1.28 High collapse potential
1.28 – 1.44 Medium collapse potential
>1.44 Low collapse potential
• Denisov criterion, (1951): used the coefficient of subsidence; K= e/eLL for defining the
collapse of the soil. Where eLL is air void ratio in liquid limit and e is air void ratio in
natural state.
In this criterion; if K= 0.5 – 0.75: highly collapsible soil;
if K= 1.0: non-collapsible loam;
if K= 1.5 – 2.0: non-collapsible soil.
• Priklonski (1952) examined the collapsibility of soil by liquidity Index (KD) as
KD = 𝑊𝑊𝑊𝑊−𝑃𝑃𝑃𝑃𝑃𝑃𝑃𝑃
Where Wn = natural moisture content
GSJ: Volume 8, Issue 12, December 2020 ISSN 2320-9186 981
GSJ© 2020 www.globalscientificjournal.com
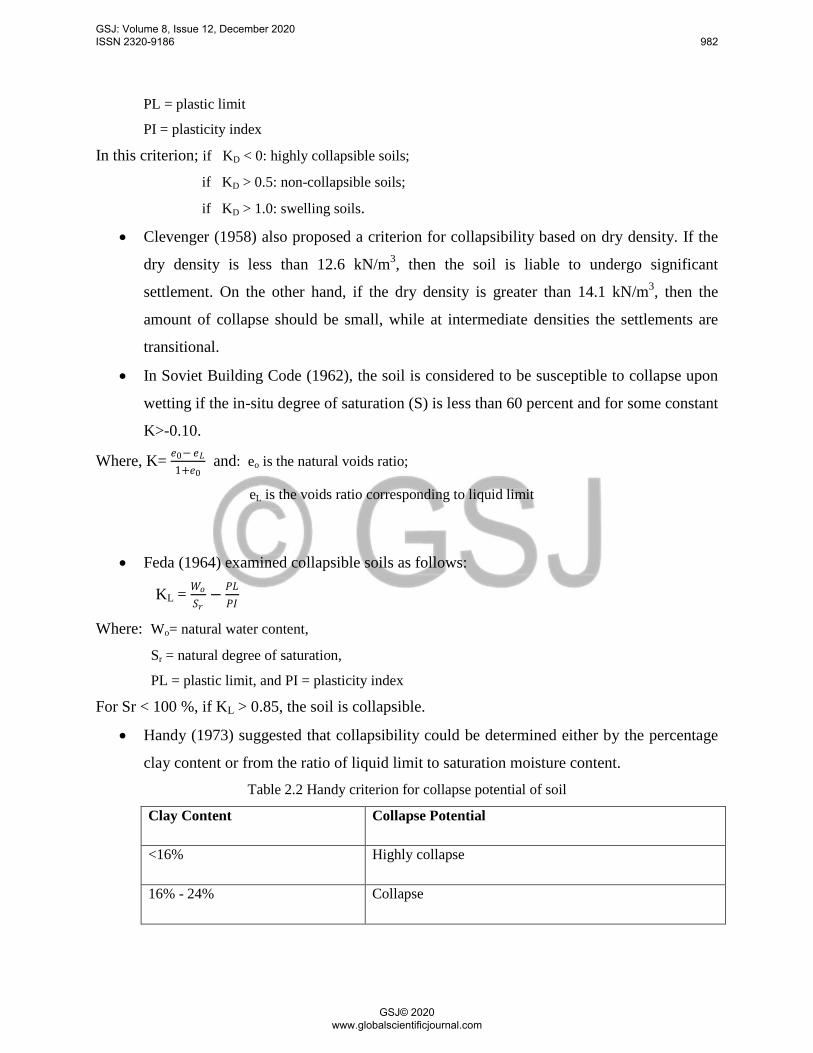
PL = plastic limit
PI = plasticity index
In this criterion; if KD < 0: highly collapsible soils;
if KD > 0.5: non-collapsible soils;
if KD > 1.0: swelling soils.
• Clevenger (1958) also proposed a criterion for collapsibility based on dry density. If the
dry density is less than 12.6 kN/m3, then the soil is liable to undergo significant
settlement. On the other hand, if the dry density is greater than 14.1 kN/m3, then the
amount of collapse should be small, while at intermediate densities the settlements are
transitional.
• In Soviet Building Code (1962), the soil is considered to be susceptible to collapse upon
wetting if the in-situ degree of saturation (S) is less than 60 percent and for some constant
K>-0.10.
Where, K= 𝑒𝑒0− 𝑒𝑒𝑃𝑃1+𝑒𝑒0
and: eo is the natural voids ratio;
eL is the voids ratio corresponding to liquid limit
• Feda (1964) examined collapsible soils as follows:
KL = 𝑊𝑊𝑜𝑜𝑆𝑆𝑟𝑟− 𝑃𝑃𝑃𝑃
𝑃𝑃𝑃𝑃
Where: Wo= natural water content,
Sr = natural degree of saturation,
PL = plastic limit, and PI = plasticity index
For Sr < 100 %, if KL > 0.85, the soil is collapsible.
• Handy (1973) suggested that collapsibility could be determined either by the percentage
clay content or from the ratio of liquid limit to saturation moisture content. Table 2.2 Handy criterion for collapse potential of soil
Clay Content Collapse Potential
<16% Highly collapse
16% - 24% Collapse
GSJ: Volume 8, Issue 12, December 2020 ISSN 2320-9186 982
GSJ© 2020 www.globalscientificjournal.com
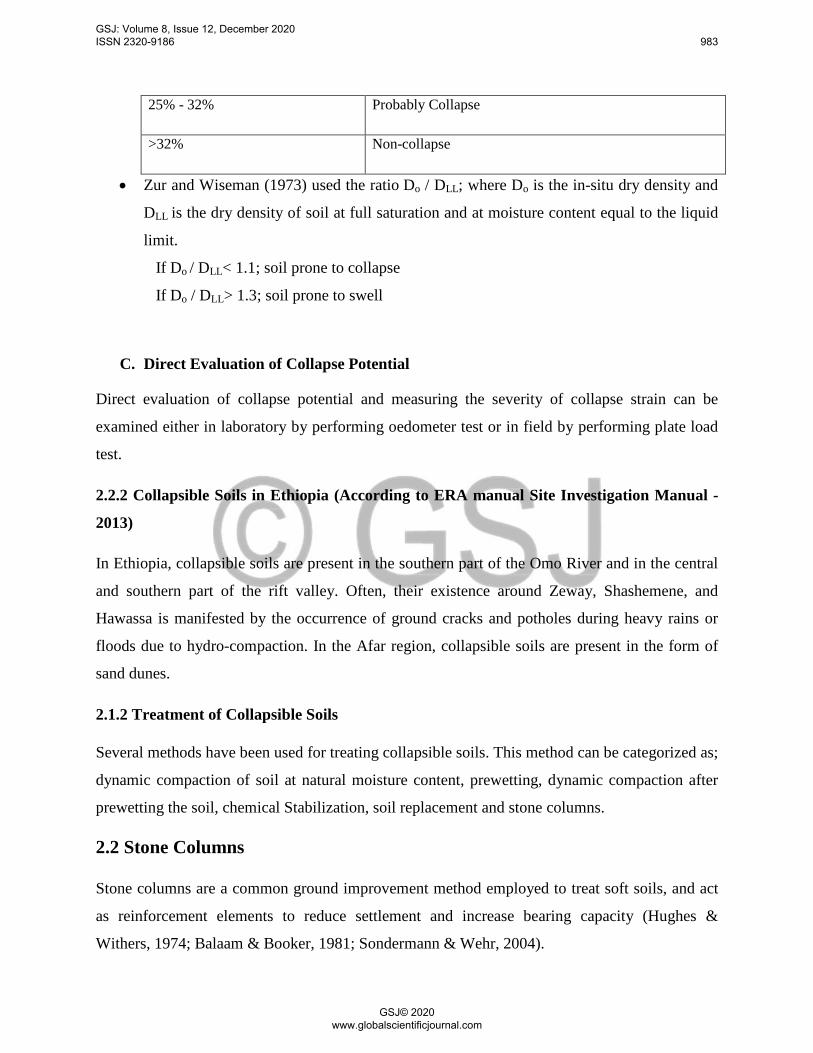
25% - 32% Probably Collapse
>32% Non-collapse
• Zur and Wiseman (1973) used the ratio Do / DLL; where Do is the in-situ dry density and
DLL is the dry density of soil at full saturation and at moisture content equal to the liquid
limit.
If Do / DLL< 1.1; soil prone to collapse
If Do / DLL> 1.3; soil prone to swell
C. Direct Evaluation of Collapse Potential
Direct evaluation of collapse potential and measuring the severity of collapse strain can be
examined either in laboratory by performing oedometer test or in field by performing plate load
test.
2.2.2 Collapsible Soils in Ethiopia (According to ERA manual Site Investigation Manual -
2013)
In Ethiopia, collapsible soils are present in the southern part of the Omo River and in the central
and southern part of the rift valley. Often, their existence around Zeway, Shashemene, and
Hawassa is manifested by the occurrence of ground cracks and potholes during heavy rains or
floods due to hydro-compaction. In the Afar region, collapsible soils are present in the form of
sand dunes.
2.1.2 Treatment of Collapsible Soils
Several methods have been used for treating collapsible soils. This method can be categorized as;
dynamic compaction of soil at natural moisture content, prewetting, dynamic compaction after
prewetting the soil, chemical Stabilization, soil replacement and stone columns.
2.2 Stone Columns
Stone columns are a common ground improvement method employed to treat soft soils, and act
as reinforcement elements to reduce settlement and increase bearing capacity (Hughes &
Withers, 1974; Balaam & Booker, 1981; Sondermann & Wehr, 2004).
GSJ: Volume 8, Issue 12, December 2020 ISSN 2320-9186 983
GSJ© 2020 www.globalscientificjournal.com
Those materials which are used in stone column method have high permeability by comparison
of the soft soils. Thus, stone columns behave like drain holes and help to speed up the rate of
consolidation process.
2.2.1 Ordinary Stone Column
The primary purposes for using stone column technique are to improve bearing capacity, reduce
settlement, and enhance drainage and stability (Ambily and Gandhi, 2007; Zhang et al., 2015).
Thus, the presence of granular columns will accelerate the dissipation of the excess pore water
pressure in soft soils which in turn accelerates the consolidation process and reduces both the
total and post-construction settlements.
2.2.2 Encased Stone Column
Ordinary stone columns usually derive their bearing capacity from passive resistance provided
by the surrounding foundation soil pressing against the lateral bulging of stone columns as a
result of axial load application. When embedded in soft clay, stone columns may bulge due to
lack of confinement offered by the surrounding soft soil. Furthermore, the soft clay may enter the
voids between granular material of column to cause clogging and reduce the permeability of
granular columns for drainage (Al-Obaidy 2000).
In order to avoid these consequences, additional confinement can be provided by using
geosynthetic encasement. This will help to isolate the granular soil inside the column so that it
does not mix with the surrounding soil and increase the stiffness of the columns (Murugesan and
Rajagopal 2009).
2.3 Related Laboratory and Numerical Studies
Many scholars conducted laboratory study on different problematic soils that are improved by
encased stone columns. Among those scholars Ayadat & Hanna (2005), Ali et al. (2010), Demir
& Sarici (2016) and Tandel et al. (2013) have studied on collapsible soil, kaolin clay, soft clay
and clay soil types respectively.
Elsawy et al (2010) had studied a FEM analysis on the behavior of ordinary and encased stone
columns. L. keykhosropur et al(2012) had also examined the influence of various parameters on
GSJ: Volume 8, Issue 12, December 2020 ISSN 2320-9186 984
GSJ© 2020 www.globalscientificjournal.com

the performance of geosynthetic encased stone columns through 3D numerical modeling. A
numerical study was undertaken by S.R Lo et al(2010) to examine the reinforcing role of stone
columns in soft clay.
Particular Features of this Study
This paper studies the behavior of GESC in collapsible soil under an embankment dam and
adjoins other uses of stone column. It argues the stone column is not only act as reinforcing
material for increasing the overall strength and stiffness of soft soil, but it also promotes
consolidation through effective drainage. This is because the materials which are used in stone
column method have high permeability in comparison to the host soils. In the analysis of FEM a
new calculation option is introduced, namely a consolidation analysis.
Chapter Three
Materials, Methods and Procedures
3.1 Introduction
A representative soil sample is taken from Ethiopian Rift valley system specifically, located in
SNNPR, Hawassa near to the Airport.
3.2 Materials
Soil data for this thesis were adopted from the Standard penetration test (SPT) and the soil
profiles for Bore hole 7 with sandy silt was chosen. The proposed site is for Factory Building
Project. However, for this research purpose a hypothetical embankment dam is proposed to build
on such problematic soil type using geosynthetic encased stone column. As the geotechnical
report of the soil investigation revealed, the soil exhibits high potential for collapse.
3.2.1 Geological and Geotechnical Overview of the Study Area
GSJ: Volume 8, Issue 12, December 2020 ISSN 2320-9186 985
GSJ© 2020 www.globalscientificjournal.com
In the Ethiopian Rift systems, the Quaternary Sediments are mostly of lacustrine origin.
Lacustrine beds are inter-bedded in plio-pleistocene ignimbrites in the lakes district and on the
rift shoulders.
The geological and geotechnical investigations of the study area are outlined below.
3.2.1.1 Site Geology
The upper most layer of the project site is loose to medium dense, light brown to white, non-
plastic sandy SILT/ silty SAND with gravel (Resedimented Pyroclastic Material). Beneath the
top geological formation in the project site dense, light brown, non-plastic sandy SILT soil layer
is found (Resedimented Pyroclastic Material).
The lowest profile found by investigation in the project site is dense to very dense, dull white,
sandy SILT soil layer (Volcanic Ash/resedimented pyroclastic material).
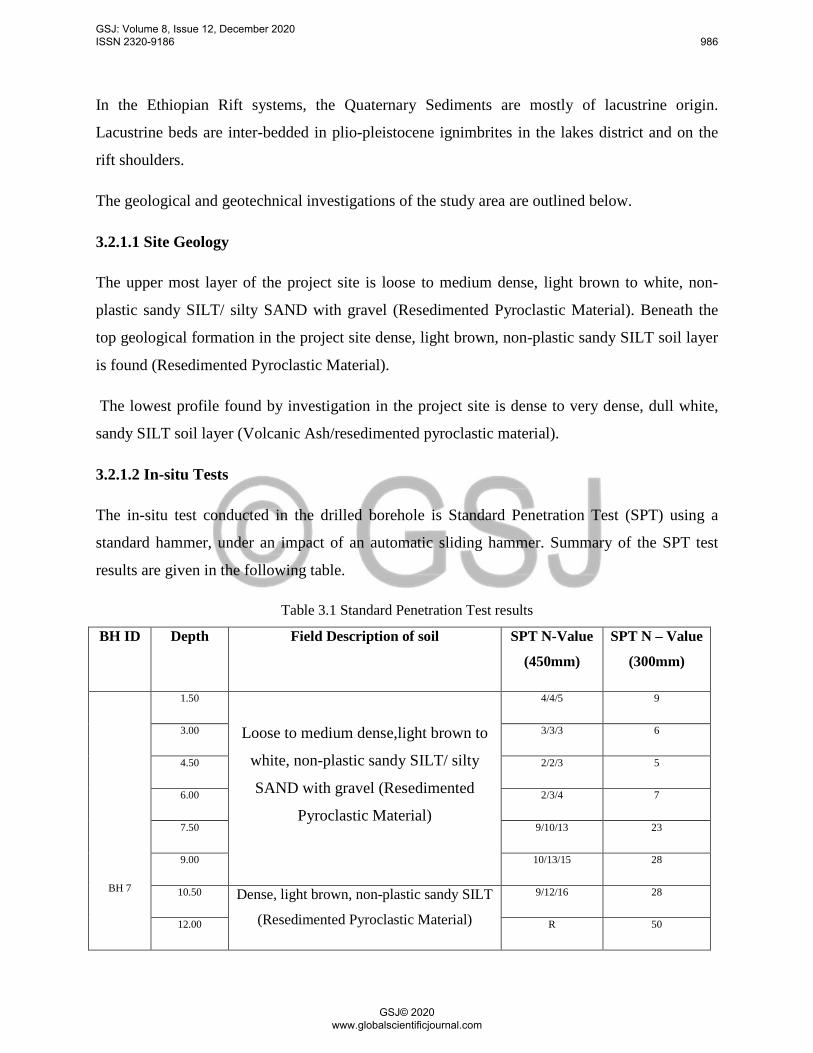
3.2.1.2 In-situ Tests
The in-situ test conducted in the drilled borehole is Standard Penetration Test (SPT) using a
standard hammer, under an impact of an automatic sliding hammer. Summary of the SPT test
results are given in the following table.
Table 3.1 Standard Penetration Test results
BH ID Depth Field Description of soil SPT N-Value
(450mm)
SPT N – Value
(300mm)
BH 7
1.50
Loose to medium dense,light brown to
white, non-plastic sandy SILT/ silty
SAND with gravel (Resedimented
Pyroclastic Material)
4/4/5 9
3.00 3/3/3 6
4.50 2/2/3 5
6.00 2/3/4 7
7.50 9/10/13 23
9.00 10/13/15 28
10.50 Dense, light brown, non-plastic sandy SILT
(Resedimented Pyroclastic Material)
9/12/16 28
12.00 R 50
GSJ: Volume 8, Issue 12, December 2020 ISSN 2320-9186 986
GSJ© 2020 www.globalscientificjournal.com

13.50 Dense to very dense, dull white, non-
plastic sandy SILT (volcanic
ash/Resedimented Pyroclastic Material)
18/21/R 50
15.00 R 50
16.50 13/17/19 36
18.00 17/21/R 50
3.2.1.3 Sampling
Representative soil samples were collected from soil investigation report. Results of Borehole ID
7 laboratory tests are presented below in table 3.2.
Table 3.2 Laboratory test results of soil samples Sample Depth(m) 3.50-4.00 6.50-7.00 9.50-10.00 13.50-14.00
Atterberg Limits
Liquid limit (%) NP NP NP NP
Plastic limit (%) NP NP NP NP
Plasticity index (%) NP NP NP NP
Specific Gravity
Gs 2.58 2.53 2.55 2.57
Particle size distribution
Gravel (%) 7 5 1 1
Sand (%) 52 49 48 45
Silt (%) 39 45 50 52
Clay (%) 2 3 1 2
Fine passing No. 200 (%) 41 49 51 54
Dry density and Moisture content
N.M.C (%) 1.12 3.41 9.61 6.12
GSJ: Volume 8, Issue 12, December 2020 ISSN 2320-9186 987
GSJ© 2020 www.globalscientificjournal.com
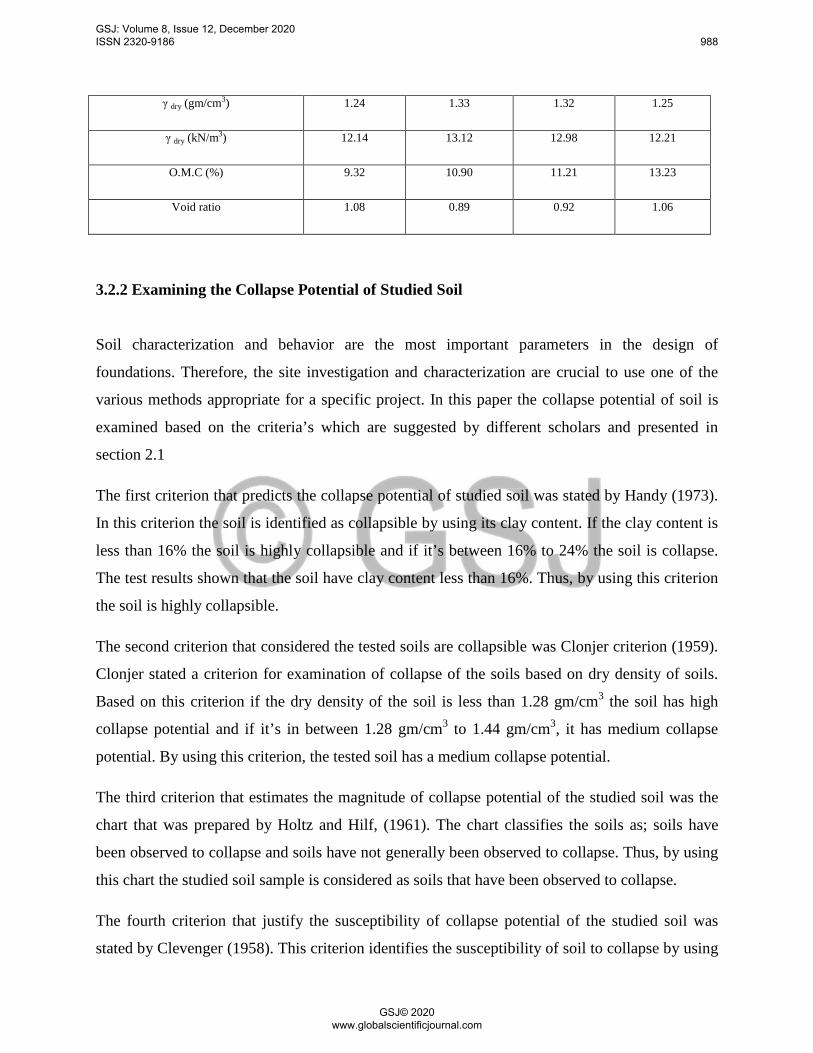
γ dry (gm/cm3) 1.24 1.33 1.32 1.25
γ dry (kN/m3) 12.14 13.12 12.98 12.21
O.M.C (%) 9.32 10.90 11.21 13.23
Void ratio 1.08 0.89 0.92 1.06
3.2.2 Examining the Collapse Potential of Studied Soil
Soil characterization and behavior are the most important parameters in the design of
foundations. Therefore, the site investigation and characterization are crucial to use one of the
various methods appropriate for a specific project. In this paper the collapse potential of soil is
examined based on the criteria’s which are suggested by different scholars and presented in
section 2.1
The first criterion that predicts the collapse potential of studied soil was stated by Handy (1973).
In this criterion the soil is identified as collapsible by using its clay content. If the clay content is
less than 16% the soil is highly collapsible and if it’s between 16% to 24% the soil is collapse.
The test results shown that the soil have clay content less than 16%. Thus, by using this criterion
the soil is highly collapsible.
The second criterion that considered the tested soils are collapsible was Clonjer criterion (1959).
Clonjer stated a criterion for examination of collapse of the soils based on dry density of soils.
Based on this criterion if the dry density of the soil is less than 1.28 gm/cm3 the soil has high
collapse potential and if it’s in between 1.28 gm/cm3 to 1.44 gm/cm3, it has medium collapse
potential. By using this criterion, the tested soil has a medium collapse potential.
The third criterion that estimates the magnitude of collapse potential of the studied soil was the
chart that was prepared by Holtz and Hilf, (1961). The chart classifies the soils as; soils have
been observed to collapse and soils have not generally been observed to collapse. Thus, by using
this chart the studied soil sample is considered as soils that have been observed to collapse.
The fourth criterion that justify the susceptibility of collapse potential of the studied soil was
stated by Clevenger (1958). This criterion identifies the susceptibility of soil to collapse by using
GSJ: Volume 8, Issue 12, December 2020 ISSN 2320-9186 988
GSJ© 2020 www.globalscientificjournal.com
the natural dry density and if the natural dry density is less than 12.6
kN/m3 the soil is liable to undergo significant settlement significant settlement will while if the
natural dry density is greater than 14.1 kN/m3 small settlement will be occur. Thus, as the test
results shown the soil is liable to undergo small settlement.
The fifth parameter that justify the studied soil sample has the potential to collapse is the chart
that is prepared by Moghadan et al. (2006). This chart uses the relations between dry unit weight
and percentage finer than 0.075mm (sieve no. 200) to evaluate the collapse potential of soils.
Thus, based on this chart the soil has moderate to high collapse potential.
Generally, most of the criteria that that are suggested by different scholars to predict the
susceptibility of collapse potential of the studied soil from moderate to high range.
3.3 Methods and Procedures
The Standard penetration test (SPT) is a common, simple and inexpensive in situ testing method
for defining subsurface materials. The data of which can be used for defining the geotechnical
properties of soils. When laboratory data is not available, it is common practice to correlate the
SPT values with many soil parameters. This research is based on the SPT data.
3.3.1 Corrections to SPT N Value
The most applicable correction method that accounts for the effect of energy delivered,
overburden stress and ground conditions is the standardized SPT corrections method.
The SPT values obtained during investigation shall be adjusted to N55 or N70 standard energy
ratio value using the following formula (Bowles, 1988).
N’S = CN*N*η1*η2*η3*η4
Where; N’S= Adjusted N (N55 or N70) ;
CN=adjustment for effective overburden pressure CN=𝑃𝑃𝑜𝑜``
𝑃𝑃𝑜𝑜` (kpa) = �95.76
𝑃𝑃𝑜𝑜`
N = SPT values (unadjusted) and
GSJ: Volume 8, Issue 12, December 2020 ISSN 2320-9186 989
GSJ© 2020 www.globalscientificjournal.com
ηi = Adjustment factors for energy ratio, rod length, sampler and borehole diameter
correction.
Another correction factor N60 also stated as per ASTM geotechnical engineering
N60 = 𝐶𝐶𝐸𝐸𝐶𝐶𝐵𝐵 𝐶𝐶𝑆𝑆𝐶𝐶𝑅𝑅
0.60
Where; N60= Corrected N values corresponding to 60% Energy Efficiency
That is, The Energy Ratio (ER) = 60%
CE, CB, CS and CR =are energy ratio, rod Length, sampling method and borehole diameter
correction factors.
Nmeasured = Raw SPT Value from Field Test
3.3.2 Mohr – Coulomb Model Parameters
The Mohr-Coulomb model idealizes the soil as elastic perfectly plastic material and has five
basic parameters.
The soil behavior before failure is computed by Hooke’s law of elasticity (defined by Young’s
modulus and Poisson’s ratio). The failure of soil is based on Mohr-Coulomb failure criteria
(defined by angle of internal friction and cohesion). The irreversible plastic strains that are
generated from shearing are computed using non-associated flow rule (defined by angle of
dilation).
3.3.3 Basic Adopted Parameters for Simulating in PLAXIS
• The modulus of elasticity (E) values is summarized in Joseph E. Bowles (1996) for
different types of soils based on N55 value.
Thus, for sandy silt soil, ES = 300(N+6)
Where the N value is estimated as N55.
• The angle of internal friction was mathematically approximated by Kulhawy and Mayne
(1990)
GSJ: Volume 8, Issue 12, December 2020 ISSN 2320-9186 990
GSJ© 2020 www.globalscientificjournal.com
φ= tan-1[N60/(12.2+20.3𝜎𝜎,
𝑃𝑃𝑎𝑎)]0.34
Where, 𝜎𝜎′ is the overburden pressure and Pa is the atmospheric pressure.
• Poisson`s ratio is assumed to be 0.3 and for cohesion.
Cu is correlated by N60 value presented by equation3.5. However, due to undrained condition
it assumed becomes zero.
Cu=0.06PaN60
• The value of angle of dilation for silty sands ψ depends on the angle of internal friction
and can be estimated as;
ψ = Ф - 30°, for Ф>300
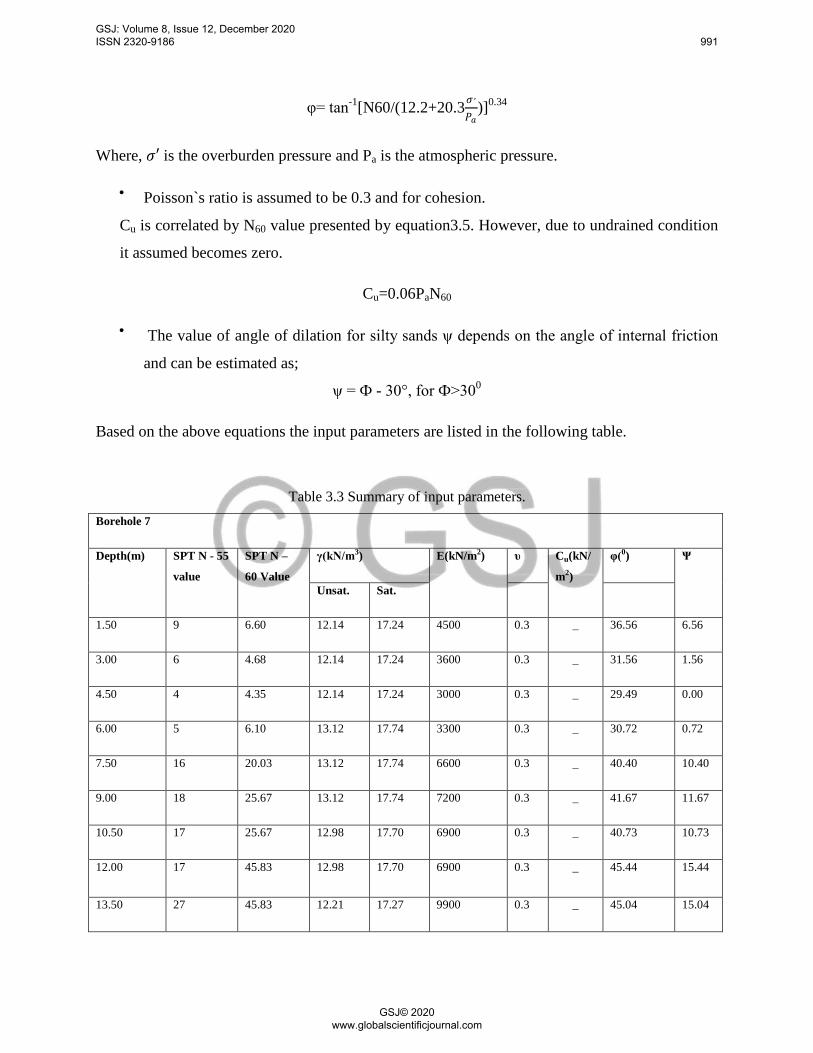
Based on the above equations the input parameters are listed in the following table.
Table 3.3 Summary of input parameters. Borehole 7
Depth(m) SPT N - 55
value
SPT N –
60 Value
γ(kN/m3) E(kN/m2) υ Cu(kN/
m2)
φ(0) Ψ
Unsat. Sat.
1.50 9 6.60 12.14 17.24 4500 0.3 _ 36.56 6.56
3.00 6 4.68 12.14 17.24 3600 0.3 _ 31.56 1.56
4.50 4 4.35 12.14 17.24 3000 0.3 _ 29.49 0.00
6.00 5 6.10 13.12 17.74 3300 0.3 _ 30.72 0.72
7.50 16 20.03 13.12 17.74 6600 0.3 _ 40.40 10.40
9.00 18 25.67 13.12 17.74 7200 0.3 _ 41.67 11.67
10.50 17 25.67 12.98 17.70 6900 0.3 _ 40.73 10.73
12.00 17 45.83 12.98 17.70 6900 0.3 _ 45.44 15.44
13.50 27 45.83 12.21 17.27 9900 0.3 _ 45.04 15.04
GSJ: Volume 8, Issue 12, December 2020 ISSN 2320-9186 991
GSJ© 2020 www.globalscientificjournal.com
15.00 18 45.83 12.21 17.27 7200 0.3 _ 44.27 14.27
16.50 18 33.00 12.21 17.27 7200 0.3 _ 40.39 10.39
18.00 14 45.83 12.21 17.27 6000 0.3 _ 42.91 12.91
Chapter Four
Model Validation
4.1 Introduction
As part of this thesis, validation of the finite element method was done by comparing with the
real-life situation or field recorded data to insure the model created is accurately modelled.
A full-scale load test reported by Iman Hossein Pour Babaei was used to validate the finite
modelling approach. Excess pore water pressures were measured by piezometers located at
depths of z = 3m, 6m, and 8m (shown in figure 4.1). The commercial finite element package
PLAXIS 3D (three dimensional FEA software) was used for the finite element modelling.
4.2 Measured and Computed Result
Measured and computed excess pore water pressure at the location of piezometers are presented
below to evaluate the degree of the accuracy of the FEM.
It can be seen that the numerical analysis predicted the measured excess pore water pressure
reasonably well, in particular the 3D model adequately simulated the maximum excess pore
pressures in the construction stages. It also shows the dissipation of excess pore pressure during
consolidation period.
GSJ: Volume 8, Issue 12, December 2020 ISSN 2320-9186 992
GSJ© 2020 www.globalscientificjournal.com

Figure 4.1 Embankment side column arrangement & instrumentation layout.
Figure 4.1 Measured and FEM computed excess pore water pressure at 3m depth.
02468
101214161820
0 50 100 150 200 250
Exce
ss p
ore
wat
er p
ress
ure(
kPa)
Time(days)
Model Validation PZ1
PZ 1 FEM
GSJ: Volume 8, Issue 12, December 2020 ISSN 2320-9186 993
GSJ© 2020 www.globalscientificjournal.com

Figure 4.2 Measured and FEM computed excess pore water pressure at 6m depth.
Figure 4.3 Measured and FEM computed excess pore water pressure at 8m depth.
Chapter Five
Analysis, Results and Discussions
5.1 Introduction
In this thesis, the elastic- perfectly plastic model of Mohr-Coulomb (MC) constitutive model
failure criterion was adopted. This model is chosen because many scholars suggest this model as
the best soil model to predict the realistic behaviour of structures, like embankment dams that are
05
101520253035404550
0 50 100 150 200 250
Exce
ss p
ore
wat
er p
ress
ure(
kPa)
Time (days)
Model Validation PZ 2PZ 2 FEM
0123456789
0 50 100 150 200 250
Exce
ss p
ore
wat
er p
ress
ure(
kPa)
Time(days)
Model Validation PZ 3
PZ 3 FEM
GSJ: Volume 8, Issue 12, December 2020 ISSN 2320-9186 994
GSJ© 2020 www.globalscientificjournal.com
imposed lower working load. Among those scholars (Zukri A. and Nazir R. (2018)), clearly
summarizes the numerical modelling techniques of soils improved by stone columns that has
done by many researchers. Moreover, input parameters for this model can be determined from
different test results (like SPT or CPT) using reasonable correlation formulas.
5.2 Finite Element Analysis
5.2.1 Materials and Parameters
The material properties of soil strata were taken from SPT results, and to minimize
computational time soils that have nearly the same properties are merged to a single layer as
shown in Table 5.1.
The properties of the stone column, geosynthetic material and embankment fill are taken from
the work of Iman Hossein Pour Babaei. The geosynthetic encasement was assumed to be
isotropic elastic material and its tensile stiffness Jenc =1750kN/m.
Table 5.1 Parameters for soil strata, embankment fill and stone column.
Material Embankment
Layer 1 (0-4.5m)
Layer 2 (4.5-10.5m)
Layer 3 (10.5-13.5m)
Layer 4 (13.5-18.0m)
Stone Column
Model Type Mohr-Coulomb (drained)
Mohr-Coulomb (undrained)
Mohr-Coulomb (undrained)
Mohr-Coulomb (undrained)
Mohr-Coulomb (undrained)
Mohr-Coulomb (drained)
γunSat(kN/m2) 24.0 12.14 13.12 12.98 12.21 18
γSat(kN/m2) 28.0 17.24 17.74 17.70 17.27 20
E’(kPa) 50000 3700 6000 6900 7575 80000
c’(kPa) 0.0 0.0 0.0 0.0 0.0 0.0
φ’(0) 38 32.54 38.28 43.10 43.15 38
υ'(-) 0.3 0.3 0.3 0.3 0.3 0.3
ψ(0) 8 2.54 8.28 13.10 13.15 8
5.2.2 Numerical Procedures
The embankment fill was built in four stages as shown in Table 5.2. The first three stage was
conducted in 2 days and allowed to consolidate for a time interval of 30 days. For the loading
type parameter, because the consolidation is for predefined period, staged construction is chosen.
Finally, the last stage was constructed for 2 days by utilizing minimum pore water pressure
option to assess the consolidation end time. Hence a total of 8 calculation phases are defined.
GSJ: Volume 8, Issue 12, December 2020 ISSN 2320-9186 995
GSJ© 2020 www.globalscientificjournal.com

Table 5.2 Phases for loading defined for numerical model. Calculation step Calculation type Loading type Embankment
height(m)
Time interval
(days)
Event
Initial phase Ko procedure - - Initial stress state
Phase_1 Consolidation Staged construction 1.5 2 Construction
Phase_2 Consolidation Staged construction 1.5 30 Consolidation
Phase_3 Consolidation Staged construction 3.0 2 Construction
Phase_4 Consolidation Staged construction 3.0 30 Consolidation
Phase_5 Consolidation Staged construction 4.0 2 Construction
Phase_6 Consolidation Staged construction 4.0 30 Consolidation
Phase_7 Consolidation Staged construction 5.0 2 Construction
Phase_8 Consolidation Minimum excess pore
pressure
5.0 - Consolidation
Because of the symmetry of the embankment, the right part of the embankment has been
considered as shown in figure 5.1. The position of the points of locations for FEM analysis can
be seen in Figure 5.1.
Figure 5.1 Mesh Connectivity and Points of location for FEM analysis.
5.3 Discussion
5.3.1 General
Three different models, by varying reinforcement type have been considered to analyze the effect
of consolidation end time, excess pore water dissipation and settlement with respect to time as
listed below.
GSJ: Volume 8, Issue 12, December 2020 ISSN 2320-9186 996
GSJ© 2020 www.globalscientificjournal.com
Model R (varying reinforcement type)
• MUnS: Unreinforced Soil
• MOSC: 9 Ordinary Stone Columns with a diameter of 1.0m, at 2.5m spacing and 10m
height
• MGESC: 9 Geosynthetic Encased Stone Columns with a diameter of 1.0m, at 2.5m
spacing and 10m height.
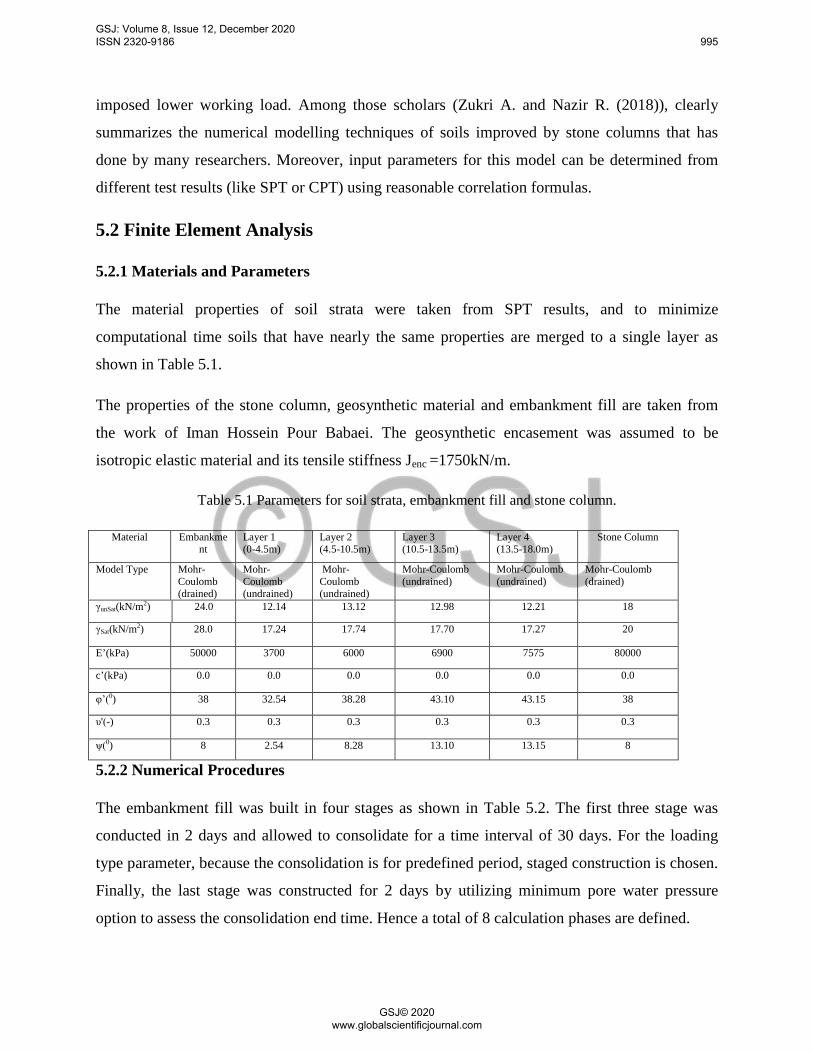
5.3.2 Consolidation End Time Analysis
Figure 5.2 shows the consolidation end time for unreinforced soil, ordinary stone columns and
geosynthetic encased stone columns beneath an embankment dam. It can be seen from the figure,
the geosynthetic encased stone column reduces the consolidation end time in comparison to the
unreinforced soil from 9719 days (approximately 26.6years) to 653days. Therefore, the
geosynthetic encased stone column has a substantial influence on reducing the consolidation end
time over the unreinforced soil and ordinary encased stone columns.
Figure 5.2 Consolidation end time of Model R.
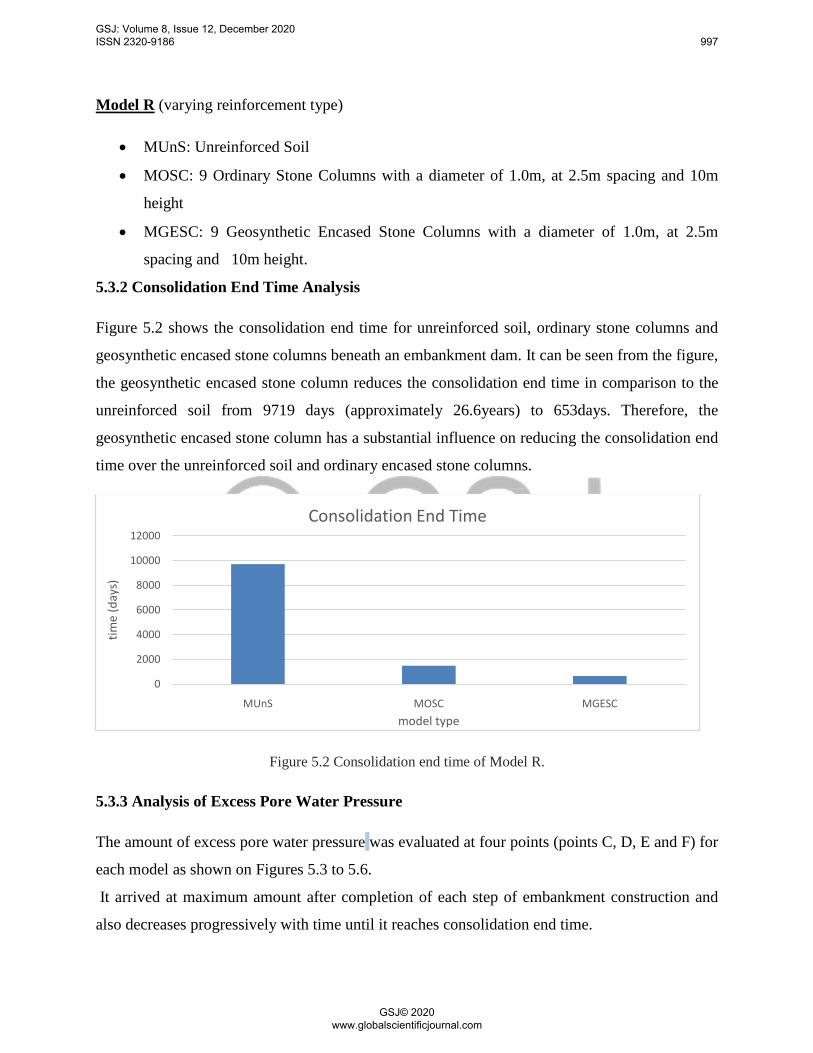
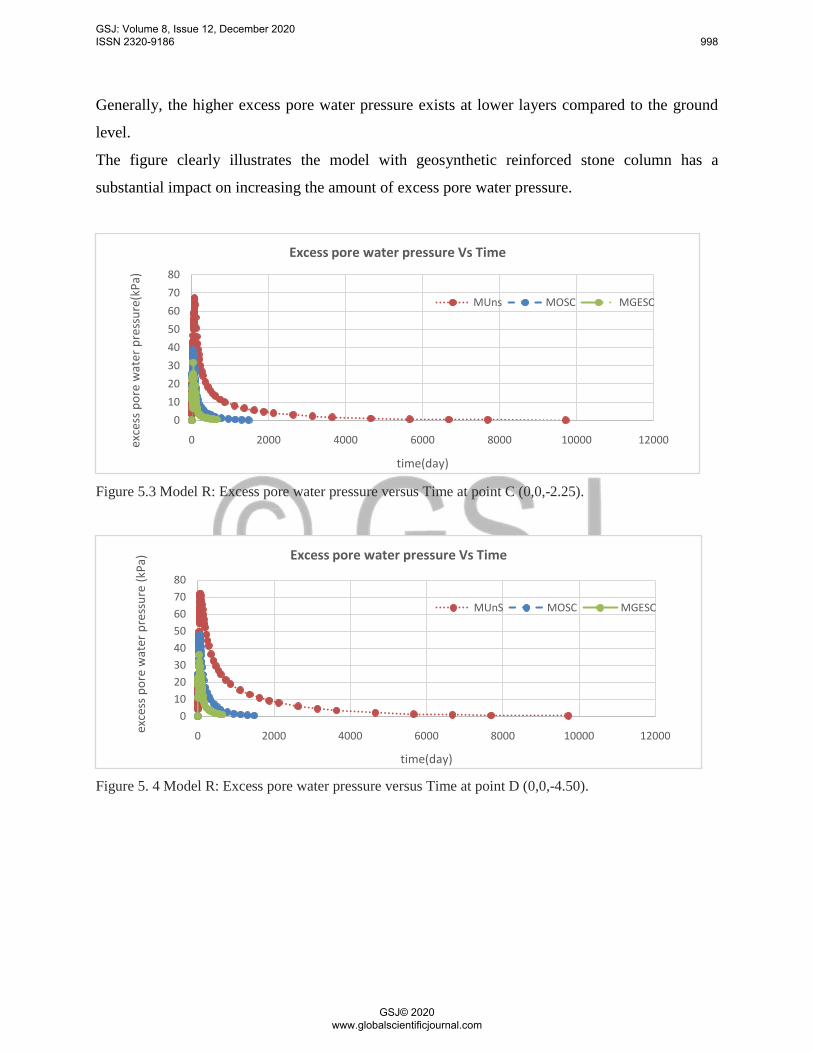
5.3.3 Analysis of Excess Pore Water Pressure
The amount of excess pore water pressure was evaluated at four points (points C, D, E and F) for
each model as shown on Figures 5.3 to 5.6.
It arrived at maximum amount after completion of each step of embankment construction and
also decreases progressively with time until it reaches consolidation end time.
0
2000
4000
6000
8000
10000
12000
MUnS MOSC MGESC
time
(day
s)
model type
Consolidation End Time
GSJ: Volume 8, Issue 12, December 2020 ISSN 2320-9186 997
GSJ© 2020 www.globalscientificjournal.com
Generally, the higher excess pore water pressure exists at lower layers compared to the ground
level.
The figure clearly illustrates the model with geosynthetic reinforced stone column has a
substantial impact on increasing the amount of excess pore water pressure.
Figure 5.3 Model R: Excess pore water pressure versus Time at point C (0,0,-2.25).
Figure 5. 4 Model R: Excess pore water pressure versus Time at point D (0,0,-4.50).
01020304050607080
0 2000 4000 6000 8000 10000 12000exce
ss p
ore
wat
er p
ress
ure(
kPa)
time(day)
Excess pore water pressure Vs Time
MUns MOSC MGESC
01020304050607080
0 2000 4000 6000 8000 10000 12000exce
ss p
ore
wat
er p
ress
ure
(kPa
)
time(day)
Excess pore water pressure Vs Time
MUnS MOSC MGESC
GSJ: Volume 8, Issue 12, December 2020 ISSN 2320-9186 998
GSJ© 2020 www.globalscientificjournal.com
Figure 5.5 Model R: Excess pore water pressure versus Time at point D (0,0,-10.5).
Figure 5.6 Model R: Excess pore water pressure versus Time at point E (0,0,-13).
5.3.4 Settlement Analysis with respect to Time
Settlement versus time relationships at three points (points A, H and I) for unreinforced, OSC
and GESC treated soils were analyzed at the consolidation end time (shown on figures 5.7 to
5.9).
Among the selected points the maximum settlement occurred at point A, the middle of the
embankment dam, while the settlement at point I shows heaving (swelling) effect.
0
10
20
30
40
50
60
0 2000 4000 6000 8000 10000 12000
exce
ss p
ore
wat
er p
ress
ure
(kPa
)
time (day)
Excess pore water pressure Vs Time
MUnS MOSC
MGESC
0
10
20
30
40
50
60
0 2000 4000 6000 8000 10000 12000
exce
ss p
ore
wat
er p
ress
ure
(kPa
)
time (day)
Excess pore water pressure Vs Time
MUnS MOSC MGESC
GSJ: Volume 8, Issue 12, December 2020 ISSN 2320-9186 999
GSJ© 2020 www.globalscientificjournal.com

The great benefit of using geosynthetic encased stone column can be seen from these models.
The results obtained from these figures indicates that, the unreinforced soil has maximum
settlement, which is 338mm and this amount decreased to 257mm for soils treated by GESC.
Figure 5.7 Model R: Settlement versus Time at point A (0,0,5)
Figure 5.8 Model R: Settlement versus Time at point H (6,0,5)
-0.40
-0.35
-0.30
-0.25
-0.20
-0.15
-0.10
-0.05
0.00
0 2000 4000 6000 8000 10000 12000
sett
lem
ent(
m)
time(day)
Settlement Vs Time
MUnS MOSC MGESC
-0.35
-0.30
-0.25
-0.20
-0.15
-0.10
-0.05
0.00
0 2000 4000 6000 8000 10000 12000
Sett
lem
ent(
m)
time(days)
Settlement Vs Time
MUnS MOSC MGESC
GSJ: Volume 8, Issue 12, December 2020 ISSN 2320-9186 1000
GSJ© 2020 www.globalscientificjournal.com
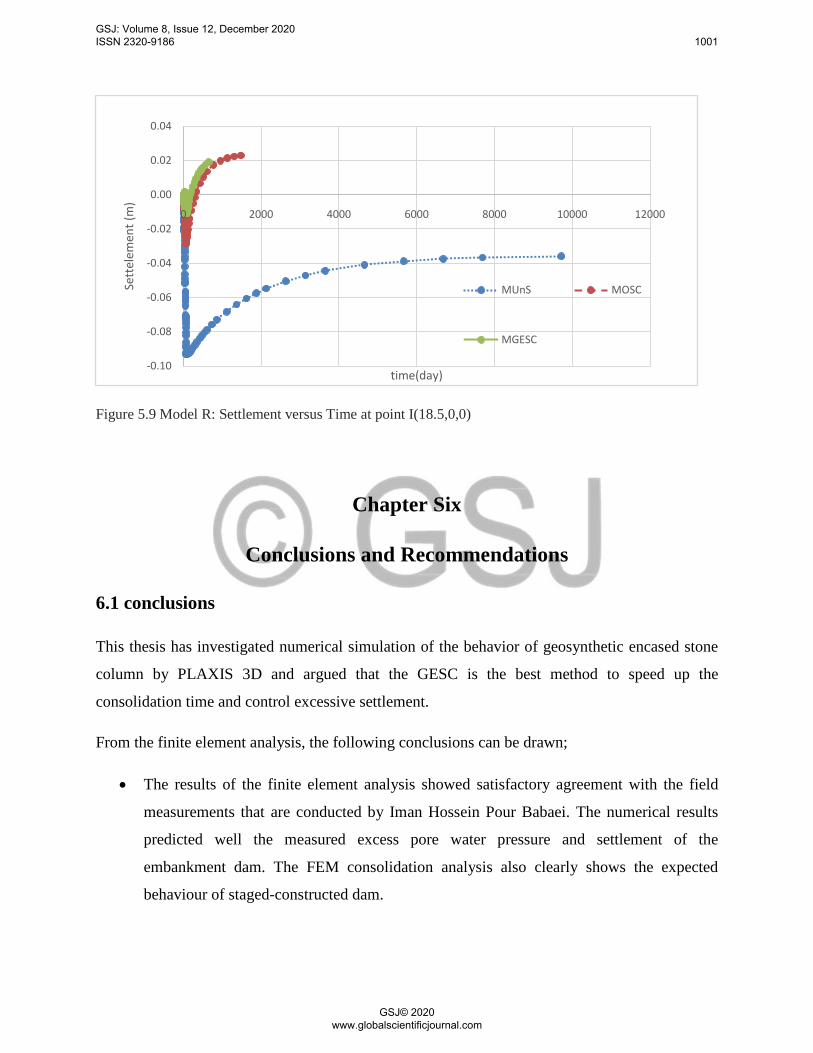
Figure 5.9 Model R: Settlement versus Time at point I(18.5,0,0)
Chapter Six
Conclusions and Recommendations
6.1 conclusions
This thesis has investigated numerical simulation of the behavior of geosynthetic encased stone
column by PLAXIS 3D and argued that the GESC is the best method to speed up the
consolidation time and control excessive settlement.
From the finite element analysis, the following conclusions can be drawn;
• The results of the finite element analysis showed satisfactory agreement with the field
measurements that are conducted by Iman Hossein Pour Babaei. The numerical results
predicted well the measured excess pore water pressure and settlement of the
embankment dam. The FEM consolidation analysis also clearly shows the expected
behaviour of staged-constructed dam.
-0.10
-0.08
-0.06
-0.04
-0.02
0.00
0.02
0.04
0 2000 4000 6000 8000 10000 12000
Sett
elem
ent (
m)
time(day)
MUnS MOSC
MGESC
GSJ: Volume 8, Issue 12, December 2020 ISSN 2320-9186 1001
GSJ© 2020 www.globalscientificjournal.com

• The GESC has a substantial influence over OSC in reducing the consolidation end time
and settlement. It speeds up the consolidation end time by 55.86% and decreases the
settlement by 12.29%.
6.2 Recommendations
This research has investigated the behaviour of geosynthetic encased stone column in collapsible
soil numerically. It is believed that the present research will be a good commencement for our
country to conduct more studies on this topic.
Hence, there are areas in which further study of GESC can be carried out to improve further the
understanding of this ground improvement technique.
Areas for future research include:
• Experimental and analytical study under cyclic loading on the behaviour of stone
columns in collapsible soils.
• The study of slope stability problem for embankment dam that is supported by GESC.
Even if settlement and consolidation time are the primary concern for stone column
reinforced ground, slope stability is also an important case and need to be studied
specially when slip surface develops underneath the column toe.
• Evaluation of parametric study on using GESC such as column diameter, length, spacing.
column length to diameter ratio, spacing to diameter ratio, area replacement ratio and
other parameters.
• The study in response to bulging effect of the GESC in relation to the geotextile stiffness,
column height and diameter.
References
GSJ: Volume 8, Issue 12, December 2020 ISSN 2320-9186 1002
GSJ© 2020 www.globalscientificjournal.com
Ali, K., Sgahu, J. T., & Sharma, K. G., “Behavior of reinforced stone columns in soft soils: an
experimental study,” In Indian Geotechnical Conference, Geotrendz, IGS Mumbai Chapter &
IIT,2010, Bombay, pp. 620–628.
Al-Obaidy, N. K., “Full scale tests on stone piles,” M. Sc thesis, University of Baghdad,
Baghdad, Iraq, 2000.
Ambily, A. P., & Gandhi, S. R., “Behavior of stone columns based on experimental and FEM
analysis,” Journal of Geotechnical and Environment Engineering, 2007, v.133(4), pp 405–415.
Ayadat, T., & Hanna, A. M., “Encapsulated stone columns as a soil improvement technique for
collapsible soil,” Ground Improvement, 2005, v. 9(4), pp.137–147.
Balaam, N. P., & Booker, J. R., Analysis of rigid rafts supported by granular piles. International
Journal for Numerical and Analytical Methods in Geomechanics, 1981, v 5(4), pp.379–403.
Beckwith, G., “Foundation Design Practices for Collapsing Soils in the Western United States in
Unsaturated Soils,” In Proc. of the First Int’l. Conference on Unsaturated Soils. Paris, (edited by
E.E.Alonso and P. Delage). Balkema Press, 1995, v.2, pp 6-8.
Clevenger, W. A., ‘‘Experiences with loess as foundation materials,’’ Journal of Soil Mechanics
and Foundation Division, 1956, v. 82(3), 1025–1025–26.
Das, B. M., Principles of foundation engineering, PWS publishing company, Boston, MA,2007.
Demir, A., & Sarici, T., “Bearing capacity and bulging behaviour of geogrid encased stone
columns,” Selcuk University Journal of Engineering Science and Technology,2016, v. 4(2), pp.
131–143.
Denisov, N. Y., “The engineering properties of loess and loess loams, Gosstroiizdat, Moscow,”
1951.
Elsway, M., Lesny, K., & Richwien, W. (2010). Performance of geogrid-encased stone columns
as a reinforcement of soft ground. Numerical Methods in Geotechnical Engineering, Vol. 26, p.
875-880.
Guetif, T., Bouassida, M., and Debats, J. M. (2007). “Improved soft clay characteristics due to
stone column installation.” Comput. Geotech, 2007.
GSJ: Volume 8, Issue 12, December 2020 ISSN 2320-9186 1003
GSJ© 2020 www.globalscientificjournal.com
Handy, R. L. (1973). ‘‘Collasible loess in Iowa.’’ Proceedings, Soil Science Society of America,
37,281–284.
Hughes, J. M. O., & Withers, N. J, “Reinforcing of soft cohesive soils with stone columns,”
Ground Engineering, 1974, v. 1(3), pp. 42–49.
Keykhosropur, L., Soroush, A. & Imam, R. (2012). 3D numerical analysis of geosynthetic
encased stone columns. Geotextiles and Geomembranes, 35, 61-68.
Khaled E. Gaaver, “Geotechnical Properties of Egyptian Collapsible Soils,” Alexandria
Engineering Journal,2012, v.12. pp. 205-210.
Lo, S. R. Zhang, R. and Mak, J. 2010, GeosyntheticEncased Stone Columns in Soft Clay: A
Numerical Study, Geotextiles and Geomembranes, 28: 292-302.
Murugesan, S., & Rajagopal, K., “Experimental and numerical investigations on the behavior of
geosynthetic encased stone columns,” IGC, 2009, pp 480–484.
Priklonski, V. A. (1952). Gruntoedenia-Vtroarid Chast, Gosgeolzdat, Moscow.
Sondermann, W., & Wehr, W., “Deep vibro technique,” In M. P. Moseley & K. Kirsch (Eds.),
“Ground Improvement,” 2nd ed., London and New York: Taylor & Francis Group, 2004, pp. 57
– 92.
Tandel, Y. K., Solanki, C. H., & Desai, A. K., “Laboratory experimental analysis on
encapsulated stone column,” Archives of Civil Engineering, 2013, LIX (3), 359–379.
Zhang, L., & Zhao, M.,” Deformation Analysis of Geotextile-Encased Stone Columns,” Int.J.
Geomech, 2015, v. 15(3), pp. 1–10.
Zukri A. and Nazir R., “Numerical modelling techniques of soft soil improvement via stone
columns,” A brief review 2018 IOP Conf. Ser.: Mater. Sci. Eng. 342, 2018.
Zur, A. and Wiseman, G., “A Study of Collapse Phenomena of an Undisturbed Loess”,
Proceeding of 8th ICSMFE, Moscow, 1973, Vol. 2, pp.265-269.
GSJ: Volume 8, Issue 12, December 2020 ISSN 2320-9186 1004
GSJ© 2020 www.globalscientificjournal.com