The Basics of Flow Cytometry - Biozentrum · The Basics of Flow Cytometry Janine Bögli,...
73
The Basics of Flow Cytometry Janine Bögli, Biozentrum, 29. January 2018 C ore F ACS F acility
Transcript of The Basics of Flow Cytometry - Biozentrum · The Basics of Flow Cytometry Janine Bögli,...

The Basics of Flow Cytometry
Janine Bögli, Biozentrum, 29. January 2018C ore
F ACS
F acility
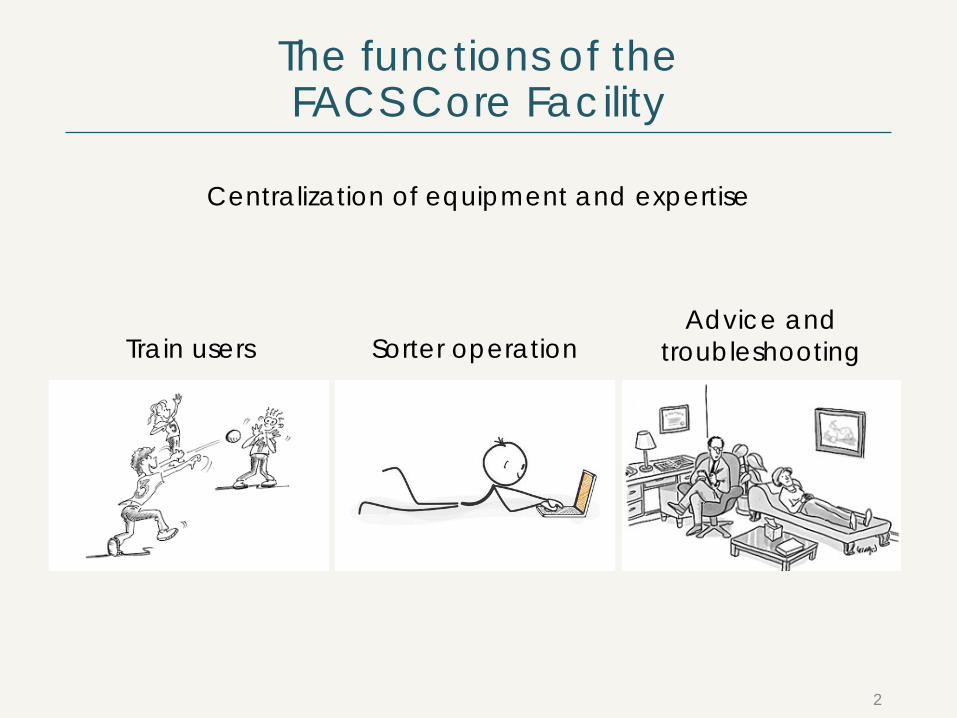
The functions of theFACS Core Facility
Centralization of equipment and expertise
Sorter operationAdvice and
troubleshootingTrain users
2
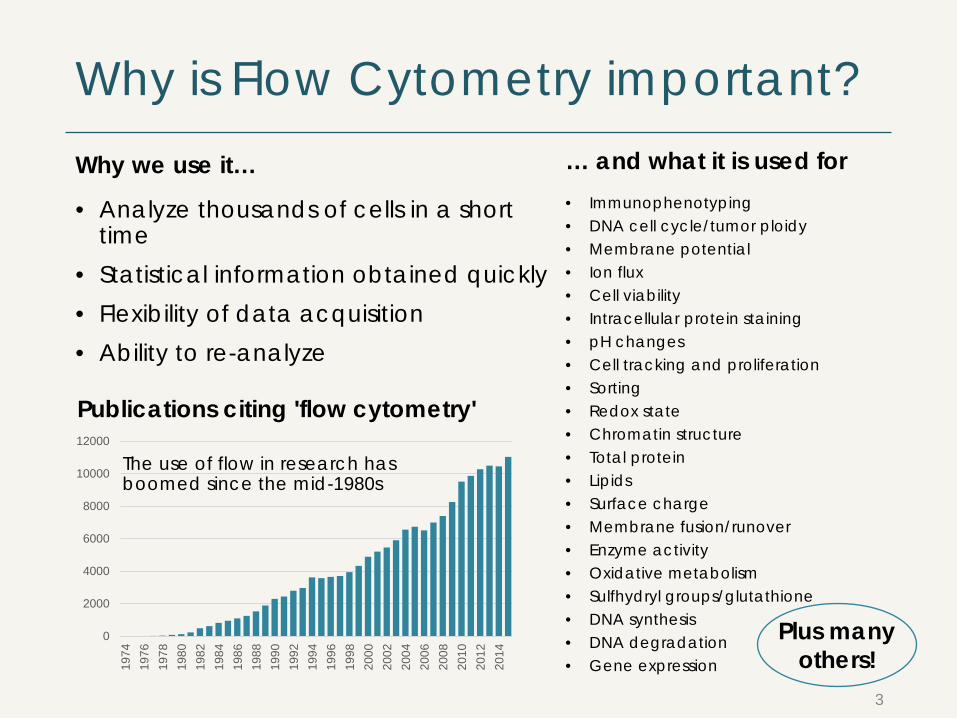
Why is Flow Cytometry important?… and what it is used for• Immunophenotyping• DNA cell cycle/tumor ploidy• Membrane potential• Ion flux• Cell viability• Intracellular protein staining• pH changes• Cell tracking and proliferation• Sorting• Redox state• Chromatin structure• Total protein• Lipids• Surface charge• Membrane fusion/runover• Enzyme activity• Oxidative metabolism• Sulfhydryl groups/glutathione• DNA synthesis• DNA degradation• Gene expression
• Analyze thousands of cells in a short time
• Statistical information obtained quickly• Flexibility of data acquisition• Ability to re-analyze
3
Publications citing 'flow cytometry'
0
2000
4000
6000
8000
10000
12000
1974
1976
1978
1980
1982
1984
1986
1988
1990
1992
1994
1996
1998
2000
2002
2004
2006
2008
2010
2012
2014
The use of flow in research has boomed since the mid-1980s
Why we use it…
Plus manyothers!

Overview
• What is Flow Cytometry• Fluorescence• The basics of a flow cytometer
• Fluidics• Optics• Electronics
• Data analysis• How does flow cytometry data look like• Gating
• Applications
4
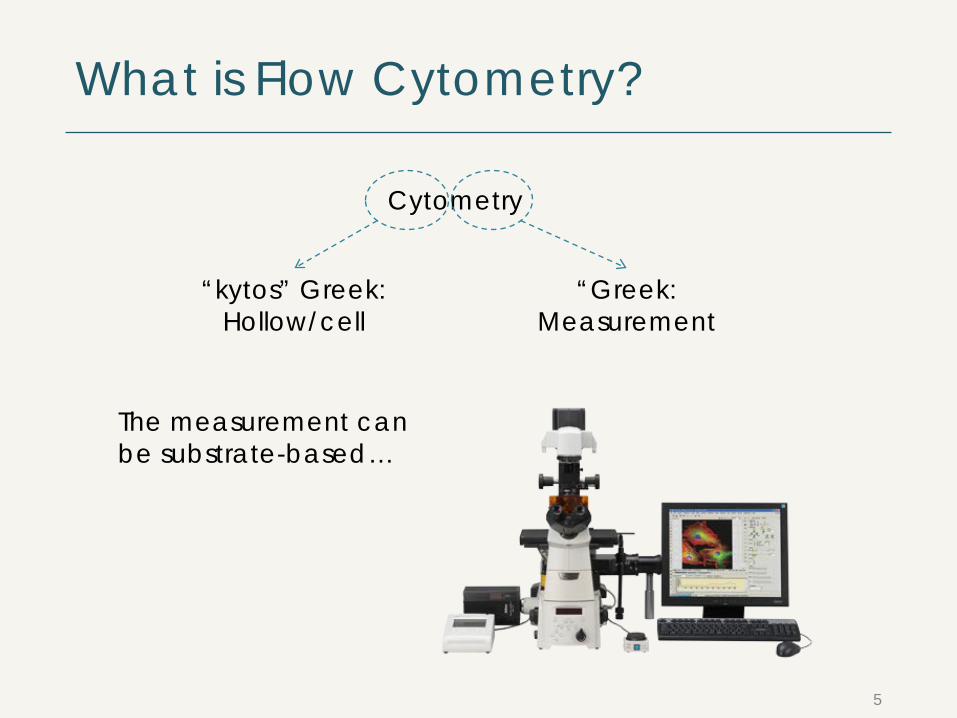
What is Flow Cytometry?
Cytometry
“kytos” Greek: Hollow/cell
“Greek: Measurement
5
The measurement canbe substrate-based…
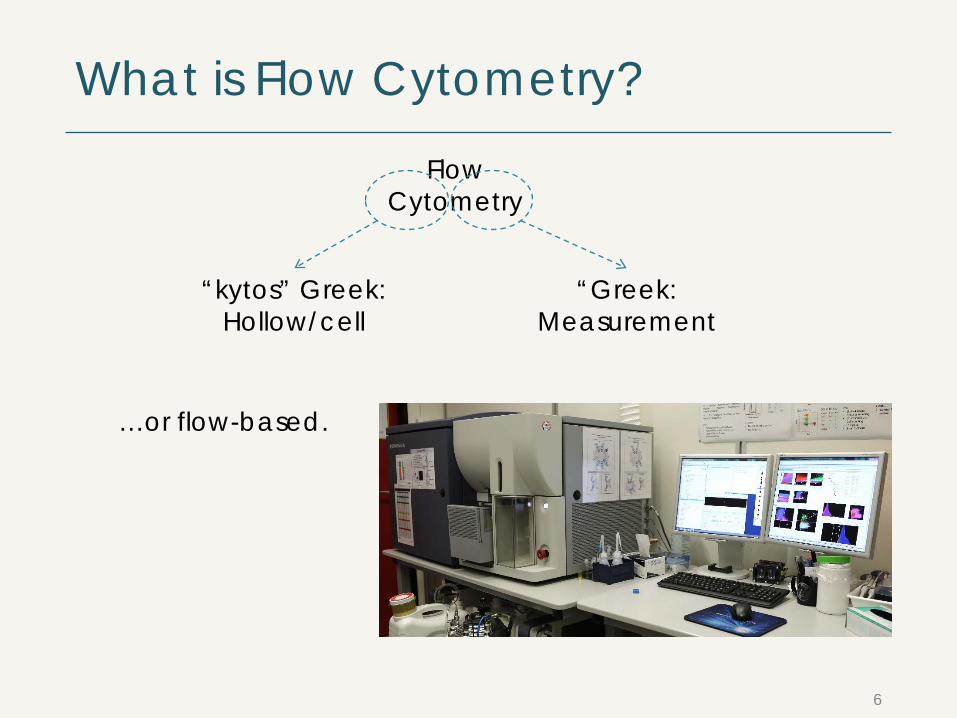
What is Flow Cytometry?
6
…or flow-based.
FlowCytometry
“kytos” Greek: Hollow/cell
“Greek: Measurement
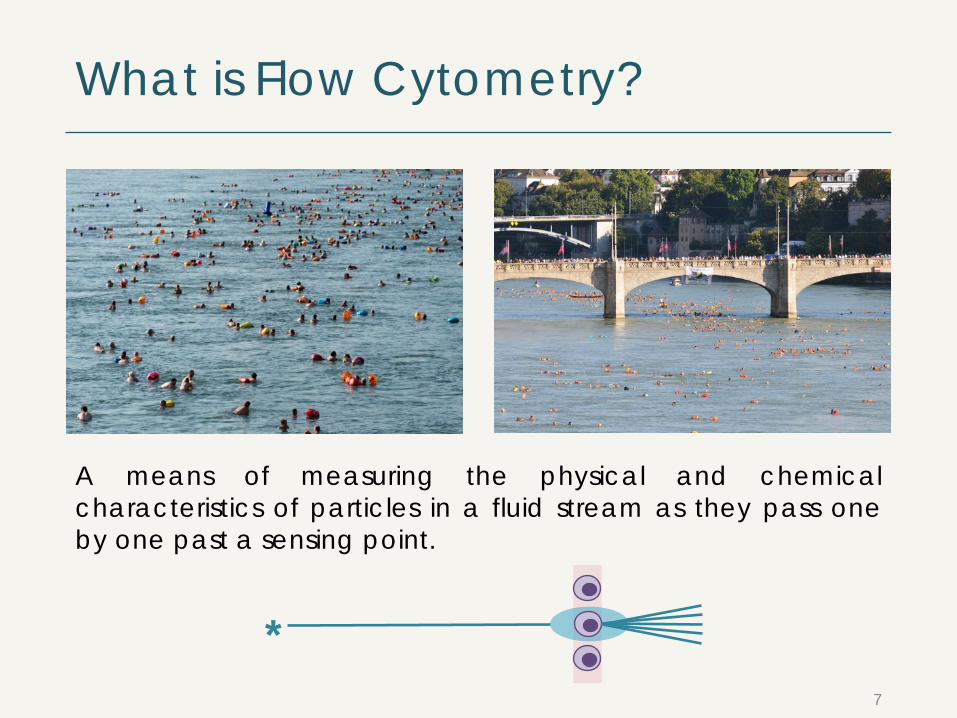
What is Flow Cytometry?
A means of measuring the physical and chemicalcharacteristics of particles in a fluid stream as they pass oneby one past a sensing point.
7
*

What can Flow Cytometry do?
Analyze light signals to:• Enumerate particles in suspension• Evaluate 105 to 106 particles in less than 1 min• Detection of rare cell populations• Measure multiple parameters• Sort single particles for subsequent analysis
8
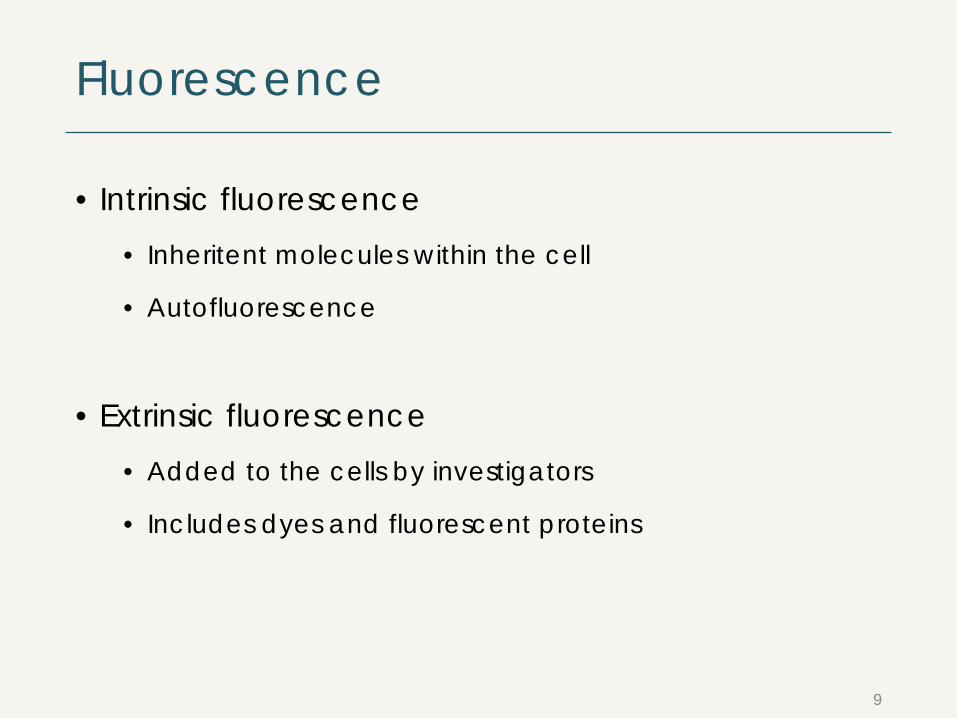
Fluorescence
• Intrinsic fluorescence• Inheritent molecules within the cell
• Autofluorescence
• Extrinsic fluorescence• Added to the cells by investigators
• Includes dyes and fluorescent proteins
9
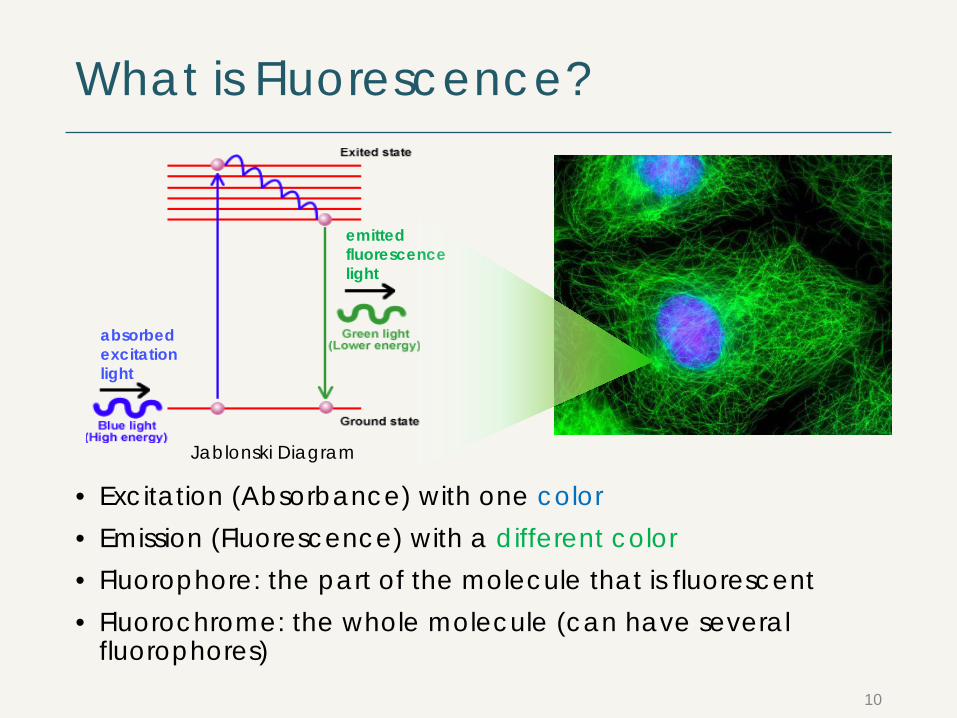
What is Fluorescence?
• Excitation (Absorbance) with one color• Emission (Fluorescence) with a different color• Fluorophore: the part of the molecule that is fluorescent• Fluorochrome: the whole molecule (can have several
fluorophores)10
absorbedexcitationlight
emittedfluorescencelight
Jablonski Diagram
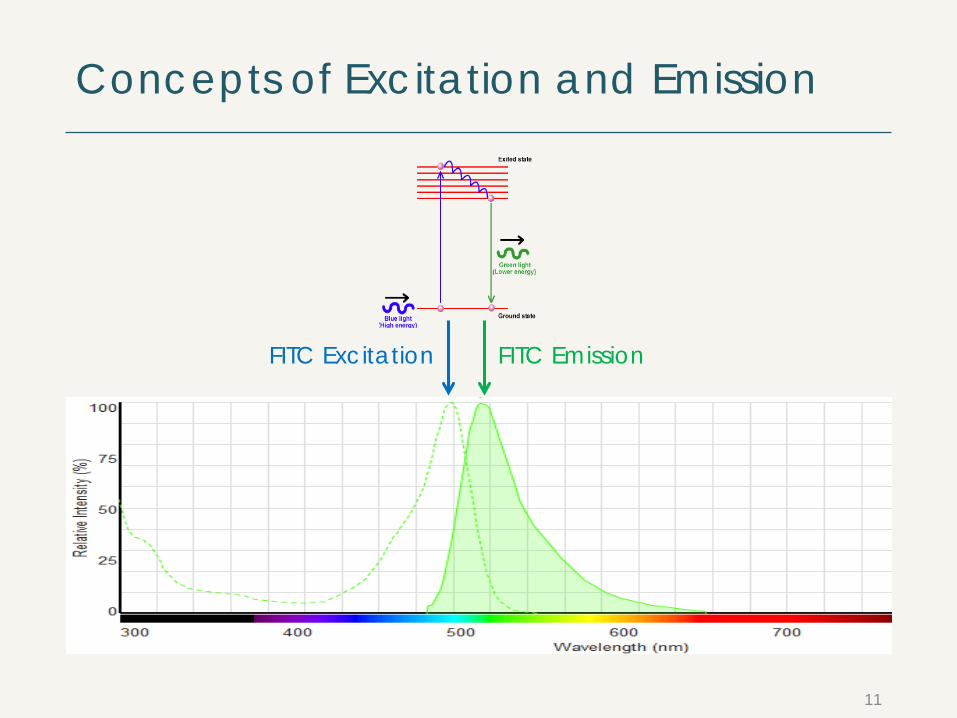
Concepts of Excitation and Emission
FITC EmissionFITC Excitation
11
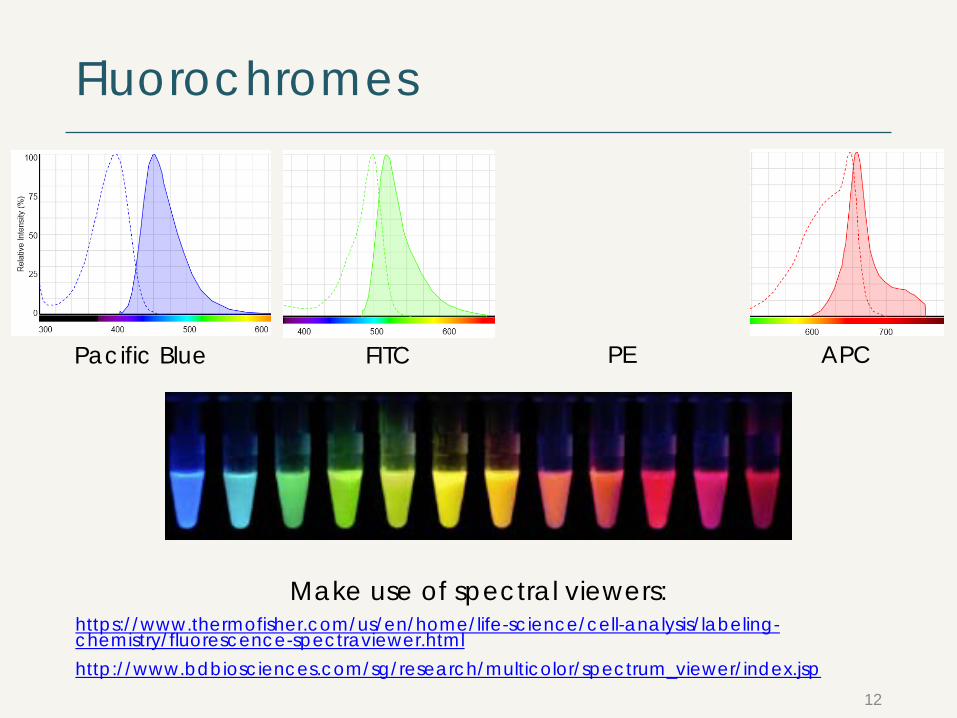
Fluorochromes
12
Pacific Blue FITC PE APC
Make use of spectral viewers:https://www.thermofisher.com/us/en/home/life-science/cell-analysis/labeling-chemistry/fluorescence-spectraviewer.htmlhttp://www.bdbiosciences.com/sg/research/multicolor/spectrum_viewer/index.jsp
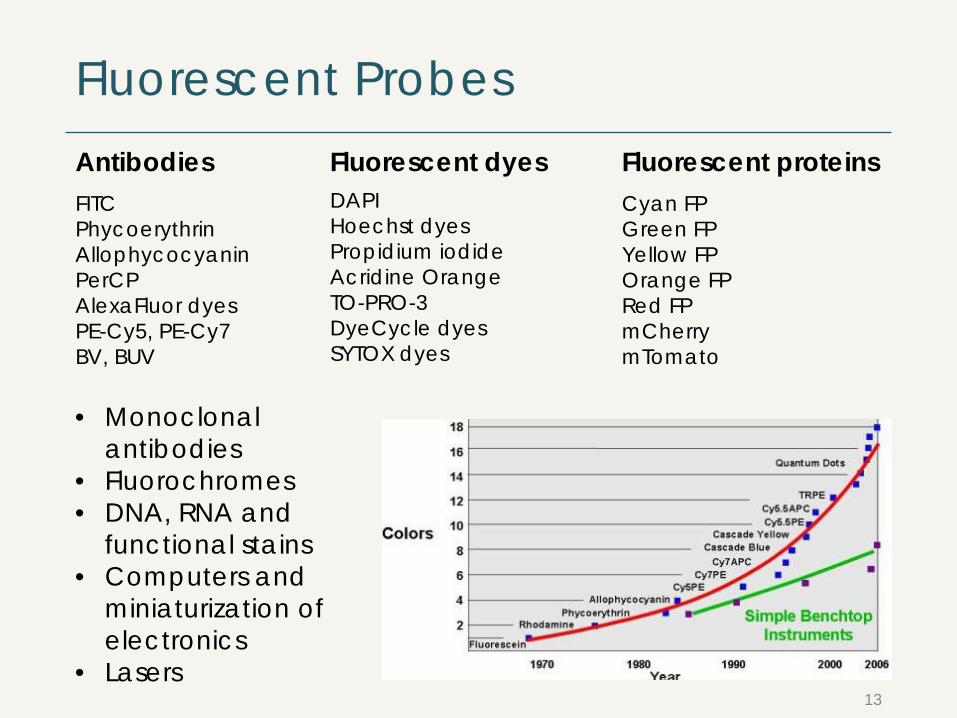
Fluorescent Probes
Cyan FPGreen FPYellow FPOrange FPRed FPmCherrymTomato
FITCPhycoerythrinAllophycocyaninPerCPAlexaFluor dyesPE-Cy5, PE-Cy7BV, BUV
DAPIHoechst dyesPropidium iodideAcridine OrangeTO-PRO-3DyeCycle dyesSYTOX dyes
Antibodies Fluorescent dyes Fluorescent proteins
13
• Monoclonalantibodies
• Fluorochromes• DNA, RNA and
functional stains• Computers and
miniaturization ofelectronics
• Lasers
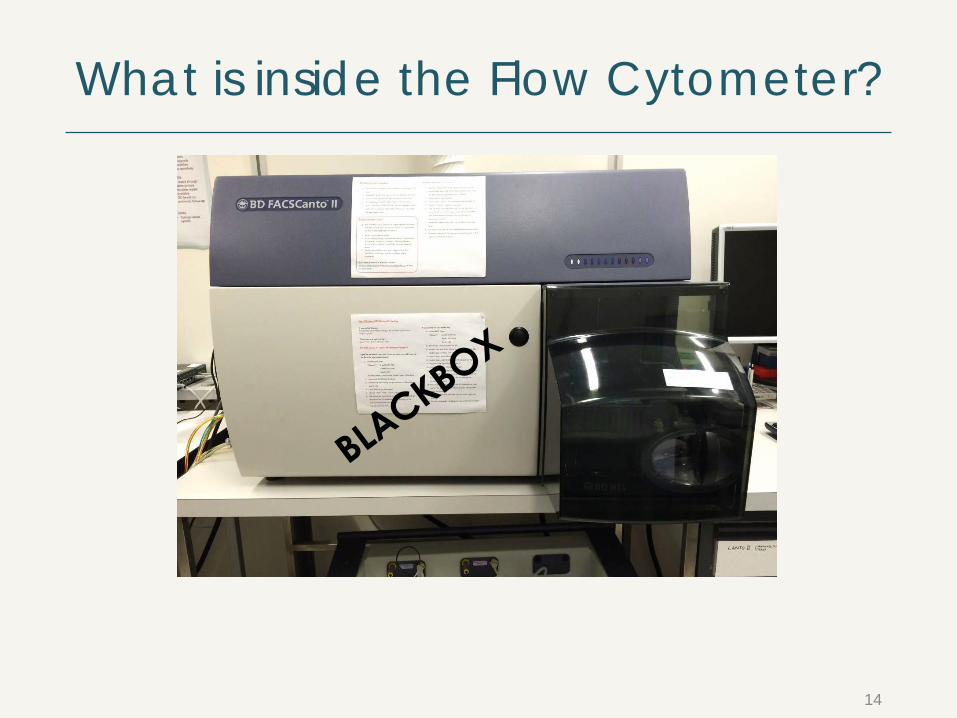
What is inside the Flow Cytometer?
14
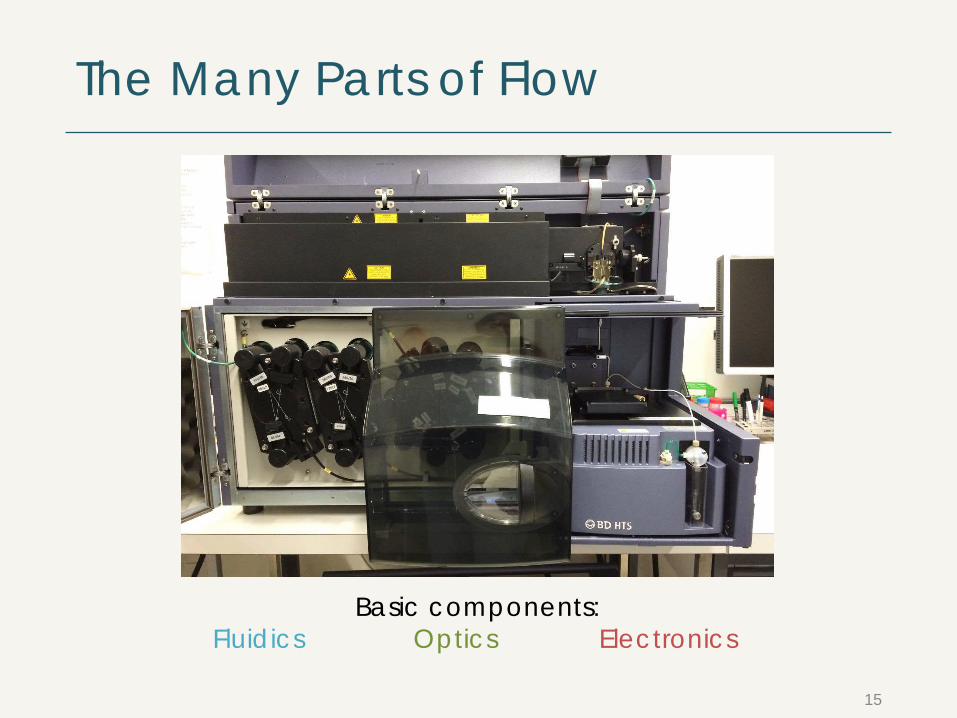
The Many Parts of Flow
Basic components:Fluidics Optics Electronics
15
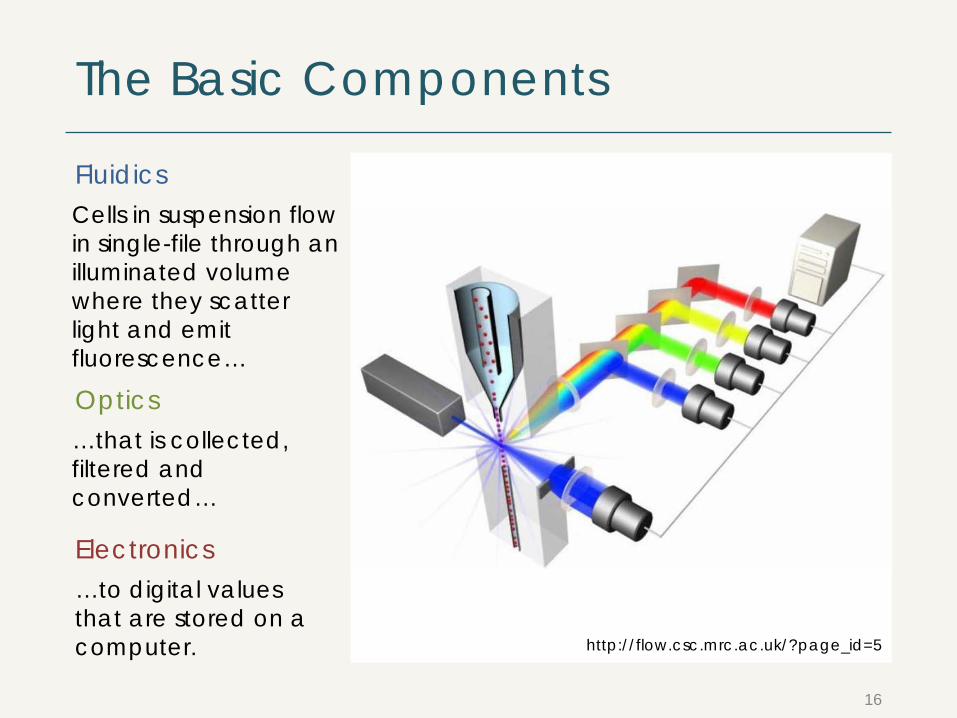
The Basic Components
16
…that is collected,filtered andconverted…
Cells in suspension flow in single-file through an illuminated volume where they scatter light and emit fluorescence…
http://flow.csc.mrc.ac.uk/?page_id=5
Optics
Electronics
Fluidics
…to digital values that are stored on a computer.
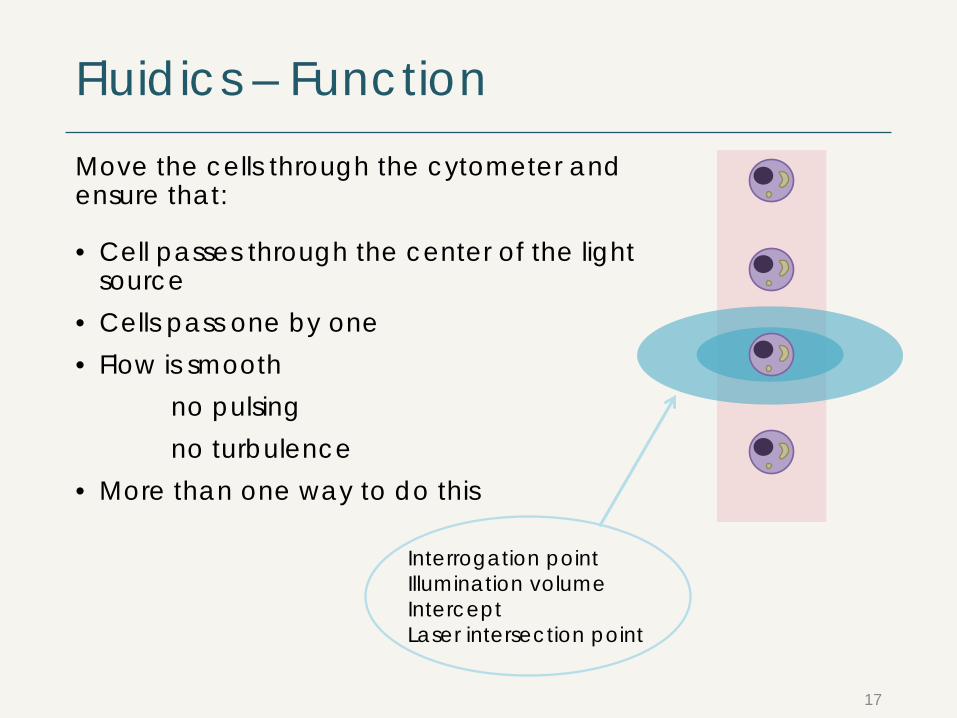
Fluidics – Function Move the cells through the cytometer and ensure that:
• Cell passes through the center of the light source
• Cells pass one by one• Flow is smooth
no pulsingno turbulence
• More than one way to do this
17
Interrogation pointIllumination volumeInterceptLaser intersection point
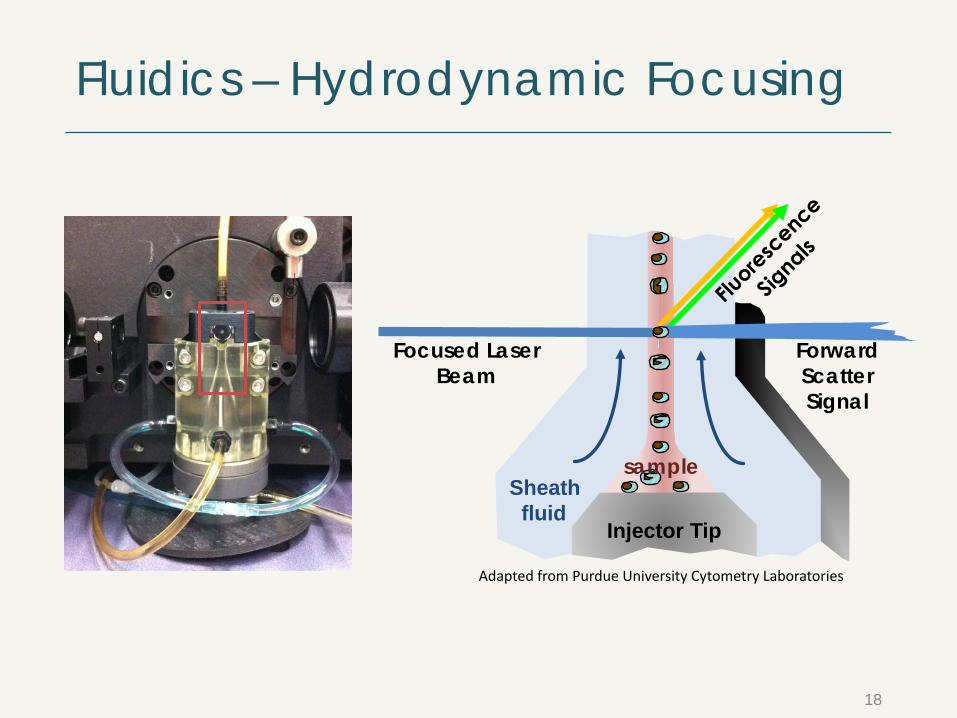
Fluidics – Hydrodynamic Focusing
Adapted from Purdue University Cytometry Laboratories
Sheathfluid
Injector Tip
sample
Focused Laser Beam
Forward ScatterSignal
18
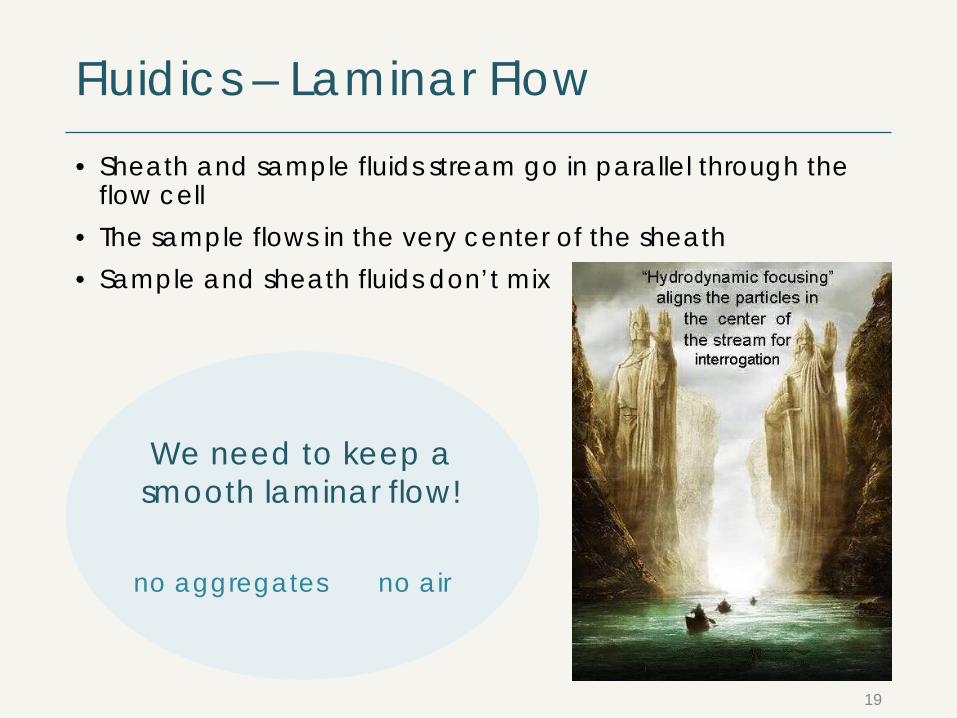
Fluidics – Laminar Flow • Sheath and sample fluids stream go in parallel through the
flow cell • The sample flows in the very center of the sheath• Sample and sheath fluids don’t mix
19
We need to keep a smooth laminar flow!
no airno aggregates
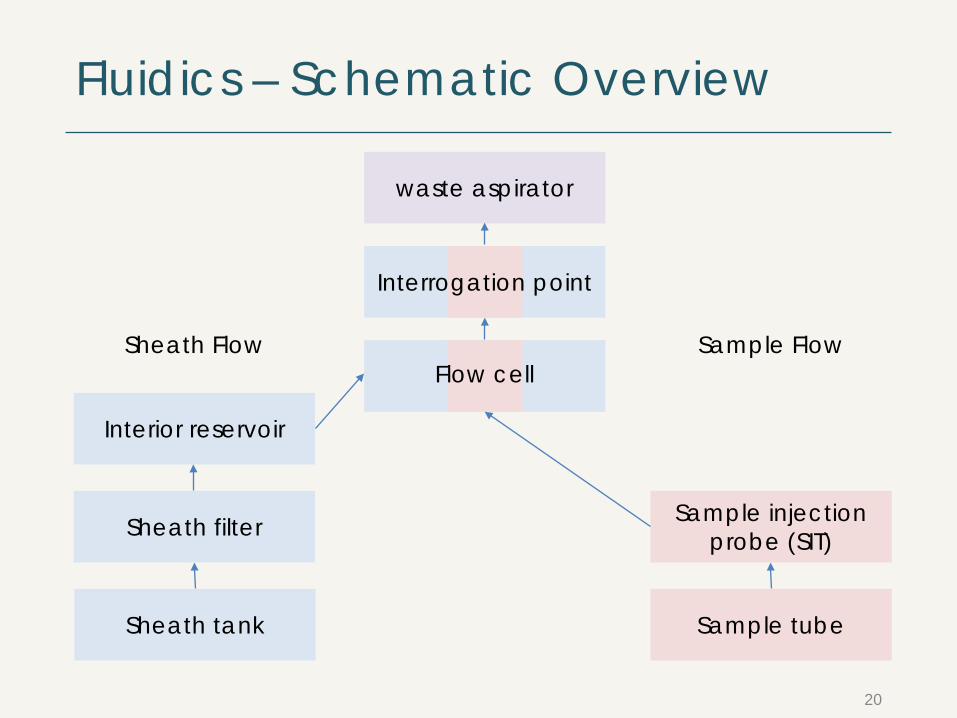
Fluidics – Schematic Overview
20
Sample injectionprobe (SIT)
Interrogation point
Flow cell
waste aspirator
Interior reservoir
Sample tube
Sample FlowSheath Flow
Sheath filter
Sheath tank
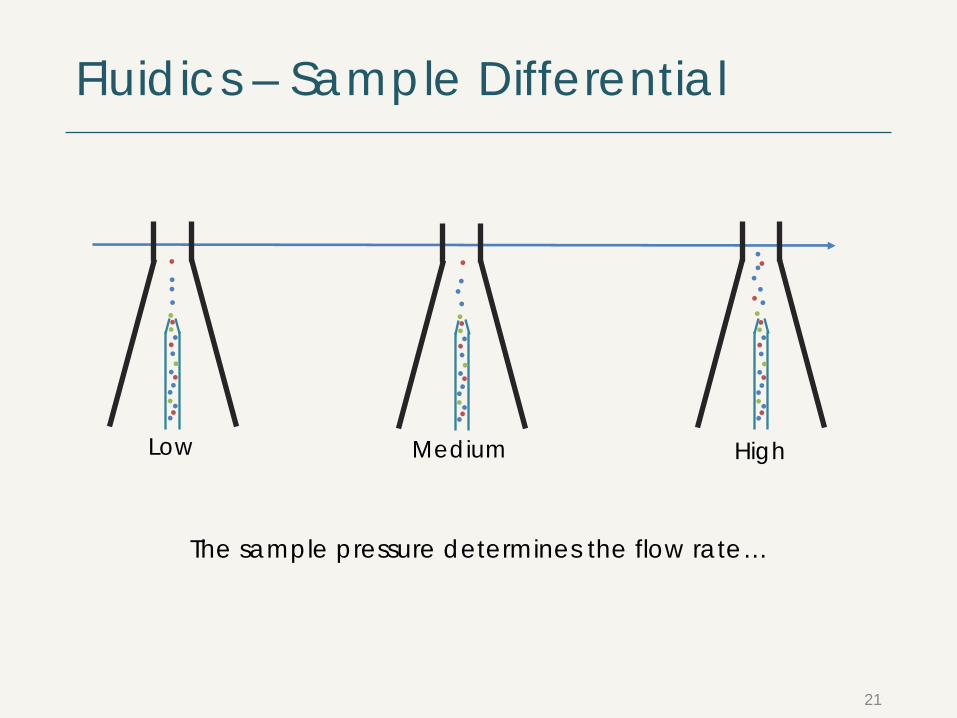
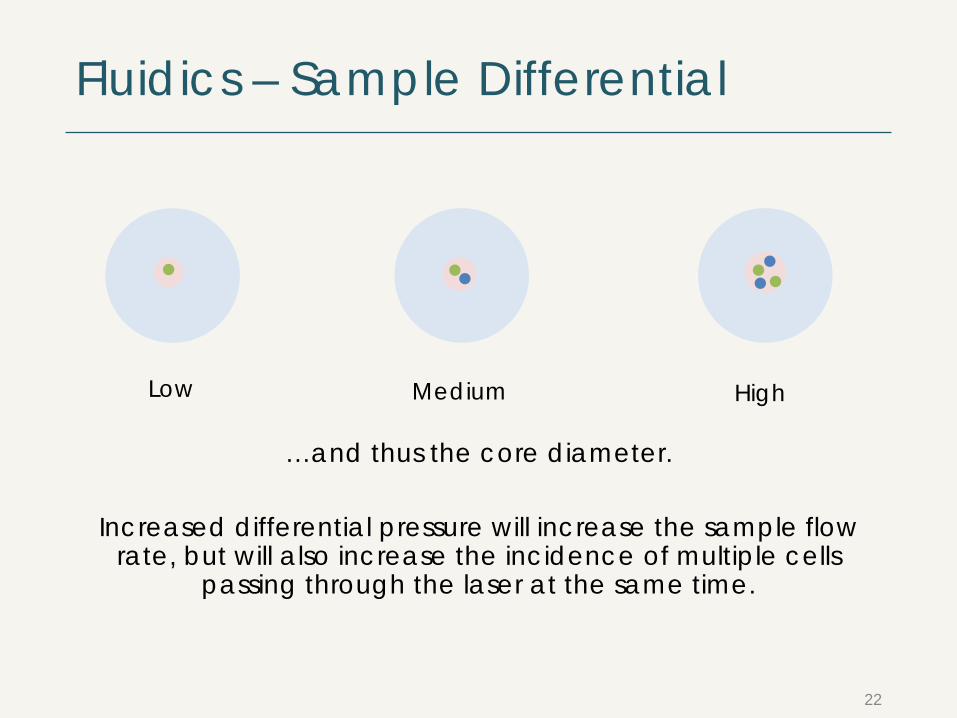
Fluidics – Sample Differential
21
The sample pressure determines the flow rate…
Low Medium High
Fluidics – Sample Differential
22
…and thus the core diameter.
Low Medium High
Increased differential pressure will increase the sample flow rate, but will also increase the incidence of multiple cells
passing through the laser at the same time.
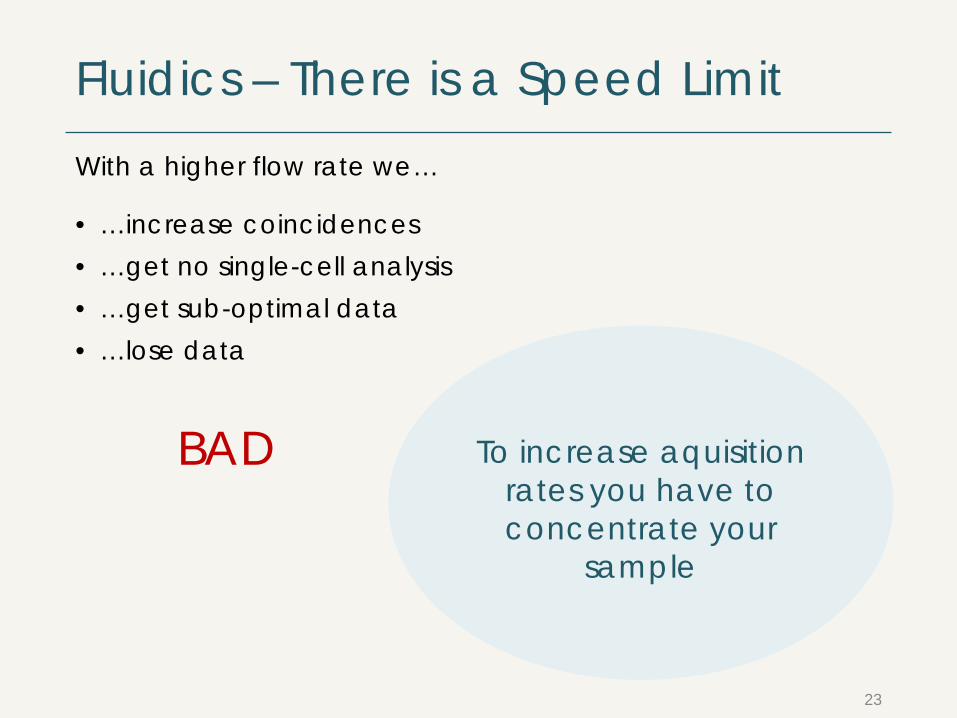
Fluidics – There is a Speed Limit
23
With a higher flow rate we…
• …increase coincidences• …get no single-cell analysis• …get sub-optimal data• …lose data
BAD To increase aquisitionrates you have toconcentrate your
sample
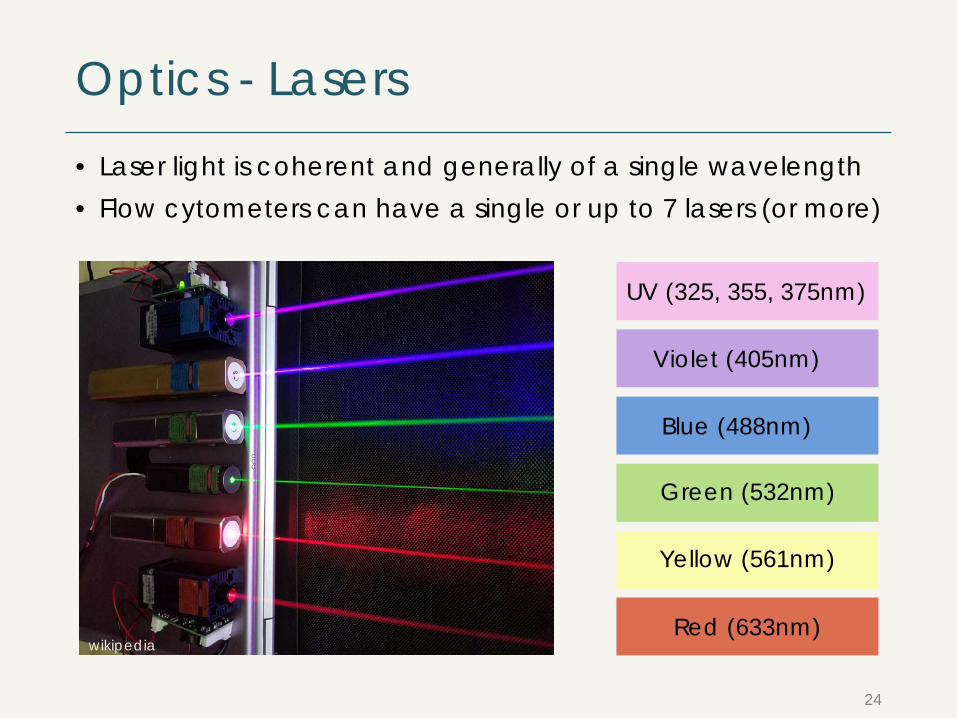
Optics - Lasers
24
• Laser light is coherent and generally of a single wavelength• Flow cytometers can have a single or up to 7 lasers (or more)
wikipedia
UV (325, 355, 375nm)
Violet (405nm)
Blue (488nm)
Green (532nm)
Yellow (561nm)
Red (633nm)
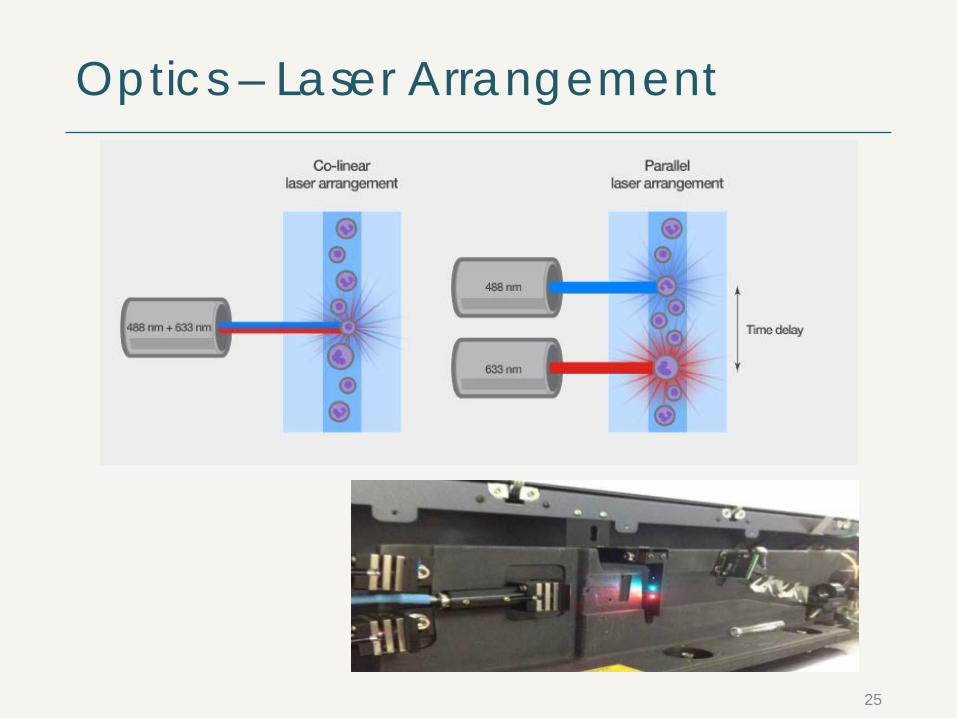
Optics – Laser Arrangement
25

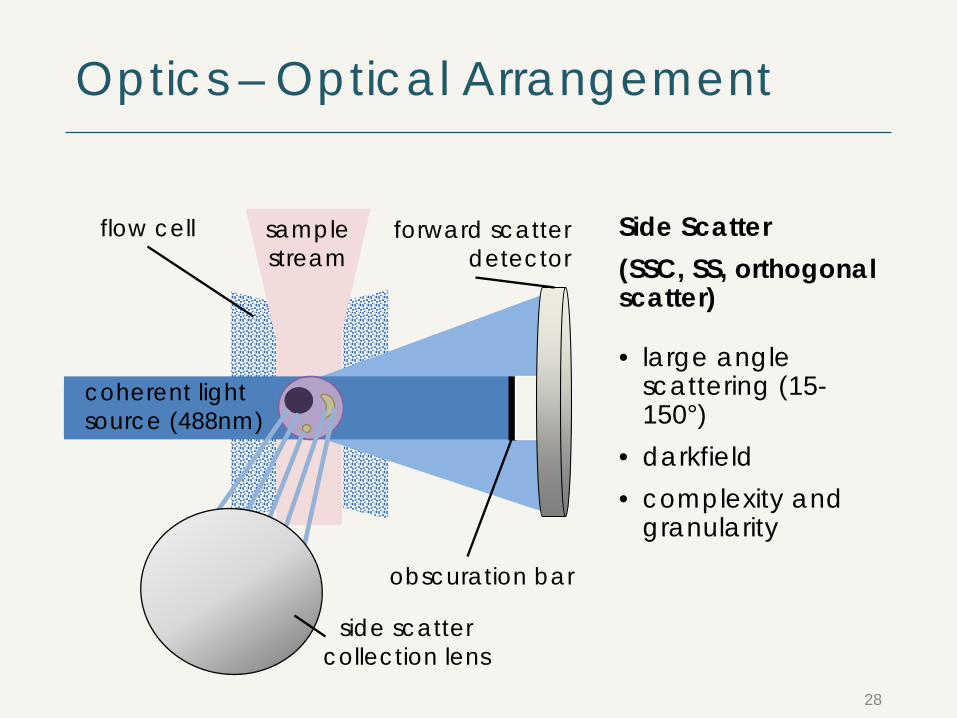
Optics – Optical Arrangement
coherent light source (488nm)
flow cell
26
sample stream
forward scatterdetector
Light scatters in all directions!
obscuration bar
Forward Scatter(FSC,FALS,FS)
• ~2-20° of the laserintercept
• Based on MieScatter
• Scatterproportional tothe square ofthe diameter ofthe cell
• Based on ‘sphericalparticles
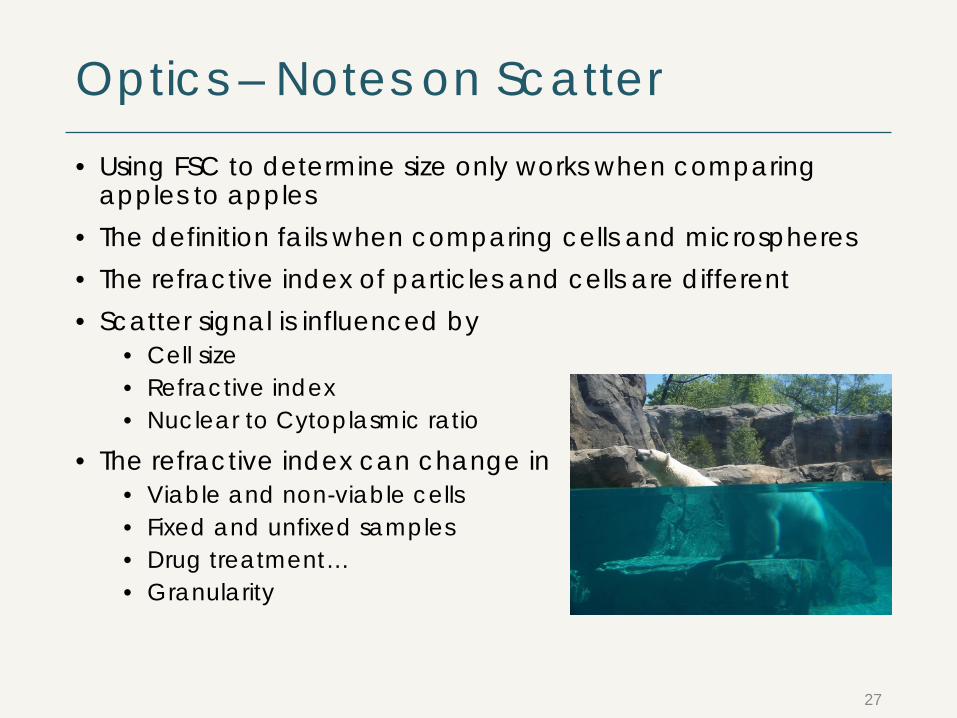
Optics – Notes on Scatter• Using FSC to determine size only works when comparing
apples to apples• The definition fails when comparing cells and microspheres• The refractive index of particles and cells are different• Scatter signal is influenced by
• Cell size• Refractive index• Nuclear to Cytoplasmic ratio
• The refractive index can change in• Viable and non-viable cells• Fixed and unfixed samples• Drug treatment…• Granularity
27
Optics – Optical Arrangement
coherent light source (488nm)
flow cell
28
sample stream
forward scatterdetector
obscuration bar
Side Scatter(SSC, SS, orthogonal scatter)
• large angle scattering (15-150°)
• darkfield• complexity and
granularity
side scattercollection lens
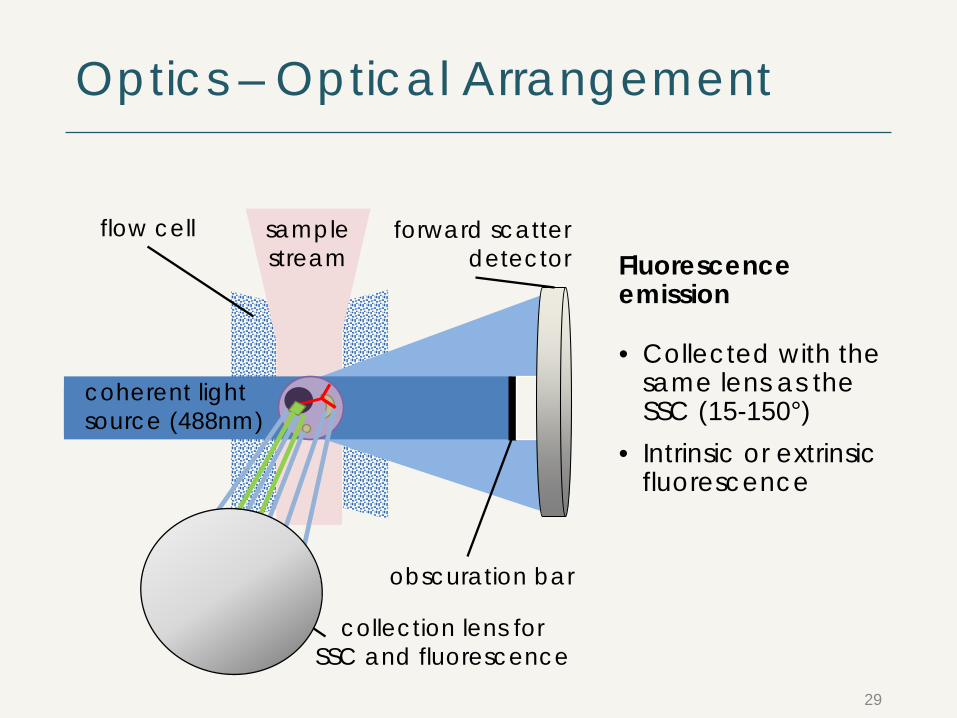
Optics – Optical Arrangement
coherent light source (488nm)
flow cell
29
sample stream
forward scatterdetector
obscuration bar
Fluorescenceemission
• Collected with thesame lens as theSSC (15-150°)
• Intrinsic or extrinsicfluorescence
collection lens forSSC and fluorescence

Optics – Fluorescence
30
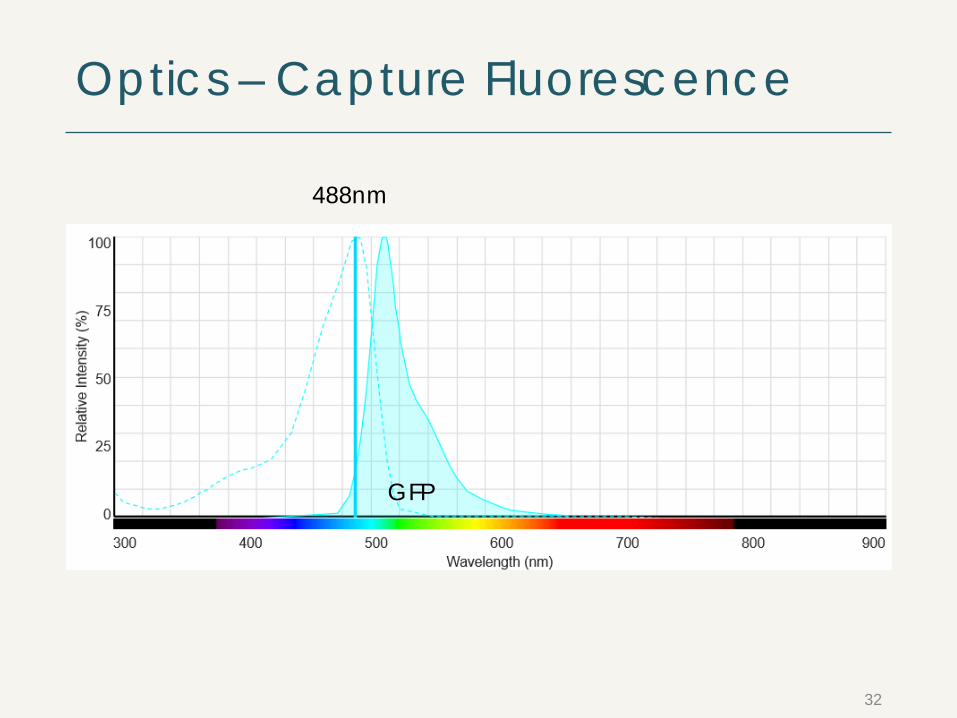
488nm
FITC

Optics – Capture Fluorescence
31
488nm
FITC
Optics – Capture Fluorescence
32
488nm
GFP
Optics – Capture Fluorescence
33
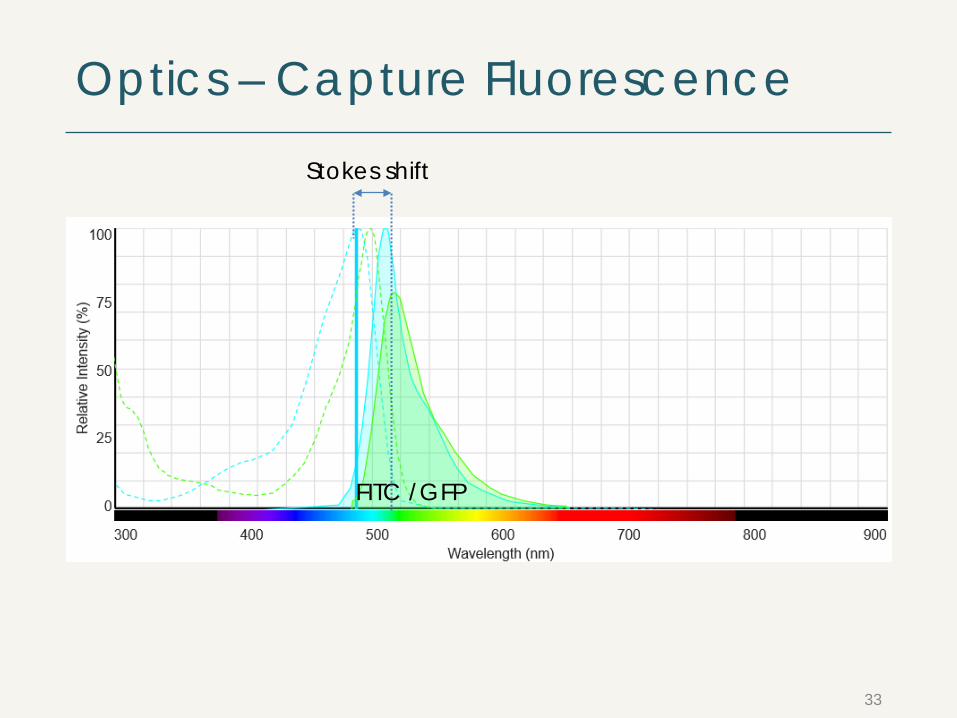
FITC /GFP
Stokes shift
Optics – Capture Fluorescence
34
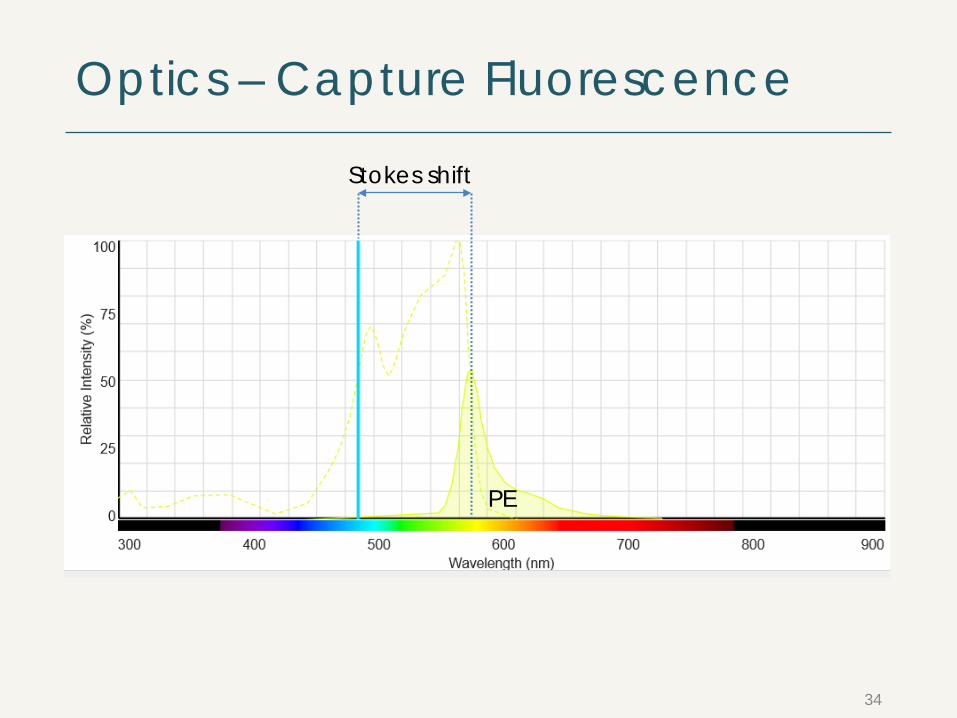
PE
Stokes shift
Optics – Capture Fluorescence
35
488nm
FITC PE

Optics – Capture Fluorescence
36
488nm
FITC PE
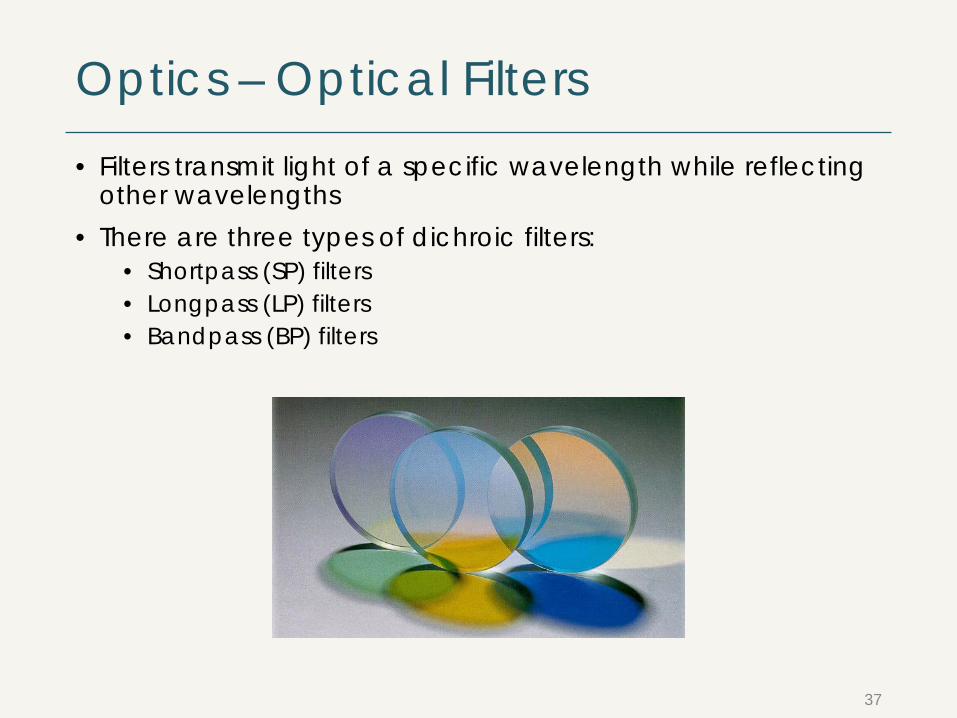
Optics – Optical Filters• Filters transmit light of a specific wavelength while reflecting
other wavelengths• There are three types of dichroic filters:
• Shortpass (SP) filters• Longpass (LP) filters• Bandpass (BP) filters
37

Optics - Filter PropertiesLongpass filters transmit wavelengths above a cut-on wavelength
Bandpass filters transmit wavelengths in a narrow range around a specified wavelength
550LP
Emission light
> 550nmEmission light
510/20BP
500-520nm
LP
Emission light
550SP
< 550nm
Shortpass filters transmit wavelengths below a certain wavelength
38
SP BP
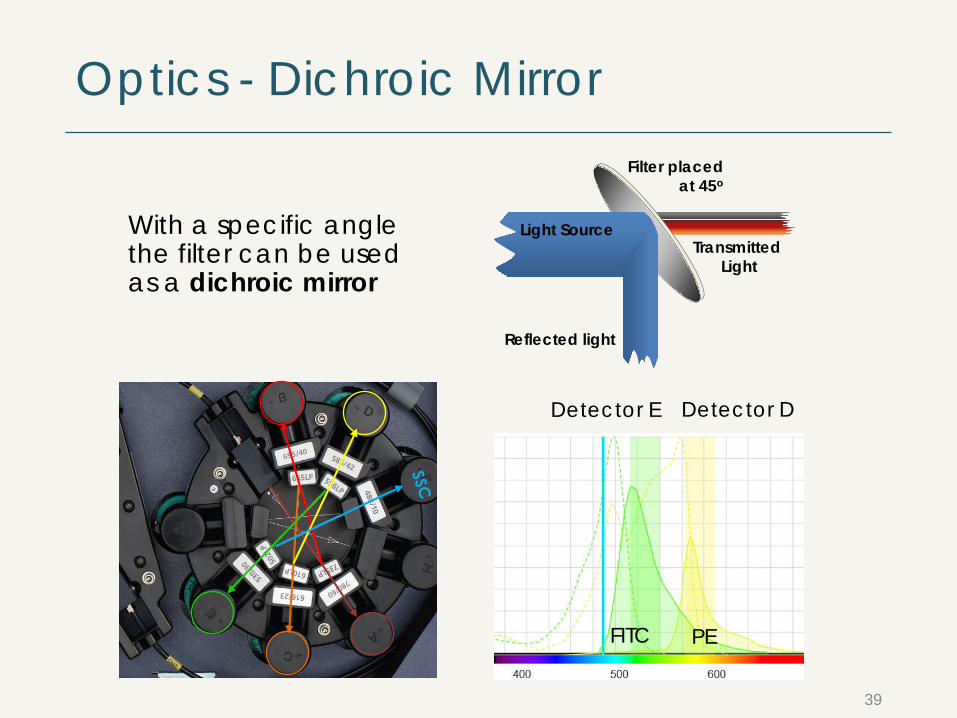
Optics - Dichroic Mirror
With a specific angle the filter can be used as a dichroic mirror
Transmitted Light
Light Source
Filter placed at 45o
Reflected light
Detector E Detector D
39
PEFITC
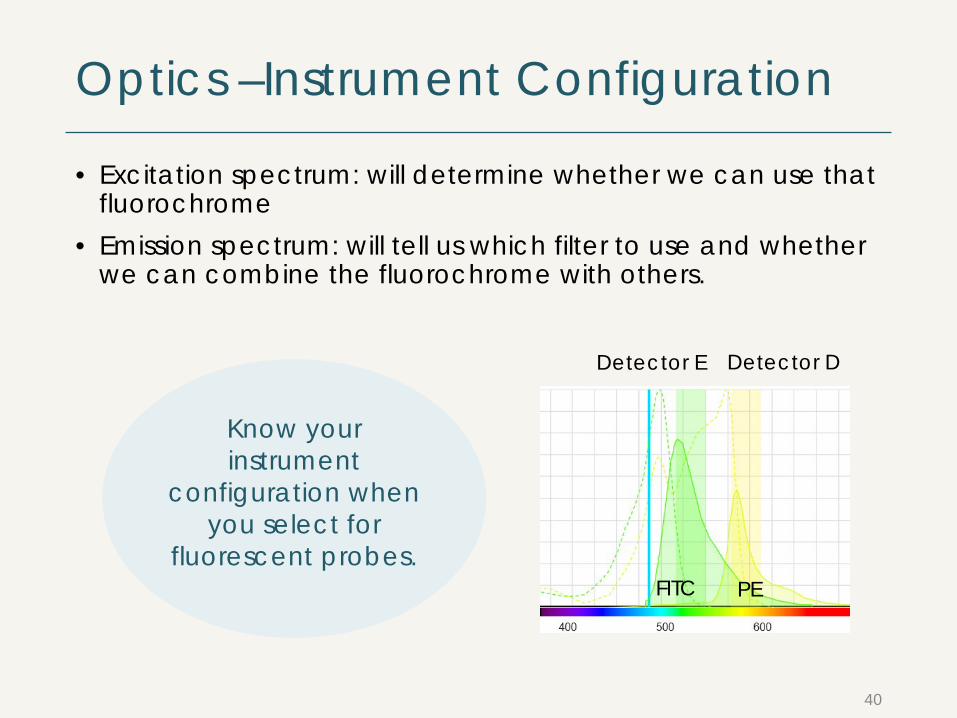
Optics –Instrument Configuration
40
Know yourinstrument
configuration whenyou select for
fluorescent probes.
• Excitation spectrum: will determine whether we can use that fluorochrome
• Emission spectrum: will tell us which filter to use and whether we can combine the fluorochrome with others.
Detector E Detector D
PEFITC
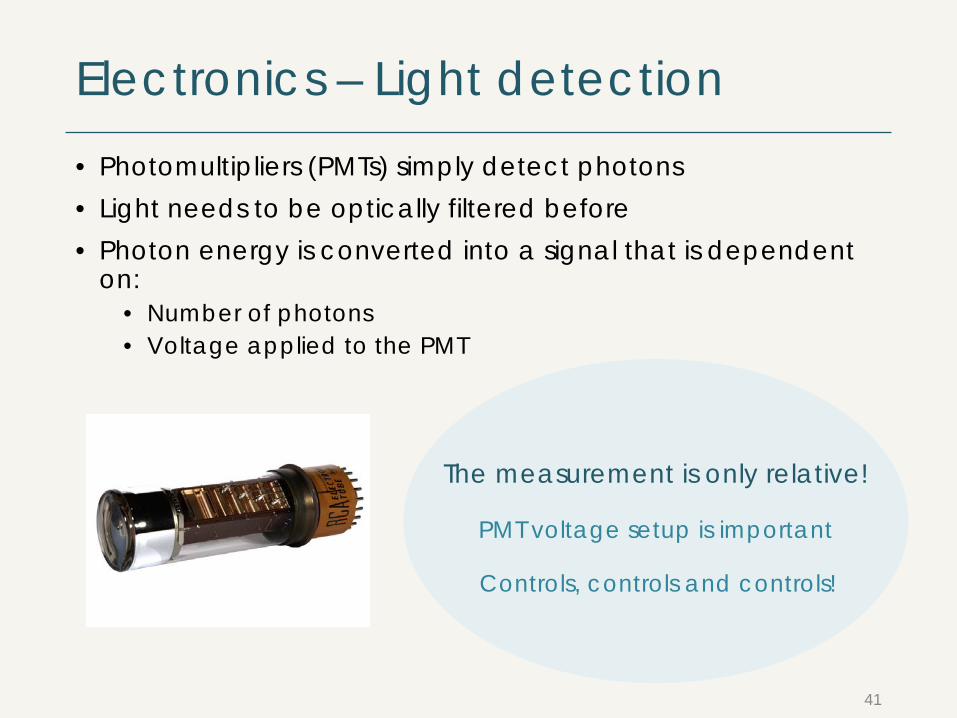
Electronics – Light detection• Photomultipliers (PMTs) simply detect photons• Light needs to be optically filtered before• Photon energy is converted into a signal that is dependent
on:• Number of photons• Voltage applied to the PMT
41
The measurement is only relative!
Controls, controls and controls!
PMT voltage setup is important
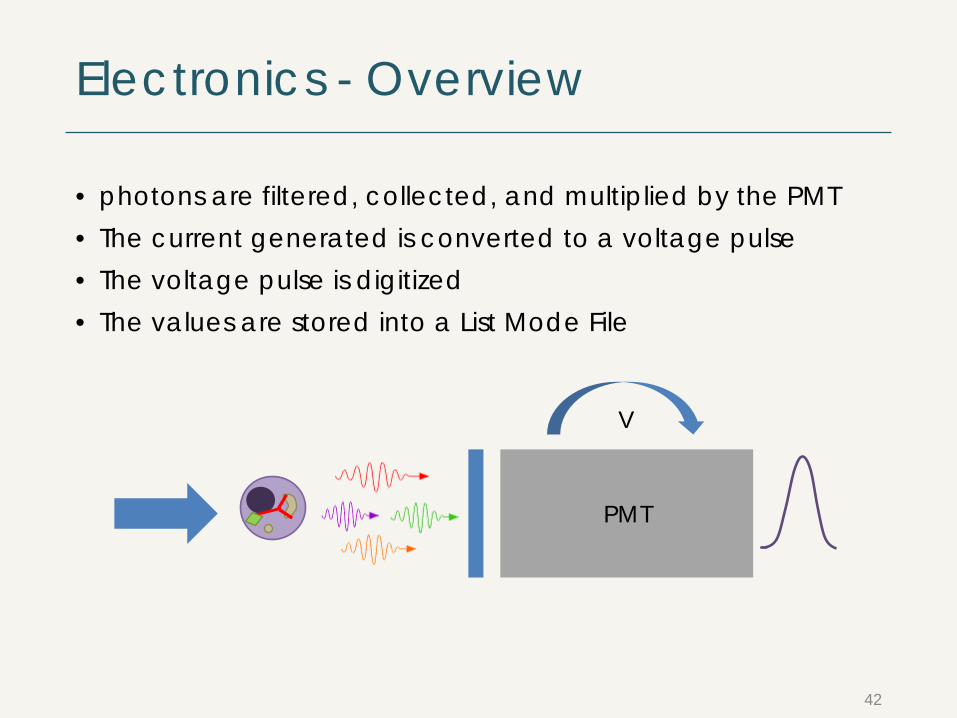
Electronics - Overview
42
PMT
V
• photons are filtered, collected, and multiplied by the PMT• The current generated is converted to a voltage pulse• The voltage pulse is digitized• The values are stored into a List Mode File
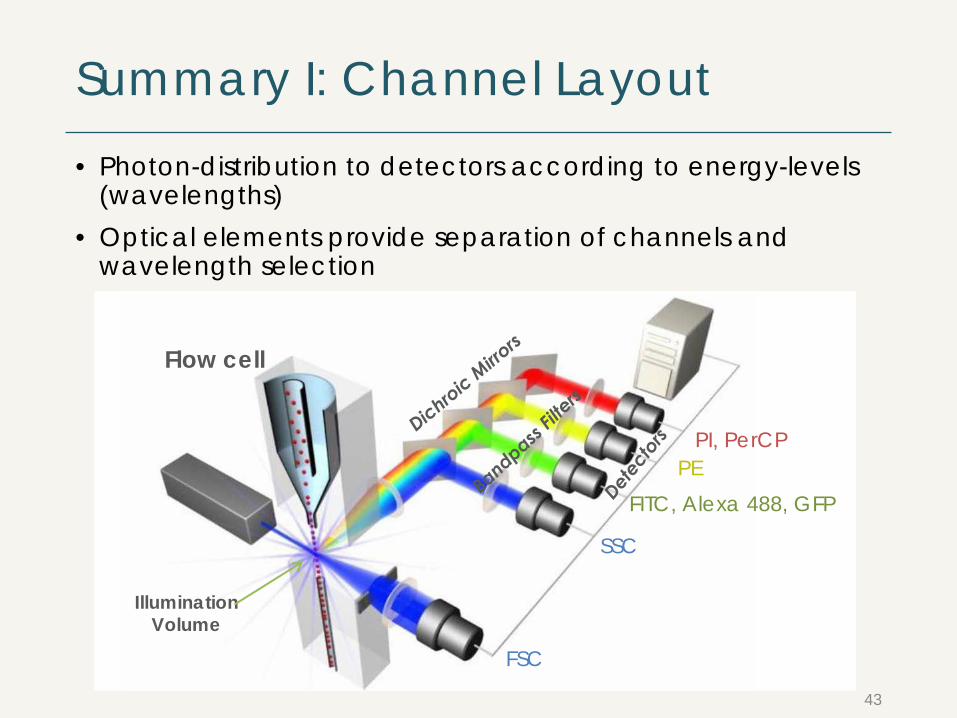
Summary I: Channel Layout• Photon-distribution to detectors according to energy-levels
(wavelengths)• Optical elements provide separation of channels and
wavelength selection
Illumination Volume
PI, PerCP
FITC, Alexa 488, GFPPE
Flow cell
SSC
FSC
43

What does a cytometer give us?• We get light scatter, fluorescence information and time• We collect the data in a defined way• We are in control of how the data is displayed
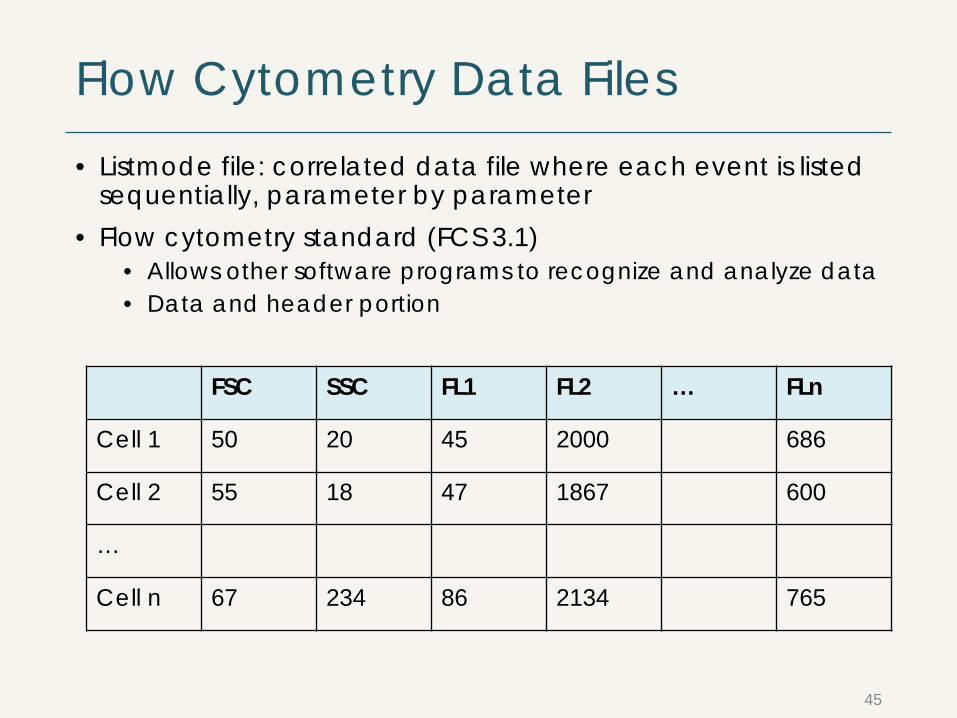
Flow Cytometry Data Files• Listmode file: correlated data file where each event is listed
sequentially, parameter by parameter• Flow cytometry standard (FCS 3.1)
• Allows other software programs to recognize and analyze data• Data and header portion
45
FSC SSC FL1 FL2 … FLn
Cell 1 50 20 45 2000 686
Cell 2 55 18 47 1867 600
…
Cell n 67 234 86 2134 765
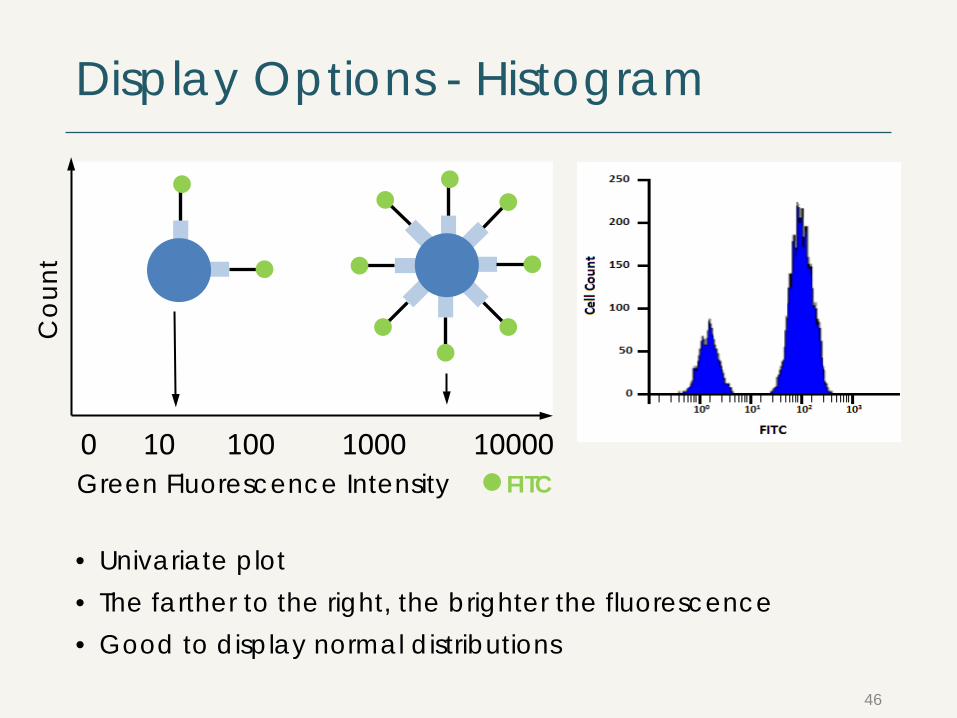
Display Options - Histogram
• Univariate plot• The farther to the right, the brighter the fluorescence• Good to display normal distributions
46
Green Fluorescence Intensity0 10 100 1000 10000
Cou
nt
FITC
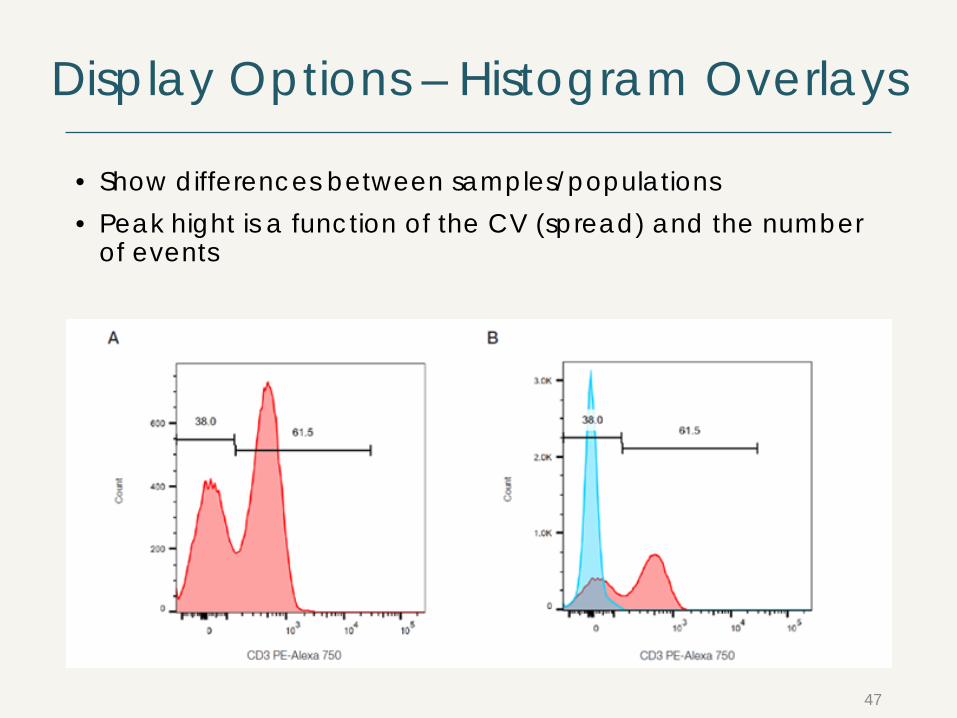
Display Options – Histogram Overlays
• Show differences between samples/populations• Peak hight is a function of the CV (spread) and the number
of events
47
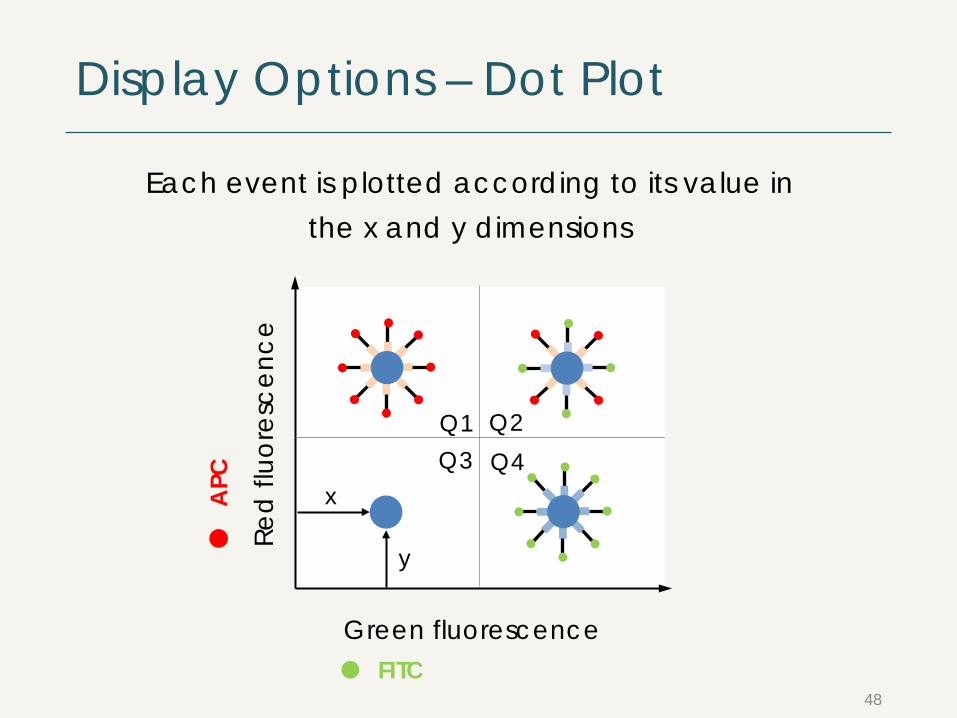
Display Options – Dot Plot
Red
fluor
esce
nce
Green fluorescence
48
Each event is plotted according to its value in the x and y dimensions
x
y
Q1 Q2Q3 Q4
FITC
APC
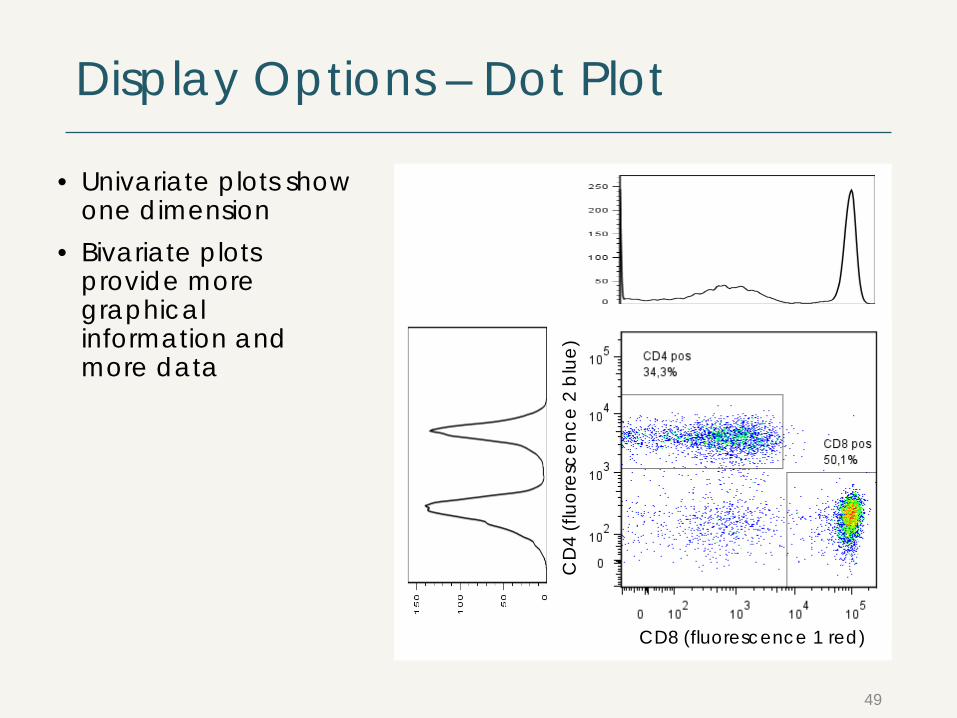
Display Options – Dot Plot
49
• Univariate plots show one dimension
• Bivariate plots provide more graphical information and more data
CD8 (fluorescence 1 red)
CD
4 (f
luor
esce
nce
2 bl
ue)

What we learn from Light ScatteringSi
de
Scat
terS
SC
Forward Scatter FSC
Bigger
Mor
e G
ranu
lar
Live Cells
Bigger Cells or Aggregates
Dead Cells
Apoptotic Cells
50
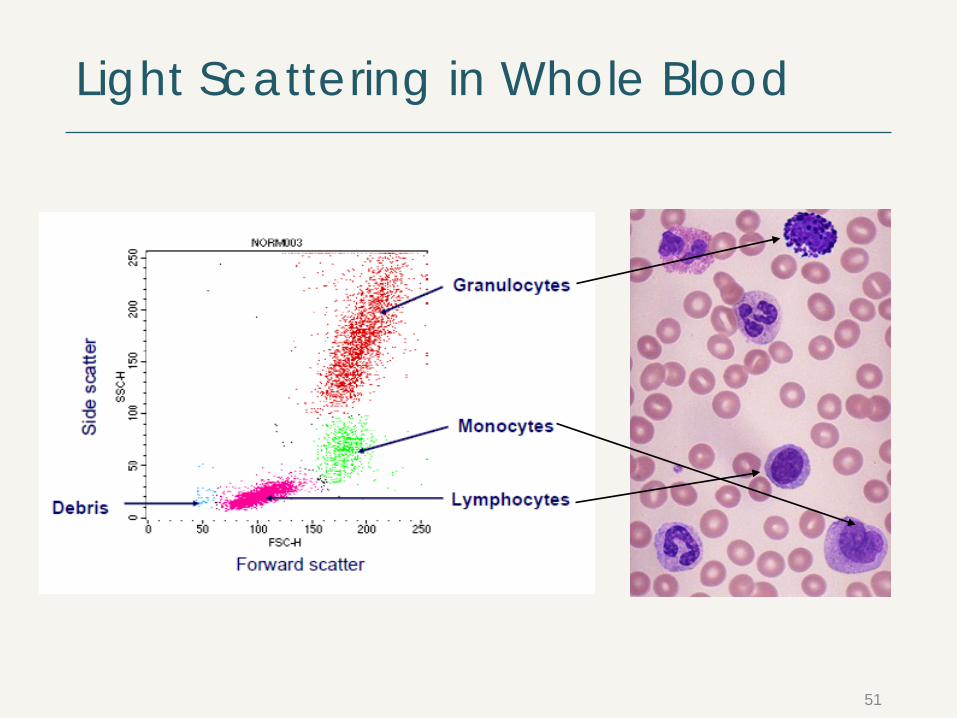
Light Scattering in Whole Blood
51

Common Modes for Dot Plots• Forward scatter vs side scatter
To look at the distribution of cells based upon size and granularity
• Single color vs side scatterTo visualize the expression of the fluorescence of cells
• Two-color fluorescence plotTo differenciate between those cells that express only one of theparticular fluorescent markers, those that express neither andthose that express both
52

Lots of Options!
www.treestar.com
53
• DOT plots mask the amount of data • Density plots and Contours show where concentrations are
heaviest• Contours do not display rare events well - use Contour
showing outliers (Contour and Dot Plot combination)
Display options:
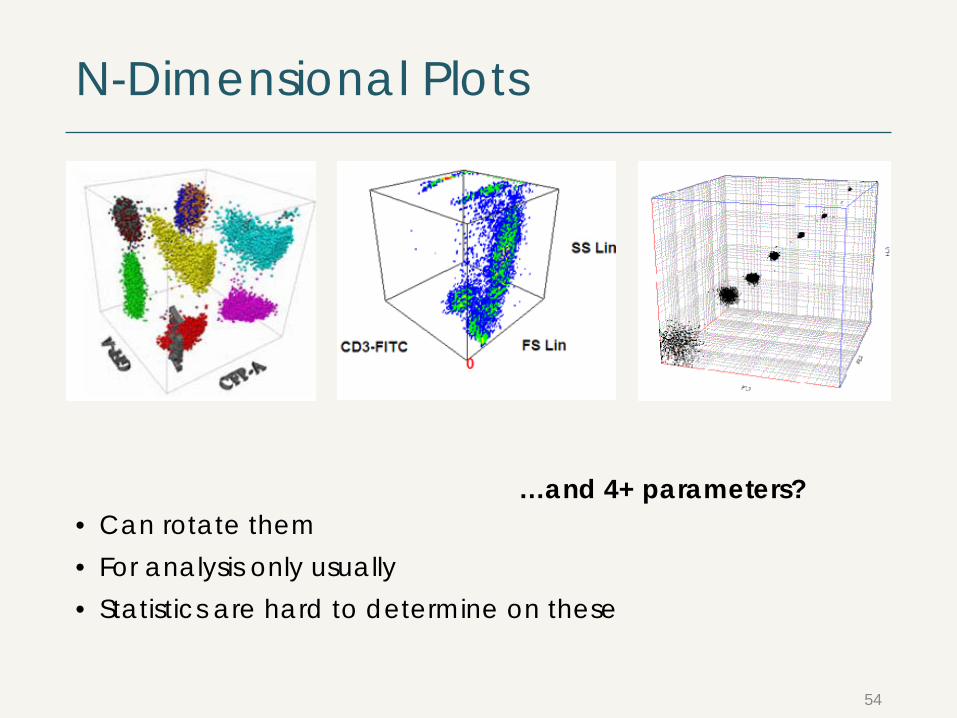
N-Dimensional Plots
• Can rotate them• For analysis only usually• Statistics are hard to determine on these
54
…and 4+ parameters?
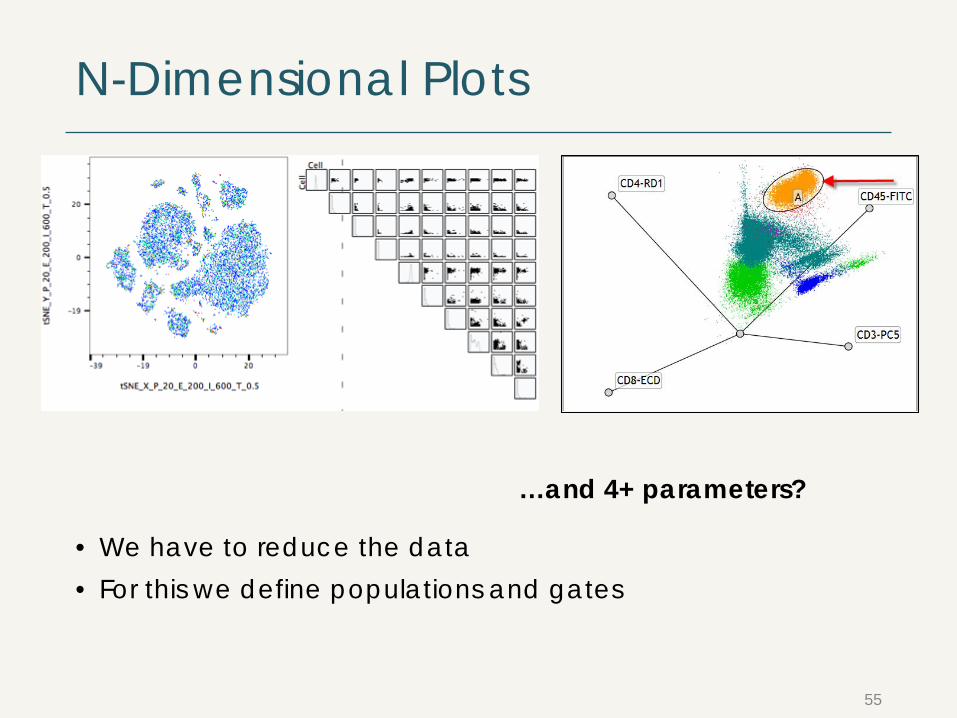
N-Dimensional Plots
• We have to reduce the data• For this we define populations and gates
55
…and 4+ parameters?
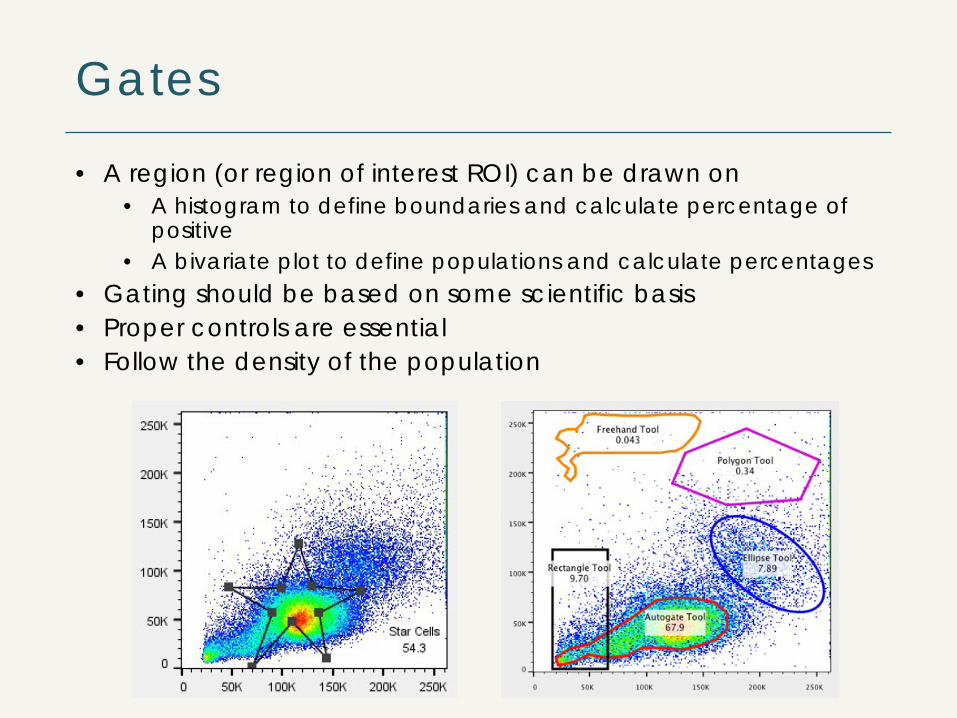
Gates
• A region (or region of interest ROI) can be drawn on• A histogram to define boundaries and calculate percentage of
positive• A bivariate plot to define populations and calculate percentages
• Gating should be based on some scientific basis• Proper controls are essential• Follow the density of the population
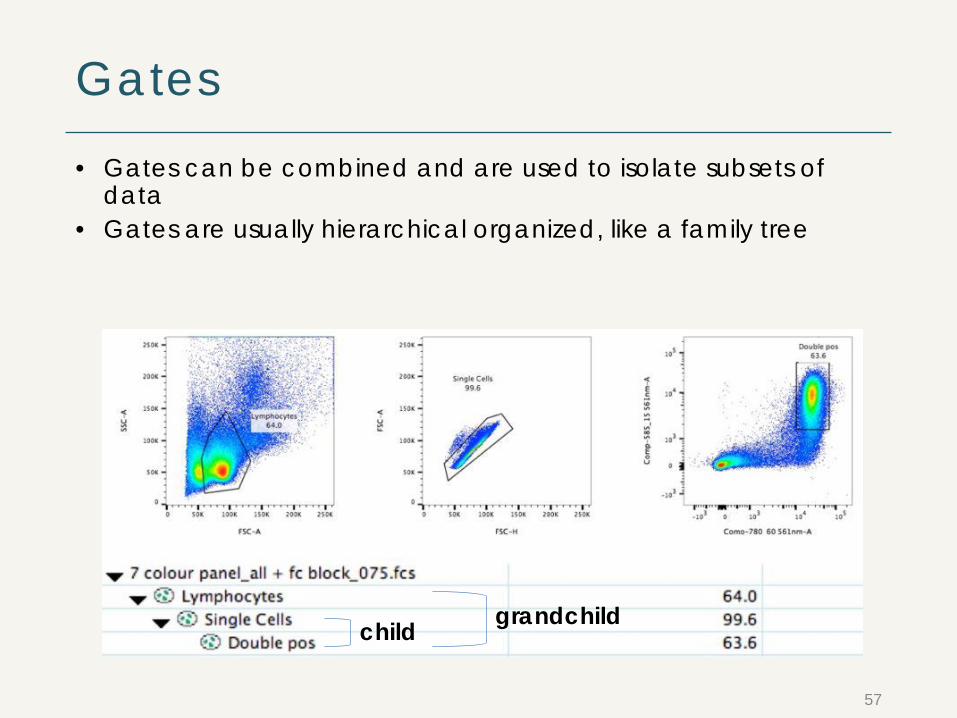
Gates• Gates can be combined and are used to isolate subsets of
data• Gates are usually hierarchical organized, like a family tree
57
child grandchild

Why Gating is useful
• Is used to isolate a subset of cells on a plot
• We can use them to select a population for further study
• Allows the ability to look at parameters specific to only that subset
green
green redboth
red
apoptotic
dead
Mixed T cell population
3% double pos. 60% double pos.
58
Why Gating is useful (2)• Doublet exclusion based on FSC-A vs -H vs –W gating• Eliminates false positive events and cleans up your plots
59
From Annual Flow Cytometry course, University Zürich
Important Points on Analysis
• Flow data is primarily concerned with descriptive statistics• Enumeration of subsets• Level of fluorescence intensity
• Visualization
• What kind of data are you looking for?• How much fluorescence?• What percent are positive?• How much more positive is x than y?• What is the ratio between green and red fluorescence?
• What kind of statistics are available• MFI • %-ages• CV• …
60
Summary II - the Main Points• Keep a smooth laminar flow! Prevent air and aggregates.• To increase acquisition rates you have to concentrate your
sample.• The key to good results is good sample preparation.• Know your instrument configuration when selecting for
fluorescent probes.• Gating helps to define your cells of interest.• All measurements are relative, don’t forget the controls.• Include a viability dye and doublet
discrimination gating to eliminate false positive events.
61

There is more…
Applications:• Major applicacions phenotyping and fluorescent proteins• Examples for special applications: RNAFlow & FRET
62
Immunopheno-typing
DNA and RNA analysis
Cell deathFunctional analysis
Transduction / Transformation confirmation
Basic Use:
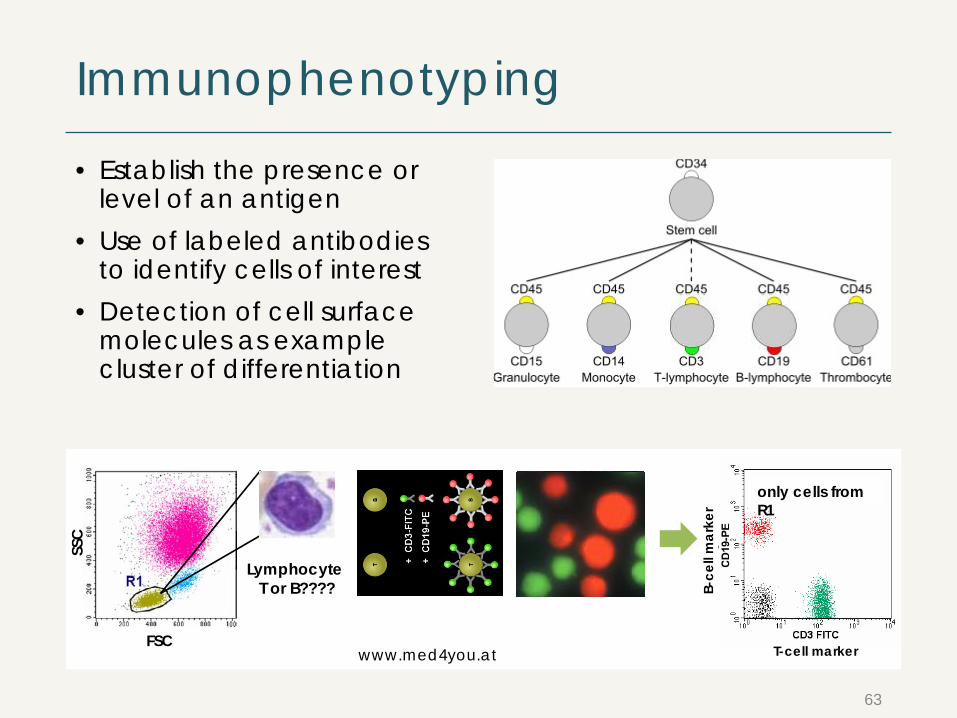
Immunophenotyping
• Establish the presence or level of an antigen
• Use of labeled antibodies to identify cells of interest
• Detection of cell surfacemolecules as examplecluster of differentiation
Lymphocyte T or B????
only cells fromR1
SSC
FSCwww.med4you.at T-cell marker
B-ce
llm
arke
r63
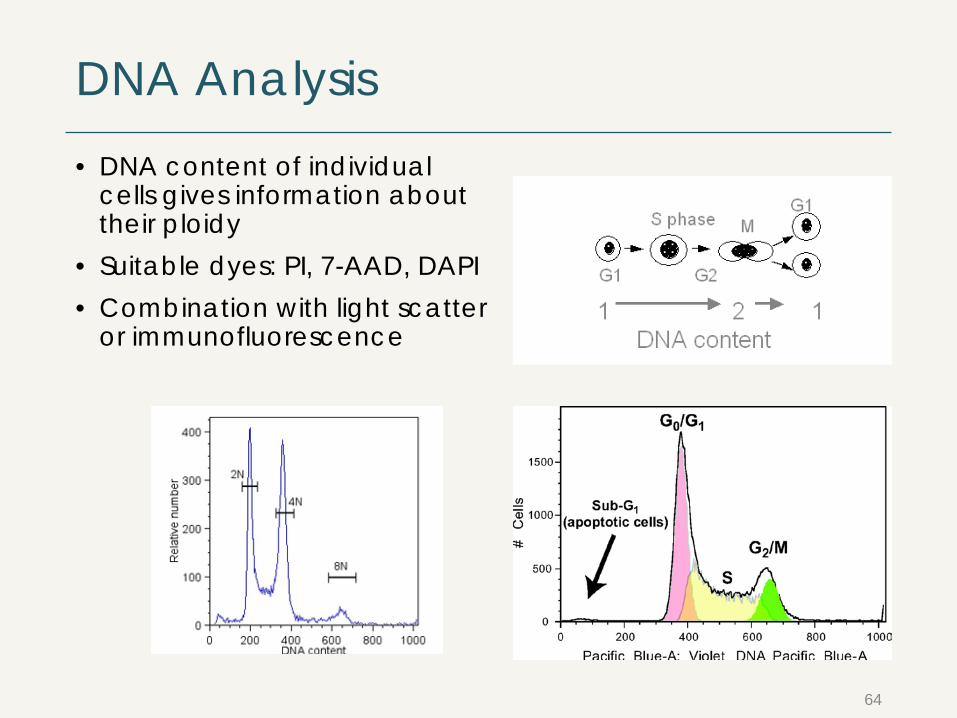
DNA Analysis• DNA content of individual
cells gives information about their ploidy
• Suitable dyes: PI, 7-AAD, DAPI• Combination with light scatter
or immunofluorescence
64
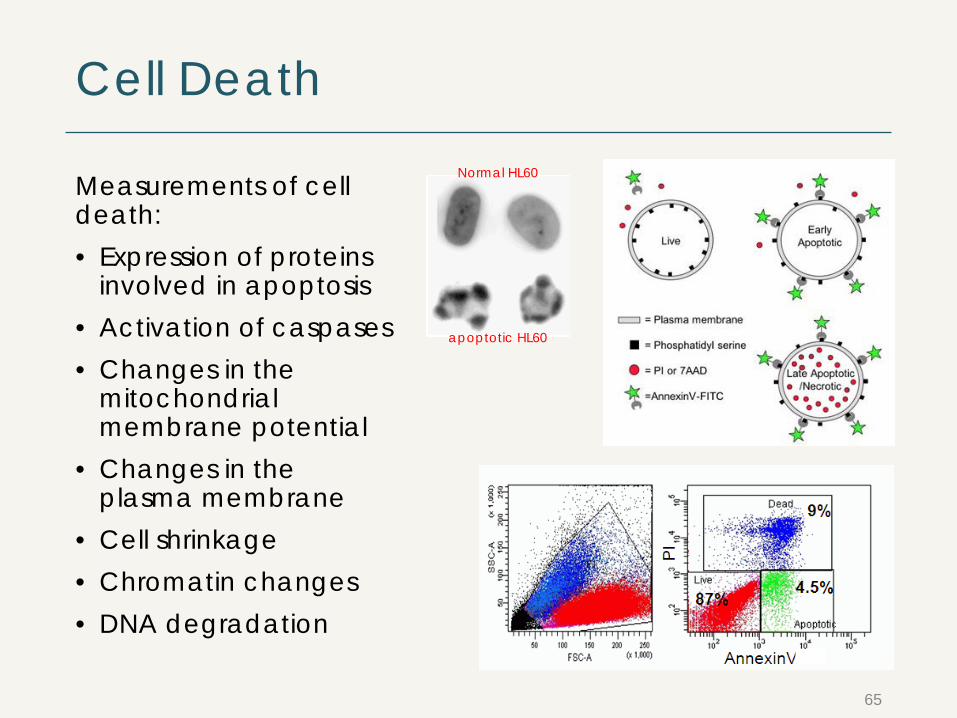
Cell Death
Measurements of cell death:• Expression of proteins
involved in apoptosis• Activation of caspases• Changes in the
mitochondrial membrane potential
• Changes in the plasma membrane
• Cell shrinkage• Chromatin changes• DNA degradation
Normal HL60
apoptotic HL60
65
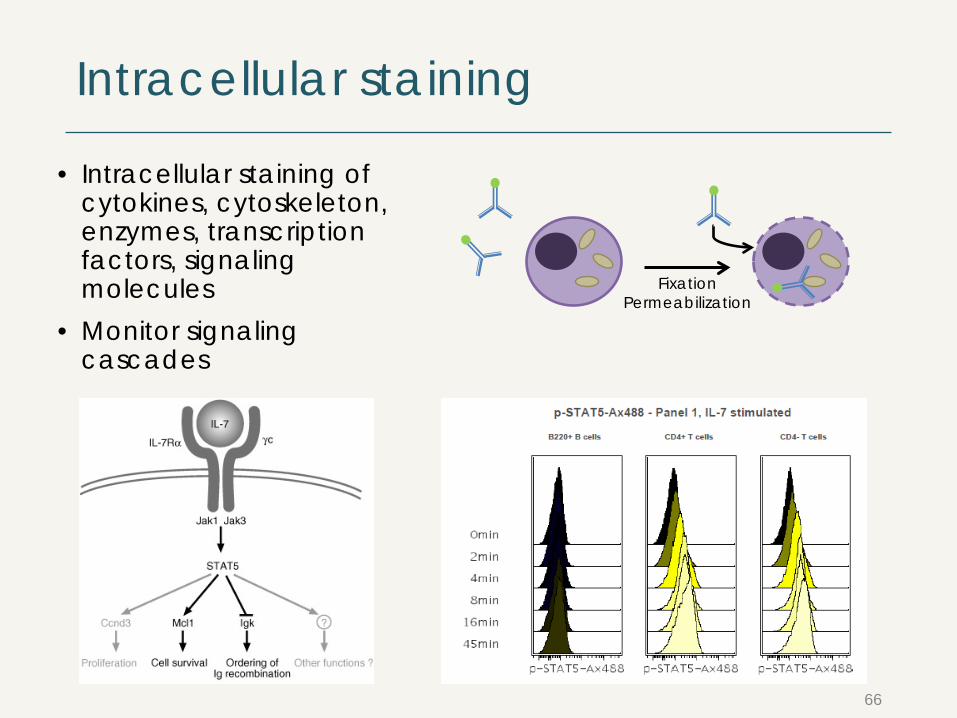
Intracellular staining
• Intracellular staining of cytokines, cytoskeleton, enzymes, transcriptionfactors, signalingmolecules
• Monitor signalingcascades
FixationPermeabilization
66

Fluorescence Resonance EnergyTransfer Assays
67https://www.innovabiosciences.com/resources/applications/fret/
• protein-protein interactions with the help of fluorescently labeled proteins
• distance between the two proteins must be less than 10nm
• The emission spectrum of the donor fluorophore must overlap the absorption spectrum of the acceptor fluorophore

RNA Flow Assay
68
Gene-specific oligonucleotide probe set and branched DNA technology:
• Compare RNA and protein kinetics in the same cell• Parallel analysis of microRNA targets in combination with
antibody staining• Detect target-specific RNA for which flow cytometry
antibodies are nonexistent

Compare RNA and Protein Kinetics
69

Gene Expression
• Genes well characterized and can be cloned in frame with gene of interest
• Can be used to monitor rates of gene expression
• Commonly used as marker of transfection
• Level of intensity can be variable
• Great for cell sorting applications
70
green fluorescence
yello
wflu
ores
cenc
e
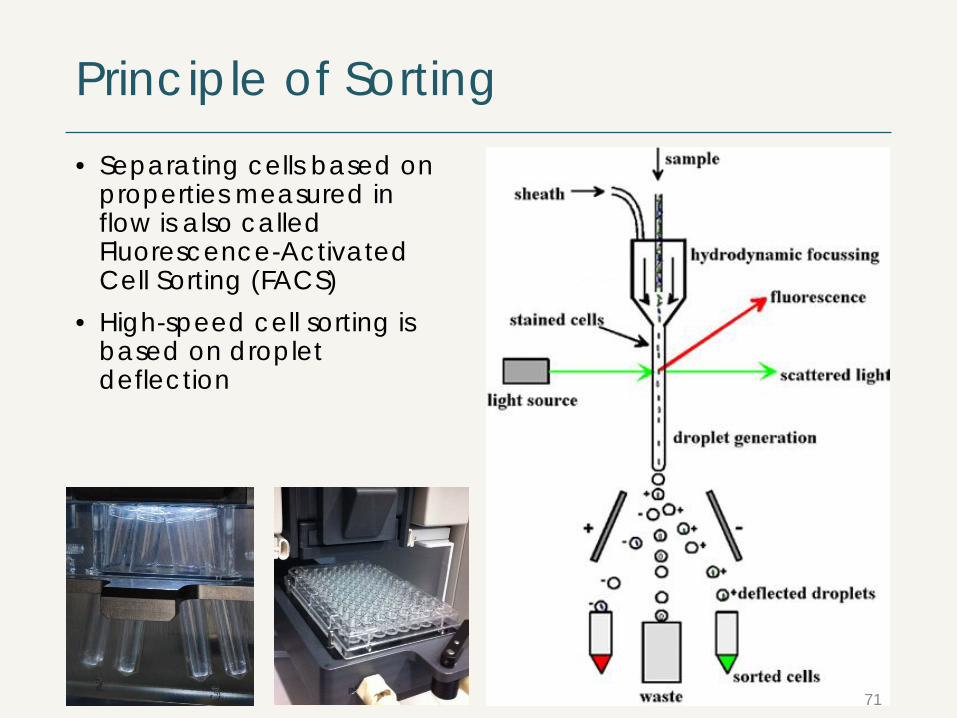
Principle of Sorting• Separating cells based on
properties measured in flow is also called Fluorescence-Activated Cell Sorting (FACS)
• High-speed cell sorting is based on droplet deflection
71

Microscopy vs Flow Cytometry
Microscopy• Localization of antigen is possible• Poor enumeration of cell
subtypes• Limiting number of simultaneous
measurements
Flow Cytometry• Can not tell you where antigen is• Fast• Subpopulation analysis• Multiparameter analysis• Characterization of rare events
72

You are not alone!
www.biozentrum.unibas.ch/research/groups-platforms/overview/unit/fcf/isac-net.org
www.cyto.purdue.eduflowbook-wiki.denovosoftware.com
www.bdbiosciences.com/research/multicolor/spectrum_viewer/index.jspwww.invitrogen.com/site/us/en/home/support/Research-Tools/Fluorescence-
Resources:
73