The Basics of Financial Management - rcac.org · your utility to have financial-management policies...
44
The Basics of Financial Management for Small-community Utilities RCA P RURAL COMMUNITY ASSISTANCE PARTNERSHIP an equal opportunity provider and employer
Transcript of The Basics of Financial Management - rcac.org · your utility to have financial-management policies...

The Basics of Financial Managementfor Small-community Utilities
RCAP RURAL COMMUNITY ASSISTANCE PARTNERSHIPan equal opportunity provider and employer

This guide was written by Community Resource Group, the Southern RCAP, on behalf of Rural Community Assistance Partnership, Inc.
Copyright © 2011
The entire contents of this guide are available on the RCAP website at www.rcap.org
This material is based upon work supported under a grant by the Utilities Programs, United States Department of Agriculture. Any opinions, findings, and conclusions or recommendations expressed in this material are solely the responsibility of the authors and do not necessarily represent the official views of the Utilities Programs.
The Basics of Financial Managementfor Small-community Utilities
Rural Community Assistance Partnership, Inc. 1701 K St. NW, Suite 700Washington, DC 20006202/408-1273800/321-7227 (toll-free)[email protected]
www.rcap.org

i
Table of Contents
INTRODUCTION 1
ChapTeR 1: The framework for financial management 3
Sample financial-management policies
General policies 4
Planning and budgeting policies 5
Accounting and cash-management policies 6
Purchasing policies and purchase-requisition system 8
Compensation and payroll policies 9
Financial Procedures Manual 10
ChapTeR 2: planning for your system’s financial future 11
ChapTeR 3: annual operating budgets 14
ChapTeR 4: Oversight and monitoring of financial performance 19
Monitoring the annual budget 19
Standard financial statements 21
The balance sheet 21
The income statement 29
The cash-flow statement 32
ChapTeR 5: Maintaining sustainable water and waste-disposal services 35

1 • Introduction
INT
RO
DU
CT
ION
Introduction
Overview of financial management The term financial management simply means effectively managing your utility’s financial functions. The financial functions of your utility include accounting, your policies and procedures, record-keeping and reporting systems, planning and forecasting practices, budgeting procedures, and financial-oversight responsibilities. The goal of good financial management is to ensure that your utility is operated as a financially sustainable enterprise.
When your utility is financially sustainable, you are selling water and/or wastewater-disposal services to your customers at a fair rate that consistently generates enough revenue to meet all of your short- and long-term expenses.
At the very least, your utility should be financially self-supporting. But successful systems do more than just break even. They establish user rates sufficient enough to meet the system’s future needs, such as emergency outages, equipment replacement and repair, and facility improvements.
The Safe Drinking Water ActThe Safe Drinking Water Act (SDWA) amendments passed by Congress in 1996 contained special provisions related to small water systems. Small water utilities were given special consideration and resources to make sure that they had the managerial, technical and financial capacity to comply with drinking water standards.
State agencies that have primary enforcement responsibilities for implementation of the SDWA (called “primacy agencies”) were also required to establish and implement state capacity-development strategies. These strategies were designed to insure that small water utilities developed and maintained the technical, managerial and financial capacity to meet their responsibilities for providing safe drinking water over the long-term.
Following the passage of the Safe Drinking Water Act amendments, there has been a much greater emphasis on financial sustainability of small utilities, along with numerous tools and resources to help utilities achieve greater financial stability. One factor driving this emphasis is fewer resources, namely grants and loans, for utilities to help them maintain their compliance with regulations or for other projects. Governments at all levels will be expecting utilities to be more financial stable and self-supporting.
One part of promoting financial sustainability is a greater emphasis on implementing concepts such as “full-cost pricing” and “asset management” in the operations of small utilities. Full-cost pricing means calculating and setting rates that reflect the true cost of producing and selling water and waste-disposal services, including all operating expenses, debt service and reserve funds for equipment replacement and future improvements. Asset management is a planning process that allows for a utility’s management to prioritize and plan for the preservation and/or replacement of critical system components, or “assets.”

2 • Introduction
INT
RO
DU
CT
ION
Responsibilities of a utility’s governing body and management
As a member of the board or governing body of your utility or as your utility’s manager, you have very important financial responsibilities, including :
• establishing the framework governing the financial-management system•planning for the system’s financial future•preparation and adoption of annual budgets•monitoring and oversight of financial performance• insuring accountability and integrity of the financial system
You already know how central financial resources are to the operation of any business or enterprise that provides a product or service. Your enterprise can sink or swim based on its financial standing. You also know how essential drinking water and wastewater treatment is not only to a city or a community, but to even a single household. So in addition to the responsibilities you were elected or hired to take on in overseeing the financial management of your utility, you probably understand that you have a deeper obligation to ensure that your utility’s finances are managed properly because they are the main resources that support the continual provision of essential water-related services where you live.
Carrying out these responsibilities and roles is not always easy, and it is acceptable to ask questions or seek training or additional skills. This guide is one resource to help you. The Rural Community Assistance Partnership (RCAP) has other printed guides for utility boards and management and field staff who provide in-person, customized assistance with the management of your utility. See the inside back cover for contact information for RCAP, or visit www.rcap.org for more information, including how to obtain other publications like this one.

3 • The framework for financial management
CH
AP
TE
R 1
Chapter 1The framework for financial managementThe policies and procedures that you develop are a framework for the operation of your utility.
You are familiar with many of the essential policies necessary for effectively operating a system: customer service policies, standard operating policies, personnel policies. It is important for your utility to have financial-management policies in place and in order.
On the following pages are a sample set of financial-management policies for a water/wastewater utility. This sample set of policies is for illustration purposes only. Some of the requirements or procedures described in the sample policies may be covered in state statutes or local ordinances, particularly if your utility is operated as a division of a public entity, such as a county or municipal government.
Important notes about what follows:The sample policies are not ready-to-use and should not be adopted or distributed as-is. They must be customized to fit your utility and your circumstances. You can change or add to these policies depending on your system’s circumstances and requirements. Be sure to review them carefully and fill in all the blanks with the required information. Ensure that all the information is pertinent to your specific utility.
Before adopting any financial policies, also be sure to check for items required by state law, local ordinances, your system bylaws or charter, and documents relating to any loans or grants your system may have received.
The information contained herein is for informational purposes only as a service to the public and is not legal advice or a substitute for legal counsel. As legal advice must be tailored to the specific circumstances of each case, nothing provided herein should be used as a substitute for advice of competent counsel. RCAP, Inc. expressly disclaims all liability in respect to actions taken or not taken based on any or all of the contents of the sample policies.

4 • The framework for financial management
CH
AP
TE
R 1
Sample financial-management policies
Financial-management Policies for the _________________ Water/Wastewater System
General policiesApplicability: Financial policies of the board of directors shall conform to applicable state statutes, local ordinances, and other legal obligations of the system. Any section or sections of these policies determined to be in conflict shall be null and void, without affecting the applicability of other sections and provisions.
Purpose: The purpose of these policies is to provide a framework for the effective management and conduct of the financial affairs of the ____________Water/Wastewater System. These policies shall be reviewed periodically by the board of directors and may be amended as necessary by a majority vote of members.
Enterprise accounting: The system shall be operated as an enterprise. It is the policy of the board of directors that the system shall operate on a financially self-sustaining basis. The full cost of providing water/wastewater services to the public on a continual basis shall be recovered through user fees and charges established by the board of directors.
Revenues: It is the policy of the board of directors that all revenues generated from customer user fees and charges of the system may be used only for expenses directly associated with the system’s operation and maintenance, debt service, debt-service reserve, and other financial-reserve funds authorized by the board.
Generally accepted principles and basis: It is the policy of the board of directors that financial affairs of the system be conducted according to generally accepted accounting principles (GAAP). The utility’s financial accounting and reporting system will be conducted on an accrual basis.
Audit reports: Audit reports shall be prepared annually covering financial operations for the previous fiscal year. Audit reports shall be completed by an independent public accountant with experience in auditing similar organizations.
Fiscal year: The fiscal year of the __________________Water/Wastewater System shall be for a 12-month period, beginning on the _____ day of ____________, and ending on the _____ day of ____________annually.
Bonding: All persons having access to system funds or with responsibilities for the receipt, handling, or expenditure of funds, shall have fidelity bond coverage in an amount necessary to protect the financial assets of the system and in accordance with state statutes and other legal requirements.
Insurance: Insurance coverage shall be maintained which is adequate and necessary to protect the system against potential financial losses.
Conflicts of interest: No member of the governing board may have any direct or indirect interest in any contract for goods or services which may be awarded by the system. No employee or member of the board of directors of the system may receive money for furnishing goods and/or services, installing utility services, or for the sale of materials to the system.

5 • The framework for financial management
CH
AP
TE
R 1
Planning and budgeting policiesLong- and short-term planning: The board of directors shall develop long- and short-term financial plans that forecast future capital and operational needs of the system and that provide a strategy for financing those future needs. Operational, financial, and administrative staff of the system shall assist the board in developing these financial plans.
Budget development: At least 30 days prior to the beginning of each fiscal year, the board of directors shall develop and adopt an annual revenue and expense budget for the operation of the system. The annual budget must show that anticipated revenues shall be sufficient to cover all operating expenses.
Budget format: The budget format and expense and revenue line items shall conform to state and/or federal requirements, if applicable. Each source of revenue and each category of expense shall be separately identified in detail sufficient to present an accurate picture of the system’s financial condition.
Rate and user-charge review: Rates and user charges shall be reviewed annually as part of the budgeting process. A comprehensive rate study shall be completed at least every five years or when major projects and/or expenses are anticipated to occur.
Past-due, late and delinquent billings: In accordance with the customer-service policies adopted by the board of directors, the amounts shown on monthly customer billings are due upon receipt. Any portion of the current amount due that is not paid by the ______ of the month will be considered late and a late-payment charge of $_________ will be assessed. Any customer owing a past-due balance on the next monthly statement will be considered delinquent. Customers with delinquent balances will be subject to service cut-off if the balance is not paid in full by _________________________.
Financial reserves: It is the policy of the board of directors that in order to maintain financial stability and self-sufficiency and to achieve both long- and short-term capital and operational needs into the future, the system shall maintain financial-reserve funds. The financial reserve funds shall be used for:
•debt-service reserve funds (DSRF) as may be required by lenders•emergency funds for unforeseen breakdowns and system repairs•equipment replacement of short-lived assets•planned system expansions or improvements consistent with long-range capital needs
Debt-service reserves: Debt-service reserve funds shall be established and maintained in a separate account in an amount consistent with requirements of the system’s lenders.
Financial-reserve accounts/transfers: The financial reserves shall be maintained in separate accounts. All financial-reserve funds shall be deposited in federally insured depositories. Expenditures or transfers from financial reserves shall be only with approval of the board of directors.
Monitoring budgeted revenues/expenditures: Each month during the fiscal year, the board of directors shall receive and review a monthly financial report from the system’s accounting personnel. Monthly financial reports shall contain:• current month’s revenues and expenditures• actual year-to-date revenues and expenditures• net income or loss• beginning and ending balances for all operating and reserve accounts of the system• summary of past-due accounts receivable (number and total amount)
Budget adjustments: Based on reviews of periodic financial reports, the board of directors shall make budget adjustments or amendments as necessary. Adjustments to an approved budget must be voted on by the board.

6 • The framework for financial management
CH
AP
TE
R 1
Accounting and cash-management policiesDisbursement of funds: All funds shall be disbursed by order of the board of directors or its designee. The use and expenditure of system funds shall be restricted to approved purposes as defined by the system’s annual budget.
Priority of disbursements: Priority of disbursements and payments from current revenues received by the system shall be in the following order or priority, unless otherwise ordered by the board of directors or by law:
1. payment of all payroll-related taxes or assessments2. payment of debt-service expenses and required debt-service reserves3. payment of operation and maintenance expenses of the system4. payments to board-authorized financial-reserve accounts (emergency reserves, capital
improvements, or equipment-replacement reserves)
Authorization to incur financial obligations: Only the board of directors or persons so designated by the board shall have authorization to incur financial obligations on behalf of the system.
Chart of system accounts: Financial recordkeeping of the system shall use a standard, double-entry chart of accounts for the classification of all assets, liabilities, expenses, revenues, and other accounting transactions on a consistent basis.
Source documentation: Payment for goods, services, and expenses of the system’s operation shall be made from original invoices submitted for payment. Once paid, all invoices must be marked “Paid” and initialed to avoid duplicate payment. Properly completed, approved, and numbered purchase requisitions (or purchase orders) shall be used for non-routine expenses prior to actual disbursement of funds.
Separation of duties/responsibilities: The board of directors shall assure that there is proper division of responsibility and function among persons who receive, deposit, account for, and expend funds in order to minimize the potential for loss, the unauthorized use of, or unauthorized disposition of system assets.
Financial-procedures manual: The board of directors shall insure that a financial-procedures manual is developed for the system. The manual shall describe routine accounting procedures and practices of the system. At a minimum, the manual shall provide for:
•routine procedures for the daily collection, recording, and deposit of receipts•the proper use of check registers, cash-receipts journals, payroll ledgers, monthly disbursement and
collections summaries, and the general ledger•proper operation of petty-cash account•proper maintenance of individual customer accounts and records•monthly bank-statement reconciliation procedures•proper cross-referencing of all accounting transactions between journals, ledgers, and source
documents.The procedures manual shall contain financial and accounting forms and documents used by the system and instructions for how and when each form or document is used.
Bank accounts: The system shall maintain appropriate, interest-bearing bank accounts for the operation of the system. Customer deposits shall be maintained in a separate interest-bearing account.
Disbursement of funds: All cash disbursements, including checks, automated clearing house (ACH) payments, wire transfers, bank drafts, etc., shall be evidenced by supporting documentation that is signed by two persons designated by the board of directors.
Cash receipts: All receipts shall be recorded in a cash-receipts journal then deposited daily intact. Deposits shall be made by a person other than the individual who records the receipts received. Cash receipts shall not be used to pay expenses of the system nor to cash personal checks of employees or others.

7 • The framework for financial management
CH
AP
TE
R 1
Petty-cash fund: The board of directors may allow for the creation of a petty-cash fund, not to exceed $____________, for the purpose of making change for customer cash payments and small purchases of less than $____________. The petty-cash fund shall be subject to procedures for its operation which are contained in the financial-procedures manual. The petty-cash fund shall not be used to cash checks of employees or others.
Capital assets: Tangible personal property and/or equipment purchased and/or installed by the system, having a per-unit acquisition cost greater than $____________ and useful life of ____________ months/years or more, will be logged into a “fixed-assets” inventory. Tangible property purchased by the system that does not meet this definition will be considered “supplies.” Procedures for cataloging and safeguarding fixed-asset and supply inventories shall be implemented by appropriate system personnel.
Monthly reporting: In addition to financial reports, the board shall receive monthly billing information, including: total billing amount, number of customers, total gallons sold, total gallons produced, and similar relevant information.
Financial-records retention: All financial records, including original source documentation, purchase requisitions, cancelled checks, and bank statements, shall be retained by the system for a period of least seven fiscal years prior to the current fiscal year, and/or as required by law.

8 • The framework for financial management
CH
AP
TE
R 1
Purchasing policies and purchase-requisition systemPurchasing policy: It is the policy of the board of directors that the purchase of goods and services shall be on a competitive and “least-cost” basis. Depending on the nature of the goods/services to be acquired, however, the board reserves the right to consider other factors aside from cost in the final procurement decision. Such factors may include: method and terms of payment, service availability, warranties and guarantees, delivery and set-up charges, operational expense, and reliability.
Purchase requisitions: A properly completed and approved purchase requisition (purchase order) shall be required prior to payment for all expenses and purchases, except routine expenses and purchases. “Routine” expenses and purchases are defined as regularly-scheduled or incurred expenses (such as payroll expenses, utilities, telephone, etc.).
Relation to budget: All purchases of goods and services are restricted to approved purposes as defined in the annual budget. Purchases of a single item or service, or the single procurement of a group of related items or services, the total of which exceeds $____________, shall be identified specifically in the annual budget.
Purchasing procedures: The following table indicates the proper procedure for procurement and purchasing for most goods/services to be used by the system.
Procurement Schedule
Value of item(s) to be procured Method of procurement/purchase
$0 to $500 Open-market purchase
$500 to $1,000 At least 3 oral quotations received prior to purchase
$1,000 to $5,000 At least 3 written quotations received prior to purchase
Over $5,000 Sealed competitive bids from qualified vendors
Board of directors approval: Any single purchase of goods/services by the system that exceeds $___________________ must be individually approved by the board. Purchase requests for such purchases must contain written quotations in accordance with the above procedures.
Trade accounts: The establishment of trade accounts (charge accounts) shall be only by board of directors approval. Monthly charge-account statements shall be reconciled to the original invoices and the general ledger within 3 working days after the receipt of the statements and prior to payment.
Conflict(s) of interest: Businesses or firms in which board members have a financial interest will not normally be considered as qualified vendors for supplying goods or services to the system. If, under extraordinary circumstances, the system must secure goods/services from such firms or business, they shall not receive preferential treatment in the procurement process. The reasons for each such procurement from such a firm shall be individually documented on any purchase requisition and must be in accordance with applicable state statutes. Actual or perceived conflicts of interest shall be subject to full disclosure requirements in the system’s financial statements.
Emergency purchases: When necessary to affect emergency repairs and/or equipment replacement to restore or maintain services, the requirements for bids or price quotations, oral or written, may be waived. Emergency purchases shall be documented on a purchase requisition with a written explanation of the emergency nature of the repairs within 2 working days of the repair.

9 • The framework for financial management
CH
AP
TE
R 1
Compensation and payroll policies
Compensation policy: It is the policy of the board of directors that compensation shall be paid that is non-discriminatory and that is competitive with rates paid for similar jobs by similar utilities in the area. All compensation decisions, however, must take into consideration the economic status of the system. The board may, from time to time, conduct surveys of other utilities to ascertain if adjustments in wage or salary levels should be made.
Pay procedures: The system shall compensate employees by check or direct-deposit on a regular basis and in such a manner so that the amount, method, and timing of payments comply with all applicable laws and regulations. Should a payday fall on a weekend (Saturday or Sunday), employees will receive their pay on the last working day prior to the regular payday. The system will not provide advanced payment of wages and salaries to employees.
Pay periods: The pay period for the system is [indicate one]: monthly/semi-monthly/bi- weekly/weekly, ending on the _____day and the _____day of each week/month.
Workweek/workday: The normal workweek of the system is Sunday through Saturday, beginning and ending at midnight on Saturday. The normal workweek consists of 40 hours. The normal workday is 8 consecutive hours of work, with an unpaid meal period and break periods.
Time and activity reports: In order to be paid, an employee must submit individual time reports showing the daily hours worked for each workweek. Time reports must provide sufficient detail to allow proper payment of each employee – including starting and quitting times, lunch-break time, un-worked time for which pay is entitled (paid vacation, paid absences), and overtime hours, if any. All time records shall be checked and approved prior to payment. Falsifying any time record is prohibited and will be grounds for disciplinary action, including termination.
Overtime hours: Overtime hours are all hours worked by a non-exempt employee more than 40 hours in any work week. Non-exempt employees shall receive compensation at the rate of 1.5 times their regular pay for each hour of overtime worked. All employees must receive prior approval for working overtime hours, unless otherwise provided by the board of directors. Exempt employees shall not receive overtime but may receive compensatory time off for all hours worked more than 40 hours. (Non-exempt employees are those employees covered by the wage/hour provisions of the Fair Labor Standards Act.)
Annual wage/salary review: The board of directors or supervisory personnel will conduct annual wage/salary reviews with each employee of the system. Decisions concerning possible wage or salary rate changes shall be based on job performance, length of service, and budgetary considerations. All pay changes for employees shall be approved in writing by the board prior to submission to accounting personnel.

10 • The framework for financial management
CH
AP
TE
R 1
Financial procedures manualOne of the most vital documents relating to the financial management of your utility is the financial procedures manual. This important manual is individualized to your specific utility and describes in detail how and when major financial tasks will be carried out and which personnel are responsible for their completion. For example:
Accounts receivable• How are monthly billings accomplished,
by whom, and by when?• How are monthly payments
collected, receipted and posted, by whom, and by when?
• How are individual customer accounts and charges maintained?
• How are cash payments handled?• How are payments deposited with financial
institutions, by whom, and how often?• How are billing adjustments/
mistakes resolved, under what circumstances, and by whom?
Accounts payable• Who receives and tracks vendor invoices?• How are invoices approved and
processed for payment?• How are goods and services
ordered and tracked?• How are goods or services that have
been ordered verified as received?• How are fund disbursements coded,
logged, and verified against the approved budget?
Reconciliation procedures• How are billings, receipts, and
payments reconciled with ledgers and accounts of the system?
• How are daily and monthly financial transaction reports reconciled with bank statements?
• How are cash transactions and petty-cash funds reconciled, by whom, and how often?
Financial reporting• How will financial reporting (income
statements, balance sheets, etc.) be accomplished, by whom, and by when?
• How are various IRS reporting and record-keeping requirements going to be met? What about withholding tax reports, sales-tax reports, unemployment tax and worker’s compensation reports?
A financial procedures manual should describe in detail how these functions and tasks will be accomplished. Staff turnover and changes in job responsibilities can affect any utility at any time. If necessary, contact your system accountant or auditing firm for assistance in developing your written financial procedures.

11 • Planning for your system’s financial future
CH
AP
TE
R 2
Chapter 2Planning for your system’s financial futureOne of the most important responsibilities as the manager or member of the board of directors of your utility is planning for the financial future of your system.
A financial plan is basically a two-part process composed of:• forecasting the utility’s future financial needs (operating and capital needs)•determining how those future financial needs will be met
Capital-improvements planningA capital-improvements plan (called a CIP for short or sometimes called a long-range plan) is a written document that specifies:• what facility improvements will be needed
in the future• when the improvements will be needed and
when they will be undertaken• how much the improvements will cost• what financing options are available for the
improvements
Covering at least a ten-year period of time into the future, a capital-improvements plan will help your utility’s board and management make informed decisions about rate setting, future debt-service requirements, and future revenue requirements.
In preparing a capital-improvements plan, a number of considerations are taken into account, such as:•Will current facilities reach their design
capacity in the near future?•What new equipment, services, or facilities
are needed to meet the demand of your customers?
•What current system components will require major repair, rehabilitation, or replacement?
•Will failure to upgrade existing facilities result in regulatory violations or enforcement actions?
•What are the most critical improvement needs, and what is the urgency of meeting those needs?
•What benefits do the improvements provide to the system and to its customers?
•What are the available options for financing the improvements?
•Which capital projects can be financed through the regular resources of the system, and which projects will require outside financing?
•How do financing options for improvements relate to the annual budgeting process?
Use the assistance of a consulting engineer to prepare cost estimates for major capital-improvement projects that might be needed in the future.
12 • Planning for your system’s financial future
CH
AP
TE
R 2
Separating capital needs and projectsThere is a tendency to talk of capital-improvements planning in terms of short-term and long-term needs. A more practical approach for separating capital-improvements projects is to develop separate schedules of improvement projects based on how those projects will be financed, such as:• improvements that can be undertaken
and completed with the utility’s own financial resources
•major capital improvements that can be completed only with outside financial assistance (bond issues, loans, grants, etc.)
The role of financial reserve accountsThe purpose of financial-reserve accounts is to hold funds that are dedicated for specific uses. Your financial-reserve accounts are built up over time with revenues from the operation of the facility. Four specific reserve accounts are recommended for water and wastewater utilities (see also Financial reserves previously mentioned in the Sample Financial- Management policies section of Chapter 1):
1. Debt-service reserve: A debt-service reserve is usually required by a lender or bond-covenant agreements. The debt-service reserve is for making regular debt-service payments should other funds for making debt-service payments not be available. (USDA Rural Utilities Service, for example, requires a debt-service reserve of 10 percent of the annual principal and interest payment, accumulated over a ten-year period.)
2. Emergency reserve: An emergency reserve fund is for unforeseen and unplanned emergency repairs that may occur during the year, such as major line breaks, pump breakdowns, etc. The recommended fund level for emergency reserves will vary from system to system. Review the average
annual amounts spent on emergency repairs over the past five years to get an estimate for what your emergency-reserve levels could be.
3. Planned equipment repair/replacement reserve: This reserve fund is for the planned repair, rehabilitation, or replacement of equipment. In particular, this reserve is meant for the replacement of those items that have a useful life that is significantly shorter than the system as a whole. (This reserve may also be called a short-lived assets reserve.)
4. (Major) Capital-improvements reserve: A capital-improvements reserve is the accumulation of funds that will be devoted to pay for part of the cost of large, future capital-improvement projects that might be needed for the upgrade of existing facilities or construction of new facilities. Most of the cost for major capital-improvement projects will be paid with outside sources of financing. (For small water or wastewater systems—those with a small customer base and lower annual revenues—it might not be possible to fund a major capital-improvements reserve at all without increasing rates above an affordable level.)
Planned repair and replacementA planned equipment replacement, repair and rehabilitation program is an example of how your utility can use its own financial resources to fund minor capital improvements.
Through a planning process sometimes referred to as “asset management”1, decision-makers can identify, prioritize and schedule the repair, replacement or rehabilitation of critical system components. The cost of completing these types of improvements would be funded through an equipment-repair/replacement reserve. An equipment repair and replacement program is particularly important for replacing critical assets with a useful and serviceable life that is much shorter than the entire system.
_____________ 1 The Environmental Protection Agency has numerous publications, tools, and resources on asset management. For more information, visit the EPA Small Systems website at http://water.epa.gov/type/drink/pws/smallsystems/managementhelp.cfm

13 • Planning for your system’s financial future
CH
AP
TE
R 2
Table 1: Sample equipment-repair and -replacement scheduleFor year beginning: January 1, 2012
Item/descriptionof work
estimated usefullife or frequency
estimated totalcost
planned year ofreplacement or repair
Funds needed annually for repair and replacement reserve
Clean and paint storage tank #1
Every 10 years $50,000 2015 $5,000
Replace well pump #1
8-10 years $12,000 2016 $1,500
Replace well pump #2
8-10 years $12,000 2016 $1,500
Replace electrical controls
10 years $10,000 2016 $1,000
Meter replacement program
15 years 200 meters/year at $200 per meter
Beginning 2013 $4,000
Clean and paint storage tank #2
Every 10 years $50,000 2020 $5,000
Total annual reserve amount $18,000
(Dollar values are for purposes of illustration only)
The following is an example of an equipment-repair and -replacement schedule:
14 • Annual operating budgets
CH
AP
TE
R 3
Preparing a budgetYou should begin the process of forming the annual operating budget well in advance of the start of each new fiscal year. Ideally, the governing body should adopt the final annual operating budget no later than 30 days prior to the start of the new fiscal year.
Your utility’s financial records are critical for creating a budget. The utility’s management should take into consideration:• previous expenses from the past 2 to 3 fiscal years• current debt-service requirements • any unplanned “emergency” expenses that occurred within the past several years• revenues from customer billings and other sources of income for the past several years• required “reserve” levels necessary for the coming year
In addition to previous years’ revenue and expense records for the utility, consideration must be given to anticipated changes to those revenues/expenses during the coming year, including:• anticipated changes in operating expenses, such as wage/salary increases, new hires, changes
in costs of materials, supplies, transportation, electricity, and other utilities, as well as adjustments for inflation
• changes in debt-service expenses, including anticipated new debt• changes in revenues due to expected rate and fee adjustments, growth or decline in the
customer base, etc.• expected transfers to/from financial reservesYour annual operating budget should have budget categories that match the revenues and expenses in your utility’s chart of accounts.
When your final budget plan has been completed, a projected cash-flow statement should be prepared to verify that monies will be available when needed.
Finally, your annual budget needs to be “balanced.” A balanced budget is a budget in which anticipated expenses do not exceed anticipated revenues. If expenses for operations, debt service and transfers to reserves exceed your revenue, it is time to look at a rate adjustment.
Chapter 3Annual operating budgetsUnlike the planned-repair and -replacement budget or the major capital-improvements budget, your annual operating budget is a short-term, 12-month financial plan. The operating budget coincides with the fiscal year of your system and is simply a one-year forecast of your utility’s expected revenues and expenses.
The budget helps your utility’s decision-makers keep adequate control of the finances and provides adequate funding to the highest-priority areas of system. The operating budget may be a separate document, but it should be compatible with your utility’s long-range financial plans.

15 • Annual operating budgets
CH
AP
TE
R 3
In Table 2: Budget projection, on page 16, which is for a fictional utility, the actual revenues and expenses from previous years (2009 and 2010) and current budget year (2011) are compared. In columns E and F, the differences among the three fiscal years are calculated to determine the growth or decline in the previous years’ budget numbers.
In column F, the utility’s board and management noted that total revenues for the system grew over the three-year period by only about one tenth of one percent (.11%). Meanwhile, total operating expenses over the same period grew by almost six percent (5.72%), resulting in a reduction of net operating income and net income over the three-year period from 2009 through 2011 of more than 21%. Significant increases in system operating expenses over the three-year period have occurred in salaries, fringe-benefit costs, electricity and utility costs, insurance expenses, contract labor, and repair and maintenance costs.
In column G, the FY (fiscal year) 2012 projected budget numbers have been prepared. The governing board and management of this example utility have proposed a water rate increase of 2.5% for the 2012 fiscal year. As a result, revenues from water sales will increase from $665,000 in 2011 to $681,625 in 2012. Net income for the 2012 fiscal year is projected to increase from $59,871 in 2011 to $73,688 in 2012.
In Table 3: projected Budget, FY 2012, on page 17, the budget for the fiscal year is presented for final adoption. In addition to the projected budget numbers and budget categories, Table 3 lists the “assumptions” that were made in preparing the budget. The primary assumptions that were made include a 2.5% average water-rate increase for the year and that all operating expenses would remain approximately the same as they were in 2011.
After the budget is completed, it is necessary to create a projected cash-flow statement in order to determine whether the budget would have a positive cash flow during the year.
Table 4: projected Cash-flow Statement, FY 2012, on page 18, shows the projected cash flow for the coming fiscal year. In the cash-flow statement, the net income is added to items not requiring cash (depreciation expense). Items that do require cash (that is, the system’s loan principal payment and a $20,000 expenditure for improvements) are subtracted from the projected total of net income and items not requiring cash. As you can see in Table 4, the projected cash-flow statement indicates that the utility will have a positive cash flow during FY 2012. The ending cash balance will be greater than the beginning cash balance by a total of $105,688.
Although it is not required, the bottom of Table 4 illustrates how the projected $105,688 in additional income will be distributed among the operating and reserve accounts during fiscal year 2012.

16
Table 2: Budget Projectiona B C D e F G
Revenueactual 2009
actual2010
Current Year2011 Budgeted
3-yr Diff + or -
% Diff projected
3-year period 2012 Budget*
Water Sales 665,091 661,363 665,000 -91 681,625
Misc. Construction & Meter Conn. 10,831 19,293 12000 1,169 12,000
Membership Fees Received 1,305 1,200 1000 -305 1,000
Total Revenue $677,227 $681,856 $678,000 $773 0.11% $694,625
Operating expenses
Salaries & Fringe Benefits 153,700 180,381 181,500 27,800 184,000
Depreciation Expense 118,338 112,598 115000 -3,338 115,000
Service Supplies 70,555 61,460 60000 -10,555 60,000
Electricity & Utilities 40,634 45,647 45000 4,366 45,000
Insurance 33,702 40,786 40000 6,298 40,000
Contract Labor 29,484 35,545 32000 2,516 32,000
System Repair & Maintenance 19,498 24,816 22500 3,002 24,000
Taxes & Licenses 17,482 16,696 17000 -482 17,500
Fuel & Oil 11,990 13,408 13500 1,510 13,500
Telephone 7,761 9,701 9500 1,739 9,500
Bad-debt Expense 2,663 6,646 4000 1,337 4,000
Legal & Accounting 5,585 4,829 5000 -585 5,000
Miscellaneous 4,294 4,385 4300 6 4,300
Postage 4,659 4,374 4500 -159 4,500
Office Expenses 3,699 3,320 3200 -499 3,200
Continuing Education 3,603 2,913 3000 -603 3,000
Uniforms 3,226 2,841 3000 -226 3,000
Testing & Analysis 2,941 2,662 3000 59 3,500
Truck Expense 4,452 2,094 3000 -1,452 3,000
Bank Charges 90 132 150 60 150
Total Operating expenses $538,356 $575,234 $569,150 30,794 5.72% $574,150
NeT Operating Income (LOSS) $138,871 $106,622 $108,850 ($30,021) -21.62% $120,475
Other Income & expenses
Interest Income 12,230 20,000 18,500 6,270 $18,000
Gain on Sale of Equipment 0 13,295 750 750 0
Interest Expenses -75,113 -71,671 -68,229 6,884 -64,787
Total Other Income & expenses -62,883 -38,376 -48,979 -46,787
NeT INCOMe (LOSS) $75,988 $68,246 $59,871 ($16,117) -21.21% $73,688
* FY 2012 budget projects a 2.5% water-rate increase

17
Table 3: Projected Budget 2012
Revenueprojected
2012 Budget* Primary Budget Assumptions
Water Sales 681,625 *2.5% avg water-rate increase
Misc. Construction & Meter Conn. 12,000
Membership Fees Received 1,000
Total Revenue $694,625
Operating expenses
Salaries & Fringe Benefits 184,000 Operating expense approximates 2011
Depreciation Expense 115,000 Operating expense approximates 2011
Service Supplies 60,000 Operating expense approximates 2011
Electricity & Utilities 45,000 Operating expense approximates 2011
Insurance 40,000 Operating expense approximates 2011
Contract Labor 32,000 Operating expense approximates 2011
System Repair & Maintenance 24,000 Operating expense approximates 2011
Taxes and Licenses 17,500 Operating expense approximates 2011
Fuel & Oil 13,500 Operating expense approximates 2011
Telephone 9,500 Operating expense approximates 2011
Bad-debt Expense 4,000 Operating expense approximates 2011
Legal & Accounting 5,000 Operating expense approximates 2011
Miscellaneous 4,300 Operating expense approximates 2011
Postage 4,500 Operating expense approximates 2011
Office Expenses 3,200 Operating expense approximates 2011
Continuing Education 3,000 Operating expense approximates 2011
Uniforms 3,000 Operating expense approximates 2011
Testing & Analysis 3,500 Operating expense approximates 2011
Truck Expense 3,000 Operating expense approximates 2011
Bank Charges 150 Operating expense approximates 2011
Total Operating expenses $574,150
NeT Operating Income (LOSS) $120,475
Other Income & expenses
Interest Income $18,000
Gain on Sale of Equipment 0
Interest Expenses -64,787
Total Other Income & expenses -46,787
NeT INCOMe (LOSS) $73,688

18
A. Projected Net Income or Loss $73,688
Add
B. Items in Operations not Requiring Cash:
1. Depreciation Expense $115,000
2. Others: ________________________________________ $0
C. Cash Provided from:
1. Proceeds from Loans/Grant Fund Financing Sources $0
2. Proceeds from Others $0
3. Increase (decrease) in Accounts Payable, etc. $0
4. Decrease (increase) in Accounts Receiveable, etc. $0
5. Other: _________________________________________ $0
6. _______________________________________________
D. Total all A,B,C Items $188,688
E. Less: Cash Expended for:
1. Construction, Equipment, New Capital (Loan & Grant Funds) $0
2. Rehabilitation, Replacement of Existing Plant, Equipment $20,000
3. Loan Principal Payment-Primary Lender $63,000
4. Principal Payments Other Loans $0
5. Other: _________________________________________ $0
6. Total E1 through 5 $83,000
Add
F. Beginning Cash Balances $528,000
G. Ending Cash Balances (Total of D minus E6 Plus F) $633,688
Item G Cash Balances Composed of:
estimatedBalances12/31/11
projectedaccount
Transfers
projectedBalancesFY 2012
General Operating Account $180,000 $26,688 $206,688
Emergency Reserve $90,000 $11,000 $101,000
Debt-service Reserve $128,000 $0 $128,000
Equipment Repair/Replacement $30,000 $18,000 $48,000
Capital-improvements Reserve $100,000 $50,000 $150,000
Total (agrees with Item G) $528,000 $105,688 $633,688
Check Transfer Amt: $105,688
Table 4: Projected Cash Flow 2012

19 • Oversight and monitoring of financial performance
CH
AP
TE
R 4
Chapter 4Oversight and monitoring of financial performanceAfter budgets have been prepared and the plans have been completed, the job of monitoring your system’s financial performance begins. Financial oversight allows you to know that everything is proceeding according to plan and that, financially speaking, your utility is on the right track.
Providing effective financial oversight means not only monitoring and adjusting the current operating budget, but it also means understanding common financial statements (such as the balance sheet, the annual income statement, and audit reports) and making informed decisions about the future based upon the important information these statements provide.
The remainder of this publication discusses in detail the monitoring and oversight functions of a utility’s governing body and management.
Monitoring the annual budgetYour governing board should receive and review financial reports every month. The monthly financial reports compare the current year’s line-item budget to the actual revenues received and expenditures incurred. A sample monthly income statement, part of a financial report, can be found in Table 5 on page 20.
In column D, “Budget target number,” you will see the target (planned) revenue and expenditures for the first nine months of the budget year. In this sample, the report is for the month ending September 30, 2011, which is month number nine of the fiscal year. The budget targets in Table 5 represent 75 percent of the annual budget (9 months divided by 12 months = 75%).
In column E, “Actual difference (over or under) budget target,” the difference between each line item’s (row) target value and the actual revenue or expense is shown. For revenue line items (items in the revenue category), a positive number (+) indicates that revenues are below the projected revenue target, and a negative number (-) indicates
that the revenue line item exceeded the projected target. For expense line items (items in the expenses category), a negative number (-) means that expenses are currently over budget, and a positive number (+) means the expense line-item is currently under budget.
Table 5 provides one example of how an annual operating budget can be monitored, and, if necessary, adjusted during the fiscal year. In this sample financial report, actual total revenues are slightly less than the budget target number, and the total operating expenses are $20,143 less than the budget target.
Note: Some of the elements shown in Table 5 may not appear in your utility’s monthly income statement, and the column headings in your statement may be different than this example’s headings. This example provides more than the usual amount of text in some elements, such as the column labels, in order to explain what type of information is in the statement. Don’t hesitate to ask the person who prepares your utility’s financial reports to explain the parts of a report or even to provide different labels or details in a report.

20
Table 5: Sample Monthly Income Statementa B C D e
Name of Utility: Sample Utility
For the Last Full Month Ending: September 30, 2011
Total Number of Full Months for This Report 9
Total Number of Months-Full Fiscal Year 12
RevenueCurrent Year
2011 BudgetedCurrent Yr
actual
Budget Target
Number
actual Difference(Over or Under)Budget Target
Water Sales 665,000 496,341 498,750 2,409
Misc. Construction & Meter Conn. 12000 6,634 9,000 2,366
Membership Fees Received 1000 457 750 293
Total Revenue $678,000 $503,432 $508,500 $5,068
Operating expenses
Salaries & Fringe Benefits 181,500 139,500 136,125 -3,375
Depreciation Expense 115000 86,250 86,250 0
Service Supplies 60000 40,000 45,000 5,000
Electricity & Utilities 45000 31,267 33,750 2,483
Insurance 40000 30,000 30,000 0
Contract Labor 32000 18,769 24,000 5,231
System Repair & Maintenance 22500 11,340 16,875 5,535
Taxes & Licenses 17000 8,976 12,750 3,774
Fuel & Oil 13500 10,765 10,125 -640
Telephone 9500 7,500 7,125 -375
Bad-debt Expense 4000 450 3,000 2,550
Legal & Accounting 5000 4,000 3,750 -250
Miscellaneous 4300 3,500 3,225 -275
Postage 4500 4,000 3,375 -625
Office Expenses 3200 1,895 2,400 505
Continuing Education 3000 1,587 2,250 663
Uniforms 3000 2,450 2,250 -200
Testing & Analysis 3000 2,500 2,250 -250
Truck Expense 3000 1,876 2,250 374
Bank Charges 150 95 113 18
Total Operating expenses $569,150 $406,720 $426,863 $20,143
NeT Operating Income (LOSS) $108,850 $96,712 $81,638
Other Income and expenses
Interest Income $18,500 $9,000 13,875 4,875
Gain on Sale of Equipment 750 50 563 513
Interest Expenses -68,229 -51,172 -51,172 0
Total Other Income and expenses -48,979 -42,122 -36,734 5,388
NeT INCOMe (LOSS) $59,871 $54,590 $44,903

21 • Oversight and monitoring of financial performance
CH
AP
TE
R 4
Standard financial statementsThe key for determining the financial performance and financial sustainability of your utility will be found in the financial statements produced by your bookkeeping staff, accountant or independent auditor. The standard financial statements of primary importance for monitoring financial performance are:
• The balance sheet (sometimes called the statement of financial position) shows the system’s net worth—how much the system is worth at a particular point in time.
• The income statement (or statement of activity) shows the results of operations over a period of time—how much revenue the system has earned vs. the amount of expense it has incurred.
• The cash-flow statement breaks down all of the financial transactions of the system in terms of how they affect the flow of cash.
Financial statements often present information comparatively. The balances from the current and previous year are shown side-by-side, which allows for easy comparison between periods. The remainder of this section will cover these standard financial statements in detail.
The balance sheetThe balance sheet has three components:
• assets
• liabilities
• equity
The heading of the balance sheet includes the date—the point in time for which the balance sheet is relevant. The heading of Table 6: Sample Balance Sheet, page 22, shows the date December 31, 2010, and compares the numbers for 2010 to those of the previous year.
It is called a “balance sheet” because the numbers on the sheet must be in balance. This means the total assets must equal the total liabilities and equity:
liabilities + equity = total assets What if the liabilities of your utility are more than its assets? In that case, your system has what is called “deficit equity.” Deficit equity occurs when the system has incurred more in net losses over the life of the system than net income. Deficit equity will typically be noted by parentheses around the numbers in the equity section of the balance sheet. Particular care should be taken when reviewing the balance sheet of a system with deficit equity. Questions should be asked to determine how the system got into a deficit position, and a plan should be formulated for moving the system back to a stable, or “positive-equity,” position.

22
aSSeTS 2010 2009
Current assets
Cash & cash equivalents 496,474 253,573
Accounts receivable 60,026 65,040
Prepaid expenses 4,982 4,957
Short-term investments 2,219 0
Inventory 14,248 15,302
Total Current assets $577,949 $338,872
Fixed assets
Land 6,950 6,950
Property, plant & equipment at cost 2,915,599 2,915,599
Less accumulated depreciation -1,636,060 -1,523,462
Total Inventory 1,286,489 1,399,087
Long-term Assets
Investments 86,660 186,660
Total Long-term assets 86,660 186,660
TOTaL aSSeTS $1,951,098 $1,924,619
LIaBILITIeS aND NeT aSSeTS
Current Liabilities
Accounts payable 8,452 7,987
Current portion of long-term debt 56,123 54,238
Withheld & accrued payroll taxes 3,158 3,479
Accrued interest 13,335 0
Meter deposits 43,504 44,602
Other accruals 1,425 1,335
Total Current Liabilities 125,997 111,641
Long-Term Liabilities
Long-term notes payable 1,297,938 1,354,061
Total Long-Term Liabilities 1,297,938 1,354,061
equity
Contributed capital (membership) 56,415 56,415
Donated capital (govt. grants) 1,720,300 1,720,300
Retained earnings -1,249,552 -1,317,798
Total equity 527,163 458,917
TOTaL LIaBILITIeS & NeT aSSeTS $1,951,098 $1,924,619
Table 6: Sample Balance Sheet

23 • Oversight and monitoring of financial performance
CH
AP
TE
R 4
AssetsAssets are the total economic resources of a system that are expected to provide benefits to the system in the future. Assets are normally listed in liquidity order, which means they are listed based on how easy they are to convert to cash. So naturally, the first item listed will be cash and cash equivalents. The assets section is also broken down into:
• current assets
• long-term assets
•property, plant and equipment
Current assetsCurrent assets are items than can be converted into cash within one year of the date of the balance sheet. Current assets include cash and cash equivalents, accounts receivable, inventories, short-term investments and prepaid assets.
•Cash and cash equivalents include the amount of money currently available in the system’s demand accounts. Cash equivalents include any security that has a maturity date of less than 90 days. The sample balance sheet includes a certificate of deposit in the cash and cash equivalents line that will mature on February 28, 2011, less than 90 days from the balance sheet’s statement date of December 31, 2010.
•accounts receivable is money owed to the system. This includes things like outstanding water bills, connection fees owed to the system, and reconnection fees.
•prepaid expenses are expenses paid in advance; for example, an insurance policy that is purchased, and its annual premium is paid up front. The value of the insurance premium will be recorded as a prepaid asset
until the premium is used. In the balance sheet example, prepays of $4,982 are listed, which is the result of a property insurance premium paid on December 15, 2010. The insurance policy is effective from January 1, 2011, through December 31, 2011. Because the system will receive the benefit of this policy during the next fiscal year (2011), the amount paid is considered an asset on the effective date of the example balance sheet—December 31, 2010.
•Short-term investments include investments with maturities more than 90 days from the balance sheet’s date but less than one year from the balance sheet’s date. On the sample balance sheet, the short-term investments include certificates of deposit with maturity dates of July 8, 2011, and December 26, 2011.
• Inventory includes the value of products related to the business that are, or will become, available for use or sale within the next year, such as new meters, pipe, equipment, and replacement parts.

24 • Oversight and monitoring of financial performance
CH
AP
TE
R 4
Fixed assetsFixed assets are the land, buildings, furniture and fixtures that the system owns and uses in day-to-day operations. On the sample balance sheet, fixed assets are broken down to show the value of each category. The amount of accumulated depreciation is then subtracted to “net down” to the book value of the assets. Some systems may choose to show only the book value of the assets on their financial statements. Both presentations are acceptable.
What does depreciation mean in terms of fixed assets? Over time, the value of fixed assets is “used up,” and you must account for the decrease in value of these assets from the normal wear and tear due to age and typical use. This is done by recording depreciation.
There are several methods for calculating depreciation. Under all methods, the system’s managers must determine the lifespan of the asset, or how long they expect to be able to use the asset.
Long-term assets
Long-term assets include items that cannot be converted to cash within one year of the date of the balance sheet. Common examples of long-term assets include investments with maturity dates more than one year. In the sample balance sheet, the utility has a certificate of deposit with a maturity date of January 2, 2012 – two days longer than one year.
The easiest method of calculating depreciation is the straight-line method. For example, the normal lifespan of a building is 30 years. If a building initially costs $100,000 and has a life of 30 years, it will depreciate $3,333 ($100,000/30 years) per year. The building will “use up” $3,333 in value each year; so this year it is worth $3,333 less than last year, and next year it will be worth $3,333 less than this year, and so on. The amount of what is used up is tracked and added together in the accumulated depreciation account.
The accumulated depreciation is separated from the original cost in order to see what was paid originally for the asset and how much of the asset has been used up. The net value of the asset (or book value) provides the utility’s management a current estimate of the value of the plant, property or equipment. Land value does not depreciate.
Total assetsAdding current assets to fixed assets and long-term assets provides the total assets.
current assets + fixed assets + long-term assets = total assets The next step is to determine your system’s liabilities and equity, or what your system owes and what it is worth.
25 • Oversight and monitoring of financial performance
CH
AP
TE
R 4
Current liabilitiesCurrent liabilities include current maturities of long-term debt, accounts payable, accrued liabilities, and other short-term notes to be paid. Long-term liabilities are loans expected to be paid back over several years.
On the sample balance sheet, the current liabilities are broken down into:
•accounts payable: what the system owes for the normal operations of business, such as utility (electricity, etc.) bills, office supplies, and reimbursement to employees for travel expenses.
•Current portion (maturities) of long-term debt: This refers to the principal amount the system will be required to repay on long-term loans during the next twelve months. This figure does not equal the total payment amount, as that includes both the interest and the principal. The current maturities line item records only the principal that is being repaid. This amount can be obtained by reviewing the payment schedule of each outstanding loan and adding up the principal portion of each monthly payment for the next 12 months.
• accrued liabilities are basically the same as accounts payable, in that they represent
LiabilitiesLiabilities are what your system owes to others. The liabilities section of a balance sheet is divided into two components—current liabilities and long-term liabilities.
what your system owes to others. However, the difference between accrued liabilities and accounts payable relates more to whom the amounts are owed. Accounts payable usually refers to items the system has purchased in the normal course of operations to support the ongoing activities of the system. Accrued liabilities are typically items that would be owed to employees, such as salaries, unpaid vacation/sick time, and payroll taxes withheld from employees’ checks but not yet remitted to the taxing agency. Accrued liabilities also include security or meter deposits from customers (these are considered liabilities because the expectation is that the system will have to return them to the customer).
•accrued interest is the interest that has been incurred but not paid. For example, many systems have long-term loans or bonds that require only annual or semi-annual payments. Even though the system has not paid interest during the months between payments, it still has incurred the interest and owes it to the lender. The system will be required to pay this incurred interest with the next regular payment. The system should record the interest as it is incurred on its balance sheet as an accrued, current liability.
Long-term liabilitiesLong-term liabilities include investments and the portion of payments to be made over the next several years that are not included in the current liabilities. For example, if you took out a capital-improvements loan that you were scheduled to pay back over the next five years, the principal amount to be repaid within the next year would be recorded in current liabilities, and the remaining principal scheduled to be paid back in years 2 through 5 would be listed as a long-term liability.

26 • Oversight and monitoring of financial performance
CH
AP
TE
R 4
EquityThe final section of the sample balance sheet covers equity (or net assets). Depending on the legal structure of your system (for-profit vs. governmental unit vs. nonprofit), this section will have various names. Other names include: net assets, fund balance, or owner’s equity.
Equity is the net value of the system over time. Equity is what would be left if the utility closed its doors, paid off all of its outstanding bills, collected everything that it was owed, and sold all of its assets for exactly the same prices as they were recorded in the financial statements. The system increases its equity
Reviewing the balance sheet
Now that you know the components of the balance sheet, it is time to put this knowledge to use.
First, look for changesLook for significant changes from one year to the next on a comparative statement. It is important to know why changes are taking place so that you will know if corrections need to be made immediately to keep the system in the black. Questions to ask include:
•Why did the value of fixed assets increase or decrease?
•Was new equipment purchased and installed?
•Was equipment sold or otherwise disposed of?
•Why did account receivables rise or drop dramatically?
•Was there a breakdown in bill collections or an increase in efforts to collect outstanding bills?
•Were new customers added, or were large water consumers lost?
each year it earns a net income—or has more revenue than expenses. In turn, a system decreases its equity each year it incurs a net loss—or has more expenses than revenue.
Looking at the sample balance sheet, you will see that if the system ceased operations on December 31, 2010 , paid its outstanding liabilities, collected the accounts receivable, and sold the inventory and fixed assets for the amounts listed in the financial statement, it would have cash in the bank of $527,163.
Equity increases for each year that a net income is recorded.
Second, calculate important ratiosCalculating a few common ratios can also provide a better picture of the system’s overall financial health. The two most important are liquidity ratios and leverage ratios.
Liquidity ratio or current ratio
The liquidity ratio (or current ratio) measures a system’s ability to pay off current liabilities. Systems with less than a 1.5 liquidity ratio are considered to be in financial distress. To calculate the liquidity ratio, simply divide the balance sheet’s current assets by the current liabilities:
current assets ÷ current liabilities = liquidity ratio
On the sample balance sheet (for 2010):•Current assets: $577,949•Current liabilities: $125,997
Using the formula above to calculate, you will arrive at a liquidity ratio of 4.59:
$577,949 ÷ $125,997 = 4.59Judging from this liquidity ratio, the sample rural water system is in safe financial waters.

27 • Oversight and monitoring of financial performance
CH
AP
TE
R 4
Leverage ratio
The leverage ratio measures how much the system relies on debt. A leverage ratio below 0.30 indicates that the system may be in financial distress. The leverage ratio is determined by dividing the equity by total assets:
equity ÷ total assets = leverage ratioOn the sample balance sheet (for 2010):•Total equity: $527,163•Total assets: $1,951,098:
Using the formula above to calculate, you will arrive at a leverage ratio of 0.27:
$527,163 ÷ $1,951,098 = 0.27The utility has a heavy debt load compared to actual value, which means that this system could be considered to be in financial distress. Keep in mind, however, that these ratios are only indicators. They should be used as tools to help guide the review of financial statements and not as anything absolute. One ratio alone will not determine the financial health of a system. These and other ratios should be considered together.
Throughout the remainder of this publication you will learn to use different tools and to look at all of the numbers and ratios available to you in order to develop a true understanding of your utility’s financial health.
28
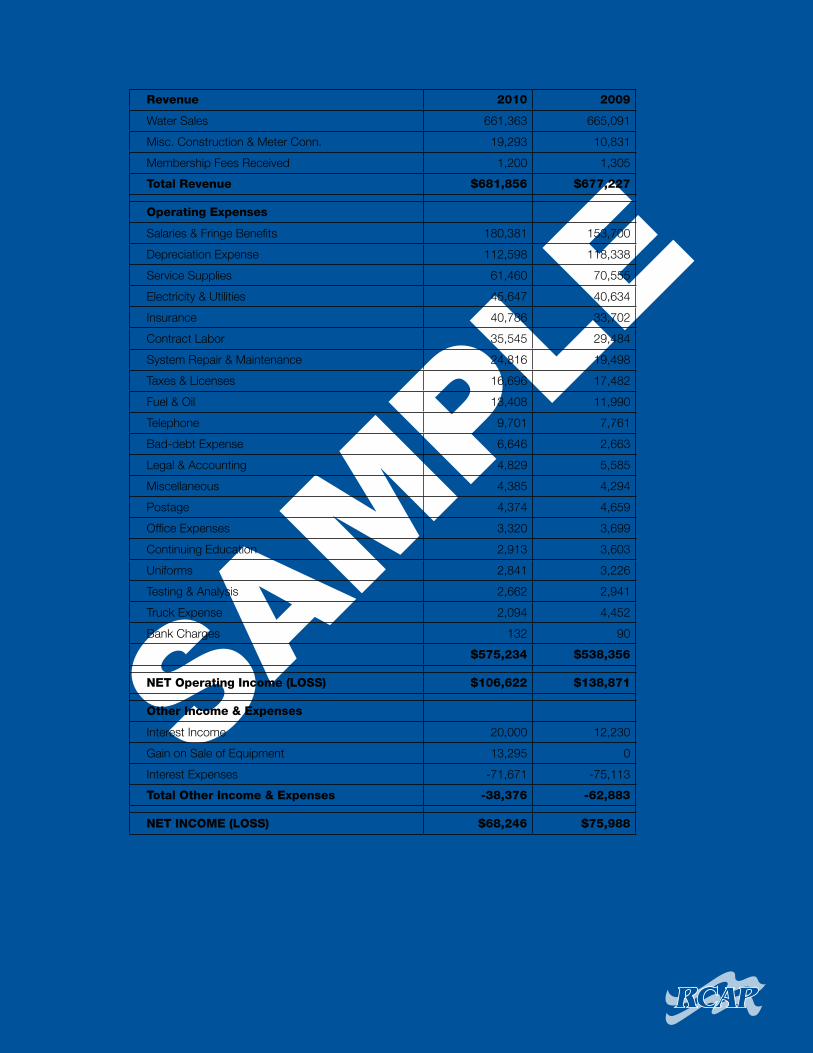
Table 7: Sample Income Statement
Revenue 2010 2009
Water Sales 661,363 665,091
Misc. Construction & Meter Conn. 19,293 10,831
Membership Fees Received 1,200 1,305
Total Revenue $681,856 $677,227
Operating expenses
Salaries & Fringe Benefits 180,381 153,700
Depreciation Expense 112,598 118,338
Service Supplies 61,460 70,555
Electricity & Utilities 45,647 40,634
Insurance 40,786 33,702
Contract Labor 35,545 29,484
System Repair & Maintenance 24,816 19,498
Taxes & Licenses 16,696 17,482
Fuel & Oil 13,408 11,990
Telephone 9,701 7,761
Bad-debt Expense 6,646 2,663
Legal & Accounting 4,829 5,585
Miscellaneous 4,385 4,294
Postage 4,374 4,659
Office Expenses 3,320 3,699
Continuing Education 2,913 3,603
Uniforms 2,841 3,226
Testing & Analysis 2,662 2,941
Truck Expense 2,094 4,452
Bank Charges 132 90
$575,234 $538,356
NeT Operating Income (LOSS) $106,622 $138,871
Other Income & expenses
Interest Income 20,000 12,230
Gain on Sale of Equipment 13,295 0
Interest Expenses -71,671 -75,113
Total Other Income & expenses -38,376 -62,883
NeT INCOMe (LOSS) $68,246 $75,988

29 • Oversight and monitoring of financial performance
CH
AP
TE
R 4
The income statementThe balance sheet provides a good snapshot of where the system stands at a particular point in time. But what about over a longer period of time? Are budget goals being met? Is equity growing or shrinking?
The best way to answer these questions is with the income statement. Sometimes referred to as the statement of activities, the income statement shows the results of operations over a specific period of time, much like a scoreboard does during a single football game. Just as you clear the scoreboard at the end of the game, the income statement starts over at the end of a set time period, such as at the end of a fiscal year.
The income statement shows how much revenue a water system has earned and how much expense it has incurred during the specified period. Income and expenses are broken down by type to provide a better understanding of how the system generates revenue and how it spends it.
Generally, the income statement tracks revenue and expense on a 12-month basis. This period is called the system’s fiscal year. For the example utility used in this publication, the fiscal year coincides with the calendar year—January 1 through December 31. Some systems may have fiscal years that begin at a different point during the calendar year, such as July or October. At the end of the fiscal year, all revenues and expenses incurred during that year are moved to the equity section of the balance sheet.
Reading the income statementTo understand the income statement, the best place to start is at the very top. Look at Table 7: Sample Income Statement on page 28. The heading provides valuable information, including the name of the system and the time period covered by the statement.
A heading that reads, for example, “for the month ending June 30, 2010” means the statement shows revenue and expenses incurred during June 2010 only. A heading that reads,
for example, “for the quarter ending June 30, 2010” indicates that the document covers revenue and expenses incurred from April 1 to June 30 of 2010. A heading that reads, “for the year ending June 30, 2010,” would cover the entire fiscal year, which in this case takes place from July 1, 2009, to June 30, 2010.
The time frame indicated in a statement’s heading is important because it lets you know when the revenue listed has been earned and when the expenses have been incurred. It is important to stress earned and incurred because the system may not have collected or paid the cash as of the date of the income statement, but it is entitled to the revenue and is obligated to pay the expenses. It is common to have a time difference between the date you record the financial information and the date you actually collect the money or pay the expense.
Revenue recorded on the income statement may not correspond exactly to deposits made to the system’s bank account, nor will expenses tie directly to checks written by the system. Those deposits may be made or checks may be written after the period listed on the income statement, but the obligation to make those deposits or write those checks takes place during that period, and therefore must be logged.
Accrual accounting Most utilities record financial activities on the accrual basis of accounting. Under this type of accounting, the system must record revenue when it is earned or when the system is entitled to the money. It also must record expenses when they are incurred or when the system is legally obligated to pay the debt. It doesn’t matter when the system actually collects the money or pays the cash.
An example: A water system prepares water bills for customers’ water usage in May on the last day of that month and puts those bills in the mail. The system records a receivable at that time for what customers owe for May water usage, even though the money won’t actually be received until around the due dates in mid-
30 • Oversight and monitoring of financial performance
CH
AP
TE
R 4
June. This increases receivables on the balance sheet and increases revenue from water sales on the income statement. The same is true of expenses. If the system receives a bill on May 31, it is recorded then, even though the bill may not be paid until sometime in June.
Understanding detailsNow that you know the basic function of, and information found on, an income statement, you will more easily understand how to review each section. There are three basic elements of an income statement: revenue, operating expenses, and net operating income (or loss).
•Revenue is income that has been earned by the system. Examples include water sales to customers, late charges, and service charges.
•Operating expenses are incurred during the system’s normal operation. This can include salaries, fringe benefits for employees, utility bills, insurance, and water purchased for resale.
•Net operating income (or loss) is determined by subtracting operating expenses from revenue. If the system has more revenue than expenses, it is operating with a net income. If operating expenses are greater, the system is operating with a net loss. This is a very important number because you want to make sure your system is charging enough to cover the full cost of providing water.
•Other income and expenses is the category where you list interest income, interest expense, and any gains or losses on sales of equipment. It also will show items that are unusual in nature, such as things not related to the operation of the system. Unusual items are hard to define, but as the saying goes, “You’ll know them when you see them.” They are sometimes items that do not occur on a monthly basis, such as regulatory expenses, consultants (an engineer), or fines. Be careful about putting items in this category, however.
•Final net income (or loss) is the last line on the statement. To determine the overall net income, add the net operating income to other income and expenses (or subtract if it’s a loss). This gives you the final net income (or loss) for the period listed on the income statement, such as the fiscal year.
net operating income + other income and expenses =
net income for statement period
or
other income and expenses – negative operating income =
net income for statement periodThe income statement in Table 7 is a comparative income statement because it shows figures for both 2009 and 2010. Comparative income statements provide an idea of how the system is progressing: Are revenues up or down? Do the revenue changes make sense? Why are water sales way up over the same period last year? Are there more customers, or did the system implement a rate increase? Is revenue down, if so, why? Are expenses up or down? If so, again, why?
Any changes from one year to the next should make sense to you. Don’t be afraid to question employees, such as the operator, bookkeeper, accountant, or the utility’s auditor, until the answers make sense and until you receive an explanation you can understand.
Calculating income-statement ratiosIn the balance sheet section of this guide, we learned how to calculate the liquidity and leverage ratios to check the system’s fiscal health. Calculating ratios from the income statement is also an effective way to check the overall fiscal health of a system. The two most important ratios to calculate on the income statement are the operating ratio and the debt-service ratio.

31 • Oversight and monitoring of financial performance
CH
AP
TE
R 4
Operating ratio
The operating ratio is a simple calculation used to measure the profitability of a system. Normally, a water utility that has an operating ratio of less than 1.0 is considered financially distressed. The formula for calculating the operating ratio is:
operating revenues ÷ operating expenses = operating ratio
On the sample income statement (for 2010):•Total revenue: $681,856•Total operating expenses: $575,234
Using the formula above to calculate, you will arrive at an operating ratio of 1.19:
681,856 ÷ 575,234 = 1.19The system appears to be financially viable.
Debt-service coverage ratio
The debt-service coverage ratio measures a utility’s ability to pay its debt. The adequate debt-coverage ratio will vary from system to system, depending upon the requirements of each lender or, in some cases, state statute.
The Rural Utilities Service (of USDA Rural Development) Water and Waste Disposal loan program is a major federal lender for small and rural utilities. The RUS prefers a minimum debt-service coverage ratio of 1.1 or higher, as calculated by the following formula:
(net operating income + depreciation) ÷ total debt service
= debt-service coverage ratioTotal debt service refers to the total annual payment made during the year on funds borrowed by the system, including principal, interest, and any debt-service reserve deposits that may be required. To calculate the example utility’s total debt service for 2010, first locate the line item “Current portion of long-term debt” in Table 6: Sample Balance Sheet on page 22. The current portion of long-term debt for this utility for 2010 is $56,123 and represents the system’s principal payments. Add this amount
to the line item “Interest expense” from Table 7. This gives us a total debt service for the sample utility of $127,794 (principal payment of $56,123 + interest expense of $71,671 = $127,794).
Now add the “Net operating income” from Table 7 of $106,622 to the “Depreciation expense” from Table 7 of $112,598 to obtain the sum of $219,220.
Divide this sum, $219,220, by the total debt service of $127,794 to arrive at a debt-service coverage ratio of 1.71 according to the above formula:
$219,220 ÷ $127,794 = 1.71With a debt-service coverage ratio of 1.71, the example water utility is able to meet its annual debt-service payment requirements and would not be considered in financial distress.

32 • Oversight and monitoring of financial performance
CH
AP
TE
R 4
The cash-flow statementThe cash-flow statement shows how all of a utility’s financial transactions during the year increased or decreased the available cash. It also shows how much cash is available at the end of the year after all of the transactions are tallied. The cash-flow statement breaks down transactions into three areas—financing, investing and operation:
•Financing activities are transactions resulting from actions to attract investors or creditors. Examples include loans for purchases of assets or major improvements to the system.
• Investing activities are transactions made to obtain the property, plant and equipment needed to run the organization. They also include transactions associated with the investment of idle cash, such as purchasing stocks or bonds. Another example is purchasing a new building or new equipment.
•Operating activities are the required transactions for the system to perform its function of providing safe drinking water to customers. Operating transactions can include employee salaries, office supplies, minor repairs to the system, and the purchase of water from other systems.
Why is the cash-flow statement important?The cash-flow statement is often the most overlooked of the three main financial statements. It is also the most difficult to read and understand. It is sometimes thought of as the least important of the three statements. This isn’t the case.
The lack of cash flow can kill a company faster than operating at a net loss every day. Even if a system shows more assets than liabilities and shows a net income, it still could be in serious financial distress if the cash flow isn’t sufficient to meet obligations. Many organizations that file for bankruptcy have more assets than liabilities on their balance sheets and show
a net income on their income statements. However, a review of their cash-flow statements often shows that in the months or years prior to the bankruptcy, they did not have sufficient cash resources to meet their obligations.
An organization that does not have the cash available to pay operating expenses can spiral quickly into financial distress. A negative cash flow can create a chain of events that will destroy your utility:
1. Without available cash in the bank, bills go unpaid or are paid late. Not only does this damage the system’s reputation with the party to be paid, but it also can lead to late fees and interest penalties. These must be added to the system’s operating costs.
2. Late or missed payments can damage the water system’s credit rating. As a result, the system may be required to pay cash for supplies and services. Because cash is already limited, the system may be unable to obtain necessary supplies and services.
3. Without necessary supplies and services, the system must delay or forego necessary maintenance or repair to the system.
4. Without necessary repairs, supplies and services, the quality or quantity of water produced may suffer. The system’s reliability can be affected, and service can be disrupted.
5. Eventually the utility may be forced into making emergency repairs or be cited for operational deficiencies by regulatory agencies—or both.
The cash-flow statement can alert you to a possible scenario like the above example because it shows how the accounts on the balance sheet have changed from one year to the next.
There are three areas on the cash-flow statement that are of particular importance in providing a snapshot of your system’s fiscal health: accounts receivable, accounts payable and long-term debt.

33 • Oversight and monitoring of financial performance
CH
AP
TE
R 4
Accounts receivableThe first item to check in your cash-flow statement is the line item “(Increase) Decrease in accounts receivable.” In Table 8: Sample Statement of Cash Flows on page 34, you will find this line item under the heading “Adjustments to reconcile change in net assets to net cash.”
As previously discussed, accounts receivable are payments owed to you by vendors or customers. An increase in accounts receivable from one year to the next means that the system was owed more at the end of the current fiscal year than it was owed at the end of the last fiscal year. This could be a warning sign, and it’s important to determine why the system was owed more this year than last. One possible explanation is simply system growth—more customers means more receivables. However, it also could mean that the system isn’t actively pursuing unpaid water bills.
When the system records the amount due from customers, it increases both revenue and assets. The system shows a healthy revenue and net income as well as increased assets. Everything looks good when the amount due is recorded.
But what happens if the customers don’t pay what is actually owed?
The system is out the cost for providing the water services and doesn’t have the cash to pay the costs of future service. The problem becomes worse the longer the system allows customers to use its services without paying for them. The system must continue to cover the costs of services for which it is not getting paid. What if other customers stop paying? That means more costs for the system to cover. Although assets and net income may show that the money is expected to come in, without pursuing delinquent accounts, the cash won’t actually be there when it’s needed. Bottom line: Keep a handle on delinquent accounts.
Accounts payableThe next thing you want to examine in a cash-flow statement is the line item “(Increase) Decrease in accounts payable.”
To review, accounts payable is just the opposite of accounts receivable. Accounts payable is money your system owes to vendors.
Look again at the sample statement in Table 8. In comparing the accounts payable of the two years listed (2009 and 2010), what do you see? Did this line item increase or decrease? Similar to receivables, an increase in payables simply can be the result of a system experiencing significant growth, but it could also be the result of delaying payments to vendors.
Long-term debtSometimes also called “notes payable,” long-term debt is a tell-all on the cash-flow statement. This line item can be found in Table 8 under the heading “Cash flows from financing activities.” It is listed as “Retirement of long-term debt.”
Compare your debt-retirement activities from the previous year to the current year. Were you able to reduce the long-term debt, or did your debt actually increase? If debt increased, make sure there is a reasonable explanation for the increase. Was it from growth, such as borrowing money to extend lines, upgrade the facility, or purchase equipment? Without a reasonable explanation for increased debt, an increase in this line item from one year to the next is a good indicator that you are not able to keep up with your system’s cash-flow requirements.
The bottom line–literallyFinally, look at the bottom of the cash-flow statement. In Table 8, the bottom shows the “Net increase (decrease) in cash.” Is there more or less cash at the end of this year than at the end of the previous year? An increase in receivables, along with an increase in payables and a decrease in cash, could be the result of normal operations. But it also could be worth questioning.

34
Table 8: Sample Statement of Cash Flows
For years ending Dec. 31, 2010, and 2009
Cash Flows from Operating activities 2010 2009
Net Income (Loss) $68,246 $75,988
adjustments to reconcile change in net assets to net cash
Provided by operating activities:
Depreciation $112,598 $118,338
(Increase) Decrease in accounts receivable 5,014 (7,395)
(Increase) Decrease in prepaid expenses (25) (1,485)
(Increase) Decrease in interest receivable 0 (3,053)
(Increase) Decrease in inventory 1,054 6,938
Increase (Decrease) in accrued expenses 90 870
Increase (Decrease) in payroll tax liabilities (321) 624
Increase (Decrease) in accrued interest 13,355 10,243
Increase (Decrease) in meter deposits (1,098) 0
Increase (Decrease) in accounts payable 445 28Net cash used in investing activities $199,358 $201,096
Cash Flows from Investing activities
Purchase of property and equipment 0 (19,857)Net cash used in investing activities 0 ($19,857)
Cash Flows from Financing activities
Retirement of long-term debt (54,238) (37,106)
Purchase of Securities (2,219) 0
Sale of Securities 100,000 0Net cash used in financing activities $43,543 ($37,106)
Net Increase in Cash $242,901 $144,133Cash Balance, beginning of year 253,573 109,440Cash Balance, end of year $496,474 $253,573
(Dollar Values are for Illustration Purposes Only)

35 • Maintaining sustainable water and waste-disposal services
CH
AP
TE
R 5
This chapter provides additional measures and actions that can be employed to help maintain financially viable and sustainable water and waste disposal services.
Again, being “financially sustainable” means you are selling water and/or wastewater-disposal services to your customers at a rate that consistently generates enough revenue to meet all of your expenses (both short- and long-term).
Chapter 5Maintaining sustainable water and waste-disposal services
Safe, affordable drinking water and
sanitary waste disposal are vital to
the public health and environment.
Maintaining system viabilityA community’s water or waste-disposal facility is an essential component of the overall well-being and quality of life of a rural community. Safe, affordable drinking water and sanitary waste disposal are vital to the public’s health and the environment. Water and waste-disposal services are building blocks for community growth and development, economic development, and job creation and retention.
In terms of money, for many small towns and rural communities, the water-supply and/or wastewater-disposal facility may the largest single capital investment in the community. From this standpoint alone, it is critically important to preserve the value of this infrastructure investment. Considering the enormous public benefit of water and waste-disposal utilities for residents of a community, it is of the highest importance that decision makers and managers ensure that water and waste facilities are operated as economically and financially sustainable enterprises.
36 • Maintaining sustainable water and waste-disposal services
CH
AP
TE
R 5
The audit reportWhile each individual financial statement contains important information, the statements must be reviewed together to obtain a clear picture of your system’s financial stability. And while it is not an official part of your financial statements, an external audit should be conducted and an audit report issued. The audit is a critical document for a utility to have. Not only is the audit an important indicator of the overall fiscal health of your utility, an external audit will assist your utility’s decision-makers in ensuring the integrity of the financial-management system.
Many water utilities are required, either by state law or by an external lender, to produce an annual audit report. Even if an external audit is not a requirement, it is a good business decision to have an annual audit completed.
When federal funds are usedAn audit performed by a certified public accountant (CPA) is required whenever federal funds are used in a project’s construction. When your utility is using funds from the federal government for projects, it is therefore important that those project’s funds are separated from other funding sources. Careful records must be maintained in an audit-friendly format. An audit complying with OMB Circular A-133 must be completed for borrowers that received $500,000 or more in federal (loan or grant) assistance. Most construction projects will meet this threshold.
The OMB Circular A-133 requires that the auditor provide an opinion on the appropriate expenditure of federal funds in addition to the normal audit requirements. The audit must therefore trace each project transaction from contract signature to final payment. These audits are both time-consuming and expensive. Testing requirements and auditing costs for an A-133-compliant audit are almost double that of a typical audit. Utilities must plan accordingly.
Contact your auditor in advance of a project’s construction phase to review A-133 program requirements and negotiate the cost of the audit. If possible, you should retain enough contingency money in the project’s budget to cover the additional cost of an A-133 audit.
Request for proposalsThe audit-hiring process starts with a request for proposals (RFP). As part of the bidding process, your system should require that firms have:• a clear understanding of the
system’s business • references from other clients in the
water or wastewater industry• résumés of the personnel
working on the audit• a clean peer-review letter that shows the
firm has undergone an extensive review of its policies and procedures in performing audits and that it adheres to industry standards in completing the audits
Your utility should request that the cost estimate of the audit be sent in a separate, sealed envelope from the qualifications proposal because you will want to open them separately.
First, review each firm’s qualifications and rank them on that basis. Then, open the cost proposals. If the firm with the best qualifications isn’t the cheapest, then it may give you a chance to negotiate the final fee.
Auditor opinionWhen the audit is completed, the firm will issue an auditor opinion. The opinion is the first page of the audit. It will detail the scope of the audit, the auditor’s opinion of the procedures and records used to produce the financial statements, and an opinion of whether or not the financial statements present an accurate picture of the utility’s financial condition. An “unqualified opinion” or “clean opinion” is the best an organization can receive. It means the auditor did not find any material misstatements in the system’s financial records. A “qualified opinion” contains exceptions, which may include the scope of the audit. An adverse opinion can be issued when the auditor determines that the financial statements are materially misstated and in general do not conform with generally accepted accounting principles.
37 • Maintaining sustainable water and waste-disposal services
CH
AP
TE
R 5
Financial statementsThe audit will include the primary financial statements: the balance sheet, the income statement, and the cash-flow statement. The next major item in the audit is the notes to the financial statements. The notes provide valuable information regarding the nature of operations and in-depth information about various balances in the financial statements, such as notes payable and property, plant and equipment. The notes will contain a lot of other pertinent information and should be read carefully.
Auditor’s recommendationsThe audit report may also contain useful recommendations from the audit firm for making improvements within the financial system that will provide better safeguards for financial assets, improve efficiency or both. The governing board and management of the utility should strongly consider taking the actions necessary to implement the recommendations of their auditor.
Report presentationThe final step in the audit process is the report presentation. The auditor should present the audit to the water system’s entire board. The auditor should be available to explain the report’s numbers and respond to any questions. Board members should not be afraid to ask questions until they understand the audit completely. Remember: the auditor works for the utility’s entire governing board.
Using unit-of-service measuresIt is often simpler to understand the “business” of a utility by developing and reviewing short-hand unit-of-service measurements. The utility is not only generating revenues and expenses, but it is also producing and selling a product—water and wastewater treatment (often measured in thousands of gallons)—for a number of customers (usually measured on a monthly basis). Reviewing a utility’s operations from a unit-of-service perspective can give decision-makers a better understanding of how the
utility is performing over time. Common unit-of-service measurements can be calculated from the information in annual financial statements. Consider some of the common unit-of-service measures that were calculated with figures (total average revenue per month, total average expenses per month, number of users, and others) from the 2010 annual financial statements of a sample water system:
Unit-of-service performance data for 2010:
•Average revenue per customer per month: $81,028 ÷ 250 (number of users) ÷ 12 mos. = $27.00
•Total expense per customer per month: $79,928 ÷ 250 ÷ 12 mos. = $26.64
•Total debt service per customer per month: $23,100 ÷ 250 ÷ 12 mos. = $7.70
•Total cost to produce water per 1,000 gallons: $79,928 ÷ 15,000,000 gals/1,000 =$5.33
•Revenue per 1,000 gallons sold: $77,153 ÷ 14,250,000 gals/1,000 = $5.41
• Average customer use per month: 14,250,000 ÷ 250 ÷ 12 mos. = 4,750 gallons
Using unit-of-service measures is a good way of simplifying a complex sheet of financial data. Similar to financial ratios, comparing common units of service from one year to the next enables managers and board members to quickly determine whether the utility is moving in the right direction.
Review user rates annuallyUser rate fees should be reviewed every year to ensure that projected revenues will be sufficient to cover all anticipated expenses. The best time to review user rates is during the annual budget-preparation process. The projected expense portion of the annual budget should be realistic in stating the full cost of running the system, including operations and maintenance expenses plus annual debt service and funding
38 • Maintaining sustainable water and waste-disposal services
CH
AP
TE
R 5
of appropriate reserves. Generally, it is good to adjust user rates at least once every five to six years. Allowing very long intervals between rate adjustments usually leads to the necessity for a major increase at some point, and as a result “customer rate shock” occurs.
Plan aheadHistorically, one of the biggest problem areas for small-community utilities has been the failure to plan for the future. It is important for the management and board of small systems to look beyond the annual budget year and look at the system’s needs in future years--both operational needs and the needs for capital improvements. Whether your state regulatory agency requires your utility to prepare a long-range plan or capital-improvement plans or not, projecting for financial needs (both operational and capital) is a key part of a financially sustainable utility.
Other RCAP publications to help in the operations and oversight of water systemsIf you are a board or council member or staff member with responsibilities for overseeing your community’s water system, the Rural Community Assistance Partnership (RCAP) has produced many other publications to assist you in these responsibilities. These publications are titled/on the topics of:
•ADropofKnowledge:TheNon-operator’sGuide to Drinking Water Systems
• ADropofKnowledge:TheNon-operator’sGuide to Wastewater Systems
•responsibilities(managerial,financial,legal,etc.)of board members of small water systems
• USDARuralUtilitiesServiceBorrower’sGuide:AHow-toforWaterandWastewaterLoans from USDA Rural Development
• ARRA Registering and Reporting Guide for Water/Wastewater Systems with Loans/Grants from the U.S. DepartmentofAgriculture-RuralUtilitiesService
•SustainableInfrastructureforSmallSystemPublicServices:APlanningandResourceGuide
•FormulateGreatRates:TheGuidetoConductinga Rate Study for a Water System
•GettingYourProjecttoFlowSmoothly:AGuidetoDevelopingWaterandWastewaterInfrastructure
• water-distribution system maintenance
• asset management and conducting vulnerability assessments and emergency-response planning
All of the above publications can be accessed and downloaded for free (in PDF) on the RCAP website at www.rcap.org (click on “Publications & Resources” on the main menu).
Free resources that can be sent to you regularly: RCAP has a magazine–Rural Matters–that is produced several times each year. Subscriptions are free. Included in each issue are articles that are useful to small community leaders and system operators. RCAP also produces an electronic newsletter, the eBulletin. Subscribing by email is also free. Each issue provides helpful tips, guides and resources on practical subjects. Find subscription information for both of these resources at www.rcap.org (click on Publications & Resources).

Puerto Rico (Northeast RCAP)and U.S. VirginIslands (RCAC)
Western RCAPRural Community Assistance Corporation3120 Freeboard Drive, Suite 201West Sacramento, CA 95691(916) 447-2854www.rcac.org
Midwest RCAPMidwest Assistance ProgramP.O. Box 81 212 Lady Slipper Avenue NENew Prague, MN 56071(952) 758-4334www.map-inc.org
Southern RCAPCommunity Resource Group3 East Colt Square DriveFayetteville, AR 72703(479) 443-2700www.crg.org
Northeast RCAPRCAP SolutionsP.O. Box 159 205 School StreetGardner, MA 01440(800) 488-1969www.rcapsolutions.org
Great Lakes RCAPWSOS Community Action CommissionP.O. Box 590219 S. Front St., 2nd FloorFremont, OH 43420(800) 775-9767www.glrcap.org
Southeast RCAPSoutheast Rural Community Assistance ProjectP.O. Box 2868 347 Campbell Ave. SWRoanoke, VA 24016(866) 928-3731www.southeastrcap.org
RCAP National Offi ce1701 K Street NW, Suite 700 • Washington, DC 20006
202/408-1273 • 800/321-7227www.rcap.org
RCAP Rural Community Assistance Partnership
Need help with your community’s water or wastewater system?
The Rural Community Assistance Partnership (RCAP) is a national network of nonprofit organizations working to ensure that rural and small communities throughout the United States have access to safe drinking water and sanitary wastewater disposal. The six regional RCAPs provide a variety of programs to accomplish this goal, such as direct training and technical assistance, leveraging millions of dollars to assist communities
develop and improve their water and wastewater systems.
If you are seeking assistance in your community, contact the office for the RCAP region that your state is in, according to the map below. Work in individual communities is coordinated by these regional offices.

RCAPRural Community Assistance Partnership, Inc.
1701 K St. NW, Suite 700Washington, DC 20006
202/408-1273800/321-7227 (toll-free)
www.rcap.org
Visit our website for other publications, electronic and print periodicals, and ways your community can get assistance with
its water and wastewater system.