THE BACTERIAL COMMUNITY OF A FRESHWATER SPONGE ... · Corticium sp. and Ircinia felix (Sharp, 2007,...
73
THE BACTERIAL COMMUNITY OF A FRESHWATER SPONGE, RADIOSPONGILLA CEREBELLATA: A COMPARISON OF TERMINAL RESTRICTION FRAGMENT LENGTH POLYMORPHISMS (T-RFLP) AND 16S RRNA CLONE LIBRARY METHODS by Andrew Stephen Mobley Robert W. Thacker, PhD Committee Chair Asim K. Bej, PhD Julie B. Olson, PhD A THESIS Submitted to the graduate faculty of The University of Alabama at Birmingham, in partial fulfillment of the requirements for the degree of Master of Science BIRMINGHAM, ALABAMA 2010
Transcript of THE BACTERIAL COMMUNITY OF A FRESHWATER SPONGE ... · Corticium sp. and Ircinia felix (Sharp, 2007,...

THE BACTERIAL COMMUNITY OF A FRESHWATER SPONGE, RADIOSPONGILLA CEREBELLATA: A COMPARISON OF TERMINAL
RESTRICTION FRAGMENT LENGTH POLYMORPHISMS (T-RFLP) AND 16S RRNA CLONE LIBRARY METHODS
by
Andrew Stephen Mobley
Robert W. Thacker, PhD Committee Chair Asim K. Bej, PhD
Julie B. Olson, PhD
A THESIS
Submitted to the graduate faculty of The University of Alabama at Birmingham,
in partial fulfillment of the requirements for the degree of Master of Science
BIRMINGHAM, ALABAMA
2010

ii
THE BACTERIAL COMMUNITY OF A FRESHWATER SPONGE, RADIOSPONGILLA CEREBELLATA: A COMPARISON OF TERMINAL
RESTRICTION FRAGMENT LENGTH POLYMORPHISMS (T-RFLP) AND 16S RRNA CLONE LIBRARY METHODS
Andrew Stephen Mobley
DEPARTMENT OF BIOLOGY
ABSTRACT
Although most sponges are found in marine environments, some are also
found in freshwaters. Sponges harbor diverse communities of sponge-associated
bacteria, and the study of the relationship between host sponge and sponge-
associated bacteria may demonstrate the existence of symbiotic relationships
which benefit both the host sponge and its bacterial symbionts. We examined the
bacterial community associated with the freshwater sponge, Radiospongilla
cerebellata using terminal restriction fragment length polymorphism (T-RFLP)
and Clone Library Construction (CLC) methods. Although T-RFLP allows us to
rapidly assess the diversity of the bacterial community associated with freshwater
sponges, it does not provide the highest level of taxonomic resolution. However,
when T-RFLP results are compared with traditional clone libraries, it is possible
to enhance the taxonomic specificity of the T-RFLP method. In this investigation,
T-RFLP and CLC analyses demonstrated that there are notable differences
between the bacterial community associated with hatched freshwater sponges
and that of their intact and crushed gemmules. Freshwater sponges and their
gemmules harbor a diverse community of bacteria which varies in its species
composition, diversity, and evenness at different stages of their lifecycles. A total

iii
of 14 major bacterial lineages were identified with T-RFLP and CLC analyses,
however each method identified some bacterial lineages not identified by the
other. The clone library method identified 7 of these bacterial lineages, while the
T-RFLP method identified 10 bacterial lineages. Forty-two unique bacterial
species were identified in the hatched gemmule clone library, with 31 of these
matching T-RFLP profiles from the hatched gemmules. Analysis of similarity
calculations were used to produce Bray-Curtis similarity dendrograms and Multi-
Dimensional Scaling plots to illustrate relationships among the three gemmule
treatments. Rarefaction curves estimated the T-RF diversity among the three
gemmule treatments. The traditional diversity indices of the Shannon Index (H’)
and Pielou's evenness index (J’) demonstrated that hatched gemmules harbor a
bacterial community that is less diverse and less even than those of the intact
and crushed gemmules These findings suggest that the bacterial community
associated with freshwater sponges may include host-specific bacterial species,
but further investigation is necessary to identify potential host-specific symbionts.

iv
DEDICATION
This thesis is dedicated to my precious wife, Elizabeth. Without her constant
support, encouragement, and occasional gentle prodding, it simply never could
have been.

v
ACKNOWLEDGEMENTS
It would have been impossible to complete this work without the support,
training, guidance, encouragement and efforts of many people. First, I would like
to sincerely thank my mentor, Dr. Robert Thacker for encouraging me to further
develop the values, abilities, and critical thinking skills necessary for one to
become a good scientist. By sharing his knowledge and experience, he helped
me to learn from both my mistakes as well as my successes. I would like to thank
my committee members, Dr. Asim K. Bej, and Dr. Julie Olson, both models
of good scientists, for sharing their time, expertise and knowledge to assist me
throughout this experience. I would also like to thank Dr. Christina Diaz and
Dr. Sally Leys for their help in teaching me the important foundations of sponge
biology and taxonomy. I am indebted to Dr. Stephen Watts, Dr. Ken Marion, and
Dr. Robert Fisher for their support in making it possible for me to attain an
education at UAB. I would also like to thank Maria Salazar for her assistance in
the CFAR sequencing lab, and all the graduate students at UAB who have
become my friends and colleagues. This work has been supported by the
Caroline P. Ireland research scholarship.

vi
TABLE OF CONTENTS
Page
ABSTRACT .......................................................................................................... iii DEDICATION ....................................................................................................... v ACKNOWLEDGMENTS ....................................................................................... vi LIST OF TABLES ................................................................................................ vii LIST OF FIGURES ............................................................................................. viii INTRODUCTION .................................................................................................. 1 MATERIALS AND METHODS .............................................................................. 6 RESULTS ........................................................................................................... 13 DISCUSSION ..................................................................................................... 19 LIST OF REFERENCES .................................................................................... 26 FIGURES .......................................................................................................... 29 TABLES .......................................................................................................... 49
APPENDICES
A T-RFLP Relative Abundance Matrices .............................................. 52

vii
LIST OF TABLES
Table 1 Number of bacterial species ubiquitous and unique to hatched gemmules ................................................................................................ 49 2 Major bacterial divisions identified in T-RFLP and clone library
analyses from hatched gemmules ........................................................... 49
3 Traditional diversity indices for each restriction enzyme treatment .......... 50
4 Comparison of Clone library and T-RFLP results .................................... 51

viii
LIST OF FIGURES
Figure Page
1 Adult specimen of Radiospongilla cerebellata from Shades Creek .......... 29 2 Gemmules of Radiospongilla cerebellata ................................................. 29 3 Hatched Radiospongilla cerebellata gemmules ....................................... 30
4 Megasclere and gemmosclere spicules of Radiospongilla cerebellata ............................................................................................... 30 5 Mean number of T-RF’s observed for each restriction enzyme Treatment……………………………………………………………………….31 6 Total number of unique T-RF’s identified for each gemmule and restriction enzyme treatment .................................................................... 31 7 Mean Shannon index of diversity for each gemmule treatment by restriction enzyme .................................................................................... 32 8 Mean Evenness for each gemmule treatment by restriction enzyme ....... 32
9 Bray-Curtis similarity dendrogram of relationships among gemmule treatments for the BstUI restriction enzyme ............................. 33 10 Bray-Curtis similarity dendrogram of relationships among gemmule treatments for the HaeIII restriction enzyme ............................ 33 11 Bray- Bray-Curtis similarity dendrogram of relationships among gemmule treatments for the MspI restriction enzyme .............................. 34 12 Multi-dimensional Scaling similarity plot of the BstUI restriction enzyme treatment ................................................................... 35 13 Multi-dimensional Scaling similarity plot of the HaeIII restriction enzyme treatment .................................................................... 35

ix
14 Multi-dimensional Scaling similarity plot of the MspI restriction enzyme treatment .................................................................... 36 14 Multi-dimensional Scaling similarity plot of combined data for all enzyme treatments .................................................................................. 36 16 Rarefaction curve for BstUI treated intact gemmules ............................... 37
17 Rarefaction curve for BstUI treated crushed gemmules .......................... 37
18 Rarefaction curve for BstUI treated hatched gemmules .......................... 38
19 Combined rarefaction curve for all BstUI treated gemmules .................... 38
20 Natural log transformation of rarefaction curves for the BstUI restriction enzyme .......................................................................... 39 21 Rarefaction curve for HaeIII treated intact gemmules .............................. 40
22 Rarefaction curve for HaeIII treated crushed gemmules .......................... 40
23 Rarefaction curve for HaeIII treated hatched gemmules .......................... 41
24 Combined rarefaction curves for all HaeIII treated gemmules ................. 41
25 Natural log transformation of rarefaction curves for the ........................... 42 HaeIII restriction enzyme 26 Rarefaction curve for MspI treated intact gemmules ................................ 43
27 Rarefaction curve for MspI treated crushed gemmules ........................... 43
28 Rarefaction curve for MspI treated hatched gemmules ........................... 44
29 Combined rarefaction curves for all MspI treated gemmules ................... 44
30 Natural log transformation of rarefaction curves for the MspI restriction enzyme ........................................................................... 45 31 Neighbor-Joining phylogenetic tree showing genetic distances among β-proteobacteria clones retrieved from the hatched gemmule clone library and nearest matching Genbank sequences ........................ 46 32 Neighbor-joining phylogenetic tree showing genetic distances among γ-proteobacteria clones retrieved from the hatched gemmule clone library and nearest matching Genbank sequences ........................ 47

x
33 Neighbor-joining phylogenetic tree showing genetic distances among α-proteobacteria clones retrieved from the hatched gemmule clone library and nearest matching Genbank Sequences ........ 47 34 Neighbor-joining phylogenetic tree showing genetic distances among Bacteriodetes clones from the hatched gemmule clone library and nearest matching Genbank sequences ........................ 48 35 Percent composition of major taxonomic groups of bacteria identified in the hatched sponge clone library ......................................... 48

1
INTRODUCTION
Although the vast majority of sponge species are known from marine
environments, some are known to inhabit freshwater lakes, streams, and rivers.
These freshwater sponges share many characteristics with their marine
counterparts, but have several important adaptations to the freshwater
environment. Marine sponges and freshwater sponges have distinctly different
lifecycles. Unlike freshwater sponges, marine sponges live in a relatively stable
environment and are not subjected to intense seasonal environmental changes
such as temperature extremes, anoxia, and desiccation (Loomis et al. 1996,
Pennak et al., 1989, Reiswig, Miller 1998). While marine sponges reproduce
sexually and may have life spans up to 2300 years (McMuray et al., 2008),
freshwater sponges are annuals which reproduce asexually by producing
gemmules. These gemmules are small packages of specialized thesocyte cells
protected by a thick protective layer of collagen fibers and specialized
gemmosclere spicules (Frost et al, 2001). During the winter, gemmules remain in
a dormant state known as diapause (Loomis et al. 1996; Reiswig, Miller 1988)
until spring and early summer when favorable environmental conditions such as
an increase in water temperature induce them to hatch and grow into adult
sponges (Loomis et al. 1996; Frost et al., 2001). Sponges grow throughout the
summer months and begin to produce gemmules in late summer and early fall in
response to environmental stimuli. As the water temperature decreases in the

2
fall, the adult sponge dies, and the dormant gemmules either disperse in the
water currents or remain attached to their substrate until the lifecycle repeats
again in the spring.
Both freshwater and marine sponges are known to harbor diverse
bacterial communities including photosynthetic algae and cyanobacteria as well
as a wide range of heterotrophic bacteria (Webster et al., 2001, Gernert et al.,
2005). Some of these bacterial symbionts may be generalists found both in the
sponge and its surrounding environment; however some have been shown to
exist as specialist inhabitants of marine sponges (Thacker, Starnes 2002; Taylor
et al. 2004). Mutualist relationships between sponges and sponge-associated
bacteria are thought to exist; however the mechanism of these relationships has
not yet been identified (Thacker et al., 2003). Previous studies have identified
unique species of sponge-associated bacteria and cyanobacteria in marine
sponges (Hill et al. 2005, Thacker et al. 2003). Cyanobacterial sponge-
associated bacteria have been demonstrated to benefit the host sponge by
increasing its growth rate compared to sponges whose cyanobacterial symbionts
were shaded from sunlight (Erwin et al. 2008).
Two mechanisms have been proposed for the transmission of bacterial
symbionts between individual sponges or succeeding generations of sponges. In
the horizontal transmission or environmental acquisition model, bacterial
symbionts are transferred from one individual to another indirectly through the
environment. The association between the light-producing bacterial symbiont
Vibrio fischeri and its host, the squid Euprymna scolopes, is an example of
horizontal transmission in which the squid acquires its symbionts from the
3
environment (Wei and Young, 1989). In the vertical transmission model, bacterial
symbionts are directly transferred from parent to offspring. Vertical transmission
of sponge associated symbionts has been confirmed for two marine sponges
Corticium sp. and Ircinia felix (Sharp, 2007, Schmitt et al., 2007). In both of these
studies, microscopy revealed the presence of bacteria packaged within the
larvae of these two species. It has been also been reported that some sponge
species may utilize a combination of both horizontal and vertical transmission
mechanisms. (Taylor et al., 2007).
To date, no studies have been conducted to assess transmission
mechanisms for sponge-associated microbes in freshwater sponges. Because
these sponges reproduce asexually by producing gemmules which can be
hatched and manipulated under controlled conditions (Funayama et al., 2005),
freshwater sponges may further elucidate the association between sponges and
their bacterial symbionts. Several studies have shown that the exterior surface of
gemmules can be sterilized with hydrogen peroxide and/or sodium hypochlorite
prior to hatching to eliminate bacterial contamination. (Funayama et al., 2005,
Strekal and McDiffett, 1974). Although these studies did not specifically
investigate sponge-associated micro-organisms, their methods suggest that
sterilization of the exterior surface of the gemmule could be utilized to isolate
vertically transmitted sponge-associated bacteria located within the gemmule
from microbes of environmental origin located on the surface of the gemmules.
Clone library construction (CLC) and DGGE analysis based on 16S
ribosomal RNA have previously been utilized to characterize the bacterial
community of both marine and freshwater sponges (Magnusson, 2005, Erwin,

4
2007, Olson et al. 2005, Gernert et al., 2005). Direct sequencing of clone libraries
generates the highest degree of taxonomic resolution; however it is very time and
resource intensive. Terminal Restriction Fragment Length Polymorphism analysis
(T-RFLP) is a method in which PCR amplified 16S rRNA gene segments are
labeled with a fluorescent primer and then digested with restriction enzymes (Liu
et al. 1997). The resulting products are then run through a sequencer to
determine the length of the terminal restriction fragments. Although T-RFLP can
be used to rapidly assess a diverse bacterial community, it sacrifices the high
degree of taxonomic resolution obtained by traditional clone library methods in
order to obtain results both rapidly and economically. However, it is possible to
utilize online applications to compare T-RFLP results with predicted T-RF’s of a
clone library to accurately identify known species of interest, thus increasing the
taxonomic resolution of the method (Kent et al. 2003, Shyu et al. 2007, Szubert
et al. 2007).
At least four species of freshwater sponges are found in the Cahaba River
and Shades Creek: Radiospongila cerebellata, Ephydatia muelleri,
Corvospongilla becki, and one additional unidentified species. These encrusting
sponges are found attached to the underside of rocks which are exposed to
flowing water. Radiospongilla cerebellata and Ephydatia muelleri appear very
similar and cannot be distinguished in the field, however their spicules and
gemmules are morphologically distinct. Microscopic observations of gemmule
sections,megascleres, and gemmoscleres, are necessary to properly identify
these species (Figures 1-4). Radiospongilla cerebellata forms flat encrusting
patches of soft tissue and produces many yellow/orange gemmules scattered
5
throughout the sponge tissue. Ephydatia muelleri forms similar flat encrusting
patches of tissue with a more abrasive texture and gemmules that are smaller
and lighter in color.
The objectives of this study are: (1) Collect freshwater sponges and their
gemmules from the Cahaba River and Shades Creek, (2) Confirm species
identification from spicule preparations, (3) Determine a suitable hatching
medium for germinating gemmules under controlled laboratory conditions, (4)
Characterize sponge-associated bacterial community of freshwater sponge
gemmules using both CLC and T-RFLP methods.
The hypotheses for this study are: (1) The exterior surface of freshwater
sponge gemmules can be sterilized without harming their ability to hatch, (2) The
bacterial community of gemmules is distinct from that of hatched gemmules, (3)
The bacterial community of hatched gemmules is less diverse than that of intact
and crushed gemmules, (4) Some bacterial symbionts of freshwater sponges are
packaged within dormant gemmules and may be transmitted vertically from adult
sponge to gemmules, (5) Sponge-associated bacteria identified in clone library
sequences will be present in T-RF profiles.

6
METHODS
Collection, Preparation, and Identification of Freshwater Sponges
Freshwater sponges (Radiospongilla cerebellata) were collected from the
Cahaba River and Shades Creek in September and October of 2006. Gemmules
were removed from the sponge tissue, washed with Milli-Q water autoclaved for
30 minutes at 121°C, and stored in bottled Evian spring water (autoclaved for 30
minutes at 121°C) for at least 3 months at 4°C to simulate conditions gemmules
would experience in the field (Loomis et al., 1996). Additional specimens for long-
term preservation were collected in the fall of 2007 and preserved in either
ethanol or RNA-Later™ (Ambion, Inc.). Sponge tissue was digested in bleach to
isolate spicules for microscopic identification with published dichotomous keys
(Penney and Racek, 1968, Pennak et al., 1989).
Hatching of Gemmules in EV-50 Media.
A mineral “M” medium was prepared according to the method described
by previous studies (Rasmont, 1961). This medium was determined to be
unsuitable as it was not possible to completely dissolve its ingredients. Water
quality analysis reports for Evian brand spring water (Evian) demonstrated that it
contained similar concentrations of most of the minerals dissolved in the “M”
medium, and an alternative medium, “ EV-50”, consisting of 50% bottled Evian
mineral water and 50% Milli-Q water was used. Gemmules were removed from

7
refrigerated storage at 4°C and hatched in the dark at ambient lab temperature
(~20°C). Gemmules were successfully hatched in sterile 24-well Falcon multi-well
plates, 1.5ml microcentrifuge tubes, or Petri dishes. For sterility testing and T-
RFLP analysis, gemmules were hatched in 1.5ml microcentrifuge tubes. For
photography purposes, gemmules were hatched in Petri dishes.
Gemmule Sterilization Study
The exterior surfaces of gemmules were treated for 5 minutes in 1% H2O2,
1% sodium hypochlorite for 1 minute, or 10ul DNase for one minute and then
rinsed with sterile water. As a control, gemmules were also treated with Milli-Q
water autoclaved at 121°C for 30 minutes. 16S Ribosomal RNA was amplified
from the treated gemmules according to the PCR amplification protocol, and
sterilization was determined by the presence or absence of bacterial 16S
ribosomal RNA. Gemmules were then hatched according to the hatching protocol
to determine if the sterilization methods affected their ability to hatch.
DNA extraction and PCR amplification
Genomic DNA consisting of DNA from freshwater sponge and associated
bacteria was extracted from intact gemmules, crushed gemmules, and hatched
gemmule sponge tissue using the Promega Wizard SV Genomic DNA
Purification system (Promega). Universal bacterial primers Eco8F forward primer
5'-AGAGTTTGATCTGGCTCAG-3’ (Reysenbach et al. 1994) and 1392R reverse
primer 5’-ACGGGCGGTGTGTAC-3’ (Ferris et al., 1996) were used to amplify a
partial sequence of the bacterial 16S rRNA gene. PCR Reactions intended for T-

8
RFLP analysis used the hexachlorofluorescein labeled forward primer 8F-Hex,
while reactions intended for clone library analysis used the unlabeled Eco8F
forward primer. Each 50ul PCR reaction contained 15pmol 8F-Hex, 10pmol
1392R, 0.2mM of each dNTP, 1X MasterTaq PC Buffer (Eppendorf), 1X
TaqMaster (Eppendorf), 3.75mM MgCl2, and 2 units MasterTaq DNA polymerase
(Eppendorf). Reactions were conducted in a thermocycler with the following
conditions: 5 min denaturing @ 85°C, then 35 cycles of 45 seconds at 94°C, 60
seconds at 55°C, and 90 seconds at 72°C. PCR products were purified in a 1.5%
agarose gel and then cleaned using the Promega Wizard SV Gel Clean-Up
System. For each sample, PCR products from 3 separate reactions were
combined, and DNA concentrations were measured using a ND-1000 NanoDrop
spectrophotometer.
Purified PCR products were digested with BstUI, MspI, and HaeIII
restriction enzymes. These enzymes were selected because previous studies of
sponge associated bacteria indicated that they would report a maximum number
of T-RFLP fingerprinting fragments (Erwin et al., 2008, Engebretson et al., 2003).
For HaeIII and MspI, each reaction contained 400ng PCR product, 0.5ul BSA,
5.0ul 10x buffer, 2ul (2 units) enzyme, and H2O to bring final volume to 50ul.
Reactions were incubated at 37°C for 8 hours. For BstUI, each reaction
contained 400ng PCR product, 5ul 10x buffer, 2ul (2 units) enzyme, and H2O to
bring final volume to 50ul. Reactions were incubated at 60°C for 8 hours.

9
T-RFLP Analysis
Samples were precipitated overnight at -20°C with 5ul 3M sodium acetate
and 110ul ethanol at -20°C. Samples were then spun in a microcentrifuge at full
speed for 15 minutes at 4°C, rinsed with 500ul 70% ethanol, and dried in a
SpeedVac centrifuge until completely void of water. 10ul formamide and 0.5ul
GeneScan 500 TAMRA standard or 0.5ul GeneScan 600-LIZ standard were
added to each dried sample. Samples were placed in a thermocycler at 94°C for
2 minutes, cooled on ice for 2 minutes, and then vortexed and spun in a
centrifuge. Samples were run on an AB1377 automated sequencer or an ABI
3130xl Genetic Analyzer. The size in base pairs of the T-RF’s was determined by
comparison against the standard using Peak Scanner software version 1.0
(Applied Biosystems).
Clone Library Construction
A clone library was constructed using the Promega pGEM-T Easy Vector
System II (Promega) following the manufacturer’s suggested protocol. To each
0.5ml PCR tube, 5ul 2X ligation buffer, 0.5ul plasmid vector, 3.5ul PCR product,
1ul T4 Ligase was added. The positive control substituted 2ul control DNA and
1.5ul Milli-Q water autoclaved for 30 minutes at 121°C, and the background
control substituted autoclaved Milli-Q water for the PCR product. Ligations were
incubated overnight at 4°C. For each transformation, 4ul ligation reaction and
50ul competent cells were mixed in a 1.5ul microcentrifuge tube and placed on
ice for 20 minutes. Each tube was heated at 42°C for 45 seconds and then
placed on ice for 2 minutes. 950ul SOC media was added to each tube prior to

10
incubation at 37°C for 1.5 hours. Forty ul 2% bromo-chloro-indolyl-
galactopyranoside, 25ul 100mM ITPG, and 100ul transformed cells were added
to 1.5ul microcentrifuge tubes. 100ul or 65ul of this mixture was plated on Luria
broth/ampicillin plates and incubated at 37’C for 16-24 hours. 100 clones were
selected and placed in 1.5ul microcentrifuge tubes containing 1000ul Luria broth
and 4ul 2.5% ampicillin and incubated at 37°C overnight. Plasmids were
harvested and purified for sequencing with the Qiagen QIAprep Miniprep
purification system (Qiagen) according to the manufacturer’s microcentrifuge
protocol. Each of the 100 clones were digested with the restriction enzymes
HaeIII and MspI. For each enzyme, the reaction contained 400ng PCR product,
0.5ul BSA, 5.0ul 10x buffer, 2ul (2 units) enzyme, and autoclaved Milli-Q water to
bring final volume to 50ul. Reactions were incubated at 37°C for 8 hours.
Restriction enzyme digest products were separated on a 1.5% agarose gel.
Restriction enzyme patterns which appeared to be unique were identified and 55
clones were selected for sequencing.
Phylogenetic Identification of T-RFs and Clone Library Sequences
Sequences obtained from the clone library were compared to highly
similar sequences obtained from a blast search in Genbank. A neighbor joining
phylogenetic tree consisting of 55 16S r-RNA sequences and 42 Genbank
matches was constructed using Mega 4 software build number 4026 (Tamura et
al., 2007).
T-RFs profiles from the hatched gemmules were analyzed with the
phylogenetic assignment tool (PAT) (Kent el al., 2003) to identify possible

11
species matches. The T-RF profiles for all three enzymes were compared to a T-
RF database of 42,452 high quality (>1200bp) 16-S gene sequences. This
database of T-RF profiles was created by an insilco enzyme digest of the MiCAIII
(Microbial Community Analysis III) (Shyu et al. 2007) RDP database of 322,864
high quality 16S rRNA gene sequences (>1200bp) using the primers 8f and
1392r.
Data Analysis
T-REX software (Culman et al., 2009) was used to process, align, and
standardize the raw Genescan Peak Scanner files to produce abundance and
presence-absence matrices for further analysis. Primer 6 (Clarke et al., 2006)
software was used to compute traditional diversity indices (S, H, J) and to
produce Bray-Curtis similarity matrices based upon a 4th root transformation of
the matrices. The mean for each group was compared by ANOVA. Analysis of
similarity (ANOSIM) compared the three similarity matrices. MDS plots and
dendrograms were produced to assess similarity among the three experimental
treatments. Rarefaction curves from presences/absence matrices and percent
coverage estimates were calculated using Estimate-S software version 8.2.0
(Collwell, R.K., 2006). Rarefaction curves were compared among gemmule
treatments using an analysis of covariance (ANCOVA) of log-transformed data.
Raw T-RF Genescan profiles for each restriction enzyme were analyzed
using the Phylogenetic Assignment Tool (PAT) which compares T-RF profiles
with a database of known bacterial sequences and reports possible species
matches for the T-RF profiles. A large general database of 42,452 sequences

12
using 8f and 1392r primers was generated from the provided RDP database of
high quality 16S sequences using the virtual digest function of the online
Microbial Community Analysis III application (MiCAIII) (Shyu et al., 2007). A
second database of 42 hatched gemmules clone library sequences was
generated with an in-silico restriction digest using the online Restriction Enzyme
Mapping Application (REMA) (Szubert et al. 2007). T-RF profiles were compared
with both the RDP database and the hatched gemmule clone library database.

13
RESULTS
Species Identification and Gemmule Sterilization/Hatching Study
Three species collected locally in the Cahaba River and Shades Creek
were identified: Radiospongilla cerebellata, Ephydatia muelleri, and
Corvospongilla becki. A fourth species could not be identified to the genus level,
as there were no gemmules or gemmoscleres present to confirm identification
(Figures 1-4).
Gemmules treated with both H2O2 and sodium hypochlorite did not
produce any PCR products and were therefore considered sterilized, but none of
the other treatments were effective for sterilization of the outer coating of the
gemmules; however, gemmules treated with all combinations of H2O2 and
sodium hypochlorite failed to hatch in EV-50 medium. Unsterilized gemmules
placed in EV-50 medium began hatching at day 4 with visible spicules observed
outside gemmules. Visible sponge tissue was observed at day 11 and the
sponges continued growth for a total of 15 days prior to harvest (figure 3).
Because it was not possible to sterilize the exterior surface of the gemmules
without negatively affecting their ability to hatch, it was not possible to determine
if sponge-associated bacteria were contained within the gemmule by hatching
them under sterile conditions.

14
T-RFLP Analysis
With the restriction enzyme BstUI, 77 T-RF’s were identified in total with
55 found in intact gemmules, 54 in crushed gemmules, and 38 in hatched
gemmules. With the restriction enzyme HaeIII, 130 T-RF’s were identified in total
with 91 of them found in intact gemmules, 94 in crushed gemmules, and 51 in
hatched gemmules. With the restriction enzyme MspI, 62 T-RF’s were identified
in total with 38 of them found in intact gemmules, 29 in crushed gemmules, and
32 in hatched gemmules. For each of the three enzyme treatments, there were
fewer T-RFs identified in the hatched gemmules than in either the intact or
crushed gemmules (Figure 5). There were no significant differences among the
mean number of T-RF’s per sample for each of the gemmule treatments and
restriction enzymes (Figure 4)
With the restriction enzyme BstUI, 23 bacterial species were ubiquitous
and 9 were unique to the hatched gemmules. With the restriction enzyme HaeIII,
19 bacterial species were ubiquitous and 12 were unique to the hatched
gemmules. With the restriction enzyme MspI, 16 bacterial species were
ubiquitous and 10 were unique to the hatched gemmules (Table 1).
Traditional Diversity indices: Shannon Index and Evenness
The Shannon diversity index (H’) (Figure 7) and evenness (J’) (Figure 8)
were calculated for each enzyme treatment. For each enzyme, the hatched

15
gemmules had lower diversity and lower evenness than either the intact or the
crushed gemmules (Table 3).
Analysis of Similarity, Bray Curtis similarity dendrograms and MDS Plots
For the BstUI treated samples, analyses of similarity showed a significant
difference between the bacterial communities of hatched gemmules and both the
intact gemmules (p=0.008) and crushed gemmules (p=0.008). For the MspI
treated samples, the only significant difference observed was between the
hatched and intact gemmules (p=0.016). No significant differences were
observed between any of the gemmule treatments in the HaeIII treated samples.
For all three enzymes, there were no significant differences observed between
the intact and crushed gemmules.
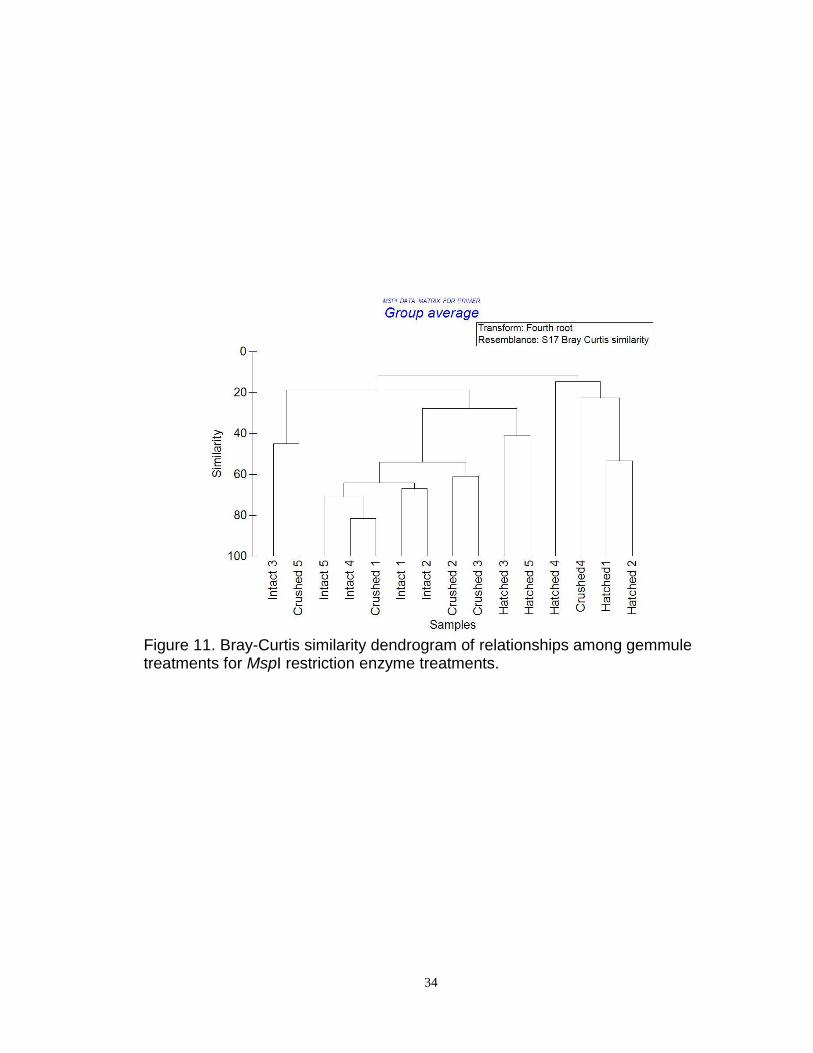
Bray Curtis similarity dendrograms provided visual support for the
ANOSIM statistical calculations. The BstUI dendrogram (Figure 9) clearly
distinguishes the hatched gemmule treatment from the intact gemmule and
crushed gemmule treatments, with the hatched gemmules occupying a distinct
separate branch of the dendrogram. Dendrograms for HaeIII (Figure 10) and
MspI (Figure 11) were less informative due to the lack of statistically significant
differences observed between the three gemmule treatments.
Two dimensional MDS (Multi-Dimensional Scaling) plots illustrated the
differences between the three gemmule treatment groups for each of the
enzymes with low stress values (0.05-0.13) indicating that these plots are
consistent with the ANOSIM calculations and Bray Curtis similarity dendrograms.

16
The BstUI plot (Figure 12) clearly distinguishes the hatched gemmule treatment
from the intact and crushed gemmule treatments. MDS plots for HaeIII
(Figure 13) and MspI (Figure 14) illustrate some distinction between treatment
groups, but lack of significance between groups is also clearly presented. Data
for all three enzymes was combined into a single matrix and an MDS plot created
from this data set clearly illustrates distinct differences among the bacterial
communities of intact, crushed and hatched gemmules (Figure 15).
Rarefaction Curves
Rarefaction curves for all three enzyme treatments illustrated the
differences in the rate of species accumulation for each of the gemmule
treatments. For the BstUI (Figures 16-19) and MspI (Figures 26-29) enzyme
treatments, there were no significant differences observed between the number
of species accumulated in the intact, crushed and hatched gemmules. For the
HaeIII enzyme treatment (Figures 21-24), hatched gemmules treated with HaeIII
accumulated significantly fewer species than both the intact and crushed
gemmules (p<0.05).
Natural log transformations of the rarefaction curves for each of the three
restriction enzymes allowed a comparison of the slope and y-intercepts of the
three gemmule treatments (Figures 20, 25, 30). Rarefaction curves were
compared among treatments using an analysis of covariance (ANCOVA) of log-
transformed data. ANCOVA analysis reported that the rates of species
accumulation among the three gemmule treatments were significantly different
for both the BstUI (p<0.001) and MspI (p<0.001) restriction enzymes. However

17
the rates of species accumulation among treatments were not significantly
different for the HaeIII restriction enzyme (P=0.120).
Percent Coverage of T-RFLP Profiles
Percent coverage of species in the community was estimated with the
Chao2 estimator for each enzyme and gemmule treatment to determine how
effectively the T-RFLP method estimates of the number of sponge associated
bacteria. Percent coverage ranged from 30.0% for the HaeIII intact gemmules to
91.5% for BstUI crushed gemmules (Table 3).
Clone Library and Taxonomic Identification of Bacteria
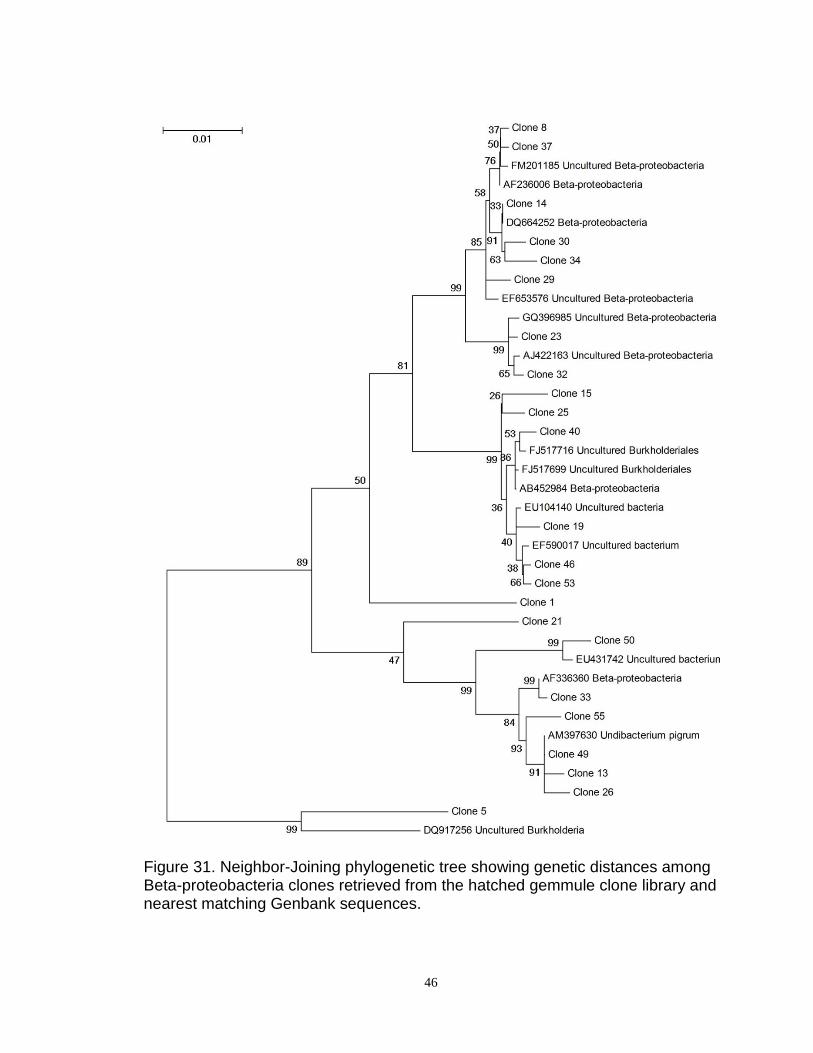
55 clones of 16S r-RNA genes were sequenced from the hatched
gemmule clone library. A blast search in Genbank identified 42 unique bacteria
species with highly similar matches to those from the clone library. Neighbor-
joining phylogenetic trees were constructed from the 55 clone library sequences
and 42 Genbank matching sequences (Figures 31-34). The most abundant major
bacterial taxa identified were alpha-proteobacteria, beta-proteobacteria, gamma-
proteobacteria, and bacteriodetes. Acidobacteria, Nitrospirae, and
Gemmatimonadetes were also present (Figure 35).
For the hatched gemmule T-RF profiles, the Phylogenetic Assignment
Tool (PAT) identified 724 unique potential species matches from the T-RF
database of bacterial species, with multiple possible bacterial species matches
for each of the individual T-RF profiles. For the enzyme BstUI, 55.5% of all T-

18
RF’s were matched with at least one bacterial species from the database. For the
enzyme HaeIII, 71.1% of all T-RF’s were matched with at least one bacterial
species from the database. For the enzyme MspI, 87.9% of all T-RF’s were
matched with at least one bacterial species from the database. When the
T-RFLP profiles were compared with the T-RF database of clone library
sequences, PAT identified 31 possible sequence matches representing 25
unique clones from the 42 unique clone library sequences. Nine of the clone
library sequences were matched by PAT using a database of all three restriction
enzymes, and 22 additional sequences were matched using databases of two
restriction enzymes (Table 4).

19
DISCUSSION
Although previous studies reported that it was possible to surface-sterilize
gemmules of different species than those used in this study without affecting their
ability to hatch (Funayama et al. 2005, Strekal and McDiffett 1974), all
combinations of sterilization treatments were unsuccessful in this study.
However, these previous studies relied on traditional bacterial culture techniques
which are not reliable for culturing most bacterial species (Hugenholtz et al.,
2008). Because it is not possible to culture most sponge-associated bacteria, the
PCR technique used in this study was able to identify the presence of bacteria on
treated gemmules which eluded previous sterilization methods. Although it was
possible to sterilize the outer surface of gemmules with a combined treatment of
hydrogen peroxide and sodium hypochlorite, none of the treatments sterilized the
gemmules without negatively affecting their ability to hatch. Because it was not
possible to hatch surface-sterilized gemmules, this study was could not
determine if bacterial symbionts were packaged inside gemmules, and therefore
transmitted vertically from adult sponges to their gemmules.
In this investigation, T-RFLP analysis demonstrated that there are notable
differences between the bacterial community associated with hatched freshwater
sponges and that of their intact and crushed gemmules. For the BstUI and HaeIII
enzyme treatments, the total number of species identified in the hatched
gemmules was lower than the total number of species identified in both the intact

20
and crushed gemmules. For the MspI enzyme treatment, the total number of
species indentified was similar among the hatched sponges and intact and
crushed gemmules. In addition, the MspI enzyme treatment identified fewer
species than both the BstUI and HaeIII enzyme treatments, indicating that this
enzyme was least effective for differentiating different species within the bacterial
community of freshwater sponges and their gemmules (Figure 6). This is
supported by a previous study in which the restriction enzyme MspI identified
fewer sponge-associated bacterial species than the restriction enzyme HaeIII
(Erwin, 2007 dissertation), and suggests that this enzyme is less informative than
the other enzymes used in this study for characterizing the bacterial community
of freshwater sponge gemmules.
The traditional diversity indices of the Shannon Index (H’) and
Pielou's evenness index (J’) demonstrated that hatched gemmules harbor a
bacterial community that is less diverse and less even than those of the intact
and crushed gemmules. This indicates that hatched sponges harbor fewer
bacterial species than their gemmules, and that some bacterial species
associated with hatched gemmules dominate the bacterial community, while
these same species are less prevalent in both the intact and crushed gemmules
prior to hatching. Previous feeding studies demonstrated that sponges were able
to distinguish between their bacterial symbionts and bacterial species found in
seawater, retaining and consuming the seawater bacteria while expelling their
symbionts. (Wilkinson et al., 1984, Wehrl et al. 2007). Our study supports these
previous studies, as the decrease in the diversity of the bacterial community
associated with hatched gemmules suggests that these freshwater sponges were
21
also selectively feeding upon the bacterial species which were not recognized as
symbionts.
These findings suggest that the bacterial community associated with
freshwater sponges may include host-specific bacterial species which are
favored by the sponges after hatching from their gemmules (Erwin et al. 2007,
Hill et al. 2005, Thacker et al. 2003, Taylor et al. 2004, Webster et al. 2004). This
is in contrast with previous studies which demonstrated that different species of
sponges harbor similar communities regardless of geography or taxonomic
relationship (Hentschel et al. 2002, Olson et al. 2005). In addition, the results of
this study are in contrast with those of another which reported that the bacterial
community of freshwater sponges resembled that of the lake from which they
were collected (Gernert et al., 2005). We found that the bacterial community
associated hatched sponges was less diverse and more even than that of the
gemmules from which they hatched. In both marine and freshwater sponges,
sponge-specific photosynthetic cyanobacteria have been identified (Erwin et al.
2007) and have been shown to benefit the sponge by improving the sponge’s
growth rate (Erwin et al. 2008). This type of mutualism may also be present
between freshwater sponges and their associated bacterial community, but
further investigation is necessary to identify potential host-specific symbionts.
Rarefaction curves created from T-RFLP profiles illustrated the differences
among the number of species accumulated for the three gemmule treatments.
For the BstUI and HaeIII enzyme treatments, the rarefaction curves for each
gemmule treatment demonstrated that the intact and crushed gemmules
accumulated more bacterial species than the hatched gemmules. For the MspI

22
enzyme treatment, the three rarefaction curves for each gemmule treatment were
similar and there was no clear distinction among the intact, crushed, or hatched
gemmules. ANCOVA analysis of natural log transformations of the rarefaction
curves for BstUI and MspI restriction enzymes indicated that the rate of species
accumulation was significantly different among the three gemmule treatments.
A clone library constructed from 55 clones identified 42 unique species
associated with the hatched freshwater sponges, but Chao2 diversity estimates
based upon T-RFLP data consistently reported that the number of sponge
associated bacterial species may be much higher than the clone library results
suggest. This may be because T-RFLP methods are capable of identifying rare
species that elude detection through traditional clone library methods. Also,
further sampling to increase the size of the clone library would likely identify more
rare species which were not identified in this study.
A total of 14 major bacterial lineages were identified with T-RFLP and CLC
analyses, however each method identified some bacterial lineages not identified
by the other. The clone library method identified 7 of these bacterial lineages,
while the T-RFLP method identified 10 bacterial lineages. This is likely due to T-
RFLP’s capability of identifying rare species which might otherwise elude
traditional clone library methods. Both methods identified alpha-proteobacteria,
beta-protobacteria, gamma-protetobacteria, nitrospira, and bacteriodetes
lineages.
When the T-RFLP profiles were compared to a large T-RF database of
known bacterial species profiles, the Phylogenetic Assignment tool (PAT)
identified over 700 potential species matches for bacteria associated with the

23
hatched sponges. In contrast, T-RFLP profiles recovered from the hatched
sponges identified a maximum of 51 T-RF’s in the HaeIII treated samples, and as
few as 32 in the MspI treated samples. This discrepancy is likely due to the
relatively low taxonomic resolution of T-RFLP analyses because T-RFLP only
reports the location of the site where the restriction enzyme cuts the sequence
but does not report any other information about the sequence. In contrast,
sequences derived from clone libraries produce the highest taxonomic resolution,
as they report the entire sequence which makes it possible to distinguish closely
related species that T-RFLP methods would identify as a single species. When
T-RFLP profiles of the hatched sponges were compared to a much smaller
internal databases of 42 bacterial species from the hatched sponge clone library,
PAT matched 31 T-RFLP profiles with sequences from the clone library,
demonstrating that it possible to rapidly identify sponge-associated bacterial
species of interest by comparing T-RF profiles to sponge-associated bacterial
species previously isolated from a clone library. Thus, it is possible to increase
the taxonomic resolution while maintaining the high throughput of the T-RFLP
method by directly matching T-RFLP profiles with known clone library sequences
using a combination of online analysis applications such as MicaIII, PAT, and
REMA.
There are several inherent biases which may affect the results of T-RFLP
analyses. Because T-RFLP is PCR based, it is possible that the efficiency of
amplification may vary among different species present in the bacterial
community. This amplification bias could cause some species to appear more or
less dominant in the community than they really are. There is also a discrepancy

24
between the predicted T-RF length determined by an in-silico digest of clone
library sequences and that which is reported by T-RFLP analysis, and it is
therefore necessary to compensate for this by defining a bin size of several base
pair for each predicted T-RF in order to match clone library sequences with T-RF
profiles (Kent et al., 2003). Additionally, T-RFLP makes the assumption that each
unique T-RF identified represents a single unique bacterial species (Marsh,
1999); however comparisons of T-RF profiles and an in-silico digest of clone
library sequences demonstrated that multiple bacterial species in the clone
library shared the same T-RF profile. Thus, the T-RFLP method tends to
oversimplify the true diversity of the bacterial community.
There are many possibilities for future studies of these freshwater
sponges. Analysis of the bacterial community in the field over time as well as
additional laboratory culturing of gemmules could provide much informative data
to further our understanding of the association between bacteria and their
freshwater sponge hosts. This study identified 2 sponge species not previously
reported in Shades Creek and the Cahaba River and correctly named three
species that had not previously been identified. The species identified were
Radiospongilla cerebellata, Ephydatia muelleri, and Corvospongilla becki. A
fourth species could not be identified to the genus level. Additional sampling of
Alabama watersheds may reveal additional species which have not previously
been reported. The use of fluorescent in situ hybridization methods to observe
the presence or absence of bacteria within the sponge gemmules could confirm
the vertical transmission hypothesis. Examination of gemmules using either

25
transmission or scanning electron microscopes could also identify the presence
of bacteria both inside the gemmules and on their exterior surfaces.
Freshwater sponges and their gemmules were found to harbor a diverse
community of bacteria which varies in its species composition, diversity, and
evenness at different stages of their lifecycles. Observation of these diverse
communities can be rapidly assessed with the use of T-RFLP methods which
provide significant information about the bacterial communities, and T-RFLP data
can be matched with that of traditional clone libraries to identify species of
interest more efficiently than previous methods allowed.
Freshwater sponges are particularly of interest for future research, as they
can be obtained locally and it is possible to store dormant gemmules for
extended periods of time and hatch them under controlled conditions when
desired. This is not possible with marine sponges, and thus freshwater sponges
are an ideal model organism for the study of sponges and their bacterial
communities under controlled conditions. Metazoan life often depends upon the
association between complex organisms and bacterial communities. Because
sponges are the earliest known metazoans, the elucidation of relationships
between sponges and their bacterial communities may help us to understand the
nature of symbiotic relationships at the most basal level, leading to a greater
understanding of symbiotic relationships between more complex species.

26
REFERENCES
Clarke, KR, Gorley, RN, (2006) PRIMER v6: User Manual/Tutorial. PRIMER-E, Plymouth. Colwell, R.K. (2006) EstimateS, Statistical Estimation of Species Richness and Shared Species from Samples Version 8. url <purl.gclc.org/estimates>. Culman, S.W.,et al. (2009) T-REX: Software for the Processing and Analysis of T-RFLP data. BMC Bioinformatics 10:171. Erwin, P. M., Thacker R.W. (2007) Incidence and identity of photosynthetic symbionts in Caribbean coral reef sponge communities. Journal of the Marine Biological Association of the United Kingdom 87: 1683-1692. Erwin, P. M., and Thacker R. W. (2008) Phototrophic nutrition and symbiont diversity of two Caribbean sponge-cyanobacteria symbioses. Marine Ecology Progress Series 362: 139-147. Frost, T.M., Reiswig, H.M., and Ricciardi, A. (2001) Chapter 4: Porifera. Ecology and Classification of North American Freshwater Invertebrates, Second Edition: p. 97-133. Academic Press. 2001. Funayama, N. et al. (2005) Isolation of the choanocyte in the freshwater sponge, Ephydatia fluvaitilis and its lineage marker, EF annexin. Develop. Growth Differ. 47: 243-253. Genert, C. et al. (2005) Micribial Diversity of the Freshwater Sponge Spongilla lacustris. Microbial Ecology 50: 206-212. Hentschel, U., et al. (2002) Molecular evidence for a uniform microbial community in sponges from different oceans. Appl Environ Microbiol 68: 4431-4440. Hill, M., Hill, A., Lopez, N., and Harriott, O. (2005) Sponge-specific bacterial symbionts in the Caribbean sponge, Chondrilla nucula (Demospongiae, Chondrosida). Marine Biology 148: 1221-1230.

27
Hodges, T.W., Olson, J.B. (2008) Molecular Comparison of Bacterial Communities within Iron-Flocculent Mats Associated with Submarine Volcanoes along the Kermadec Arc. Applied Environmental Microbiology 75: 1650-1657. Loomis, S.H. et al. (1996) Metabolism of Gemmules from the Freshwater Sponge Eunapiusfragilis During Diapause and Post-Diapause States. Biological Bulletin 191: 385-392. Kent, A.D., Smith, D.J., Benson, B.J., and Triplett, E.W. (2003) Web-based Phylogenetic Assignment Tool for Analysis of Terminal Restriction Fragment Polymorphism Profiles of Microbial Communities. Appl Environ Microbiol 69: 6768-6776. Liu, W., Marsh, T.L., Cheng, H., and Forney, L.J. (1997) Characterization of microbial diversity by determining terminal restriction fragment polymorphisms of genes encoding 16S rRNA. Appl Environ Microbiol 63: 4516-4522. Magnusson, T. (2005) Master’s Thesis: A Comparison of Microbial Communities Associated with the Freshwater Sponges Radiospongilla crateriformis and Eunapius fragilis. Loomis, S.H. et al. (1996) Metabolism of Gemmules from the Freshwater Sponge Eunapius fragilis During Diapause and Post-Diapause States. Biological Bulletin 191: 385-392. Marsh, T.L. (1999) Terminal restriction fragment polymorphism (T-RFLP): an emerging method for characterizing diversity among homologous populations of amplification products. Curr Opin Microbiol 2: 323-327. Olson, J.B., and McCarthy, P.J. (2005) Associated bacterial communities of two deepwater sponges. Aquat Microb Ecol 39: 47-55. Osborne, C.A., et al. (2006) New threshold and confidence estimates for terminal restriction fragment length polymorphism analysis of complex bacterial communities. Appl Environ Microbiol 72: 1270-1278. Pennak, R.W. Fresh-Water Invertebrates of the United States: Protozoa to Mollusca 3rd Edition: p. 91-109. John Wiley & Sons, Inc., New York. 1989. Penney, J. T. and Racek A.A. (1968) Comprehensive revision of a worldwide collection of freshwater sponges (Porifera : Spongillidae). Bull. U. Nat. Mus. 272: 1-184. Reiswig, H.M., Miller, T.L. (1988) Freshwater Gemmules Survive Months of Anoxia. Invertebrate Biology 117: 1-8.

28
Sharp, K.H. et al. (2007) Vertical Transmission of Diverse Microbes in the Tropical Sponge Corticum sp. Applied and Environmental Microbiology 73: 622-629. Schmitt, S. et al. (2007) Vertical Transmission of a Phylogenetically Complex Microbial Consortium in the Viviparous Sponge Ircinia felix. Applied Environmental Biology 73:7 2067-2078. Shyu, C., et al. (2007) MiCA: A Web-Based Tool for the Analysis of Microbial Communities Based on Terminal-Restriction Fragment Length Polymorphisms of 16S and 18S rRNA Genes. Journal of Microbial Ecology 53:562-570. Strekal, T.A., McDiffett W.F. (1974) Factors Affecting the Germination, Growth, and Distribution of the Freshwater Sponge Spongilla fragilis leidy (Porifera). Biological Bulletin 146: 267-278. Szubert, J., Et al. (2007) REMA: A computer-based mapping tool for analysis of restriction sites in multiple DNA sequences Journal of Microbiological Methods. 69: 411-413. Taylor, M.W., et al. (2004) Host specificity in marine sponge-associated bacteria, and potential implications for marine microbial diversity. Environmental Microbiology 6: 121-130. Thacker, R.W., and Sarnes, S. (2003) Host Specificity of the symbiotic cyanobacterium Oscillatoria spongeliae in marine sponges, Dysidea spp. Marine Biology 142: 643-648. Webster, N.S., Wilson, K., Blackall, L.L., and Hill, R.T. (2001) Phylogenetic diversity of the bacterial communities associated with the marine sponge, Rhopaloeides odorabile. Applied Environmental Microbiology 67: 434-444. Webster, N.S.,et al. (2004) Diverse Microbial Communities Inhabit Antarctic Sponges. Environ Microbiol 6: 288-300. Wehrl, M. et al. (2007) Bacterial Uptake by the Marine Sponge Aplysina aerophoba. Microbial Ecology 53: 355-365. Wilkinson, C.R. et al. (1984) Marine Sponges Discriminiate between Food Bacteria and Bacterial Symbionts: Electron Microscope Radioautography and in-situ Evidence. Proceedings of the Royal Society of London. Series B, Biological Sciences 220:1221 519-528.

29
FIGURES
Figure 1. Adult specimen of Radiospongilla cerebellata from Shades Creek.
Figure 2. Gemmules of Radiospongilla cerebellata. Gemmules are visible within disintegrating adult sponge tissue collected 10/15/2008.

30
Figure 3. Hatched Radiospongilla cerebellata gemmules. Hatched gemmules were grown under sterile laboratory conditions.
Figure 4. Megascleres and gemmosclere spicules of Radiospongilla cerebellata

31
Figure 5. Mean number of T-RF’s observed for each restriction enzyme treatment. For all restriction enzymes, there were no significant differences observed among the three gemmules treatments.
Figure 6. Total number of unique T-RF’s identified for each gemmule and restriction enzyme treatment.
0
5
10
15
20
25
30
35
40
45
BstUI HaeIII MspI
mean intact
mean crushed
mean hatched
Sp
ecie
s O
bse
rve
d
Restriction Enzyme
55
91
38
54
94
2938
51
32
77
130
62
BstUI HaeIII MspI
T-RFLP Profiles
Intact Gemmules Crushed Gemmules Hatched Gemmules Total T-RF's

32
Figure 7. Mean Shannon index of diversity for each gemmule treatment by restriction enzyme. Error bars indicate standard error of the means.
Figure 8. Mean Evenness for each gemmule treatment by restriction enzyme. Error bars indicate standard error of the means.
0
0.5
1
1.5
2
2.5
3
3.5
4
BstUI HaeIII MspI
mean intact
mean crushed
mean hatchedSh
an
no
nIn
de
x
Restriction Enzyme
0
0.1
0.2
0.3
0.4
0.5
0.6
0.7
0.8
0.9
1
BstUI HaeIII MspI
mean intact
mean crushed
mean hatched
Eve
nn
ne
ss
Restriction Enzyme

33
Figure 9. Bray-Curtis similarity dendrogram of relationships among gemmule treatments for the BstUIrestriction enzyme.
Figure 10. Bray-Curtis similarity dendrogram of relationships among gemmule treatments for HaeIII restriction enzyme.
34
Figure 11. Bray-Curtis similarity dendrogram of relationships among gemmule treatments for MspI restriction enzyme treatments.

35
Figure 12. Multi-dimensional Scaling similarity plot of the BstUI restriction enzyme treatment.
Figure 13. Multi-dimensional Scaling similarity plot of the HaeIII restriction enzyme treatment.

36
Figure 14. Multi-dimensional Scaling similarity plot of the MspI restriction enzyme treatment.
Figure 15. Multi-dimensional Scaling similarity plot of combined data for all enzyme treatments.

37
Figure 16. Rarefaction curve for BstUI treated intact gemmules. Dotted lines indicate 95% confidence values.
Figure 17. Rarefaction curve for BstUI treated crushed gemmules. Dotted lines indicate 95% confidence values.
0
10
20
30
40
50
60
70
0 1 2 3 4 5
Spe
cie
s O
bse
rve
d
Sample
BstUI Intact Gemmules
0
10
20
30
40
50
60
70
0 1 2 3 4 5
Spe
cie
s O
bse
rve
d
Sample
BstUI Crushed Gemmules

38
Figure 18. Rarefaction curve for BstUI treated hatched gemmules. Dotted lines indicate 95% confidence values.
Figure 19. Combined rarefaction curves for all BstUI gemmule treatments. Hatched gemmules accumulated fewer species than both intact and crushed gemmules.
0
5
10
15
20
25
30
35
40
45
50
0 1 2 3 4 5
Spe
cie
s O
bse
rve
d
Sample
BstUI Hatched Gemmules
0
10
20
30
40
50
60
0 1 2 3 4 5
Spe
cie
s O
bse
rve
d
Sample
BstUI Rarefaction Curves
Intact
Crushed
Hatched

39
Figure 20. Natural log transformation of rarefaction curves for the BstUI restriction enzyme. The three gemmule treatments had similar slopes, but the Y-intercept of the hatched gemmules was lower than that of the intact and crushed gemmules. ANCOVA analysis reported that the rates of species accumulation among treatments were significantly different (p<0.001).
0
0.5
1
1.5
2
2.5
3
3.5
4
4.5
0 0.5 1 1.5 2
ln s
pe
cie
s o
bse
rve
d
ln replicate
BstUI
Intact
Crushed
Hatched

40
Figure 21. Rarefaction curve for HaeIII treated intact gemmules. Dotted lines indicate 95% confidence values.
Figure 22. Rarefaction curve for HaeIII treated crushed gemmules. Dotted lines indicate 95% confidence values
0
20
40
60
80
100
120
0 1 2 3 4 5
Spe
cie
s O
bse
rve
d
Sample
HaeIII Intact Gemmules
0
20
40
60
80
100
120
0 1 2 3 4 5
Spe
cie
s O
bse
rve
d
Sample
HaeIII Crushed Gemmules

41
Figure 23. Rarefaction curve for HaeIII treated hatched gemmules. Dotted lines indicate 95% confidence values.
Figure 24. Combined rarefaction curves for all HaeIII gemmule treatments. Hatched gemmules accumulated fewer species than both intact and crushed gemmules.
0
10
20
30
40
50
60
70
0 1 2 3 4 5
Spe
cie
s O
bse
rve
d
Sample
HaeIII Hatched Gemmules
0
10
20
30
40
50
60
70
80
90
100
0 1 2 3 4 5
Spe
cie
s O
bse
rve
d
Sample
HaeIII Rarefaction Curves
Intact
Crushed
Hatched

42
Figure 25. Natural log transformation of rarefaction curves for the HaeIII restriction enzyme. The three gemmule treatments had similar slopes, but the Y-intercept of the hatched gemmules was lower than that of the intact and crushed gemmules. ANCOVA analysis reported that the rates of species accumulation among treatments were not significantly different. (p=0.120).
0
0.5
1
1.5
2
2.5
3
3.5
4
4.5
5
0 0.5 1 1.5 2
ln s
pe
cie
s o
bse
rve
d
ln replicate
HaeIII
Intact
Crushed
Hatched

43
Figure 26. Rarefaction curve for MspI treated intact gemmules. Dotted lines indicate 95% confidence values.
Figure 27. Rarefaction curve for MspI treated crushed gemmules. Dotted lines indicate 95% confidence values.
0
10
20
30
40
50
60
0 1 2 3 4 5
Spe
cie
s O
bse
rve
d
Sample
MspI Intact Gemmules
0
5
10
15
20
25
30
35
40
45
0 1 2 3 4 5
Spe
cie
s O
bse
rve
d
Sample
MspI Crushed Gemmules

44
Figure 28. Rarefaction curve for MspI treated hatched gemmules. Dotted lines indicate 95% confidence values.
Figure 29. Combined rarefaction curves for all MspI gemmule treatments. No significant difference was observed between the three treatments.
0
5
10
15
20
25
30
35
40
45
0 1 2 3 4 5
Spe
cie
s O
bse
rve
d
Sample
MspI Hatched Gemmules
0
5
10
15
20
25
30
35
40
0 1 2 3 4 5
Spe
cie
s O
bse
rve
d
Sample
MspI Rarefaction Curves
Intact
Crushed
Hatched

45
Figure 30. Natural log transformation of rarefaction curves for the MspI restriction enzyme. The three gemmule treatments had similar slopes, but the Y-intercept of the intact was greater than that of the hatched and crushed gemmules. ANCOVA analysis reported that the rates of species accumulation among treatments were significantly different (p<0.001).
0
0.5
1
1.5
2
2.5
3
3.5
4
0 0.5 1 1.5 2
ln s
pe
cie
s o
bse
rve
d
ln replicate
MspI
Intact
Crushed
Hatched
46
Figure 31. Neighbor-Joining phylogenetic tree showing genetic distances among Beta-proteobacteria clones retrieved from the hatched gemmule clone library and nearest matching Genbank sequences.

47
Figure 32. Neighbor-Joining bootstrap consensus phylogenetic tree showing genetic distances among Gamma-proteobacteria clones retrieved from the hatched gemmule clone library and nearest matching Genbank sequences.
Figure 33. Neighbor-Joining bootstrap consensus phylogenetic tree showing genetic distances among clones of Alpha-proteobacteria, Acidobacteria, Nitrospirae, and Gemmatimonadales retrieved from the hatched gemmule clone library and nearest matching Genbank sequences.

48
Figure 34. Neighbor-Joining bootstrap consensus phylogenetic tree showing genetic distances among Bacteriodetes clones retrieved from the hatched gemmule clone library and nearest mat ching Genbank sequences
Figure 35. Percent composition of major taxonomic groups of bacteria identified in the hatched sponge clone library. The community was dominated by Beta-proteobacteria, followed by Alpha-proteobacteria, Bacteriodetes, and Gamma-proteobacteria.
43%
13%
20%
18%
2%
2% 2%
Beta-Proteobacteria
Gamma-Proteobacteria
Alpha-Proteobacteria
Bacteroidetes
Acidobacteria
Nitrospirae
Gemmatimonadetes

49
TABLES
Table 1. Number of bacterial species ubiquitous and unique to hatched gemmules identified with T-RFLP analyses.
Restriction Enzyme Ubiquitous Unique to Hatched
Gemmules
BstUI 23 9
HaeIII 19 12
MspI 16 10
Table 2. Major bacterial divisions identified in T-RFLP and clone library analyses from hatched gemmules. T-RF’s were analyzed with the phylogenetic assignment tool (PAT). Clone library was assembled from 16S rRNA clones. Clone library construction of 42 sequences identified 7 major taxonomic groups of bacteria. T-RFLP identified 10 major taxonomic groups of bacteria.
Bacterial Division CLC T-RFLP
Acidobacteria X
Bacteroidetes X X
Chlamydiae/Verrucomicrobia X
Chloroflexi X
Firmicutes X
Gemmatimonadetes X
Nitrospira X X
Planctomycetes X
Proteobacteria
Alpha-proteobacteria
Beta-proteobacteria
Gamma-proteobacteria
X
X
X
X
X
X
Tenericutes X

50
Table 3. Traditional diversity indices for each enzyme treatment. Percent coverage estimates are based upon total T-RF’s observed and Chao 2 calculations. The Significance level of pair-wise comparisons for mean T-RF’s, Pair-wise comparisons of Shannon Index and Evenness reported by ANOVA are represented by A,B,C, with different letters indicating p-values <0.05.
Total T-RF’s
Observed
Mean T-RF’s Observed
(± SE)
Mean Shannon Index (H’)
(± SE)
Mean Evenness (J’)
(± SE)
Chao 2 Estimate
Percent Coverage
BstUI
Intact Gemmules 55 31.0 ± 6.10
A 3.00 ± 0.17
A 0.903 ± 0.017
A 65.5 84.0%
Crushed Gemmules 54 32.8 ± 7.43
A 2.98 ± 0.400
AB 0.934 ± 0.016
B 59 91.5%
Hatched Gemmules 38 20.6 ± 1.81
A 2.30 ± 0.047
B 0.767 ± 0.012
C 70 54.3%
p=0.293 p=0.127 p<0.001
HaeIII
Intact Gemmules 91 33.8 ± 5.05
A 2.97 ± 0.141
A 0.855 ± 0.014
A 233.6 39.0%
Crushed Gemmules 94 31.0 ± 7.96
A 3.03 ± 0.221
A 0.927 ± 0.013
B 231.3 40.6%
Hatched Gemmules 51 19.4 ± 2.76
A 2.17 ± 0.105
B 0.748 ± 0.043
C 60.5 84.9 %
p=0.205 p=0.004 p<0.001
MspI
Intact Gemmules 38 17.0 ± 2.12
A 2.51 ± 0.197
A 0.89 ± 0.028
A 51 74.5%
Crushed Gemmules 29 10.6 ± 2.46
AB 2.07 ± 0.269
A 0.94 ± 0.011
B 39.5 73.4%
Hatched Gemmules 32 9.6 ± 2.38
B 1.21 ± 0.219
B 0.55 ± 0.058
C 50.7 63.1%
p=0.088 p=0.005 p<0.001

51
Table 4. Comparison of Clone library and T-RFLP results displaying the closest Genbank match to each clone matched with at T-RF profile, predicted T-RF length based upon in-silico restriction digestion of clone library sequences, and percent abundance for matching T-RF profiles and clone library sequences. Nine clones were matched with the database of T-RF profiles of all three restriction enzymes. Twenty-two additional clones were matched with databases of T-RF profiles of two of the three restriction enzymes.
Clone
ID
Closest matching
Genbank
Ascension #
Predicted T-RF’s
BstUI HaeIII MspI
T-RFLP P Mean
Abundance
BstUI HaeIII MspI
Abundance in
Clone Library
Clone 5 DQ917256 198 212 483 0.2% 10.9% 56.2% 1.8%
Clone 29 EF653576 198 212 483 0.2% 10.9% 56.2% 1.8%
Clone 30 DQ664252 198 193 483 0.2% 0.8% 56.2% 3.6%
Clone 34 DQ664252 198 193 483 0.2% 0.8% 56.2% 3.6%
Clone 33 AF336360 198 193 483 0.2% 0.8% 56.2% 1.8%
Clone 8 AF236008 203 217 488 0.7% 24.0% 4.7% 1.8%
Clone 24 FN428786 203 217 488 0.7% 24.0% 4.7% 1.8%
Clone 40 EU104140 204 218 489 0.7% 21.0% 4.7% 1.8%
Clone 10 AF005179 384 248 485 24.4% 0.1% 56.2% 1.8%
Clone 2 EU861860 381 218 0.3% 21.0% 1.8%
Clone 11 EF019693 396 211 0.1% 10.9% 3.6%
Clone 28 EF019693 396 211 0.1% 10.9% 3.6%
Clone 20 AB504926 394 258 0.2% 1.5% 1.8%
Clone 3 AB308368 380 475 14.6% 8.4% 5.5%
Clone 16 AB308368 380 475 14.6% 8.4% 5.5%
Clone 39 AB308368 380 475 14.6% 8.4% 5.5%
Clone 6 FJ593908 380 475 14.6% 8.4% 1.8%
Clone 18 AY250110 389 490 0.4% 4.7% 1.8%
Clone 27 EU193055 388 489 0.4% 4.7% 1.8%
Clone 38 AY247063 389 490 0.4% 4.7% 1.8%
Clone 41 AY512611 389 490 0.4% 4.7% 1.8%
Clone 43 CP000774 214 456 0.1% 0.4% 1.8%
Clone 1 AM397630 217 488 24.0% 4.7% 3.6%
Clone 13 AM397630 217 488 24.0% 4.7% 3.6%
Clone 7 FJ687971 225 437 15.1% 0.6% 3.6%
Clone 35 FJ687971 190 436 2.3% 0.6% 3.6%
Clone 15 FJ517716 219 490 2.8% 4.7% 1.8%
Clone 19 AB452984 219 490 2.8% 4.7% 1.8%
Clone 25 FJ517699 219 490 2.8% 4.7% 1.8%
Clone 32 AJ422163 219 490 2.8% 4.7% 1.8%
Clone 37 FM201185 219 490 2.8% 4.7% 1.8%

52
APPENDIX I
T-RFLP Relative Abundance Matrices
BstUI T-RFLP Relative Abundance Matrix
TRF I 1 I 2 I 3 I 4 I 5 C 1 C 2 C 3 C 4 5 H 1 H 2 H 3 H4 H5
101G 2.63 1.80 1.51 2.27 3.83 0.00 3.18 1.99 1.27 3.12 0.00 0.00 0.00 0.00 0.00
102G 1.83 0.46 0.00 0.00 0.00 0.00 1.16 1.02 1.23 0.69 0.00 0.00 0.00 0.00 0.00
103G 0.00 0.49 0.65 1.22 0.00 0.00 0.00 0.00 0.00 0.00 0.00 0.00 0.00 0.00 0.00
104G 7.51 4.96 1.82 0.85 6.29 0.00 1.14 0.76 1.57 4.21 0.00 0.00 0.00 0.00 0.25
107G 0.00 0.63 0.70 0.54 0.00 0.00 0.00 0.55 0.49 0.00 0.00 0.00 0.00 0.00 0.00
114G 0.00 0.55 0.34 0.38 0.00 0.00 0.00 0.00 0.00 0.00 0.00 0.36 0.00 0.00 0.00
128G 0.00 0.00 0.00 0.00 0.00 0.00 0.00 0.00 0.45 0.00 0.00 0.00 0.00 0.00 0.00
137G 0.00 0.00 0.00 0.42 0.00 0.00 0.00 0.00 0.00 0.00 0.00 0.00 0.00 0.00 0.00
144G 0.00 0.00 0.00 0.00 5.91 0.00 0.00 0.00 0.00 0.00 0.00 0.00 0.00 0.00 0.00
190G 5.88 4.06 3.86 5.89 9.74 0.00 2.28 5.55 4.10 5.27 2.00 0.94 1.33 1.44 1.31
191G 0.00 0.00 0.00 0.00 0.00 0.00 0.96 1.66 1.79 0.00 2.16 0.92 1.19 1.50 0.92
193G 0.00 0.00 0.00 0.00 0.00 0.00 0.00 0.00 0.38 0.00 0.00 0.00 0.00 0.00 0.00
194G 2.04 1.49 2.06 2.20 0.00 0.00 5.68 1.17 2.13 1.90 0.00 0.00 0.00 0.00 0.00
195G 3.47 2.33 2.00 2.70 4.83 0.00 4.79 5.00 4.36 3.79 2.63 16.31 14.30 5.02 14.96
196G 0.00 0.90 1.35 1.24 0.00 0.00 0.00 0.00 0.00 0.00 0.00 0.00 0.00 0.76 9.70
197G 0.00 0.00 0.00 0.00 0.00 0.00 0.00 0.00 0.00 0.00 0.00 0.93 0.00 0.00 0.00

53
200G 0.00 0.00 0.34 0.00 0.00 0.00 0.00 0.00 0.00 0.00 11.23 4.87 7.92 5.30 3.12
201G 3.45 4.21 7.15 3.81 0.00 0.00 1.15 1.57 2.15 2.61 5.16 2.37 2.00 2.57 1.85
203G 3.50 4.22 5.86 3.84 3.55 0.00 1.38 2.44 2.59 2.49 2.16 0.89 0.00 1.27 1.48
205G 0.00 0.00 0.00 0.47 0.00 0.00 0.00 1.04 0.50 0.61 0.00 0.00 0.00 0.00 0.00
207G 0.00 0.55 0.00 0.00 0.00 0.00 0.00 0.00 0.00 0.00 0.00 0.00 0.00 0.00 0.00
207G 0.00 0.53 1.09 0.64 0.00 0.00 1.10 0.80 0.92 0.95 0.00 0.00 0.00 0.00 0.00
209G 0.00 0.00 0.32 0.00 0.00 0.00 0.00 0.00 0.00 0.00 0.00 0.00 0.00 0.00 0.00
211G 0.00 0.46 0.00 0.00 0.00 0.00 0.00 0.00 0.00 0.00 0.00 0.00 0.00 0.00 0.00
214G 0.00 0.00 0.00 0.00 0.00 0.00 1.66 0.00 0.00 0.00 0.00 0.00 0.00 0.00 0.00
215G 0.00 0.00 0.00 0.00 0.00 27.57 0.75 0.00 0.00 0.00 0.00 0.30 0.00 0.00 0.00
226G 0.00 0.00 0.00 0.00 0.00 0.00 1.66 0.00 0.00 1.47 0.00 0.00 0.00 0.00 0.00
230G 0.00 0.00 0.00 0.00 0.00 0.00 0.00 0.00 0.00 0.00 1.11 0.00 0.00 0.00 0.00
232G 0.00 0.00 0.00 0.00 0.00 0.00 0.00 0.00 0.45 0.00 0.00 0.00 0.00 0.00 0.00
234G 0.00 0.00 0.00 0.54 0.00 0.00 0.00 1.00 1.02 0.00 0.00 0.00 0.00 0.00 0.00
235G 0.00 0.00 0.65 0.00 0.00 0.00 0.00 0.00 0.00 0.00 0.00 0.00 0.00 0.00 0.00
240G 0.00 0.88 1.43 1.42 0.00 0.00 1.28 1.32 0.99 1.04 0.00 0.00 0.00 0.00 0.00
243G 0.00 0.00 0.00 0.00 0.00 0.00 0.00 0.00 0.46 0.00 0.00 0.00 0.00 0.00 0.00
263G 0.00 0.00 0.00 0.58 0.00 0.00 0.00 0.00 0.00 0.00 0.00 0.00 0.00 0.00 0.00
292G 0.00 1.03 0.00 0.80 0.00 0.00 0.00 0.00 0.00 0.00 0.00 0.00 0.00 0.00 0.00
324G 0.00 0.00 0.00 0.00 0.00 0.00 0.00 0.00 0.00 0.00 1.29 0.00 0.00 0.00 0.00
357G 9.50 7.27 5.84 8.61 12.50 25.88 3.89 9.64 8.25 7.65 2.24 1.53 2.92 3.22 2.24
357G 0.00 0.00 0.00 0.00 0.00 0.00 0.00 0.00 0.00 0.00 2.61 1.46 2.09 0.00 1.48
360G 0.00 0.92 0.70 1.05 0.00 0.00 4.34 1.55 2.86 2.49 0.00 0.55 0.00 0.00 0.29
361G 3.44 2.55 1.82 2.48 0.00 0.00 7.24 3.65 3.63 3.12 1.12 0.65 1.07 1.20 0.49
362G 0.00 0.86 0.50 0.76 0.00 0.00 1.32 1.90 1.54 1.37 0.00 0.00 0.00 0.86 0.00
367G 0.00 0.00 0.00 0.00 0.00 0.00 0.00 0.00 0.00 0.00 1.28 0.00 0.00 0.00 0.00
370G 0.00 1.27 0.66 0.54 0.00 0.00 0.00 1.74 1.09 1.21 0.00 0.00 0.00 0.00 0.00
371G 0.00 0.00 0.00 0.46 0.00 0.00 0.00 0.00 0.00 0.00 0.00 0.00 0.00 0.00 0.00

54
372G 0.00 0.00 0.00 0.00 0.00 0.00 1.07 0.84 0.69 0.73 0.00 0.00 0.00 0.00 0.00
373G 0.00 0.75 0.88 0.00 0.00 0.00 0.00 0.52 0.50 0.00 0.00 0.00 0.00 0.00 0.00
374G 0.00 0.00 0.00 0.77 0.00 0.00 0.67 0.83 1.25 1.62 0.00 0.00 0.00 0.00 0.00
376G 3.11 1.45 0.96 1.37 0.00 0.00 2.52 0.88 0.68 0.00 0.00 3.90 1.12 3.07 0.37
378G 3.51 3.57 4.08 3.54 4.49 0.00 2.93 3.31 3.55 2.11 0.00 0.00 0.00 0.00 0.00
379G 0.00 0.00 0.00 0.00 0.00 0.00 0.00 0.00 0.00 0.00 0.00 18.54 19.41 7.72 25.71
380G 0.00 0.00 0.00 0.00 0.00 0.00 0.00 0.00 0.00 0.00 1.51 0.00 0.00 0.00 0.00
384G 3.19 0.00 0.00 0.00 3.85 21.12 9.07 4.22 0.00 9.44 36.47 19.33 24.62 29.68 11.94
384G 6.49 9.61 17.20 10.42 5.67 0.00 0.00 5.46 7.91 0.00 0.00 0.00 0.00 0.00 0.00
386G 0.00 3.38 3.04 1.64 0.00 0.00 4.11 1.28 3.88 1.80 15.29 13.95 11.89 18.92 14.62
386G 0.00 0.00 0.00 0.00 0.00 0.00 0.00 0.72 0.00 0.00 0.00 0.00 0.00 0.00 0.00
388G 13.51 7.50 7.81 5.01 18.20 0.00 4.68 2.30 3.29 6.19 0.00 0.64 0.00 0.67 0.55
391G 6.70 8.67 6.46 6.62 6.52 0.00 5.93 5.89 4.45 6.43 0.00 1.20 2.28 1.74 1.87
393G 0.00 0.00 0.00 1.66 0.00 0.00 0.00 0.50 0.00 0.00 0.00 0.00 0.00 1.09 0.00
396G 0.00 0.86 1.00 1.23 0.00 0.00 0.69 1.31 2.16 1.25 0.00 0.00 0.00 0.68 0.00
398G 0.00 0.00 0.00 0.00 0.00 0.00 3.04 0.00 0.00 0.00 0.00 0.00 0.00 0.00 0.00
399G 2.52 2.32 1.44 3.00 0.00 0.00 0.00 1.66 1.62 1.19 2.06 0.00 0.00 0.00 0.00
405G 0.00 0.00 1.76 0.00 0.00 0.00 1.21 0.65 0.93 0.00 0.00 0.00 0.00 0.00 0.00
406G 0.00 1.24 0.00 1.60 0.00 0.00 0.00 0.75 0.00 1.26 0.00 0.00 0.00 0.00 0.00
408G 0.00 0.00 0.00 0.00 0.00 0.00 0.00 0.00 0.99 0.00 0.00 0.00 0.00 0.00 0.00
456G 10.40 7.95 7.16 9.88 14.60 25.44 3.09 10.02 8.79 8.82 0.00 0.00 5.82 7.13 4.55
457G 0.00 0.00 0.00 0.00 0.00 0.00 0.00 0.00 0.00 0.00 8.59 3.80 0.00 0.00 0.00
459G 0.00 0.79 0.64 0.98 0.00 0.00 3.13 1.09 2.49 2.39 0.00 0.45 0.00 0.00 0.00
461G 3.81 3.16 1.83 2.63 0.00 0.00 5.36 3.44 3.49 3.33 0.00 0.40 0.00 1.33 0.35
462G 0.00 0.00 0.62 0.77 0.00 0.00 1.11 1.17 1.09 1.14 0.00 0.00 0.00 0.00 0.00
468G 0.00 0.61 0.00 0.44 0.00 0.00 0.00 1.45 0.82 0.91 0.00 0.38 0.00 0.00 0.00
471G 0.00 0.64 0.00 0.61 0.00 0.00 0.00 0.59 0.00 0.00 0.00 0.00 0.00 0.00 0.00
479G 0.00 1.70 1.62 1.34 0.00 0.00 1.68 2.50 2.76 1.72 0.00 0.36 0.00 0.00 0.00
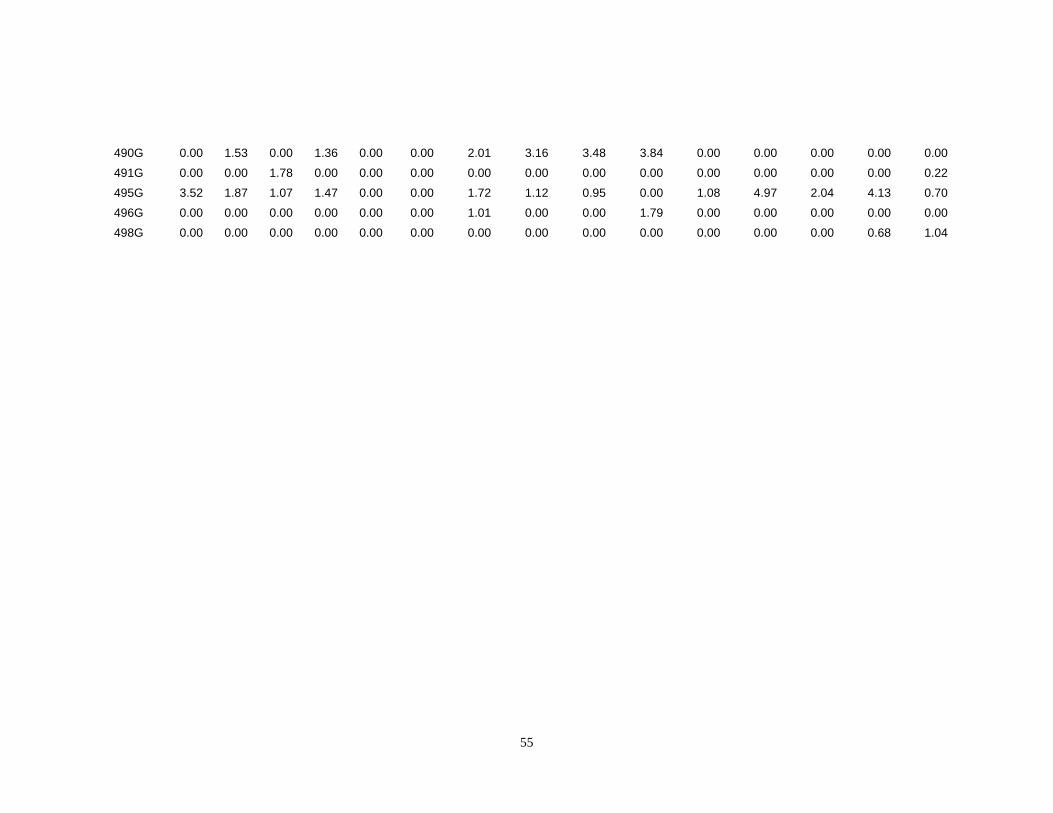
55
490G 0.00 1.53 0.00 1.36 0.00 0.00 2.01 3.16 3.48 3.84 0.00 0.00 0.00 0.00 0.00
491G 0.00 0.00 1.78 0.00 0.00 0.00 0.00 0.00 0.00 0.00 0.00 0.00 0.00 0.00 0.22
495G 3.52 1.87 1.07 1.47 0.00 0.00 1.72 1.12 0.95 0.00 1.08 4.97 2.04 4.13 0.70
496G 0.00 0.00 0.00 0.00 0.00 0.00 1.01 0.00 0.00 1.79 0.00 0.00 0.00 0.00 0.00
498G 0.00 0.00 0.00 0.00 0.00 0.00 0.00 0.00 0.00 0.00 0.00 0.00 0.00 0.68 1.04
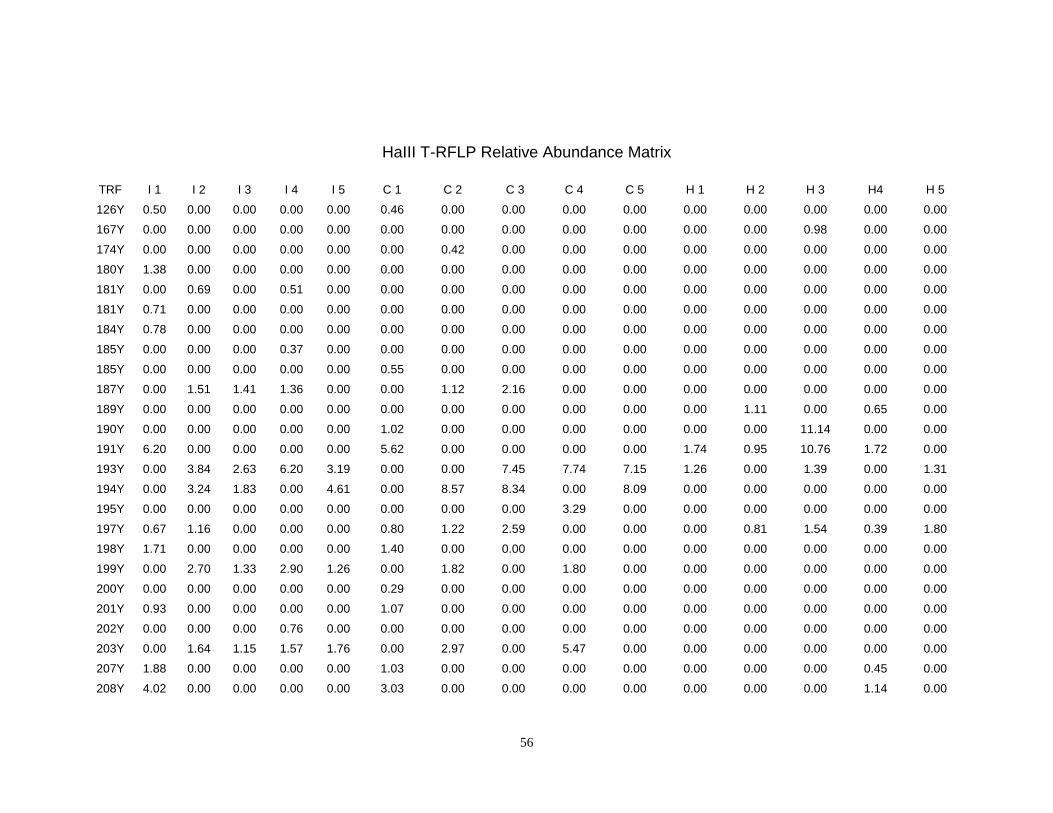
56
HaIII T-RFLP Relative Abundance Matrix
TRF I 1 I 2 I 3 I 4 I 5 C 1 C 2 C 3 C 4 C 5 H 1 H 2 H 3 H4 H 5
126Y 0.50 0.00 0.00 0.00 0.00 0.46 0.00 0.00 0.00 0.00 0.00 0.00 0.00 0.00 0.00
167Y 0.00 0.00 0.00 0.00 0.00 0.00 0.00 0.00 0.00 0.00 0.00 0.00 0.98 0.00 0.00
174Y 0.00 0.00 0.00 0.00 0.00 0.00 0.42 0.00 0.00 0.00 0.00 0.00 0.00 0.00 0.00
180Y 1.38 0.00 0.00 0.00 0.00 0.00 0.00 0.00 0.00 0.00 0.00 0.00 0.00 0.00 0.00
181Y 0.00 0.69 0.00 0.51 0.00 0.00 0.00 0.00 0.00 0.00 0.00 0.00 0.00 0.00 0.00
181Y 0.71 0.00 0.00 0.00 0.00 0.00 0.00 0.00 0.00 0.00 0.00 0.00 0.00 0.00 0.00
184Y 0.78 0.00 0.00 0.00 0.00 0.00 0.00 0.00 0.00 0.00 0.00 0.00 0.00 0.00 0.00
185Y 0.00 0.00 0.00 0.37 0.00 0.00 0.00 0.00 0.00 0.00 0.00 0.00 0.00 0.00 0.00
185Y 0.00 0.00 0.00 0.00 0.00 0.55 0.00 0.00 0.00 0.00 0.00 0.00 0.00 0.00 0.00
187Y 0.00 1.51 1.41 1.36 0.00 0.00 1.12 2.16 0.00 0.00 0.00 0.00 0.00 0.00 0.00
189Y 0.00 0.00 0.00 0.00 0.00 0.00 0.00 0.00 0.00 0.00 0.00 1.11 0.00 0.65 0.00
190Y 0.00 0.00 0.00 0.00 0.00 1.02 0.00 0.00 0.00 0.00 0.00 0.00 11.14 0.00 0.00
191Y 6.20 0.00 0.00 0.00 0.00 5.62 0.00 0.00 0.00 0.00 1.74 0.95 10.76 1.72 0.00
193Y 0.00 3.84 2.63 6.20 3.19 0.00 0.00 7.45 7.74 7.15 1.26 0.00 1.39 0.00 1.31
194Y 0.00 3.24 1.83 0.00 4.61 0.00 8.57 8.34 0.00 8.09 0.00 0.00 0.00 0.00 0.00
195Y 0.00 0.00 0.00 0.00 0.00 0.00 0.00 0.00 3.29 0.00 0.00 0.00 0.00 0.00 0.00
197Y 0.67 1.16 0.00 0.00 0.00 0.80 1.22 2.59 0.00 0.00 0.00 0.81 1.54 0.39 1.80
198Y 1.71 0.00 0.00 0.00 0.00 1.40 0.00 0.00 0.00 0.00 0.00 0.00 0.00 0.00 0.00
199Y 0.00 2.70 1.33 2.90 1.26 0.00 1.82 0.00 1.80 0.00 0.00 0.00 0.00 0.00 0.00
200Y 0.00 0.00 0.00 0.00 0.00 0.29 0.00 0.00 0.00 0.00 0.00 0.00 0.00 0.00 0.00
201Y 0.93 0.00 0.00 0.00 0.00 1.07 0.00 0.00 0.00 0.00 0.00 0.00 0.00 0.00 0.00
202Y 0.00 0.00 0.00 0.76 0.00 0.00 0.00 0.00 0.00 0.00 0.00 0.00 0.00 0.00 0.00
203Y 0.00 1.64 1.15 1.57 1.76 0.00 2.97 0.00 5.47 0.00 0.00 0.00 0.00 0.00 0.00
207Y 1.88 0.00 0.00 0.00 0.00 1.03 0.00 0.00 0.00 0.00 0.00 0.00 0.00 0.45 0.00
208Y 4.02 0.00 0.00 0.00 0.00 3.03 0.00 0.00 0.00 0.00 0.00 0.00 0.00 1.14 0.00

57
209Y 0.00 5.48 7.21 9.18 8.54 0.00 0.00 4.46 3.32 5.60 0.00 6.47 0.00 0.00 0.00
210Y 0.00 0.00 0.00 0.00 0.00 0.00 4.25 0.00 0.00 0.00 0.00 0.00 0.00 0.00 0.00
211Y 0.00 0.00 0.00 0.00 0.00 0.00 0.00 0.00 0.00 0.00 0.00 0.00 19.42 0.00 0.00
211Y 0.00 0.00 0.00 0.00 0.00 0.00 0.00 0.00 0.00 0.00 0.00 0.00 0.00 0.00 29.69
212Y 0.00 0.00 0.00 0.00 0.00 0.00 0.00 0.00 0.00 0.00 24.35 0.00 0.00 0.42 0.00
213Y 0.00 0.00 0.00 0.00 0.00 1.84 0.00 0.00 0.00 0.00 0.00 0.00 0.00 0.00 0.00
214Y 0.00 0.00 0.00 0.00 0.00 0.00 0.00 0.00 0.00 0.00 0.00 29.45 0.00 42.94 0.00
215Y 12.16 0.00 0.00 0.00 0.00 8.16 0.00 0.00 0.00 0.00 0.00 0.00 0.00 23.21 0.00
216Y 4.75 0.00 29.01 0.00 0.00 3.95 0.00 12.68 13.00 16.60 0.00 15.10 0.00 0.00 0.00
217Y 0.00 16.65 0.00 16.81 16.40 0.00 9.89 0.00 0.00 0.00 18.61 9.73 26.39 0.00 36.49
218Y 0.00 0.00 4.59 4.73 6.39 0.00 7.34 9.62 7.84 14.15 13.36 0.00 0.00 0.43 0.00
220Y 0.00 14.26 3.80 2.21 0.00 0.00 1.27 3.89 3.78 0.00 0.00 0.00 0.00 0.00 0.00
220Y 0.00 0.00 0.00 0.00 0.00 0.00 0.00 0.00 0.00 0.00 10.27 0.00 9.65 0.00 8.43
221Y 8.85 0.00 0.00 0.00 0.00 8.03 0.00 0.00 0.00 0.00 0.00 2.21 0.00 2.80 0.00
222Y 2.35 0.00 0.00 0.00 0.00 3.66 0.00 0.00 0.00 0.00 0.00 2.87 0.00 2.82 0.00
224Y 0.00 8.51 7.36 12.38 11.41 0.29 10.51 8.61 8.37 10.11 3.85 0.00 3.10 0.00 1.69
225Y 0.00 0.00 0.00 0.00 0.00 0.88 0.00 0.00 0.00 0.00 0.00 0.00 0.00 0.00 0.00
226Y 0.62 3.76 3.14 2.47 6.04 0.48 4.37 7.08 8.37 12.88 2.11 0.00 2.51 0.00 1.79
228Y 0.00 0.61 0.00 0.38 0.00 0.37 0.00 0.00 0.00 0.00 0.00 0.00 0.00 0.00 0.00
229Y 0.71 0.00 0.00 0.00 0.00 0.00 0.00 0.00 0.00 0.00 0.00 0.00 0.00 0.00 0.00
231Y 0.00 0.00 0.00 0.00 1.09 0.00 0.53 0.00 0.00 0.00 0.00 0.00 0.00 0.00 0.00
232Y 0.00 0.00 0.00 0.00 0.00 0.00 1.08 0.00 2.20 0.00 0.00 0.00 0.00 0.00 0.00
234Y 0.00 2.39 1.91 2.63 1.58 0.00 0.00 0.00 0.00 0.00 0.00 0.00 0.00 0.00 0.00
236Y 0.93 0.00 0.00 0.00 0.00 1.26 0.00 0.00 0.00 0.00 0.00 0.00 0.00 0.00 0.00
238Y 0.81 0.00 0.00 0.00 0.00 1.00 0.00 0.00 0.00 0.00 0.00 0.00 0.00 0.00 0.00
241Y 0.00 1.71 1.26 1.57 1.29 0.00 3.29 0.00 1.61 0.00 0.00 0.00 0.00 0.00 0.00
243Y 1.51 0.00 0.00 0.00 0.00 1.54 0.00 0.00 0.00 0.00 0.00 0.00 0.00 0.00 0.00
244Y 0.00 0.59 0.00 0.51 0.00 0.00 1.13 0.00 1.07 0.00 0.00 0.00 0.00 0.00 0.00

58
246Y 0.00 0.00 0.00 0.29 0.00 0.32 0.00 0.00 0.00 0.00 0.00 0.00 0.00 0.00 0.00
249Y 0.77 0.00 0.00 0.55 0.00 1.54 1.41 0.00 0.97 0.00 0.00 0.00 0.00 0.00 0.00
249Y 0.00 0.00 0.00 0.00 0.00 0.00 0.00 0.00 0.00 0.00 0.00 0.00 0.00 0.42 0.00
250Y 0.59 0.00 0.00 0.00 0.00 0.00 0.76 2.54 0.00 0.00 0.00 0.79 0.00 0.73 0.00
252Y 2.19 0.00 0.00 0.00 0.00 0.91 0.00 0.00 0.00 0.00 0.00 0.00 0.00 0.00 0.00
253Y 5.00 0.00 0.00 0.00 0.00 2.68 0.00 0.00 0.00 0.00 0.00 0.00 0.00 0.00 0.00
254Y 0.00 1.39 2.59 1.75 1.54 0.00 4.13 4.23 2.50 0.00 0.00 0.00 0.00 0.00 0.00
255Y 4.71 0.00 0.00 0.00 0.00 2.76 0.00 0.00 0.00 0.00 0.00 1.19 0.00 0.40 0.00
256Y 0.00 5.26 8.46 7.99 17.95 0.00 1.06 0.00 1.69 0.00 0.00 0.00 0.00 0.00 0.00
257Y 0.49 0.00 0.00 0.00 0.00 0.68 0.00 0.00 0.00 0.00 0.00 0.00 0.00 0.00 0.00
258Y 0.00 0.00 0.00 0.00 0.00 0.00 1.05 0.00 0.00 0.00 0.00 0.00 0.00 0.00 0.00
259Y 0.00 6.37 3.19 5.54 2.93 0.00 2.31 2.88 3.78 0.00 2.75 0.00 3.59 0.00 1.14
261Y 0.00 1.61 3.05 0.78 0.00 0.00 2.91 0.00 1.76 0.00 0.00 0.00 0.00 0.00 0.00
262Y 0.59 0.00 0.00 0.00 0.00 0.86 0.00 3.43 0.00 0.00 0.00 0.00 0.00 0.00 0.00
263Y 0.00 0.00 0.00 0.41 0.00 0.00 0.00 0.00 0.00 0.00 0.00 0.00 0.00 0.00 0.00
264Y 0.85 0.00 0.00 0.00 0.00 1.20 0.00 0.00 0.00 0.00 0.00 0.00 0.00 0.00 0.00
265Y 0.00 0.00 0.00 0.00 0.00 0.00 0.00 0.00 0.00 0.00 0.00 1.33 0.00 0.94 0.00
266Y 0.00 1.50 0.88 0.53 0.00 0.00 3.25 2.51 2.13 0.00 0.00 0.00 0.00 0.00 0.00
268Y 0.00 1.48 0.00 1.06 0.00 0.00 1.06 0.00 1.24 0.00 0.00 0.00 0.00 0.00 0.00
270Y 0.00 0.00 0.00 0.00 0.00 0.00 0.00 0.00 0.00 0.00 2.96 0.00 1.90 0.00 1.00
278Y 0.00 0.00 0.86 0.53 1.28 0.61 0.00 0.00 0.00 0.00 0.00 0.00 0.00 0.00 0.00
279Y 1.62 0.00 0.00 0.00 0.00 0.89 0.00 0.00 0.00 0.00 0.00 0.00 0.00 0.00 0.00
281Y 0.00 0.70 0.00 0.44 0.00 0.27 1.09 0.00 0.00 0.00 0.00 0.00 0.00 0.00 0.00
287Y 5.42 0.00 0.00 0.00 0.00 7.58 0.00 0.00 0.00 0.00 0.00 1.53 0.00 1.21 0.00
288Y 1.72 3.60 3.52 2.21 4.90 2.50 3.64 4.80 4.34 8.45 0.00 1.26 0.00 0.85 0.00
290Y 0.00 0.00 0.00 0.78 0.00 0.00 1.57 2.16 1.84 5.26 0.00 0.00 0.00 0.00 0.00
291Y 0.00 0.00 0.00 0.58 0.00 0.00 1.22 0.00 1.17 0.00 0.00 0.00 0.00 0.00 0.00
292Y 2.75 0.00 0.00 0.00 0.00 3.69 0.00 0.00 0.00 0.00 0.00 0.00 0.00 0.00 0.00

59
293Y 2.13 0.00 0.00 0.00 0.00 0.00 0.00 0.00 0.00 0.00 0.00 0.85 0.00 1.15 0.00
294Y 0.00 1.12 1.67 0.90 1.28 0.00 2.53 2.91 2.31 6.11 0.00 0.00 0.00 0.00 0.00
294Y 0.00 0.00 0.00 0.00 0.00 0.00 0.00 0.00 0.00 0.00 1.29 0.00 0.00 0.00 1.03
297Y 1.09 0.00 0.00 0.00 0.00 0.60 0.00 0.00 0.00 0.00 0.00 0.00 0.00 0.00 0.00
300Y 0.00 0.00 0.00 0.00 0.00 0.47 0.00 0.00 0.00 0.00 0.00 0.00 0.00 0.00 0.00
302Y 0.00 0.00 0.00 0.00 0.00 0.31 0.00 0.00 0.00 0.00 0.00 0.00 0.00 0.00 0.00
304Y 0.00 0.00 0.00 0.00 0.00 0.35 0.00 0.00 0.00 0.00 0.00 0.00 0.00 0.47 0.00
306Y 0.00 0.00 0.00 0.51 0.00 0.00 0.00 0.00 0.00 0.00 0.00 0.00 0.00 0.00 0.00
308Y 1.46 0.00 0.00 0.00 0.00 1.88 0.00 0.00 0.00 0.00 0.00 1.32 0.00 0.00 0.00
309Y 0.00 0.00 0.00 0.00 0.00 0.00 0.00 0.00 0.00 0.00 0.00 1.66 0.00 0.00 0.00
310Y 0.60 0.00 0.00 0.00 0.00 0.00 0.00 0.00 0.00 0.00 0.00 1.64 1.66 1.04 0.00
311Y 0.00 0.00 0.00 0.44 0.00 0.00 0.95 0.00 0.00 0.00 0.00 0.00 0.00 0.00 0.00
312Y 0.00 0.00 0.00 0.00 0.00 0.00 0.00 0.00 0.00 0.00 6.49 0.00 0.00 0.00 5.80
313Y 0.00 0.00 0.00 0.32 0.00 0.00 0.00 0.00 0.00 0.00 0.00 0.00 1.72 0.00 0.00
314Y 0.00 0.00 0.00 0.00 0.00 0.00 0.00 0.00 0.00 0.00 0.00 3.08 0.00 4.59 0.00
315Y 1.79 0.00 0.00 0.00 0.00 1.83 0.00 0.00 0.00 0.00 0.00 0.00 0.00 0.00 0.00
316Y 0.74 0.00 0.00 0.45 0.00 1.04 0.00 0.00 0.00 0.00 0.00 0.95 0.00 0.36 0.00
317Y 0.00 0.00 0.00 0.00 0.00 0.00 0.00 0.00 0.00 0.00 2.08 0.00 0.00 0.00 1.44
318Y 0.63 0.00 0.00 0.00 0.00 0.75 0.00 0.00 0.00 0.00 0.00 0.00 0.00 0.00 0.00
318Y 0.00 0.00 0.00 0.00 0.00 0.00 1.24 0.00 0.00 0.00 0.00 0.00 0.00 0.00 0.00
320Y 0.00 0.71 0.00 0.00 0.00 0.38 0.00 0.00 0.00 0.00 0.00 0.00 0.00 0.00 0.00
321Y 0.00 0.00 0.00 0.00 0.00 0.00 0.91 0.00 0.00 0.00 0.00 0.00 0.00 0.00 0.00
322Y 0.00 0.00 0.00 0.00 0.00 0.44 0.00 0.00 0.00 0.00 0.00 0.00 0.00 0.00 0.00
322Y 1.28 0.00 0.00 0.00 0.00 0.66 0.00 0.00 0.00 0.00 0.00 0.00 0.00 0.00 0.00
324Y 0.00 0.00 0.00 0.00 0.00 0.44 0.00 0.00 0.00 0.00 0.00 0.00 0.00 0.00 0.00
326Y 0.00 0.90 0.00 0.43 0.00 0.00 0.94 0.00 0.00 0.00 0.00 0.00 0.00 0.00 0.00
328Y 1.56 0.00 0.00 0.00 0.00 1.94 0.00 0.00 0.00 0.00 0.00 0.00 0.00 0.47 0.00
330Y 0.00 0.95 1.90 2.09 2.51 0.00 2.06 5.46 3.03 5.60 0.00 0.00 0.00 0.00 0.00

60
370Y 0.00 1.80 2.16 1.36 2.57 0.00 1.66 0.00 0.00 0.00 0.00 0.00 0.00 0.00 0.00
371Y 0.00 0.00 0.00 0.00 0.00 0.00 0.00 0.00 2.09 0.00 0.00 0.00 0.00 0.00 0.00
372Y 2.59 0.00 0.00 0.00 0.00 4.12 0.00 0.00 0.00 0.00 0.00 0.87 0.00 1.22 0.00
376Y 0.00 0.00 0.00 0.00 0.00 0.00 0.70 0.00 0.00 0.00 0.00 0.00 0.00 0.00 0.00
376Y 0.92 0.00 0.00 0.00 0.00 2.13 0.00 0.00 0.00 0.00 0.00 0.00 0.00 0.35 0.00
390Y 0.00 0.00 1.03 0.00 0.00 0.00 0.00 0.00 0.00 0.00 0.00 0.00 0.00 0.00 0.00
391Y 0.00 0.00 0.00 0.78 0.00 0.00 0.00 0.00 0.00 0.00 0.00 0.00 0.00 0.00 0.00
393Y 0.99 0.00 0.00 0.00 0.00 1.05 0.00 0.00 0.00 0.00 1.83 0.00 0.00 0.00 0.00
394Y 0.00 0.00 0.00 0.00 0.00 0.00 0.00 0.00 0.00 0.00 0.00 0.00 0.00 0.00 2.19
394Y 0.00 0.00 2.69 0.00 0.00 0.00 0.00 0.00 0.00 0.00 0.00 2.21 0.00 0.00 0.00
395Y 0.00 0.00 0.00 0.00 0.00 0.00 0.00 0.00 0.00 0.00 0.00 0.00 0.00 0.59 0.00
397Y 0.00 0.00 0.00 0.39 0.00 0.00 0.00 0.00 0.00 0.00 0.00 0.00 0.00 0.00 0.00
399Y 0.00 0.00 0.00 0.00 0.00 0.00 0.00 0.00 0.00 0.00 7.05 7.98 0.00 6.13 4.11
400Y 3.39 0.00 0.00 0.37 0.00 2.19 0.00 0.00 0.00 0.00 0.00 0.00 4.25 0.00 2.08
401Y 0.00 0.00 0.00 0.00 0.00 1.70 0.00 0.00 0.00 0.00 0.00 0.00 0.00 0.00 0.00
401Y 0.00 2.55 0.00 0.00 0.00 0.00 0.00 0.00 0.00 0.00 0.00 4.63 0.00 2.11 0.00
402Y 0.00 0.00 0.00 0.86 0.00 0.00 2.26 2.19 2.33 0.00 0.00 0.00 0.00 0.00 0.00
403Y 0.97 0.00 0.00 0.00 0.00 1.46 0.00 0.00 0.00 0.00 0.00 0.00 0.00 0.00 0.00
405Y 0.59 1.31 1.38 1.10 1.45 0.00 1.52 0.00 0.97 0.00 0.00 0.00 0.00 0.00 0.00
406Y 1.11 0.00 0.00 0.00 0.00 2.23 0.00 0.00 0.00 0.00 0.00 0.00 0.00 0.00 0.00
420Y 0.00 0.00 0.00 0.00 0.00 0.83 0.00 0.00 0.00 0.00 0.00 0.00 0.00 0.00 0.00

61
MspI T-RFLP Relative Abundance Matrix
TRF ID I 1 I 2 I 3 I 4 I 5 C 1 C 2 C 3 C 4 5 H 1 H 2 H 3 H4 H 5
122Y 0.00 0.00 0.00 0.00 0.00 0.00 0.00 0.00 0.00 0.00 0.00 0.61 0.00 0.00 0.00
123Y 3.46 3.91 4.61 2.51 7.03 9.51 4.47 5.90 8.58 0.00 1.30 1.46 1.48 0.00 1.34
128Y 2.97 2.22 0.00 1.75 4.22 0.00 3.63 4.82 0.00 0.00 0.00 0.54 0.00 0.00 0.00
135Y 0.00 0.00 0.00 0.00 0.00 0.00 0.00 0.00 0.00 0.00 1.50 0.50 0.00 0.00 0.00
136Y 0.00 0.00 0.00 0.00 0.00 0.00 0.00 0.00 0.00 0.00 0.00 0.00 1.28 0.00 0.00
137Y 0.00 0.00 0.00 0.00 0.00 0.00 0.00 0.00 0.00 0.00 0.92 0.97 0.00 0.00 0.00
138Y 0.00 0.00 0.00 0.00 0.00 0.00 0.00 0.00 0.00 0.00 0.00 0.00 1.63 0.00 0.00
146Y 0.00 0.00 0.00 0.00 0.00 0.00 0.00 0.00 0.00 0.00 0.00 0.61 0.00 0.00 0.00
147Y 0.00 0.00 0.00 0.00 0.00 7.50 0.00 0.00 0.00 0.00 0.00 0.60 0.00 0.00 0.00
149Y 4.36 3.43 0.00 3.12 4.32 0.00 4.59 5.28 9.89 0.00 0.00 0.00 0.00 0.00 0.00
155Y 0.00 0.00 0.00 0.00 0.00 0.00 2.11 0.00 0.00 0.00 0.00 0.00 0.00 0.00 0.00
159Y 0.00 0.00 0.00 1.97 0.00 0.00 0.00 0.00 0.00 0.00 0.00 0.00 0.00 0.00 0.00
170Y 0.00 0.00 0.00 0.00 0.00 0.00 0.00 0.00 0.00 0.00 0.00 0.45 0.00 0.00 0.00
172Y 0.00 0.00 0.00 2.10 4.59 0.00 1.85 0.00 5.80 0.00 0.00 0.00 0.00 0.00 0.00
198Y 2.06 0.00 0.00 0.00 0.00 0.00 0.00 0.00 0.00 0.00 0.00 0.00 0.00 0.00 0.00
199Y 0.00 0.00 0.00 0.00 0.00 5.92 0.00 0.00 0.00 0.00 0.00 0.00 0.00 0.00 0.00
201Y 1.92 0.00 0.00 0.00 0.00 0.00 0.00 3.42 0.00 0.00 0.00 0.00 0.00 0.00 0.00
203Y 0.00 0.00 4.03 0.00 0.00 0.00 0.00 0.00 0.00 0.00 0.00 0.00 0.00 0.00 0.00
204Y 5.02 4.55 0.00 3.89 7.31 0.00 3.38 6.71 7.12 0.00 0.00 0.00 1.06 0.00 0.00
211Y 0.00 0.00 0.00 0.00 2.59 0.00 0.00 0.00 0.00 0.00 0.00 0.00 0.00 0.00 0.00
252Y 0.00 1.93 0.00 0.00 0.00 0.00 0.00 0.00 0.00 0.00 0.00 0.00 0.00 0.00 0.00
273Y 0.00 0.00 0.00 0.00 3.13 0.00 0.00 0.00 0.00 0.00 0.00 0.00 0.00 0.00 0.00
277Y 0.00 0.00 4.90 0.00 0.00 0.00 0.00 0.00 0.00 0.00 0.00 0.00 0.00 0.00 0.00
277Y 6.58 3.92 0.00 4.69 7.85 0.00 5.92 0.00 0.00 0.00 0.00 0.00 0.00 0.00 0.00
280Y 0.00 2.44 0.00 2.12 0.00 0.00 0.00 0.00 0.00 0.00 0.00 0.00 0.00 0.00 0.00

62
289Y 0.00 2.61 0.00 2.63 0.00 0.00 0.00 0.00 0.00 0.00 0.00 0.00 0.00 0.00 0.00
302Y 0.00 2.63 0.00 0.00 0.00 0.00 3.15 4.07 0.00 0.00 0.00 0.00 0.00 0.00 0.00
385Y 0.00 0.00 0.00 0.00 0.00 0.00 0.00 0.00 0.00 0.00 0.83 0.00 0.00 0.00 0.00
395Y 5.24 3.80 0.00 7.58 2.79 0.00 3.48 3.89 0.00 0.00 0.00 0.00 0.00 0.00 1.41
396Y 0.00 0.00 0.00 0.00 0.00 0.00 0.00 0.00 0.00 0.00 1.11 2.19 0.00 0.00 0.00
399Y 0.00 0.00 0.00 0.00 0.00 0.00 0.00 0.00 8.11 0.00 0.00 0.00 0.00 0.00 0.00
400Y 0.00 0.00 0.00 0.00 0.00 6.71 0.00 0.00 0.00 0.00 0.00 0.00 0.00 0.00 0.00
417Y 0.00 0.00 0.00 2.10 0.00 0.00 0.00 0.00 0.00 0.00 0.00 0.00 0.00 0.00 0.00
419Y 0.00 0.00 0.00 0.00 0.00 0.00 0.00 0.00 0.00 0.00 0.00 0.46 0.00 0.00 0.00
431Y 17.19 12.72 0.00 13.40 15.89 0.00 15.71 21.97 22.25 0.00 0.00 0.00 3.54 0.00 1.89
432Y 0.00 0.00 0.00 0.00 0.00 0.00 0.00 0.00 0.00 39.69 0.00 4.72 0.00 3.01 0.00
432Y 0.00 0.00 14.48 0.00 0.00 27.68 0.00 0.00 0.00 0.00 3.70 0.00 0.00 0.00 0.00
436Y 4.54 1.82 0.00 2.95 2.44 0.00 4.35 7.20 6.88 0.00 0.00 0.00 0.00 0.00 0.00
437Y 0.00 0.00 0.00 0.00 0.00 0.00 0.00 0.00 0.00 0.00 1.37 1.66 0.00 0.00 0.00
438Y 2.48 0.00 0.00 0.00 0.00 0.00 0.00 0.00 0.00 0.00 0.00 0.00 0.00 0.00 0.00
439Y 0.00 3.50 0.00 2.30 0.00 0.00 2.74 0.00 0.00 0.00 0.00 0.00 0.00 0.00 0.00
441Y 3.75 0.00 0.00 0.00 0.00 0.00 0.00 0.00 0.00 0.00 0.00 0.00 0.00 0.00 0.00
442Y 0.00 2.20 0.00 0.00 0.00 0.00 0.00 0.00 0.00 0.00 0.00 0.00 0.00 0.00 0.00
442Y 0.00 0.00 0.00 3.77 8.21 0.00 2.82 0.00 0.00 0.00 0.00 0.00 0.00 0.00 0.00
445Y 0.00 0.00 5.35 0.00 0.00 0.00 0.00 0.00 0.00 0.00 0.00 0.00 0.00 0.00 0.00
452Y 0.00 0.00 0.00 0.00 0.00 0.00 0.00 0.00 0.00 0.00 1.11 1.32 0.00 5.28 0.00
453Y 3.52 3.63 5.05 0.00 0.00 0.00 0.00 0.00 0.00 0.00 0.00 0.00 0.00 0.00 0.00
454Y 0.00 0.00 0.00 1.99 3.97 0.00 0.00 0.00 0.00 0.00 0.00 0.00 0.00 0.00 2.04
456Y 2.44 2.60 5.12 2.97 2.87 10.93 4.49 6.90 4.48 0.00 0.00 0.00 0.00 0.00 0.00
470Y 6.80 4.18 0.00 4.78 0.00 0.00 5.71 0.00 0.00 0.00 0.00 0.00 0.00 2.33 7.13
471Y 0.00 0.00 0.00 0.00 0.00 6.71 0.00 5.39 0.00 0.00 3.20 4.90 0.00 0.00 0.00
474Y 0.00 0.00 0.00 0.00 0.00 0.00 0.00 0.00 0.00 0.00 0.00 0.72 0.00 0.00 0.00
476Y 4.41 4.43 0.00 5.60 4.50 0.00 4.23 0.00 0.00 0.00 0.00 0.00 19.70 0.00 0.00

63
477Y 0.00 0.00 0.00 0.00 0.00 0.00 0.00 0.00 0.00 0.00 0.00 0.00 21.76 0.00 0.00
478Y 0.00 0.00 8.49 0.00 0.00 0.00 0.00 0.00 0.00 0.00 0.00 0.00 0.00 0.00 31.35
479Y 0.00 0.00 0.00 0.00 0.00 0.00 0.00 0.00 0.00 0.00 0.00 11.92 0.00 0.00 0.00
480Y 0.00 0.00 0.00 0.00 0.00 0.00 0.00 0.00 0.00 0.00 41.16 0.00 0.00 0.00 0.00
482Y 0.00 17.72 0.00 0.00 0.00 0.00 0.00 0.00 10.48 35.49 0.00 0.00 0.00 0.00 0.00
483Y 14.75 0.00 0.00 18.08 12.02 0.00 17.73 13.69 0.00 0.00 0.00 0.00 0.00 89.39 0.00
485Y 8.49 15.76 0.00 0.00 6.26 0.00 0.00 0.00 0.00 24.82 43.81 42.94 49.55 0.00 54.85
485Y 0.00 0.00 47.97 9.70 0.00 18.90 9.64 10.76 16.41 0.00 0.00 0.00 0.00 0.00 0.00
486Y 0.00 0.00 0.00 0.00 0.00 6.14 0.00 0.00 0.00 0.00 0.00 23.43 0.00 0.00 0.00


![DOES THE ODOR FROM SPONGES OF THE GENUS Ircinia …people.uncw.edu/pawlikj/2002JCEPaw.pdf · 2007. 3. 10. · P1: GCO Journal of Chemical Ecology [joec] pp482-joec-372103 June 28,](https://static.fdocuments.in/doc/165x107/60b8a0e054d3447a187dc103/does-the-odor-from-sponges-of-the-genus-ircinia-2007-3-10-p1-gco-journal-of.jpg)