The backbone of a City Information Model (CIM)
9
City Modelling - eCAADe 29 143 The backbone of a City Information Model (CIM) Implementing a spatial data model for urban design Jorge Gil 1 , Júlio Almeida 2 , José Pinto Duarte 3 1 Delft University of Technology, Netherlands, 1,2,3 Technical University of Lisbon, Portugal 1 http://urbanism.tudelft.nl/, 1,2,3 http://www.fa.utl.pt/ 1 [email protected], 2 [email protected], 3 [email protected] Abstract. We have been witnessing an increased interest in a more holistic approach to urban design practice and education. In this paper we present a spatial data model for urban design that proposes the combination of urban environment feature classes with design process feature classes. This data model is implemented in a spatial database that becomes the backbone of a City Information Model (CIM), integrating urban neighbourhood formulation, design, and evaluation methods into a comprehensive urban design support system. We demonstrate its application to urban design analysis and evaluation through the development of a tool for AutoCAD Map 3D that is integrated with the PostGIS spatial database. Keywords. urban design; data model; GIS; design support tools; urban design evaluation. INTRODUCTION In light of the challenges of sustainable urban de- velopment we have been witnessing an increased interest in a more holistic approach to urban design practice and education. This approach has multiple dimensions and challenges (Gil and Duarte, 2008): • To integrate the activities of a wide range of stakeholders; • To integrate analysis and evaluation in a perfor- mance based design process; • To manage the various outputs from the various stages of the design process; • To facilitate access to information from a variety of sources and in different data formats; • To manage very large quantities of information, facilitating its manipulation and visualization by different users. The field of building design has responded to similar challenges with the development of various Building Information Modeling (BIM) technologies and there have been calls for the creation of some- thing equivalent in urban design, a City Information Model (CIM) (Khemlani, 2007; Gil et al. 2010). The CIM would extend the use of Geographic Information Sys- tems (GIS) in urban planning as decision support tools (Webster, 1993; Batty et al., 1998) through the integra- tion with Computer Aided Design (CAD), to become a design support tool (Dave and Schmitt, 1994; Maguire, 2003). The City Induction research project has been focusing on the development of such a system, based on an urban design method that integrates the stages of formulation, generation and evaluation of urban designs supported by a CAD/GIS software platform (Duarte et al., 2011). In this paper, we present a spatial data model for urban design practice that can serve as the backbone of a CIM. This is a general component of the City Induction project based on previous work car- ried out on urban design ontologies (Beirão et al. 2009;
Transcript of The backbone of a City Information Model (CIM)

City Modelling - eCAADe 29 143
The backbone of a City Information Model (CIM)
Implementing a spatial data model for urban design
Jorge Gil1, Júlio Almeida2, José Pinto Duarte3
1Delft University of Technology, Netherlands, 1,2,3Technical University of Lisbon, Portugal1http://urbanism.tudelft.nl/, 1,2,3http://www.fa.utl.pt/[email protected], [email protected], [email protected]
Abstract. We have been witnessing an increased interest in a more holistic approach to urban design practice and education. In this paper we present a spatial data model for urban design that proposes the combination of urban environment feature classes with design process feature classes. This data model is implemented in a spatial database that becomes the backbone of a City Information Model (CIM), integrating urban neighbourhood formulation, design, and evaluation methods into a comprehensive urban design support system. We demonstrate its application to urban design analysis and evaluation through the development of a tool for AutoCAD Map 3D that is integrated with the PostGIS spatial database.Keywords. urban design; data model; GIS; design support tools; urban design evaluation.
INTRODUCTIONIn light of the challenges of sustainable urban de-velopment we have been witnessing an increased interest in a more holistic approach to urban design practice and education. This approach has multiple dimensions and challenges (Gil and Duarte, 2008): • To integrate the activities of a wide range of
stakeholders; • To integrate analysis and evaluation in a perfor-
mance based design process; • To manage the various outputs from the various
stages of the design process; • To facilitate access to information from a variety
of sources and in different data formats; • To manage very large quantities of information,
facilitating its manipulation and visualization by different users.
The field of building design has responded to similar challenges with the development of various
Building Information Modeling (BIM) technologies and there have been calls for the creation of some-thing equivalent in urban design, a City Information Model (CIM) (Khemlani, 2007; Gil et al. 2010). The CIM would extend the use of Geographic Information Sys-tems (GIS) in urban planning as decision support tools (Webster, 1993; Batty et al., 1998) through the integra-tion with Computer Aided Design (CAD), to become a design support tool (Dave and Schmitt, 1994; Maguire, 2003). The City Induction research project has been focusing on the development of such a system, based on an urban design method that integrates the stages of formulation, generation and evaluation of urban designs supported by a CAD/GIS software platform (Duarte et al., 2011). In this paper, we present a spatial data model for urban design practice that can serve as the backbone of a CIM. This is a general component of the City Induction project based on previous work car-ried out on urban design ontologies (Beirão et al. 2009;

144 eCAADe 29 - City Modelling
Montenegro and Duarte, 2009) and we demonstrate its integration with the evaluation module.
Firstly, we describe the urban design data model and the structure of the spatial database, highlighting the possibilities that it offers by integrating urban en-vironment and urban design process feature classes, and provide an example of its implementation in PostGIS using datasets for the Randstad region in the Netherlands. Secondly, we demonstrate its applica-tion to urban design analysis and evaluation through the implementation of a tool for AutoCAD Map 3D. We then discuss the benefits and the potential ap-plications in urban planning and urban design educa-tion, and point to further work required to test its inte-gration with the complete City Induction framework.
A SPATIAL DATABASE FOR URBAN DESIGNA spatial database can constitute an adequate sup-port platform to achieve the integration and interop-erability requirements of an integrated urban design approach, namely: • It can manage different user roles giving differ-
entiated access to and production of informa-tion by the various stakeholders involved in the urban design and planning process;
• It is a platform to which different design and analysis tools can connect, but it also provides an array of analytic methods to quickly process spatially and statistically the information con-tained in it;
• It stores and manipulates simulataneously the geometry and attribute information (text and numbers) that is used and produced during the various stages of urban design;
• It can import information from a wide range of data, image, GIS and CAD file formats, either na-tively or by using plug-ins;
• The information can be accessed locally or re-motely over a network for manipulation or vi-sualisation;
• It can store very large quantities of information and provide selective access to portions of the data through queries in an efficient way;
• The information is managed in a single central repository, avoiding data duplication and en-suring that the most up-to-date version is ac-cessed by everyone.
However, to use such an infrastructure in the urban design process, it needs to be configured with an adequate data model that supports the kinds of information, methods and user roles that make up the urban design process.
URBAN ENVIRONMENT DATA MODELSOne of the leading GIS software companies has a re-pository with several data models [1] but most stem from the field of geography. Although one can find various components that would be relevant to an urban environment data model, these are not inte-grated and do not constitute a complete set.
The most comprehensive urban environment data model for GIS is the OGC standard CityGML (Groger et al., 2008; Kolbe, 2009). However, it follows a logic strongly oriented towards data exchange and 3D city model visualization. The model is structured around the concept of levels of detail of information that is organized according to the needs of 3D visu-alization and not necessarily to those of a design pro-cess. Furthermore, it reaches a high level of detail with building features, components and interiors, which are not very relevant to the urban design process.
Other urban environment data models and databases (Koshak and Flemming, 2002; Hamilton et al., 2005) focus primarily on the retrieval, analysis and visualization of existing information, but lack components pertaining to the design process itself, i.e. building regulations, development constraints, benchmarks and multiple design proposals.
A SPATIAL DATA MODEL FOR URBAN DESIGNWe propose an urban design data model that accom-modates two knowledge domains: the urban environ-ment and the urban design process. The first domain contains data that objectively describes the existing or planned urban environment, referring to physical
City Modelling - eCAADe 29 145
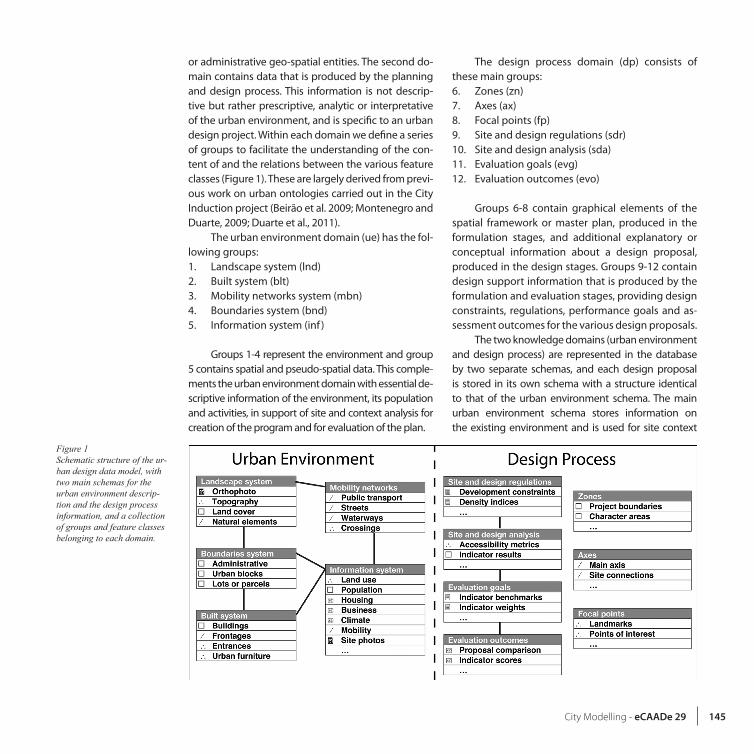
or administrative geo-spatial entities. The second do-main contains data that is produced by the planning and design process. This information is not descrip-tive but rather prescriptive, analytic or interpretative of the urban environment, and is specific to an urban design project. Within each domain we define a series of groups to facilitate the understanding of the con-tent of and the relations between the various feature classes (Figure 1). These are largely derived from previ-ous work on urban ontologies carried out in the City Induction project (Beirão et al. 2009; Montenegro and Duarte, 2009; Duarte et al., 2011).
The urban environment domain (ue) has the fol-lowing groups:1. Landscape system (lnd)2. Built system (blt)3. Mobility networks system (mbn)4. Boundaries system (bnd)5. Information system (inf )
Groups 1-4 represent the environment and group 5 contains spatial and pseudo-spatial data. This comple-ments the urban environment domain with essential de-scriptive information of the environment, its population and activities, in support of site and context analysis for creation of the program and for evaluation of the plan.
The design process domain (dp) consists of these main groups:6. Zones (zn)7. Axes (ax)8. Focal points (fp)9. Site and design regulations (sdr)10. Site and design analysis (sda)11. Evaluation goals (evg)12. Evaluation outcomes (evo)
Groups 6-8 contain graphical elements of the spatial framework or master plan, produced in the formulation stages, and additional explanatory or conceptual information about a design proposal, produced in the design stages. Groups 9-12 contain design support information that is produced by the formulation and evaluation stages, providing design constraints, regulations, performance goals and as-sessment outcomes for the various design proposals.
The two knowledge domains (urban environment and design process) are represented in the database by two separate schemas, and each design proposal is stored in its own schema with a structure identical to that of the urban environment schema. The main urban environment schema stores information on the existing environment and is used for site context
Figure 1Schematic structure of the ur-ban design data model, with two main schemas for the urban environment descrip-tion and the design process information, and a collection of groups and feature classes belonging to each domain.
146 eCAADe 29 - City Modelling
analysis and visualization. The proposal schemas store the proposed environments within the limits of the site boundary and are directly manipulated by the design generation process. The groups of each domain pro-vide a prefix for the naming convention of data tables, thus grouping together in the database management environment the data tables that are related.
Examples of the data structureThe urban design spatial data model is defined fol-lowing principles from spatial data modeling (Yeung and Hall, 2007). Figure 1 represents a schematic
structure of the urban design data model with the main relations between feature classes, the core data tables and some examples of custom tables that can be created to accommodate specific project or local characteristics. This expansion possibility is indicat-ed by the ellipsis (…) punctuation in the groups that support it.
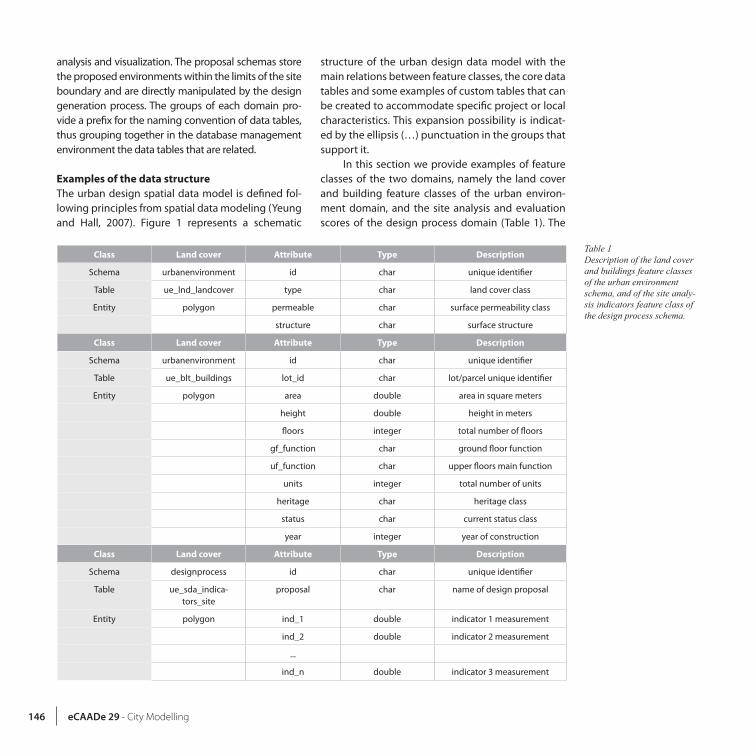
In this section we provide examples of feature classes of the two domains, namely the land cover and building feature classes of the urban environ-ment domain, and the site analysis and evaluation scores of the design process domain (Table 1). The
Table 1Description of the land cover and buildings feature classes of the urban environment schema, and of the site analy-sis indicators feature class of the design process schema.
Class Land cover Attribute Type Description
Schema urbanenvironment id char unique identifier
Table ue_lnd_landcover type char land cover class
Entity polygon permeable char surface permeability class
structure char surface structure
Class Land cover Attribute Type Description
Schema urbanenvironment id char unique identifier
Table ue_blt_buildings lot_id char lot/parcel unique identifier
Entity polygon area double area in square meters
height double height in meters
floors integer total number of floors
gf_function char ground floor function
uf_function char upper floors main function
units integer total number of units
heritage char heritage class
status char current status class
year integer year of construction
Class Land cover Attribute Type Description
Schema designprocess id char unique identifier
Table ue_sda_indica-tors_site
proposal char name of design proposal
Entity polygon ind_1 double indicator 1 measurement
ind_2 double indicator 2 measurement
...
ind_n double indicator 3 measurement

City Modelling - eCAADe 29 147
complete functional data structure of each table is provided, including the object classes, their geom-etry, basic attributes and relations.
The data structure is typical of spatial relational databases, with the important addition of a geom-etry field that can store the urban form’s geometry in the form of points, lines and polygons.
IMPLEMENTING A TOOL FOR NEIGH-BOURHOOD DESIGN AND EVALUATIONTo test the feasibility and the advantages of using an urban design spatial database in the urban design process we have implemented one in the context of the City Induction project, serving as the back-bone of the CIM. The database is built on the open source PostgreSQL database with its PostGIS exten-sion, which can be linked to other spatial design and analysis platforms, namely AutoCAD Map 3D, the urban design platform chosen for the City Induction implementation (Gil et al., 2010).
Setting up the spatial databaseFor the pilot study, we have loaded data of the Rand-stad region in the Netherlands, and selected four different urban areas for analysis, namely Ijburg and
de Pijp in Amsterdam, Ypenburng in de Hague and Houten near Utrecht. The amount and diversity of in-formation and the need to make it available to differ-ent users were sufficient reasons to opt for a managed data solution in the form of a database. The data sets used were obtained via the DANS EASY service [2]: • Bestand Bodemgebrauk 2006, for land use and
land cover (CBS and Kadaster, 2006) • Kadastrale Kaart, for property subdivision and
address points (Kadaster, 2008) • TOP10 NL, for topographic layers (Kadaster,
2009) • Wijk- en buurtkaart 2009, for census data (CBS
and Kadaster, 2009)
Initially, we started preparing the data sets us-ing a commercial GIS platform and the files provided in ‘Shape’ format. However, it became clear that cer-tain operations of merging tiles, deleting records, and editing tables either took too long or the opera-tion failed. As a result we decided to load the data di-rectly into the database and perform the data prepa-ration operations using the native SQL functions and the PostGIS functions. The database proved to be far more stable and efficient in performing those
Table 2Example of the correspond-ence between data attributes of the original source data sets (right) and the structure of the urban design data mod-el (leftmost column), for the buildings feature classes.
ue_blt_buildings Source Table Attribute
geometry top10nl gebouw_vlak geometry
id top10nl gebouw_vlak identi
lot_id custom ue_bnd_lots id
area custom ue_blt_buildings from geometry
height top10nl gebouw_vlak hoogte / hoogteklas
floors survey - -
gf_function Bbg2006 Bbg2006 BG2006_a
uf_function - - -
units custom ue_blt_entrances parsed from door numbers sequence
heritage top10nl gebouw_vlak typegebouw
status top10nl gebouw_vlak status
year - - -

148 eCAADe 29 - City Modelling
operations, reducing processing times in some op-erations from 40 minutes to 4 minutes.
The other two main tasks of data preparation were to make a correspondence between data sets, assigning to the data structure defined in the urban design data model the attributes and geometry of the existing data sources (Table 2), and to reclassify the attribute values themselves, because they were in different languages or were following a very spe-cific classification.
In some cases the attribute data is not available in the original data sets and it has to be synthesized from other attributes, complemented by local sur-veys or simply ignored with consequences to the kinds of analysis that one can perform. The result is a spatial database that follows the specification of the urban design data model, ready to be manipulated by various stages of the urban design process.
Integrating the spatial database and CAD for ur-ban form analysis and evaluationIn order to demonstrate the use of the database and the integration of CAD and GIS we measure the ur-ban form and evaluate the performance of the differ-ent pilot study areas using a tool developed for this
purpose in AutoCAD Map 3D. This tool is the proof of concept implementation of the City Induction evalu-ation module. The purpose of the module is to mea-sure a series of sustainable urban form indicators and offer a variety of means to evaluate the results to support decision-making during the design process. The proof of concept tool implements a sample of indicators, listed in Table 3, identified in a review of existing sustainable urban development assessment tools (Gil and Duarte, 2010). This sample aims to test indicators of different dimensions of sustainability (environment, economy, and society) that are calcu-lated at different levels of spatial resolution.
The tool offers at this stage a basic urban design workflow following the City Induction structure. In the ‘Formulation’ section it includes the functionality to set up a new urban design project and load data in the spatial database, to configure project settings, such as the acceptable ‘walking distance’, to define the project site and analysis boundaries, and to set-up the design requirements in terms of the weight and performance levels of each indicator (Figure 2). In the ‘Generation’ section the tool offers the possibility of starting a new design proposal by creating a new schema in the database and loading the design tools
Indicator Spatial unit Result unit
Green areas per inhabitant site m2
Number of light railway/tram/trolley stops site n
Bike paths lengths per inhabitant/dwelling site m
Dwelling per hectare site n
Connected community site n
Street network length site m
Ground space per inhabitant/dwelling site m2
Impermeable areas site m2
Average distance between building entrances street segment m
Distance to nearest kindergarten entrance m
Number of kindergarten in close neighbourhood entrance n
Distance to nearest light railway/tram/trolley entrance m
Number of access points to public transportation entrance n
Table 3List of the sample urban form indicators implemented for analysis of the neighbour-hood data stored in the urban design spatial database.

City Modelling - eCAADe 29 149
toolbars. Finally, it has an ‘Evaluation’ section with a collection of tools relating to the analysis and evalu-ation of these proposals. This includes tools to run the analysis on the data sets, display those results visually through thematic maps of each indicator, compare the results between several different design propos-als showing a radar plot (Figure 2), compare the pro-posals against a reference case (not necessarily from the same project), and score the results based on the previously defined performance levels, aggregating those scores towards an overall proposal performance score. The overall score is a weighted mean at various levels of aggregation and these are summarized in a multilevel pie chart for an individual proposal.
The user interface is implemented using Au-toLisp and DCL. The data visualization functionality uses AutoCAD Map3D workflows because the Map API is not accessible from AutoLisp, and finally the various indicator calculations have been implement-ed as plSQL functions in the PostGIS database itself. We have decided to keep the data analysis and calcu-lations in the database because of the performance gains observed in our previous experience and to keep the data processing functionality indepen-dent from any specific user interface. The AutoLisp front-end creates PostgreSQL instructions that are sent directly to the database via the command line using DOSLib 8.6 thus performing any number of
Figure 2Screenshot of the proof of concept tool implemented in AutoCAD Map3D. It is displaying an urban neighbourhood orthophoto, overlayed with the results of the ‘Number of access points to public transport’ indica-tor in a thematic map. The proposal comparison radar chart shows this designs performance against other options. The information that is mapped in this view is be-ing read from the PostGIS database.

150 eCAADe 29 - City Modelling
operations on the data. The charting functionality to visualize the evaluation outcomes has been imple-mented in Python using the Matplotlib library and connecting directly to the database using the Psy-copg library.
CHALLENGES AND FURTHER WORKThe use of a spatial database in the design process still requires GIS and database expertise (Pandit, 2009) and it is essential to develop user-friendly in-terfaces for the various design support tasks, espe-cially to manage the data and to provide basic analy-sis outputs. The tests provide insight into possibili-ties and limitations of this integrated urban design support system.
The data collection and preparation phase common to urban design practice and education is quite challenging due to the variety of data sources and formats, and the quantity of resulting data. The proposed spatial data model offers a clearer set of requirements and a more structured knowl-edge framework, and with the support of ontol-ogy based tools it would facilitate the data classi-fication and aggregation process. Furthermore, the structured nature of the database can support the development of automated data translation tools from/to standards such as CityGML (Stadler et al., 2009) and we need to identify the shared elements between the data models and ensure compatibility at those levels.
We still require an integration of the spatial da-tabase and the proof of concept tool with the formu-lation and generation modules of the City Induction project. This is important to fine-tune the urban de-sign data model and confirm its compatibility with the methods developed in those modules. Further-more, it will offer the opportunity for further testing the use of a spatial database in other phases of the design process and with different stakeholders. To explore this scenario, local authorities seem to be a good test case as they play several roles in the urban development process, from data collection to plan-ning, evaluation and public participation.
CONCLUSIONSIn this paper we have presented an urban design data model to enable the development of spa-tial databases to support the urban design pro-cess. The proposed urban design data model has unique characteristics because it combines the more common urban environment description with a schema to support information relating to the design process. Testing the proposed urban design data model by building a spatial database has shown that these databases offer a suitable platform for an integrated approach to urban design, in line with the idea of a City Information Model (CIM), becoming the backbone of such a system. We demonstrate their use in the analysis and evaluation of designs integrated in a CAD en-vironment, but we still need to test and demon-strate their use in a complete set-up that includes the formulation and the generation of urban de-sign proposals.
ACKNOWLEDGEMENTSThis work is part of the “City Induction” project funded by Fundação para a Ciência e Tecnologia (FCT), Portugal, and hosted by ICIST at the Technical University of Lisbon (PTDC/AUR/64384/2006). The project is coordinated by José Pinto Duarte. Júlio Almeida is assistant researcher and Jorge Gil is main researcher in the project, funded by FCT with grant SFRH/BD/46709/2008.
REFERENCESBatty, M, Dodge, M, Jiang, B & Smith, A 1998, ‘GIS and
urban design’, CASA UCL, London.Beirão, JN, Montenegro, N, Gil, J, Duarte, JP and
Stouffs, R 2009, ‘The city as a street system: A street description for a city ontology’, in Pro-ceedings of the 13th Congress of the Iberoamer-ican Society of Digital Graphics, Sao Paulo, Brazil.
Centraal Bureau voor de Statistiek (CBS) and Kadaster 2006, Bestand bodemgebruik 2006 – BBG’06, Per-sistent identifier: nbn:nl:ui:13-0an-1ei.

City Modelling - eCAADe 29 151
Centraal Bureau voor de Statistiek (CBS) and Ka-daster 2009, Wijk- en buurtkaart 2009, Acces-sible from: http://www.cbs.nl/nl-NL/menu/the-mas/dossiers/nederland-regionaal/publicaties/geografische-data/archief/2010/2010-wijk-en-buurtkaart-2009.htm.
Dave, B and Schmitt, G 1994, ‘Information systems for urban analysis and design development’, En-vironment and Planning B: Planning and Design, 21 (1), p.p.83 – 96.
Duarte, JP, Montenegro, N, Beirão, JN and Gil, J 2011, ‘City Induction: a model for formulating, gen-erating, and evaluating urban designs’, in J. Halatsch et al. (eds.) Digital urban modelling and simulation, Communications in Computer and In-formation Science Series, Springer-Verlag, Berlin. (forthcoming)
Gil, J, Beirão, JN, Montenegro, N and Duarte, JP 2010, ‘Assessing computational tools for urban de-sign: Towards a City Information Model’, Future Cities, Proceedings of the eCAADe conference, ETH Zurich, Switzerland, pp.361-369.
Gil, J and Duarte, JP 2008, ‘Towards an Urban Design Evaluation Framework’, Architecture in Compu-tro, Proceedings of the eCAADe conference, An-twerpen, Belgium, pp.257-264.
Gil, J and Duarte, JP 2010, ‘A review of urban design sustainability evaluation tools’, in HJP Timmer-mans and B de Vries (eds) 10th International Conference on Design & Decision Support Systems in Architecture and Urban Planning, Eindhoven University of Technology.
Groger, G, Kolbe, TH, Czerwinski, A & Nagel, C 2008, OpenGIS® City Geography Markup Language (CityGML) Encoding Standard, Open Geospatial Consortium Inc.
Hamilton, A, Wang, H, Tanyer, AM, Arayici, Y, Zhang, X and Song, Y 2005, ‘Urban information model for city planning’, Journal of Information Technology in Construction, 10 (Special Issue From 3D to nD modelling), pp.55-67.
Kadaster 2004, Kadastrale kaart, Persistent identifier: urn:nbn:nl:ui:13-oxg-wgy
Kadaster 2009, TOP 10NL - digitaal topografisch bestand, Persistent identifier: urn:nbn:nl:ui:13-fft-twq.
Khemlani, L 2007, ‘Autodesk University 2007’, AECbytes Newsletter, (32).
Kolbe, TH 2009, ‘Representing and Exchanging 3D City Models with CityGML’ in J Lee and S Zlatanova (eds), 3D Geo-Information Sciences, Springer-Verlag, Berlin, Heidelberg, pp.15-31.
Koshak, N and Flemming, U 2002, ‘Object-Oriented Data Modeling and Warehousing to Support Urban Design’, in Proceedings of DDSS 2002, El-lecom, The Netherlands, p.18.
Maguire, D 2003, ‘Improving CAD-GIS Interoperabil-ity’, ArcNews, Winter, 2003 (24), pp.4.
Montenegro, N and Duarte, JP 2009, ‘Computational Ontology of Urban Design: Towards a City Infor-mation Model’, Computation: The New Realm of Architectural Design, Istanbul Technical Univer-sity, Turkey, pp.253-260.
Pandit, P 2009, Using PostGIS/PostgreSQL for Manag-ing CAD and GIS Data, Autodesk.
Stadler, A, Nagel, C, Konig, G and Kolbe, TH 2009, ‘Making Interoperability Persistent: A 3D Geo Database Based on CityGML’, in J Lee and S Zlatanova (eds) 3D Geo-Information Sciences, Springer-Verlag, Berlin Heidelberg, pp.175-192.
Webster, CJ 1993, ‘GIS and the scientific inputs to ur-ban planning. Part 1: description’, Environment and Planning B: Planning and Design, 20 (6), pp.709 – 728.
Yeung, A and Hall, GB 2007, Spatial Database Sys-tems: Design, Implementation and Project Man-agement, Springer-Verlag, Berlin.
[1] http://resources.arcgis.com/content/data-models
[2] http://easy.dans.knaw.nl/