The AVMA Pet Demographic Study Partners for Healthy … · The AVMA Pet Demographic Study &...
60
The AVMA Pet Demographic Study & Partners for Healthy Pets® W. Ron DeHaven, DVM, MBA CEO, AVMA Chair, Partners for Healthy Pets
Transcript of The AVMA Pet Demographic Study Partners for Healthy … · The AVMA Pet Demographic Study &...
The AVMA Pet Demographic Study
& Partners for Healthy Pets®
W. Ron DeHaven, DVM, MBA CEO, AVMA Chair, Partners for Healthy Pets
Agenda
Pet Demographic Study
Pet Ownership and Population
Veterinary Visits and Expenditures
Impact of Spay/Neuter
Partners for Healthy Pets®
2
Household Pet Survey - Method
Conducted in Spring 2012 50,000 + households surveyed Pet ownership, veterinary visits and expenditures Dogs, cats, birds, horses, specialty/exotic pets Every 5 years - trends since 1983
US Pet Ownership & Demographic Sourcebook
US Census uses this data in their Statistical Abstract
3

Ownership & Population
4
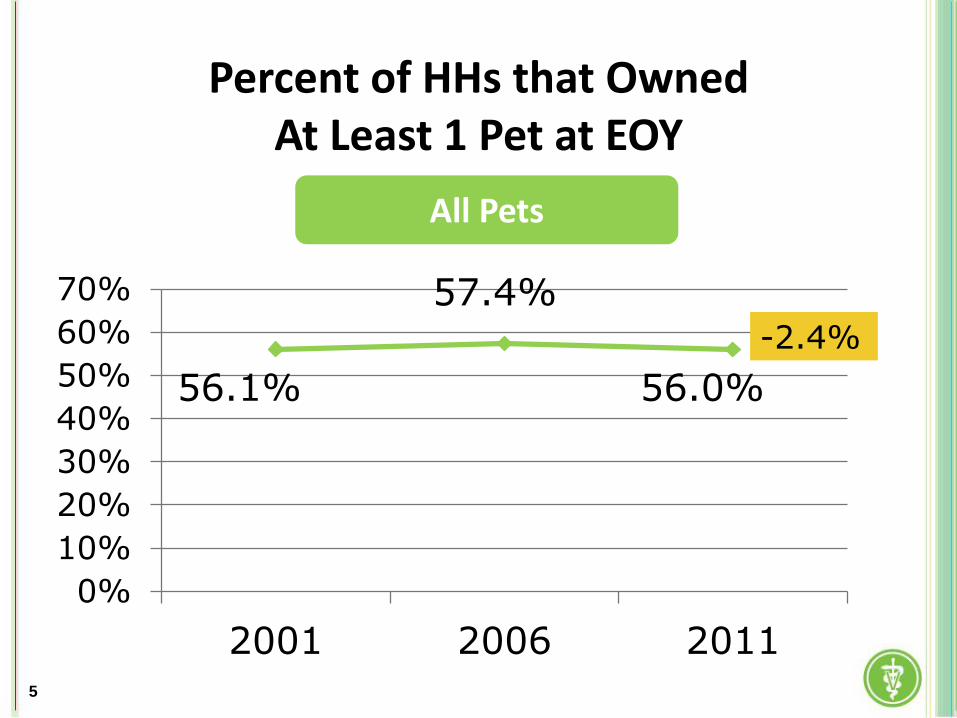
Percent of HHs that Owned At Least 1 Pet at EOY
0%
10%
20%
30%
40%
50%
60%
70%
2001 2006 2011
56.1%
57.4%
All Pets
56.0%
-2.4%
5
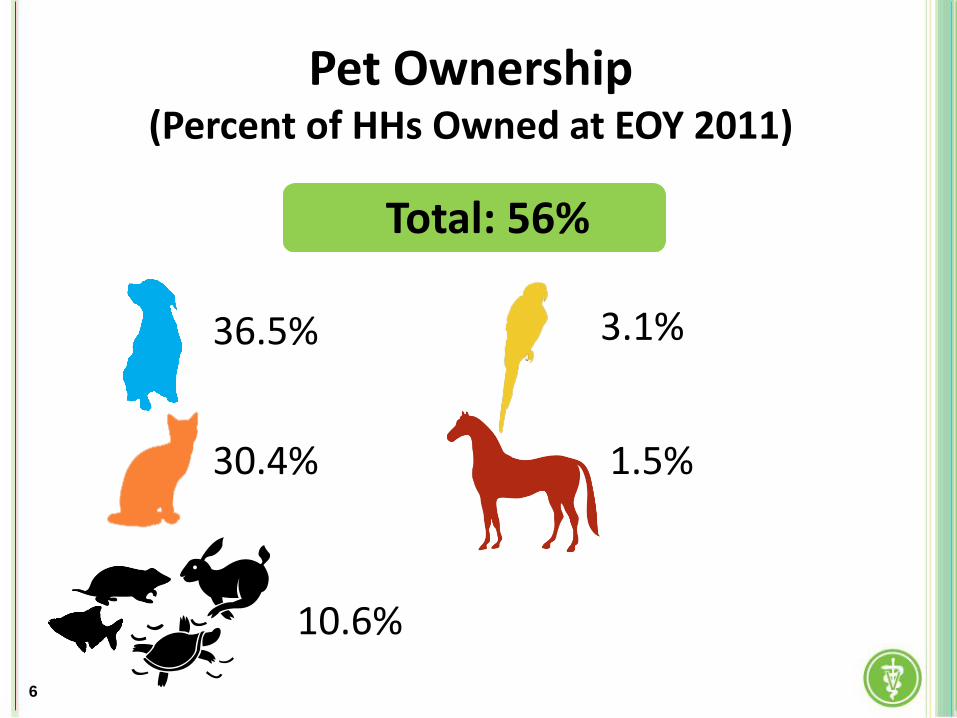
Pet Ownership (Percent of HHs Owned at EOY 2011)
36.5%
30.4% 1.5%
3.1%
10.6%
6
Total: 56%
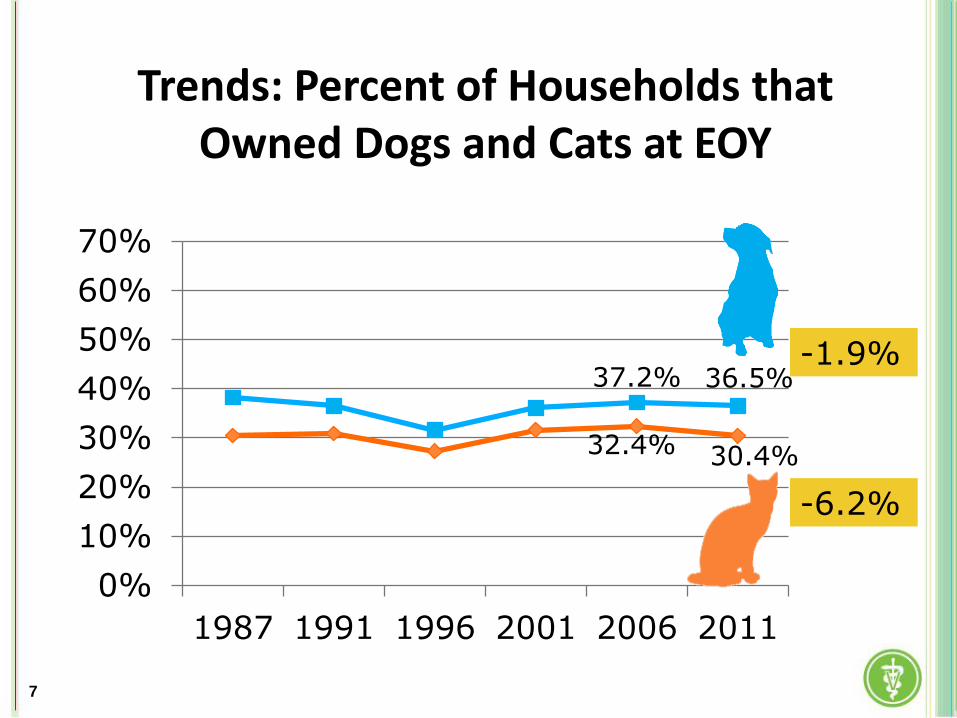
Trends: Percent of Households that Owned Dogs and Cats at EOY
32.4% 30.4%
37.2% 36.5%
0%
10%
20%
30%
40%
50%
60%
70%
1987 1991 1996 2001 2006 2011
-1.9%
-6.2%
7
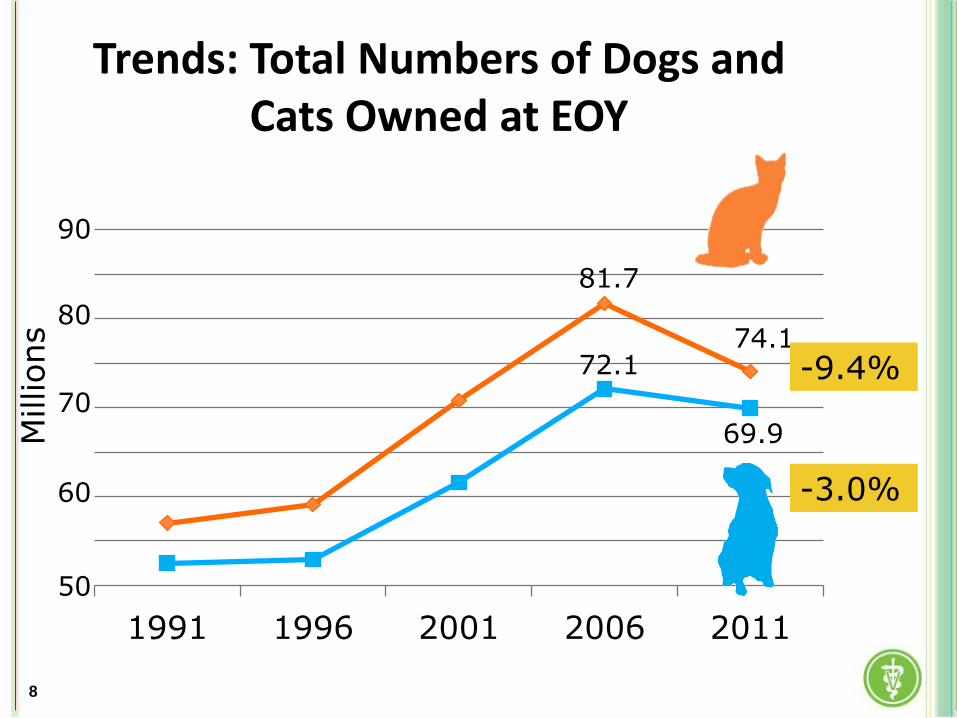
Trends: Total Numbers of Dogs and Cats Owned at EOY
81.7
74.1 72.1
69.9
1991 1996 2001 2006 2011
-9.4%
-3.0% 60
80
70
50
90
Millions
8
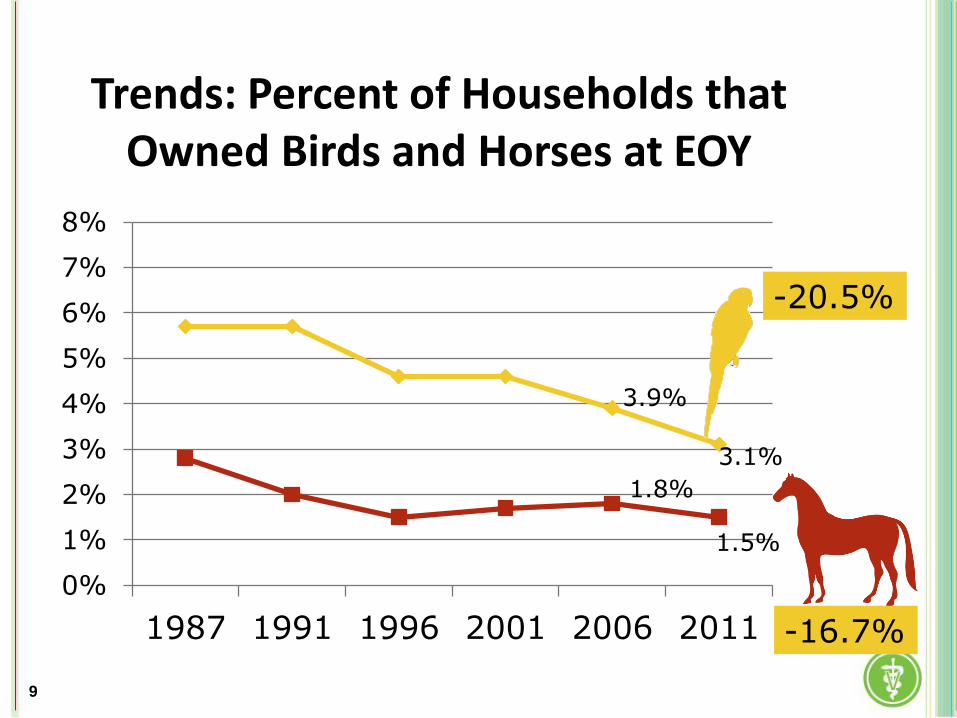
Trends: Percent of Households that Owned Birds and Horses at EOY
3.9%
3.1%
1.8%
1.5%
0%
1%
2%
3%
4%
5%
6%
7%
8%
1987 1991 1996 2001 2006 2011 -16.7%
-20.5%
9
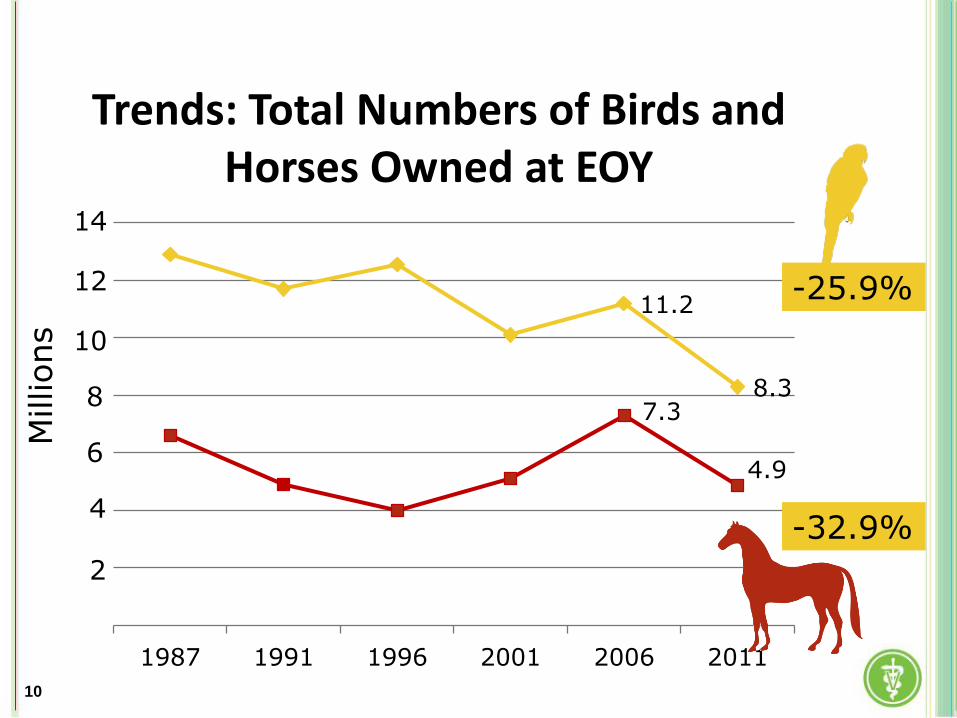
Trends: Total Numbers of Birds and Horses Owned at EOY
11.2
8.3 7.3
4.9
1987 1991 1996 2001 2006 2011
2
4
8
6
10
12
14
-32.9%
-25.9%
Millions
10
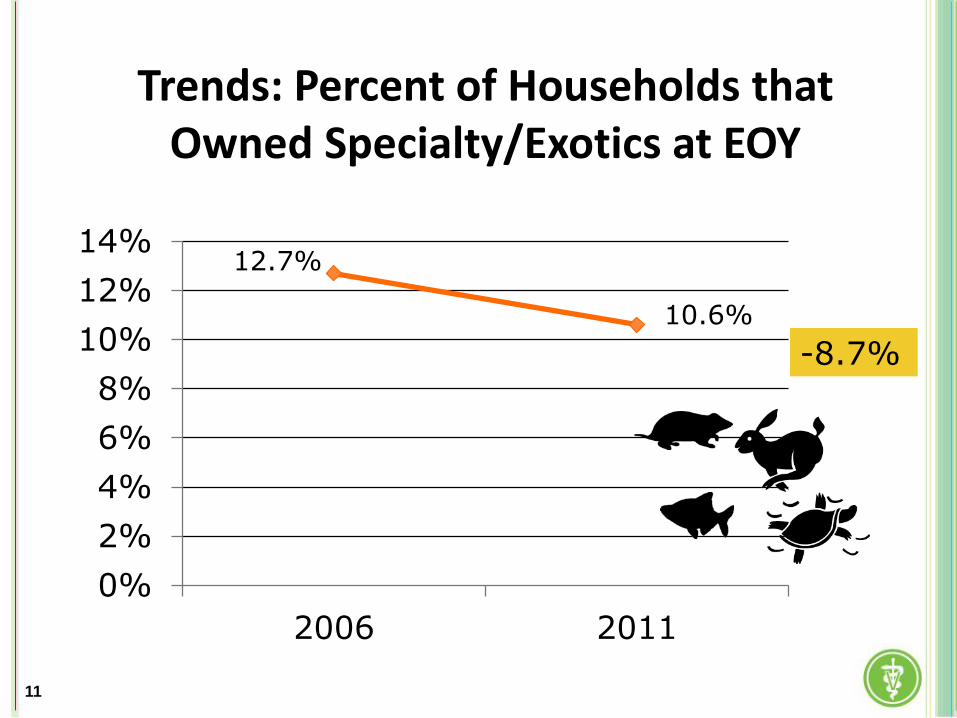
Trends: Percent of Households that Owned Specialty/Exotics at EOY
0%
2%
4%
6%
8%
10%
12%
14%
2006 2011
12.7%
10.6%
-8.7%
11
What Does This Mean?
Decline in all measures Percent of HHs that own any pet Percent of HHs that own dogs, cats, horses, birds Total # of owned dogs, cats, horses, birds Number owned per HH
Why?
Recession? Other?
Need to find out? Can we even influence?
12
Gender of Caretaker
13
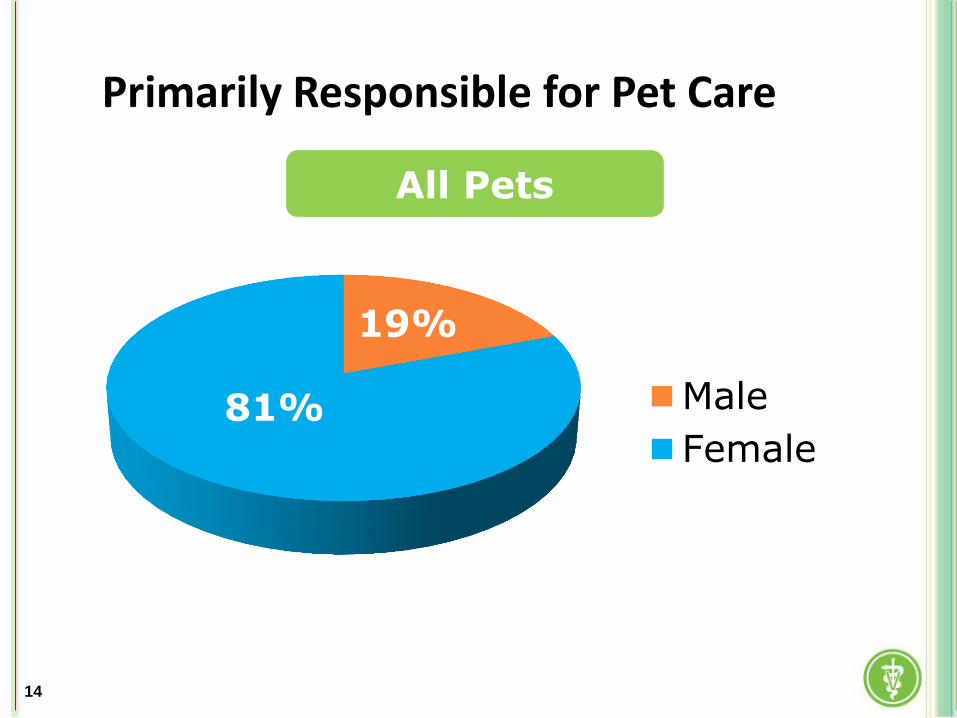
Primarily Responsible for Pet Care
19%
81% Male
Female
All Pets
14
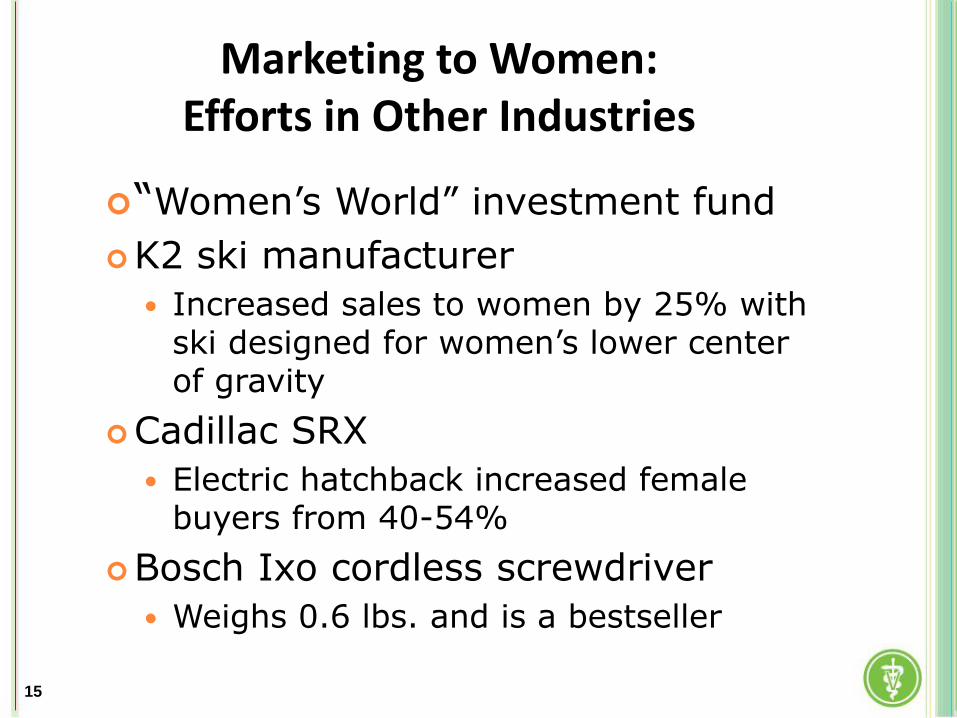
Marketing to Women: Efforts in Other Industries
“Women’s World” investment fund
K2 ski manufacturer
Increased sales to women by 25% with ski designed for women’s lower center of gravity
Cadillac SRX
Electric hatchback increased female buyers from 40-54%
Bosch Ixo cordless screwdriver
Weighs 0.6 lbs. and is a bestseller
15
Aging Pet Population
16
0%
20%
40%
60%
80%
100%
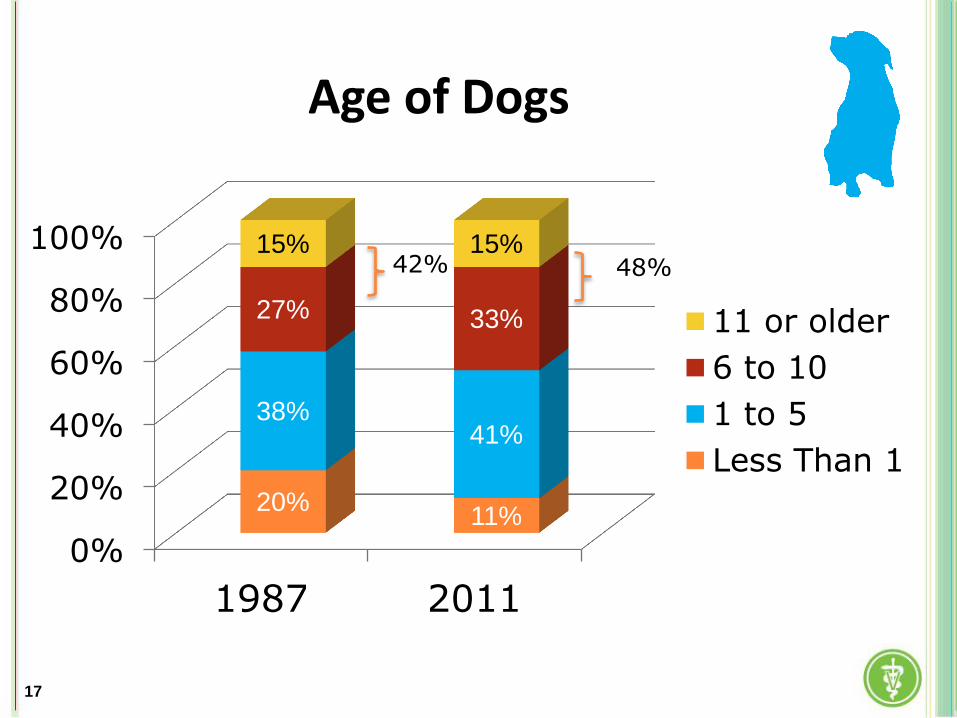
1987 2011
20% 11%
38% 41%
27% 33%
15% 15%
11 or older
6 to 10
1 to 5
Less Than 1
Age of Dogs
48% 42%
17
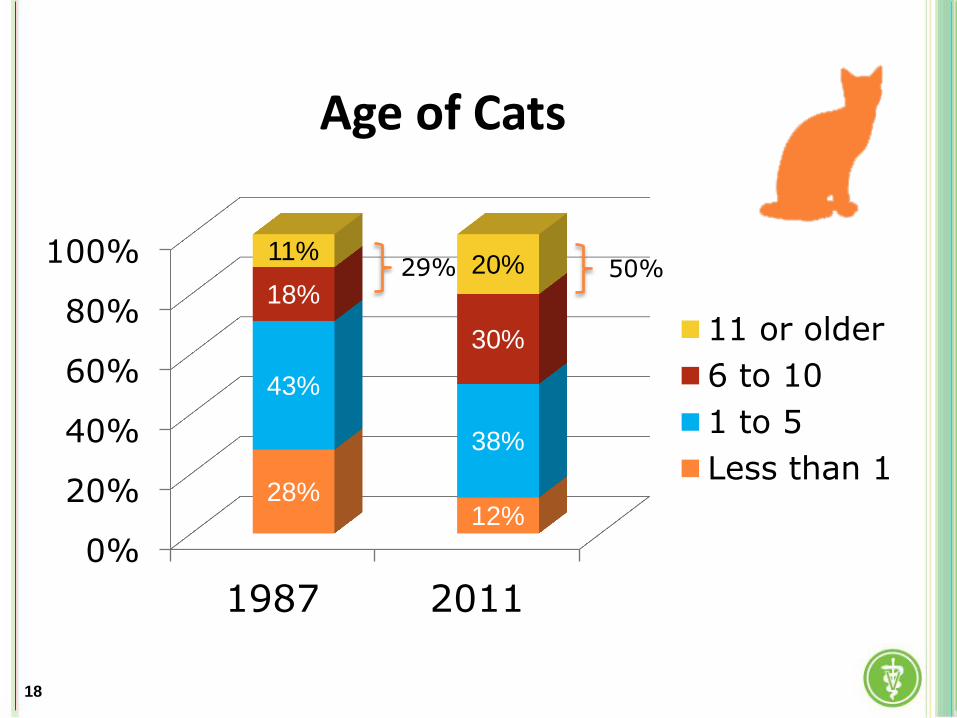
Age of Cats
0%
20%
40%
60%
80%
100%
1987 2011
28% 12%
43%
38%
18%
30%
11% 20%
11 or older
6 to 10
1 to 5
Less than 1
29% 50%
18
What Does This Mean?
Fewer pets in the pipeline Profession/Industry-wide concern
Exacerbated by loss of starter services in many practices Low cost clinics to a full-service
veterinary practice
Lost opportunity to bond pets to practice for life
19
Veterinary Visits
20
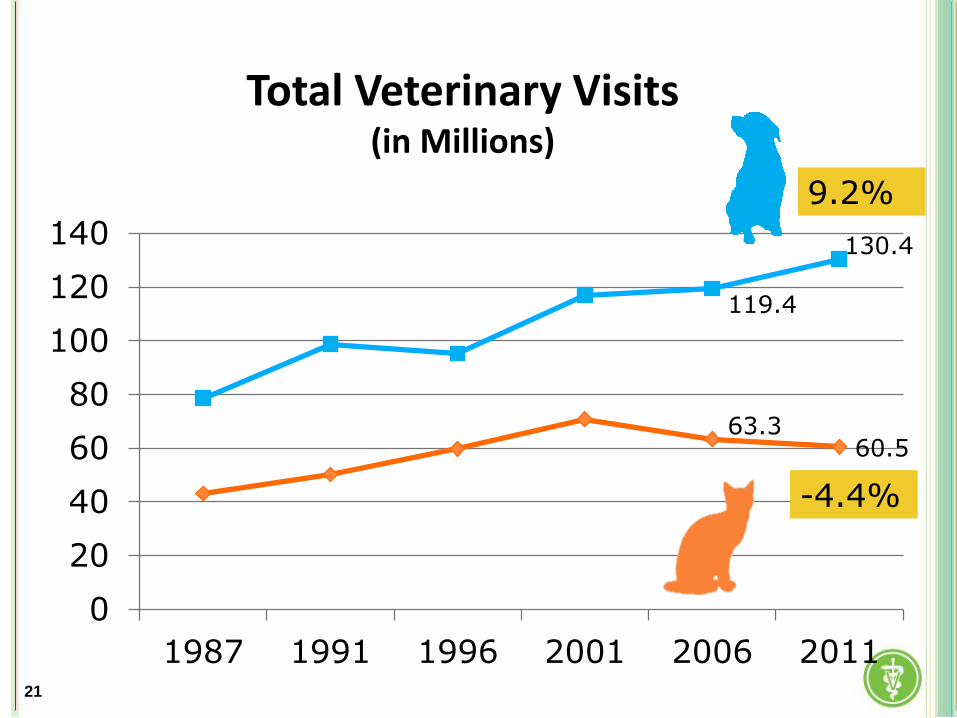
Total Veterinary Visits (in Millions)
63.3 60.5
119.4
130.4
0
20
40
60
80
100
120
140
1987 1991 1996 2001 2006 2011
9.2%
-4.4%
21
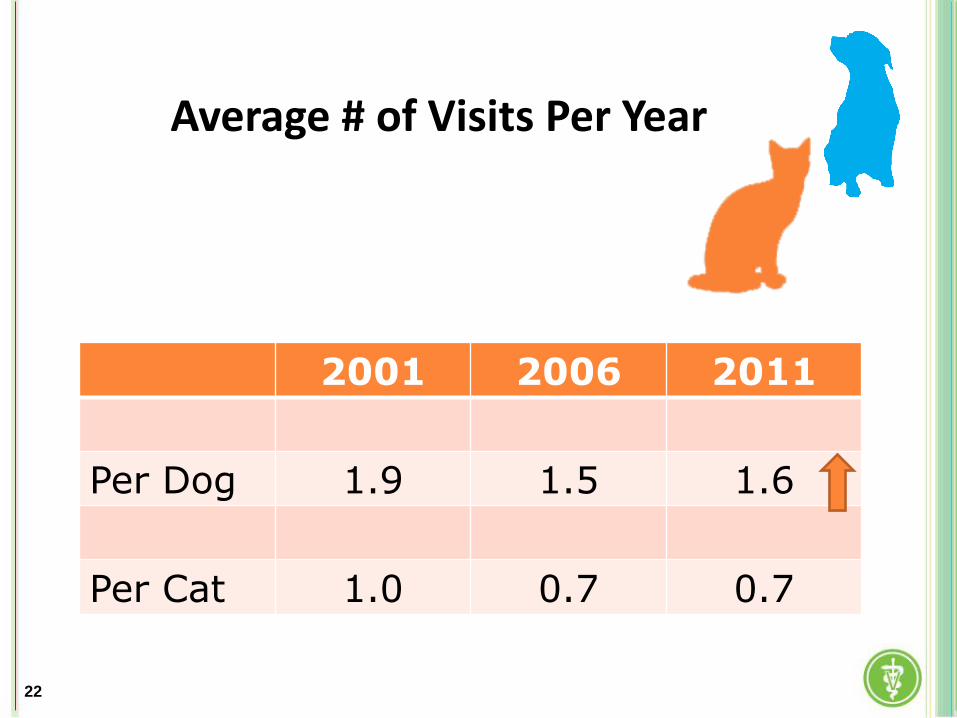
Average # of Visits Per Year
2001 2006 2011
Per Dog 1.9 1.5 1.6
Per Cat 1.0 0.7 0.7
22
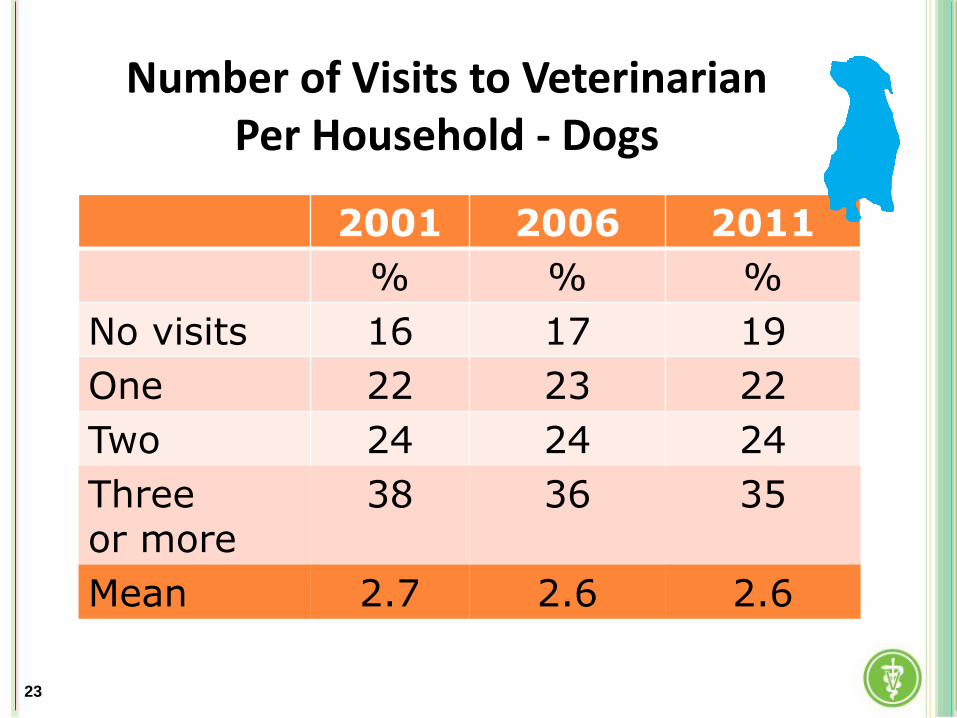
Number of Visits to Veterinarian Per Household - Dogs
2001 2006 2011
% % %
No visits 16 17 19
One 22 23 22
Two 24 24 24
Three or more
38 36 35
Mean 2.7 2.6 2.6
23
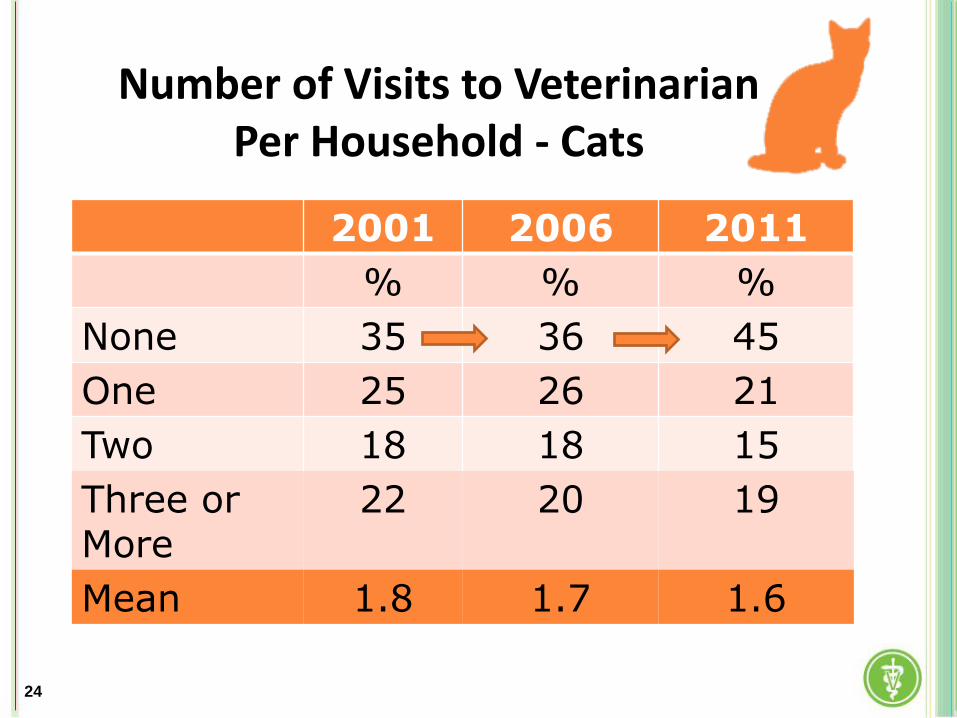
Number of Visits to Veterinarian Per Household - Cats
2001 2006 2011
% % %
None 35 36 45
One 25 26 21
Two 18 18 15
Three or More
22 20 19
Mean 1.8 1.7 1.6
24
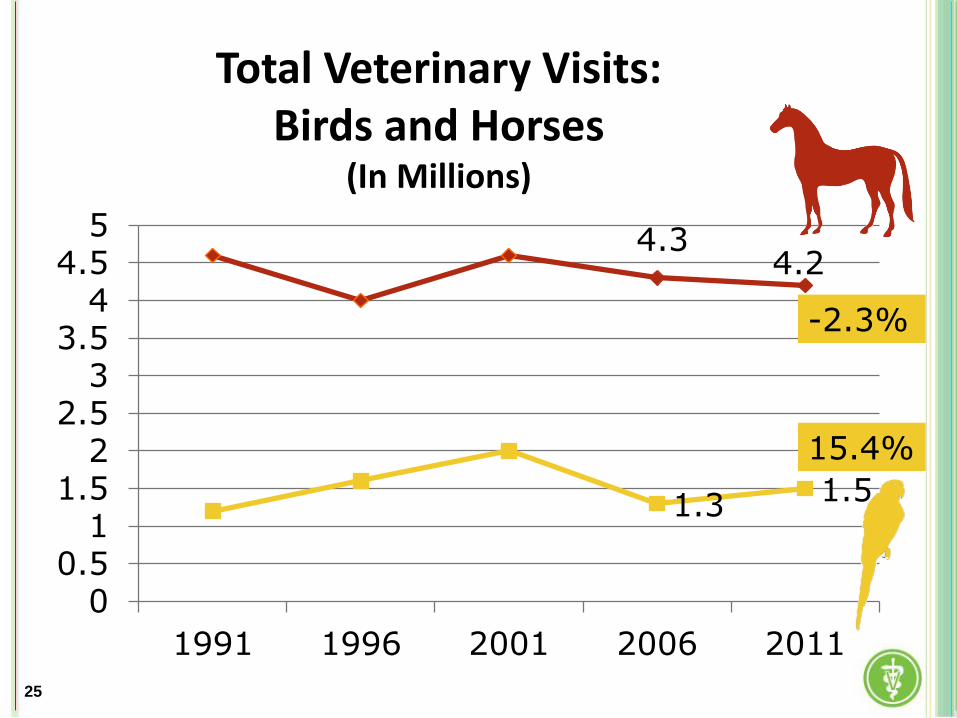
Total Veterinary Visits: Birds and Horses
(In Millions)
4.3 4.2
1.3 1.5
00.5
11.5
22.5
33.5
44.5
5
1991 1996 2001 2006 2011
-2.3%
15.4%
25
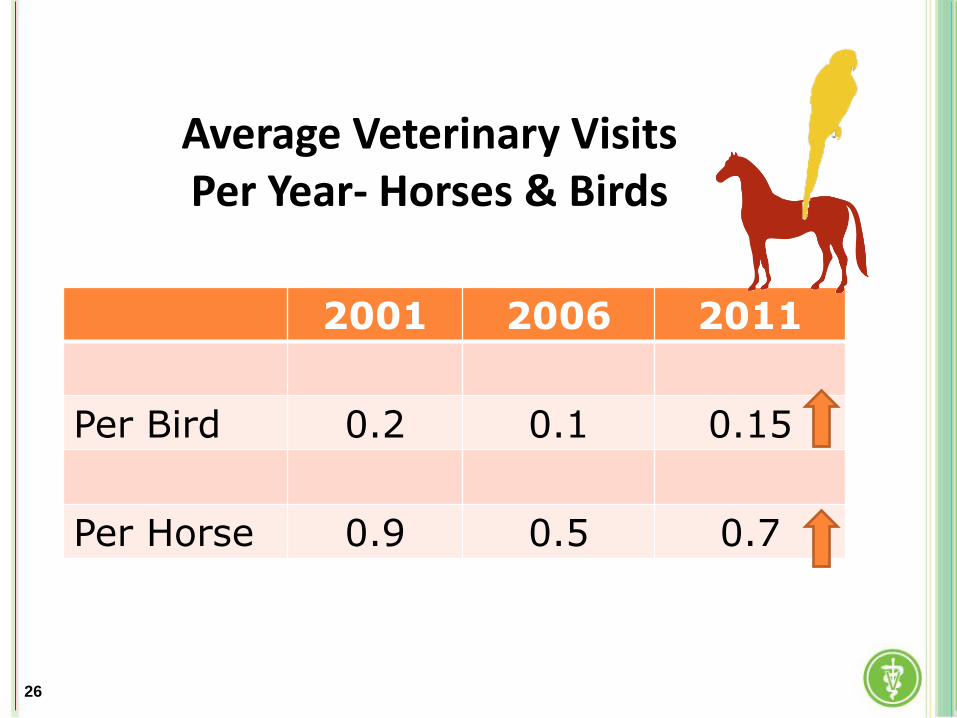
Average Veterinary Visits Per Year- Horses & Birds
2001 2006 2011
Per Bird 0.2 0.1 0.15
Per Horse 0.9 0.5 0.7
26
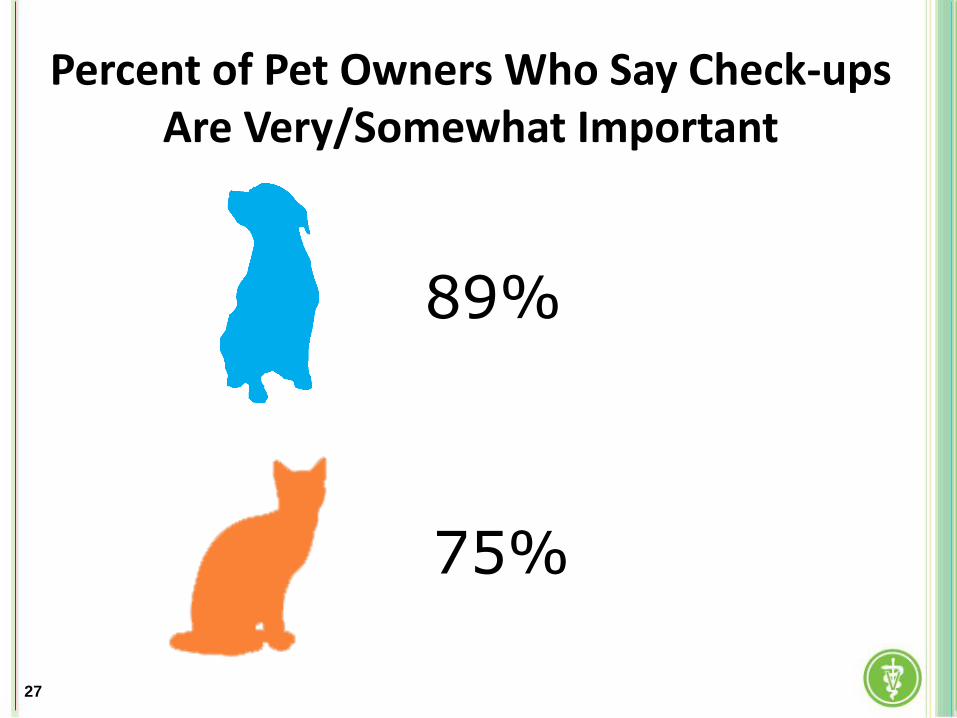
Percent of Pet Owners Who Say Check-ups Are Very/Somewhat Important
89%
75%
27
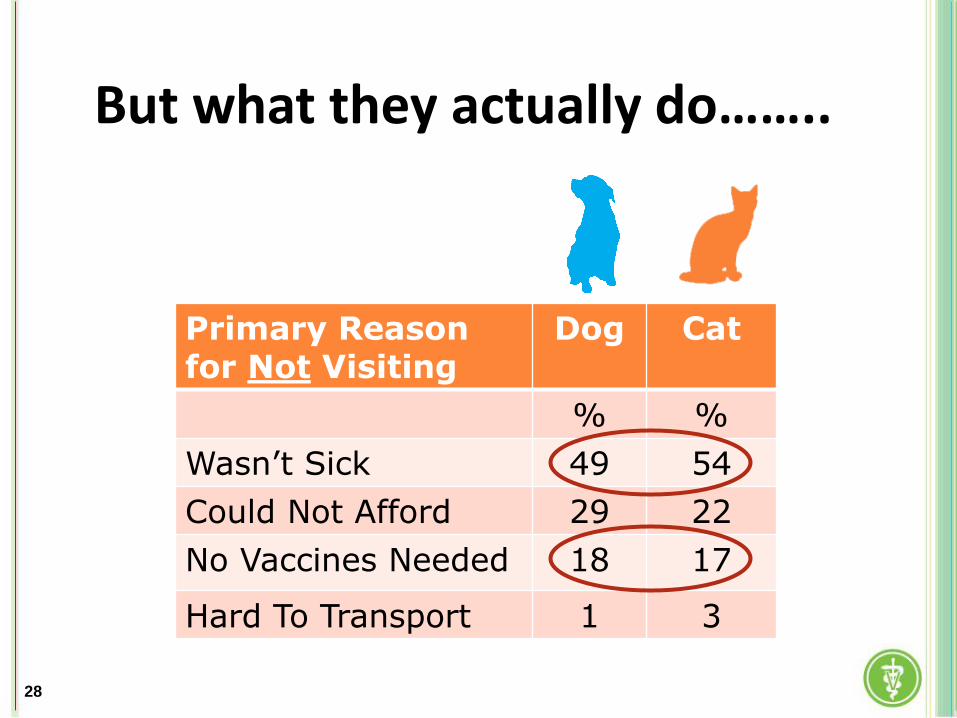
But what they actually do……..
Primary Reason for Not Visiting
Dog Cat
% %
Wasn’t Sick 49 54
Could Not Afford 29 22
No Vaccines Needed 18 17
Hard To Transport 1 3
28
Veterinary Expenditures
29
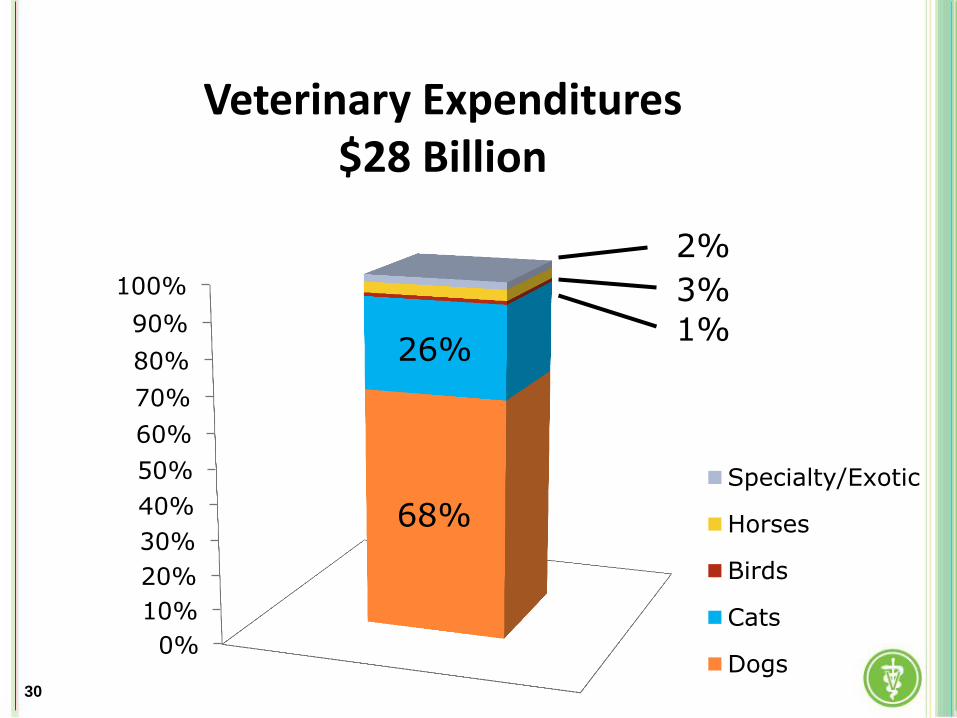
Veterinary Expenditures $28 Billion
0%
10%
20%
30%
40%
50%
60%
70%
80%
90%
100%
68%
26% 1%
3%
2%
Specialty/Exotic
Horses
Birds
Cats
Dogs30
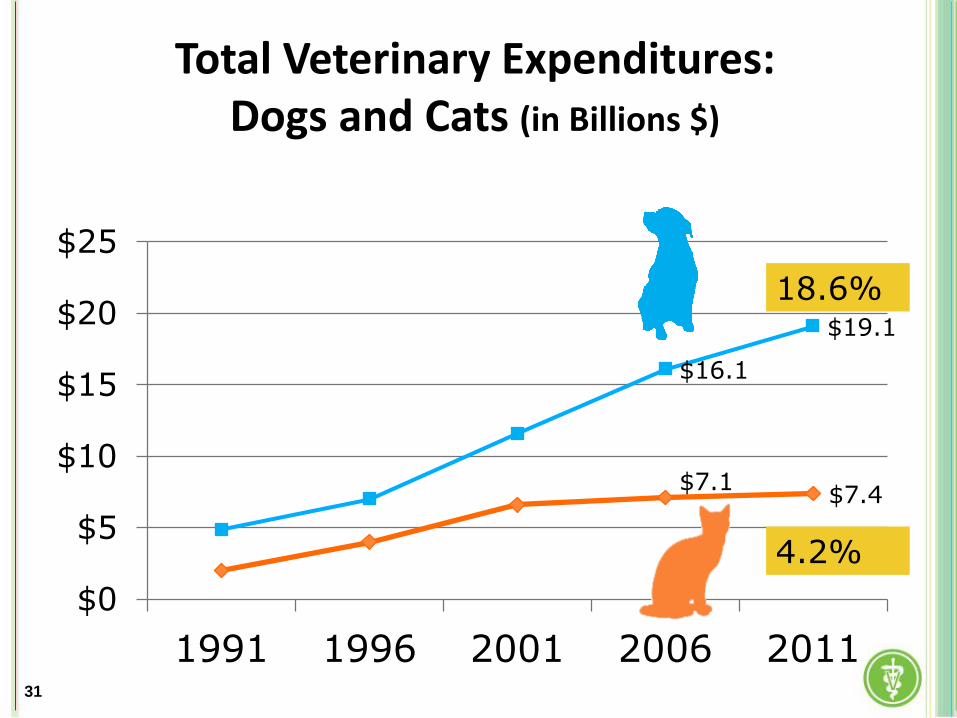
Total Veterinary Expenditures: Dogs and Cats (in Billions $)
$7.1 $7.4
$16.1
$19.1
$0
$5
$10
$15
$20
$25
1991 1996 2001 2006 2011
4.2%
18.6%
31
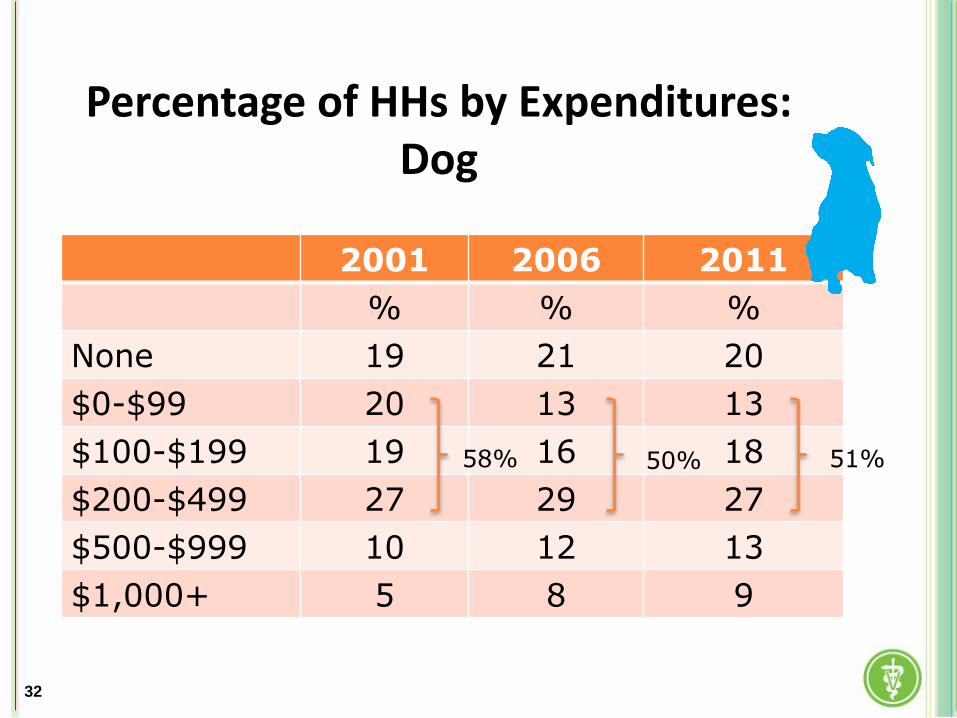
Percentage of HHs by Expenditures: Dog
2001 2006 2011
% % %
None 19 21 20
$0-$99 20 13 13
$100-$199 19 16 18
$200-$499 27 29 27
$500-$999 10 12 13
$1,000+ 5 8 9
58% 50% 51%
32
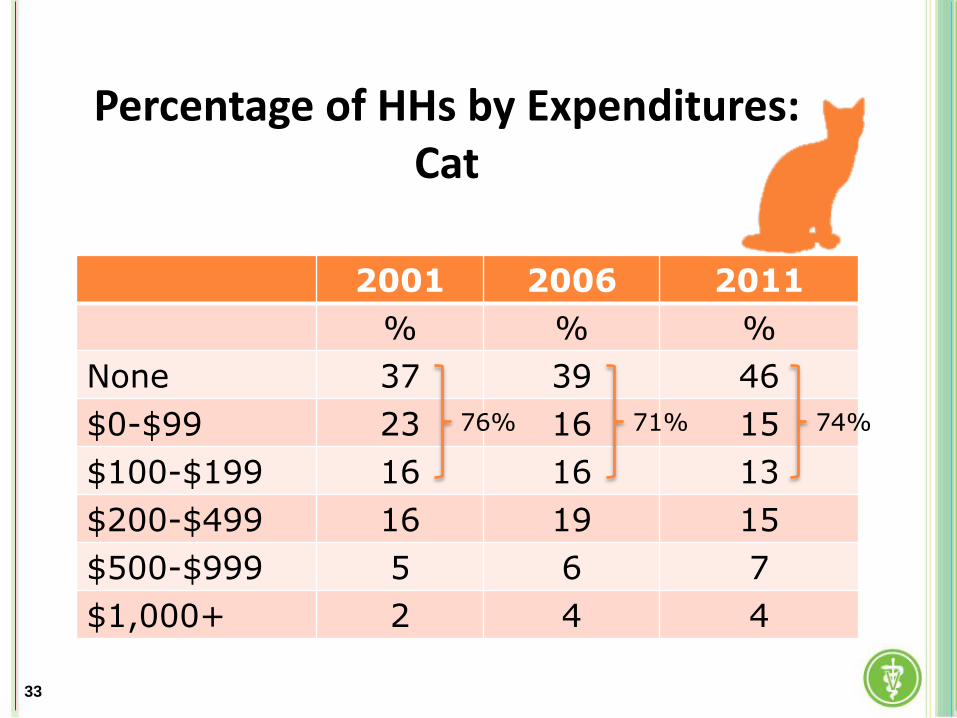
Percentage of HHs by Expenditures: Cat
2001 2006 2011
% % %
None 37 39 46
$0-$99 23 16 15
$100-$199 16 16 13
$200-$499 16 19 15
$500-$999 5 6 7
$1,000+ 2 4 4
76% 71% 74%
33
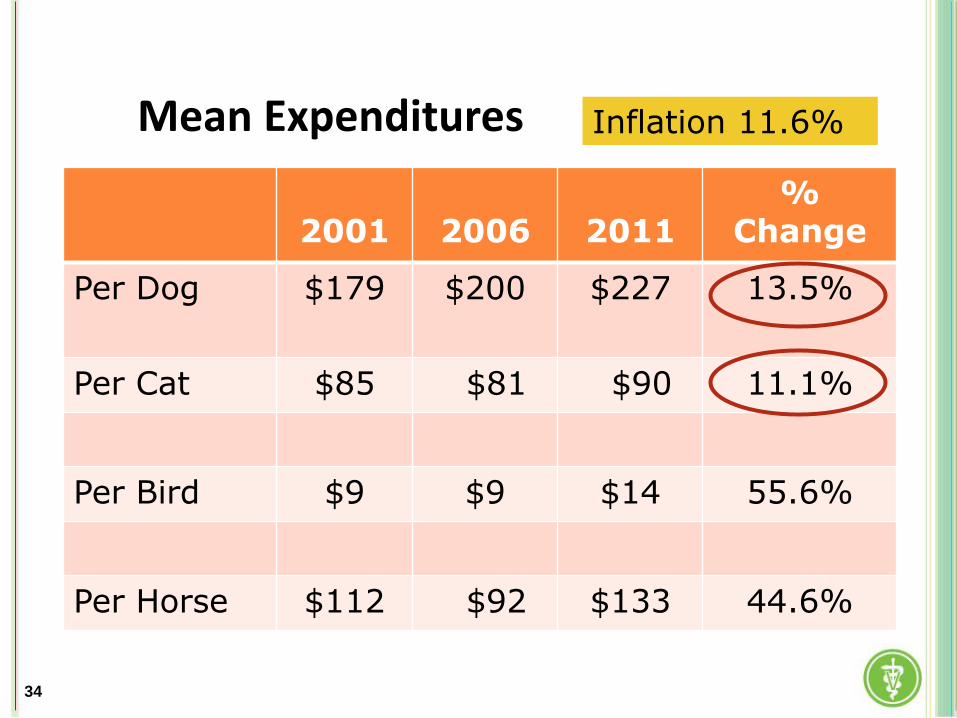
Mean Expenditures
2001
2006
2011
% Change
Per Dog $179 $200 $227 13.5%
Per Cat $85 $81 $90 11.1%
Per Bird $9 $9 $14 55.6%
Per Horse $112 $92 $133 44.6%
34
Inflation 11.6%
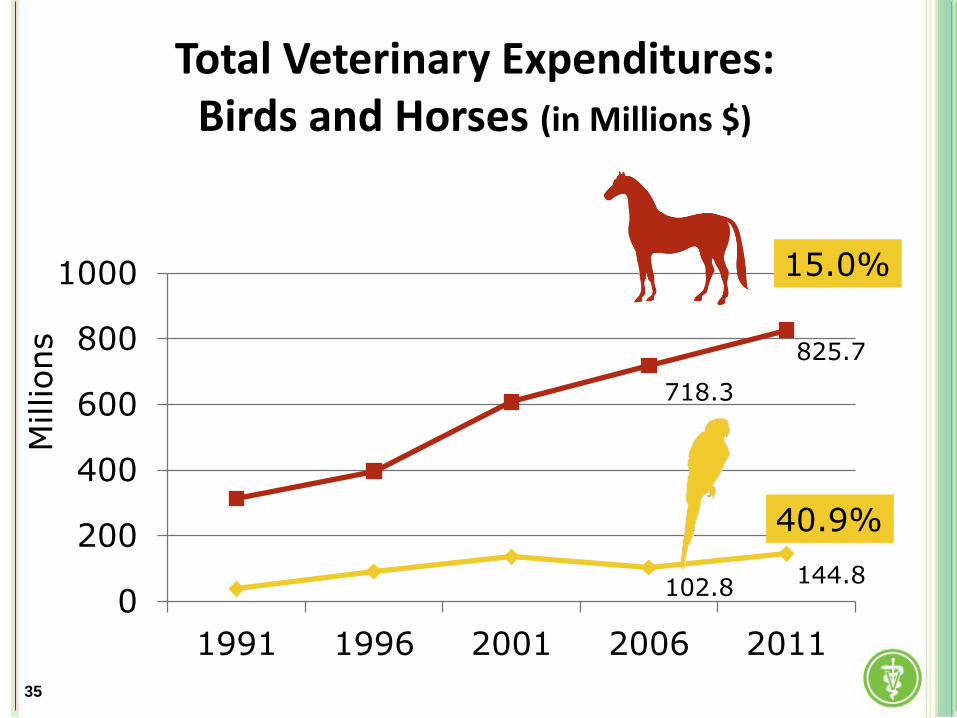
Total Veterinary Expenditures: Birds and Horses (in Millions $)
102.8 144.8
718.3
825.7
0
200
400
600
800
1000
1991 1996 2001 2006 2011
Millions
15.0%
40.9%
35
What Does This Mean?
Most dogs and cats are not getting necessary preventive care
51% of dog HHs spend <$200/year
74% of cat HHs spend <$200/year
Growth in expenditures not real growth
36
What Pet Owners Think and Do About Veterinary Healthcare
37
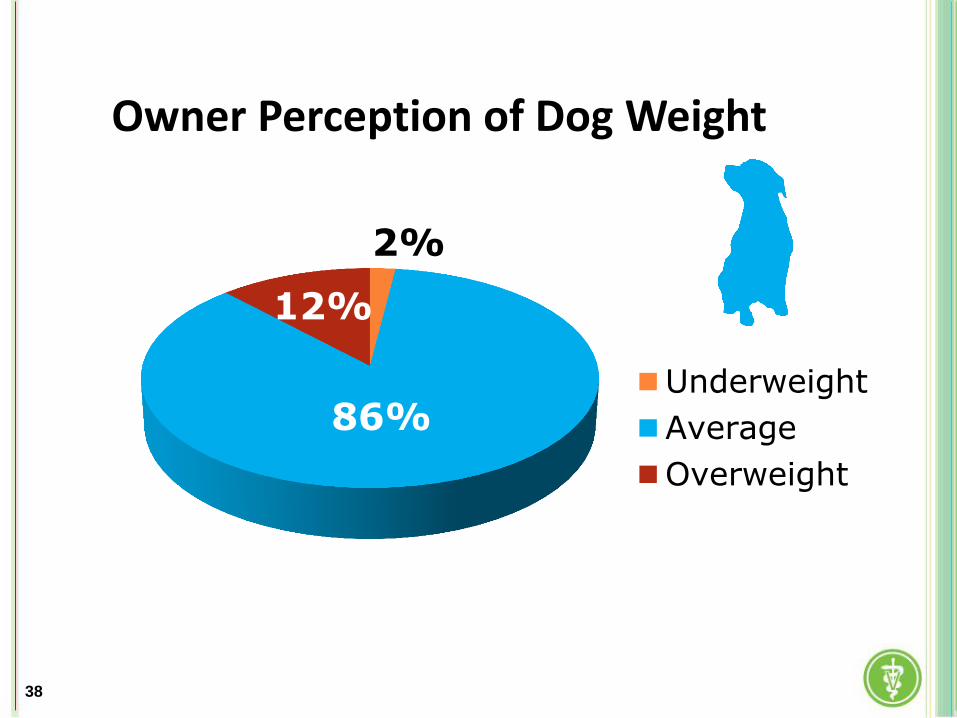
2%
86%
12%
Underweight
Average
Overweight
Owner Perception of Dog Weight
38
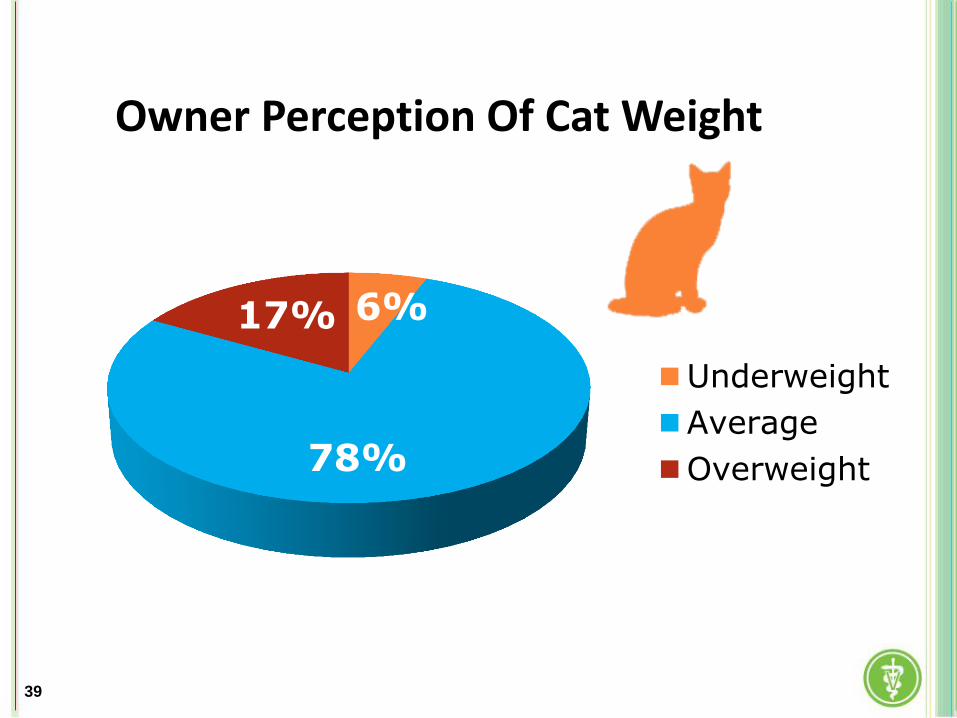
Owner Perception Of Cat Weight
6%
78%
17%
Underweight
Average
Overweight
39
What Does This Mean?
Vast majority of pet owners think their pet is of average weight, but…
37% increase in overweight dogs in past five years, 90% increase in cats
Weight associated with
Diabetes
Arthritis
High blood pressure
Hypothyroidism (dogs)
Banfield Pet Hospital State of Pet Health 2012 Report 40
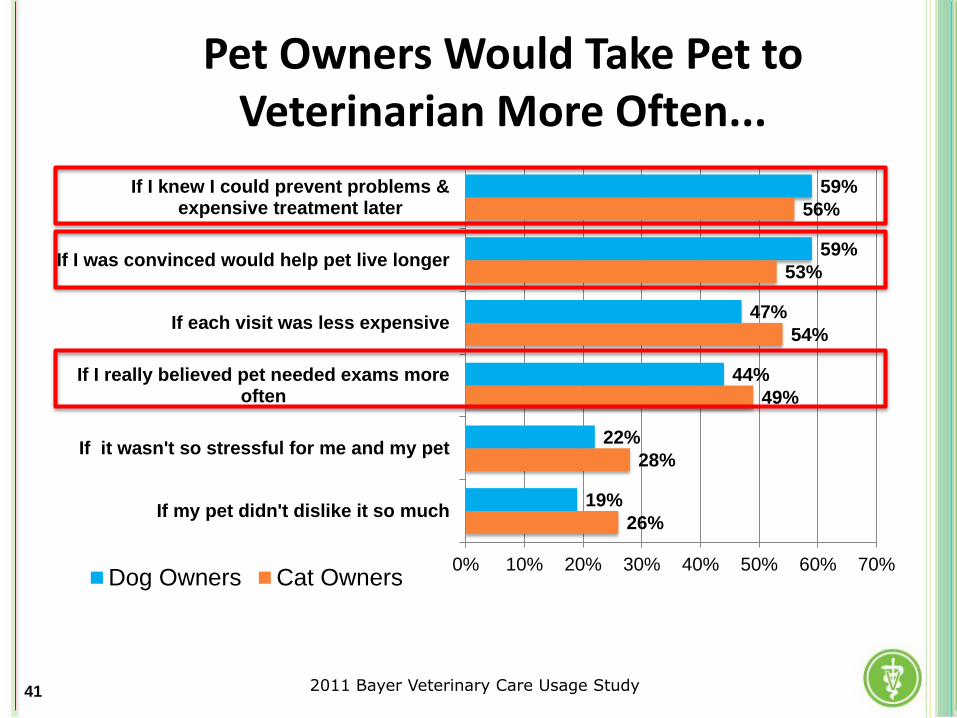
Pet Owners Would Take Pet to Veterinarian More Often...
26%
28%
49%
54%
53%
56%
19%
22%
44%
47%
59%
59%
0% 10% 20% 30% 40% 50% 60% 70%
If my pet didn't dislike it so much
If it wasn't so stressful for me and my pet
If I really believed pet needed exams moreoften
If each visit was less expensive
If I was convinced would help pet live longer
If I knew I could prevent problems &expensive treatment later
Dog Owners Cat Owners
41 2011 Bayer Veterinary Care Usage Study
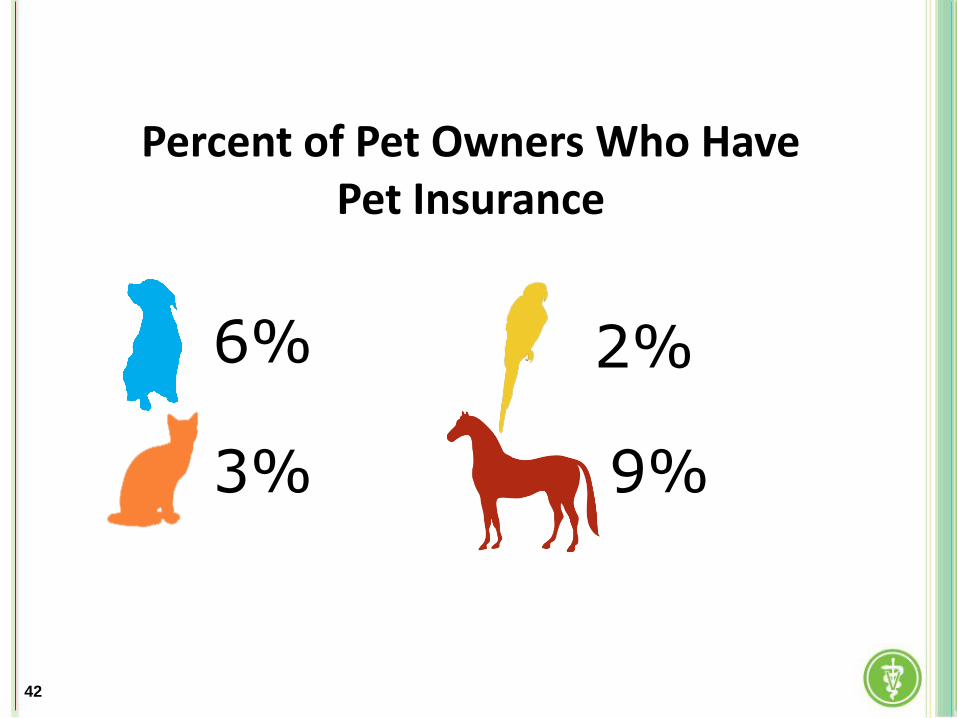
Percent of Pet Owners Who Have Pet Insurance
6%
3% 9%
2%
42

43
Impact of Spay/Neuter
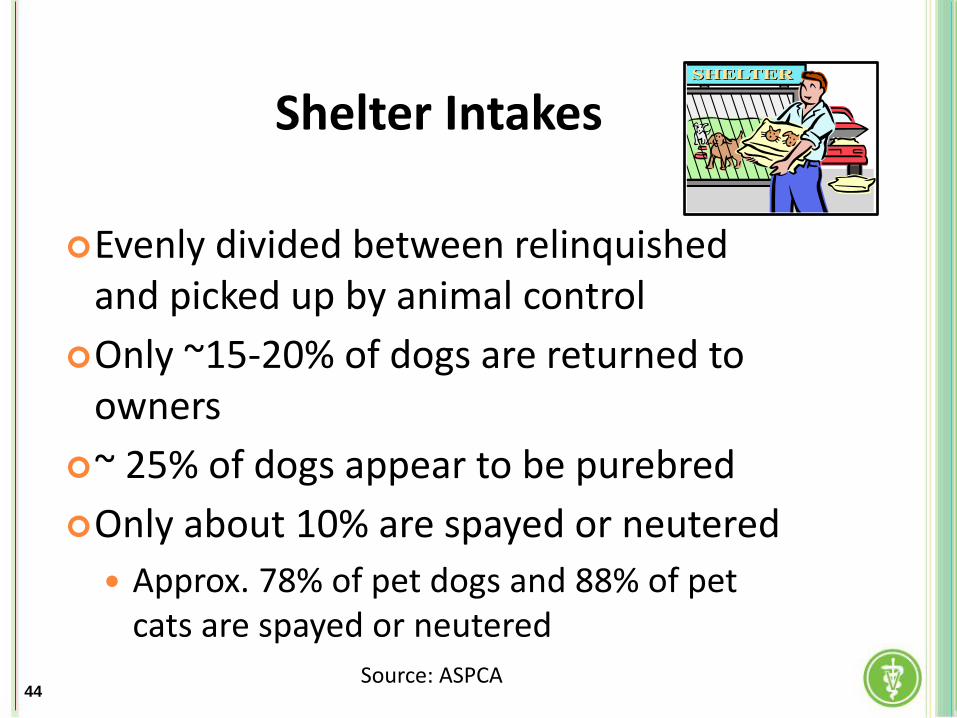
Shelter Intakes
Evenly divided between relinquished and picked up by animal control
Only ~15-20% of dogs are returned to owners
~ 25% of dogs appear to be purebred
Only about 10% are spayed or neutered
Approx. 78% of pet dogs and 88% of pet cats are spayed or neutered
44 Source: ASPCA
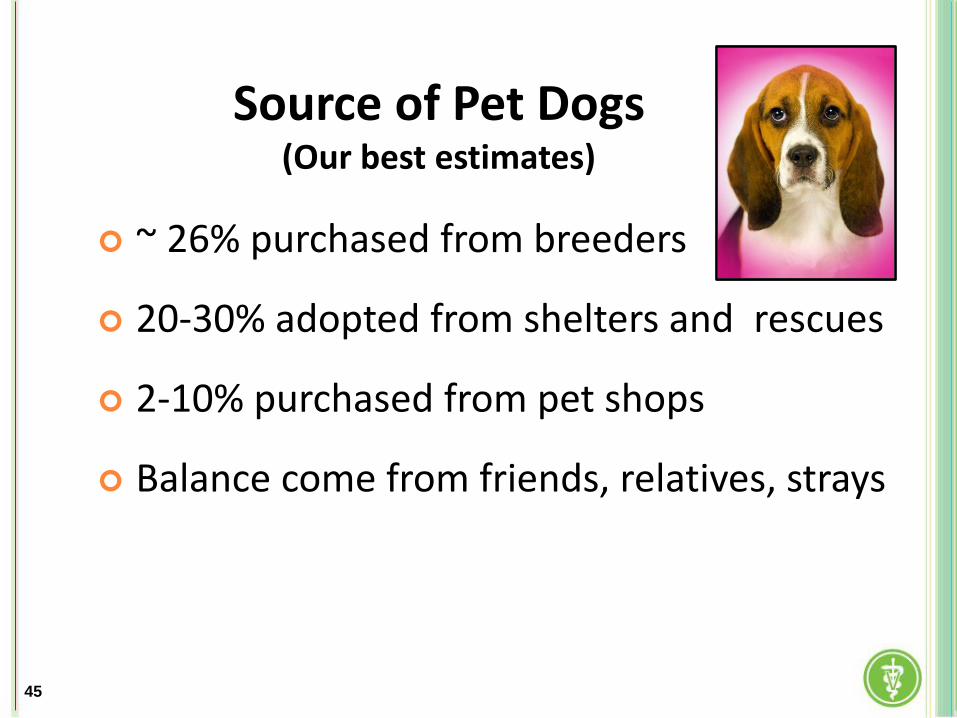
Source of Pet Dogs (Our best estimates)
~ 26% purchased from breeders
20-30% adopted from shelters and rescues
2-10% purchased from pet shops
Balance come from friends, relatives, strays
45
An Unprecedented Coalition
Focused on Improving the
Health of Our Pets
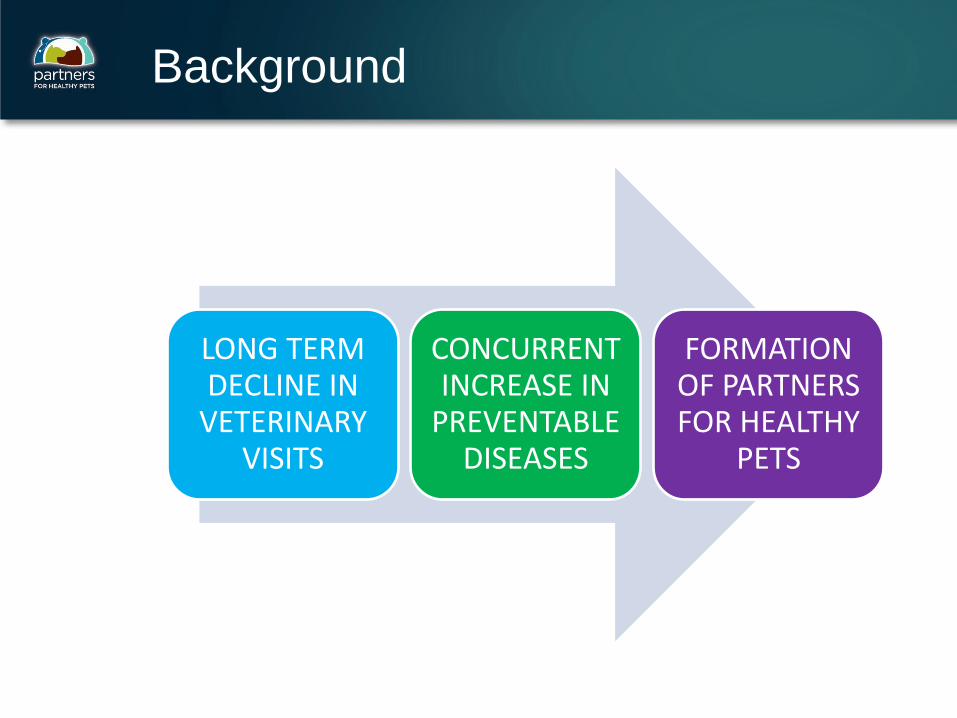
Background
LONG TERM DECLINE IN
VETERINARY VISITS
CONCURRENT INCREASE IN
PREVENTABLE DISEASES
FORMATION OF PARTNERS FOR HEALTHY
PETS

Organizations Involved
TIER 1
TIER 2
TIER 3
SUPPORTER
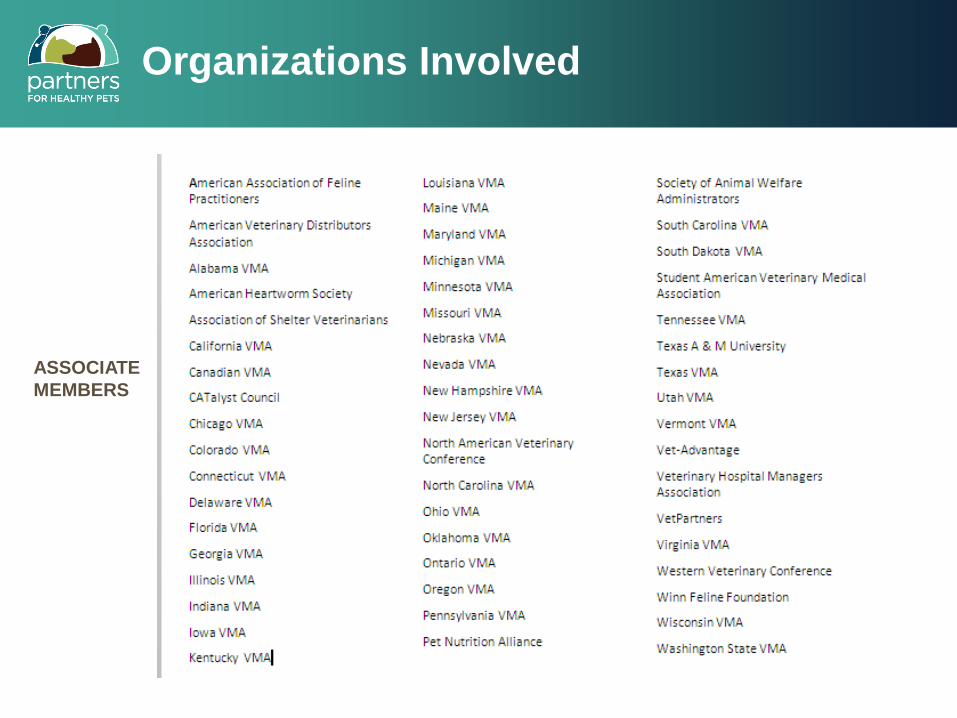
Organizations Involved
ASSOCIATE
MEMBERS
A Growing Partnership
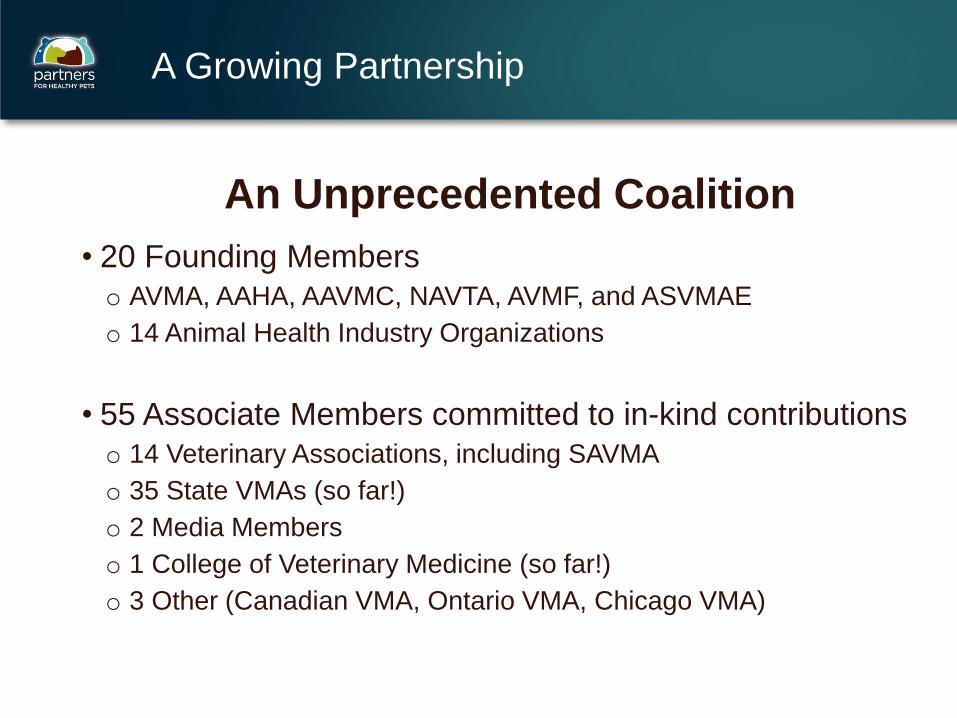
An Unprecedented Coalition
• 20 Founding Members
o AVMA, AAHA, AAVMC, NAVTA, AVMF, and ASVMAE
o 14 Animal Health Industry Organizations
• 55 Associate Members committed to in-kind contributions
o 14 Veterinary Associations, including SAVMA
o 35 State VMAs (so far!)
o 2 Media Members
o 1 College of Veterinary Medicine (so far!)
o 3 Other (Canadian VMA, Ontario VMA, Chicago VMA)
Mission and Vision
Our Mission:
To ensure that pets receive the preventive healthcare
they deserve through regular visits to a veterinarian
Our Vision:
To improve the overall health of our pets
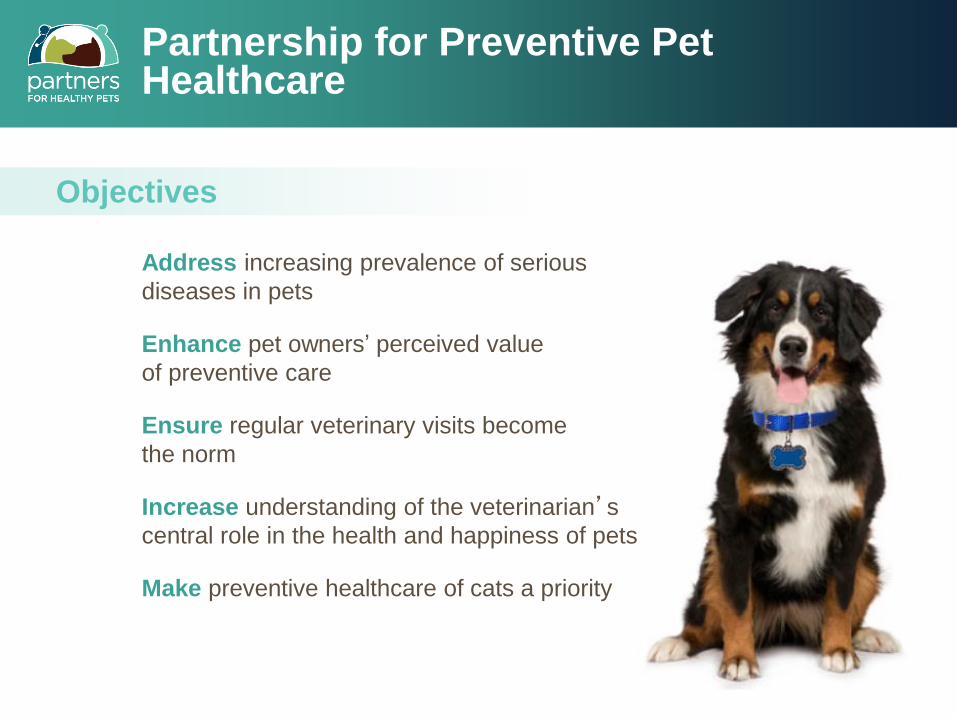
Partnership for Preventive Pet Healthcare
Address increasing prevalence of serious
diseases in pets
Enhance pet owners’ perceived value
of preventive care
Ensure regular veterinary visits become
the norm
Increase understanding of the veterinarian’s
central role in the health and happiness of pets
Make preventive healthcare of cats a priority
Objectives
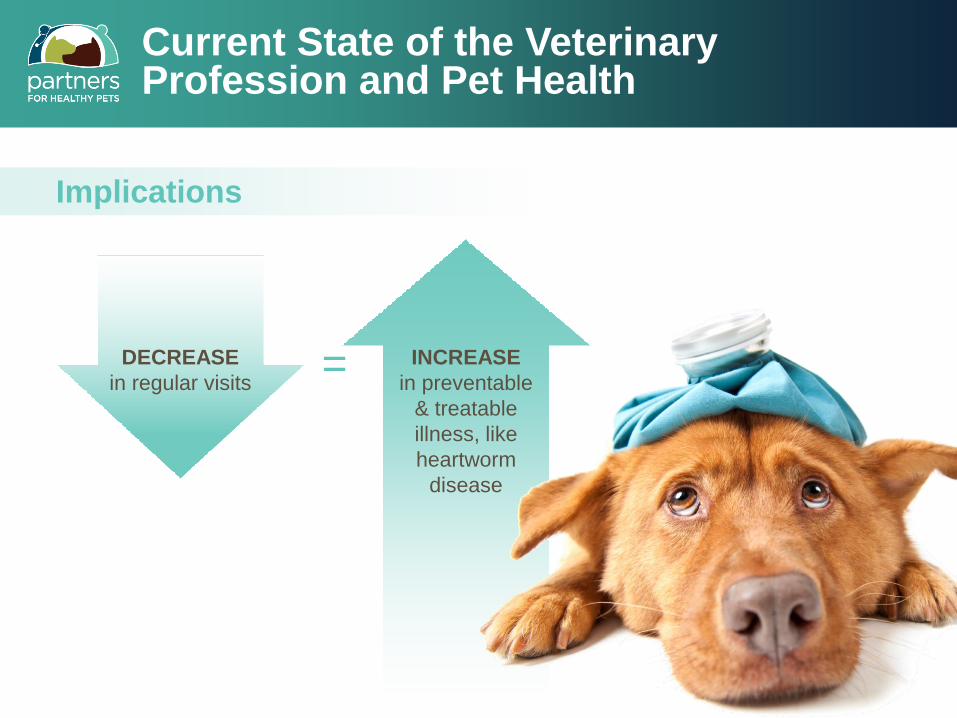
Current State of the Veterinary Profession and Pet Health
INCREASE
in preventable
& treatable
illness, like
heartworm
disease
Implications
DECREASE
in regular visits =
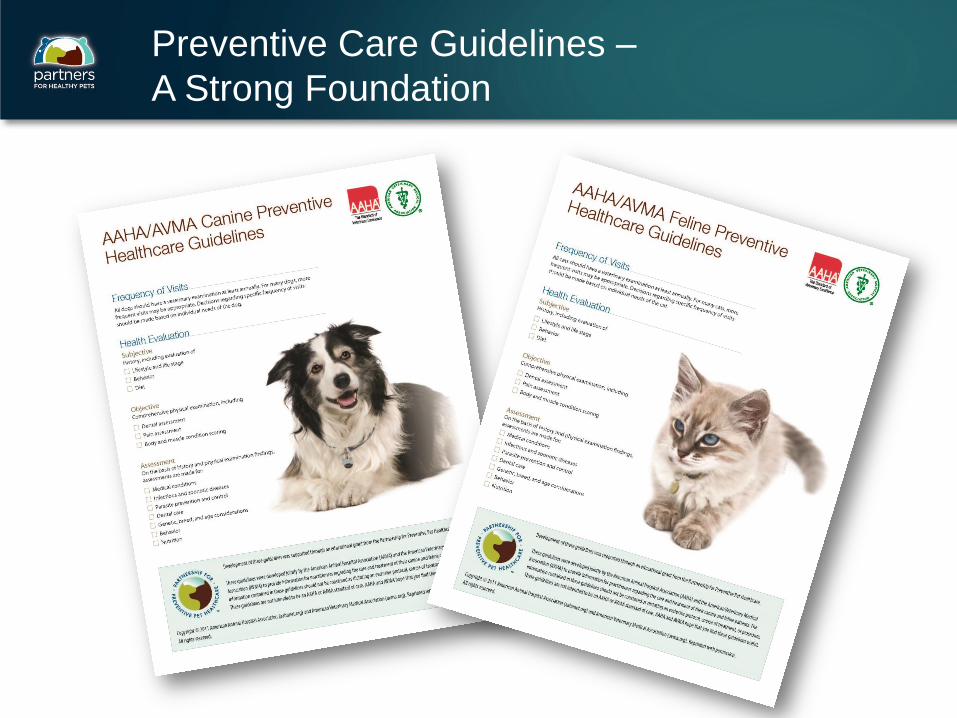
Preventive Care Guidelines –
A Strong Foundation

Partners for Healthy Pets
Offers innovative tools &
resources to the profession
Partners for Healthy Pets
partnersforhealthypets.org
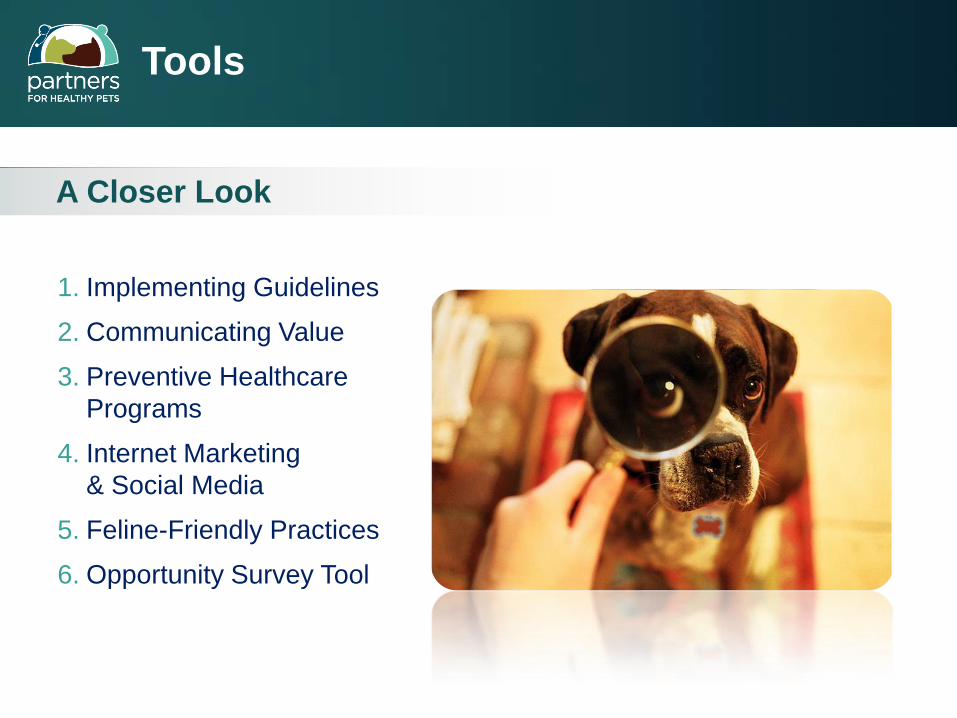
Tools
A Closer Look
1. Implementing Guidelines
2. Communicating Value
3. Preventive Healthcare
Programs
4. Internet Marketing
& Social Media
5. Feline-Friendly Practices
6. Opportunity Survey Tool
Next Objective: Engage Pet Owners
Direct to Consumer Campaign
•Anticipate the launch of an 18 month
campaign in July 2013
•Projected $5+ Million budget
•Potential to expand scope and duration

Practice Enrollment
May – July 2013
• Sales representatives of member companies will
recruit practices to participate
• Participating Practice Materials
o Participant logo/badge (e.g., window cling)
o Creative materials for practice display, websites,
and newsletters
o Periodic updates as campaign unfolds
We’re All Working Together
Veterinary Associations
Animal Health Industry Companies
Veterinary Practices
An Important Mission.
A Powerful Partnership.
Be Part of It!