The Aviva Real Retirement Report - Issue 7 September 2011
20
The Aviva Real Retirement Report Issue Seven September 2011 RETIREREPORT_V7_32694_BRO.indd 1 15/09/2011 10:38
Transcript of The Aviva Real Retirement Report - Issue 7 September 2011

The Aviva Real Retirement Report Issue SevenSeptember 2011
RETIREREPORT_V7_32694_BRO.indd 1 15/09/2011 10:38

Welcome to Aviva’s seventh Real Retirement Report. We have been tracking
the concerns and finances of the three distinctive ages of retirement –
pre-retiree (aged 55-64), retiring (65-74) and long-term retired (over-75)
for almost two years now and have found distinctive trends emerging.
Each quarter we look at an area of particular concern to this age group
with the focus for September 2011 on long-term care. The recent Dilnot
Commission Report (04 July 2011) has put this issue firmly in the spotlight
and we believe garnering the thoughts of today’s over-55s is essential.
It has emerged there is little willingness to pay for long-term care with 70%
of over-55s believing that they should not have to pay for care (page 4), with
even those who realise they will need to contribute suggesting just £3,610 is
a fair price for a future life of care. However, while the majority of this age
group would prefer not to pay for care, there is some realisation that they
may have no choice and the majority are now concerned about how they will
meet these costs (page 5).
This concern is likely to stem from the fact that over half (53%) have no plan
in place to meet costs associated with long-term care (page 6) and just 2%
have long-term care insurance. However, the cost of care is not their only
concern as many are also worried about losing their independence (page 5).
However, while the over-55s obviously have concerns about care, it is
encouraging to see that people’s attitudes are becoming more realistic and
while there are no easy solutions, this is a step in the right direction.
Household finances remain tight and we have seen a reversal of some of the
trends evident in the last report. Indeed, over-55 income and savings (page 8)
have now fallen while debts have risen (page 13). Pre-retirees appear to be
particularly affected by savings apathy and despite being in the count down
to retirement have the lowest savings pots and highest number of people
without any savings at all (page 11).
Clive Bolton, ‘at-retirement’ director at Aviva
Foreword
Aviva Real Retirement Report 2
RETIREREPORT_V7_32694_BRO.indd 2 15/09/2011 10:38
Aviva Real Retirement Report 3
l Pre-retirees - (55 to 64 years old) are on the countdown to retirement but 29% still have outstanding mortgages (£53,227 – average outstanding balance) and on average they are repaying £2,471 worth of unsecured debt annually. Despite moving towards the end of their careers, 29% have savings of less than £500 and 46% are not saving anything each month.
l Retiring - (65 to 74 years old) have just passed the age at which many people retire and while 21% are still working, many are looking to relax after a long working life. However, retiring may come as a shock to some as 13% have no savings and 13% still have a mortgage that they need to service. In addition, over half of this age group (51%) have not given active thought as to how they might meet the specific costs of care in retirement.
l Long-term retired - (over 75 years) most are 10 years or more into retirement. Those with private pensions (39%) or employee pensions (41%) are likely to have annuitised. While 72% own their homes outright, a worrying 7% are still paying off a mortgage (av. amount of mortgage debt - £46,873). Despite generally being less economically active, they have the highest number of savers of all age groups (74%).
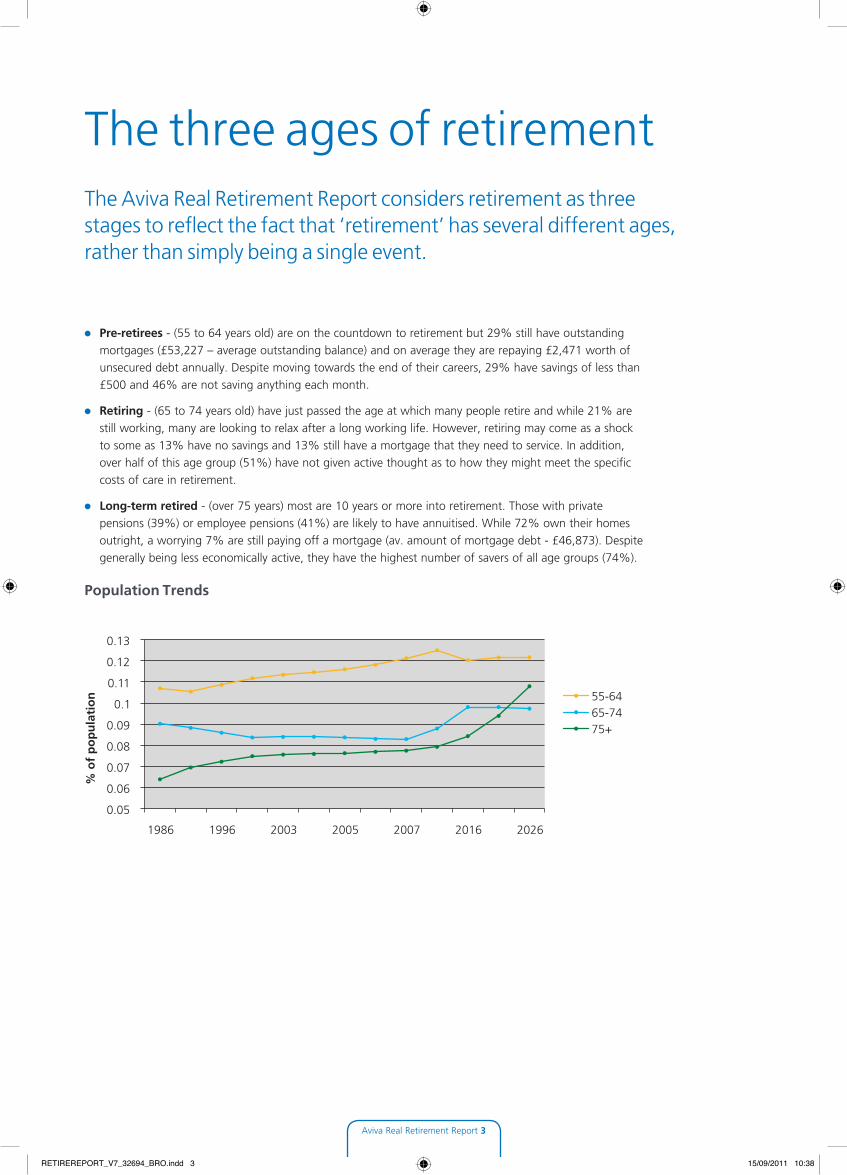
Population Trends
The three ages of retirementThe Aviva Real Retirement Report considers retirement as three stages to reflect the fact that ‘retirement’ has several different ages, rather than simply being a single event.
0.05
0.06
0.07
0.08
0.09
0.1
0.11
0.12
0.13
1986 1996 2003 2005 2007 2016 2026
% o
f p
op
ula
tio
n
55-64 65-74 75+
RETIREREPORT_V7_32694_BRO.indd 3 15/09/2011 10:38
With the publication of the Dilnot Report in July 2011, the question of who should fund long-term care has been put firmly in the spotlight. Aviva’s Seventh Real Retirement Report takes a closer look at this issue to establish how the current over-55 population feel about the impact of the proposed reforms.
Cost of Care:While over-55s estimate that it is likely to cost £30,171 per year to cover standard care in a retirement home, 70% of people don’t believe that in an ideal world they should pay for care at all. While it is obviously not good news that the majority of people believe the state should fund later life care, the fact that they are quite realistic about the actual cost is a good sign.
However - despite this realism - even those who felt they should make some contribution believe that they should contribute a total of just £3,610 towards the cost of their care during their later years. Over-75s - who potentially are more likely to have had some experience of the care system - believe they should contribute the most (£4,828) followed by 55-64s (£3,992) and 65-74s (£2,802).
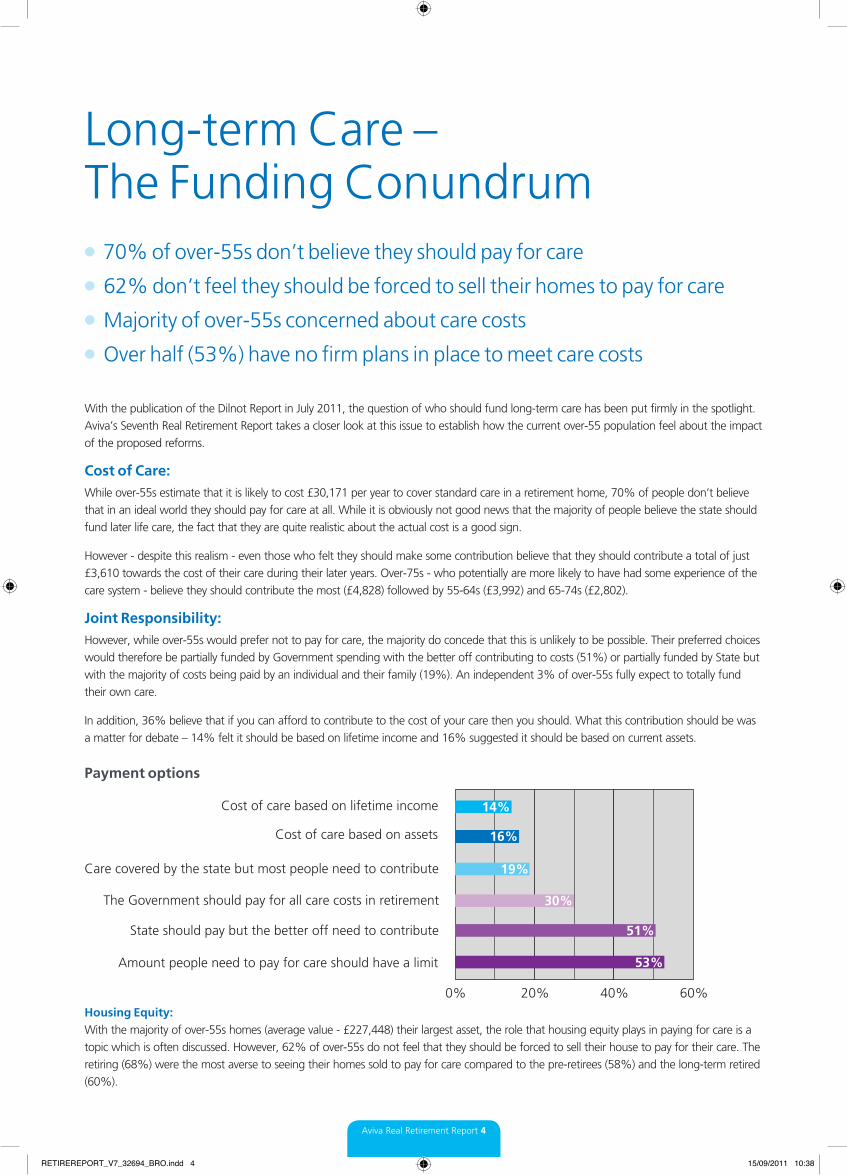
Joint Responsibility:However, while over-55s would prefer not to pay for care, the majority do concede that this is unlikely to be possible. Their preferred choices would therefore be partially funded by Government spending with the better off contributing to costs (51%) or partially funded by State but with the majority of costs being paid by an individual and their family (19%). An independent 3% of over-55s fully expect to totally fund their own care.
In addition, 36% believe that if you can afford to contribute to the cost of your care then you should. What this contribution should be was a matter for debate – 14% felt it should be based on lifetime income and 16% suggested it should be based on current assets.
Payment options
Housing Equity:With the majority of over-55s homes (average value - £227,448) their largest asset, the role that housing equity plays in paying for care is a topic which is often discussed. However, 62% of over-55s do not feel that they should be forced to sell their house to pay for their care. The retiring (68%) were the most averse to seeing their homes sold to pay for care compared to the pre-retirees (58%) and the long-term retired (60%).
Long-term Care – The Funding Conundruml 70% of over-55s don’t believe they should pay for care
l 62% don’t feel they should be forced to sell their homes to pay for care
l Majority of over-55s concerned about care costs
l Over half (53%) have no firm plans in place to meet care costs
Aviva Real Retirement Report 4
0% 20% 40% 60%
Amount people need to pay for care should have a limit
State should pay but the better off need to contribute
Care covered by the state but most people need to contribute
Cost of care based on assets
The Government should pay for all care costs in retirement
16%
Cost of care based on lifetime income 14%
19%
30%
51%
53%
RETIREREPORT_V7_32694_BRO.indd 4 15/09/2011 10:38
Care Confusion:While there are lots of different opinions as to how care should be funded, one clear message from the research was that the over-55s believe finding information on this topic is difficult. Indeed, 47% said there needs to be clearer information and 36% felt it would clear up confusion if one Government department was responsible for all care issues.
The fact that it would be preferable if one Government department oversaw all care issues is evident when people were asked how they would find information on this issue. Almost half of over-55s (48%) would consult the State in one form or another for advice on care - 18% Government directly, 16% local council and 14% a medical professional. Others would turn to the private sector with 11% speaking to a financial adviser and 5% looking to a financial services company for help.
Worries about the cost:With most over-55s aware that they are likely to need to pay for some portion of their care, they were asked how they felt generally about long-term care costs. The highest percentage (41%) said they felt concerned and realised they would need to be careful with their finances if they were to meet the costs.
A further 14% felt that they would need to ‘scrimp’ to meet the costs, 15% said they were worried as they did not feel they would be able to meet the costs and 12% confessed to being terrified about the prospect. Worries about not being able to meet the costs were highest amongst the over-75s (18%) who are least likely to be able to boost their income.
Not the only worry:Despite the cost of care being at the forefront of many people’s minds, only one in five (19%) cited this as their main concern about going into care. Instead, over a quarter (27%) felt that becoming frail and being forced to rely on others was a significant concern as was the loss of independence (23%) that came with needing care. Women (20%) were substantially more worried about the quality of care than men (12%). Conversely, men (23%) were more worried about the cost of care than women (13%).
Home care preferable option:The majority of over-55s (53%) wanted to remain in their homes for as long as possible. Almost a third (31%) said they would prefer care at home until medical issues mean they needed to go into a home, and 22% would like care at home until they needed to go into a hospice/hospital. Even the alternative options, sheltered accommodation (17%) and a retirement community with some access to medical care (19%) allowed them to maintain their independence.
Aviva Real Retirement Report 5
“Long term care is often an immediate needs purchase so it is vital that clear and consistent information is easily available. Unfortunately, this is simply not the case at the moment and people in this situation often don’t fully understand their rights or what they are entitled to. As a country, we need to seriously look at how we fund care but also how accessible it is to people who need it.”Jonathan Bruce – Managing Director of Prestige Nursing + Care
RETIREREPORT_V7_32694_BRO.indd 5 15/09/2011 10:38
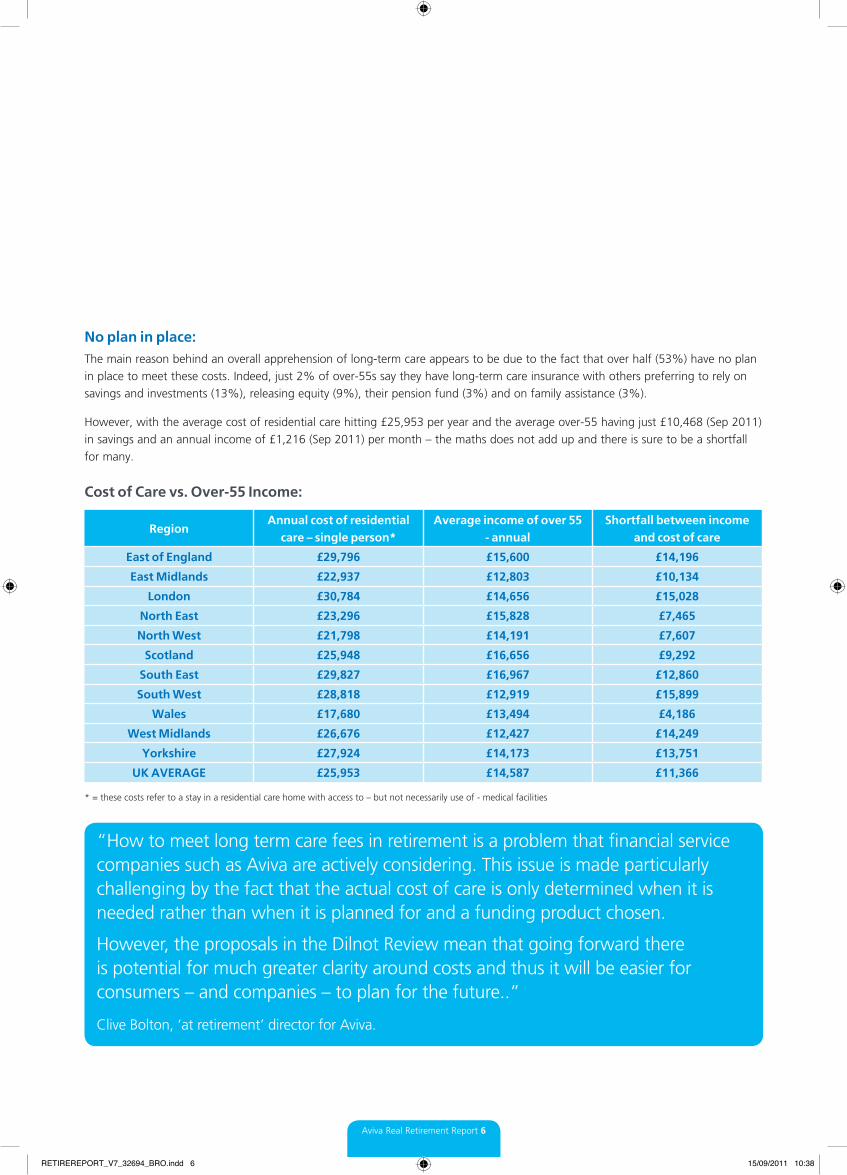
No plan in place:The main reason behind an overall apprehension of long-term care appears to be due to the fact that over half (53%) have no plan in place to meet these costs. Indeed, just 2% of over-55s say they have long-term care insurance with others preferring to rely on savings and investments (13%), releasing equity (9%), their pension fund (3%) and on family assistance (3%).
However, with the average cost of residential care hitting £25,953 per year and the average over-55 having just £10,468 (Sep 2011) in savings and an annual income of £1,216 (Sep 2011) per month – the maths does not add up and there is sure to be a shortfall for many.
Cost of Care vs. Over-55 Income:
* = these costs refer to a stay in a residential care home with access to – but not necessarily use of - medical facilities
Aviva Real Retirement Report 6
RegionAnnual cost of residential
care – single person*Average income of over 55
- annualShortfall between income
and cost of care
East of England £29,796 £15,600 £14,196
East Midlands £22,937 £12,803 £10,134
London £30,784 £14,656 £15,028
North East £23,296 £15,828 £7,465
North West £21,798 £14,191 £7,607
Scotland £25,948 £16,656 £9,292
South East £29,827 £16,967 £12,860
South West £28,818 £12,919 £15,899
Wales £17,680 £13,494 £4,186
West Midlands £26,676 £12,427 £14,249
Yorkshire £27,924 £14,173 £13,751
UK AVERAGE £25,953 £14,587 £11,366
“How to meet long term care fees in retirement is a problem that financial service companies such as Aviva are actively considering. This issue is made particularly challenging by the fact that the actual cost of care is only determined when it is needed rather than when it is planned for and a funding product chosen.
However, the proposals in the Dilnot Review mean that going forward there is potential for much greater clarity around costs and thus it will be easier for consumers – and companies – to plan for the future..”
Clive Bolton, ‘at retirement’ director for Aviva.
RETIREREPORT_V7_32694_BRO.indd 6 15/09/2011 10:38

While lower than the UK wide Retail Price Index (RPI) (5.2%), pensioner RPI (4.76%) is still significant – especially when you consider that pensioner income fell by 6% from £1,294 (June 2011) to £1,216 (Sep 2011).
CPI vs RPI
Annual rate of inflation:All increases to the rate of retail price inflation have an immediate impact on people’s monthly expenditure as the cost of essential goods increases, but price rises tend to have the most significant consequences for those on fixed incomes such as many over-55s.
However, because this group’s typical ‘shopping basket’ has a different bias to the general population; they feel economic pressures in a different way.
For example, as 59% of over-55s own their own home without a mortgage, they are unlikely to benefit from the fact that housing inflation is only 1.39% at the moment. On the other hand, they spend a significant amount of their income on food (15%) and fuel and light (8.6%) so inflation on these costs (food – 6.75% and fuel and light – 8.57%) are likely to have a greater impact on them.
Aviva Real Retirement Report 7
Economic Overview:l Over-55s RPI (4.76%) vs. all UK (5.2%)
-2
-1
0
1
2
3
4
5
6
% c
han
ge
ove
r 12
mo
nth
s
Month
CPI
RPI
Oct-08
Dec-08
Feb-09
Apr-09
Jun-0
9
Aug-09
Oct-09
Dec-09
Feb-10
Apr-10
Jun-1
0
Aug-10
Oct-10
Dec-10
Feb-11
Apr-11
Jun-1
1
Aug-11
RETIREREPORT_V7_32694_BRO.indd 7 15/09/2011 10:38

Aviva Real Retirement Report 8
The data - compiled exclusively for Aviva’s Real Retirement Report - focuses on the weightings attached to the different income sources as opposed to the actual values being derived from them in order to allow meaningful comparison. The most common source of income for the over-55s remains the state pension (61%). It is followed by an employer pension (37%), wages/earned income (36%), and then a personal pension (35%).
Earned Income:It is interesting to note the percentage of over-55s deriving an income from wages or other form of earnings is at one of the highest levels (36%) since February 2010 – this is likely to be as a result of the initial impact of Age Discrimination legislation in conjunction with the rising cost of living which is encouraging people to remain in work as long as possible.
Predictably, the number of people deriving income from wages or other forms of earning falls with age – 53% (55 – 64) to 21% (65 – 74) to 8% (over-75). However, the fact that almost one in ten over-75s (8%) claim to have some income from wages or other earnings highlights the potential longevity of some careers.
Pension Income:The majority of people derive income from one form of pension or another. That State provision (61%) is the most common is to be expected. However, the fact that more of the retiring (65-74) have a employer pension (46%) and private pension (43%) than any other group shows that they have taken on board some of the key Government messages.
Gender Divide:Almost a third of women (28%) – who have traditionally stayed at home or given up work to raise a family – have a pension provided by an employer compared to 43% of men. With increased emphasis on self-provision and the advent of NEST on the horizon, this trend is likely to change in the future.
Savings and Investment Income Dips:With interest rates at a historically low level - unchanged for 31 months - and the stock-market remaining volatile, just 26% of over-55s say they derive some income from savings or investments. This is significantly down from the 33% recorded in Q3 2010, and only slightly down from 28% last quarter (June 2011).
Income l Top three most common sources of income for over-55s are the state
pension (61%), employer pension (37%) and wages/earned income (36%).
l Average income hits historic low (£1,216 – Sep 2011) down from £1,294 (June 2011)
“With increased emphasis on self-provision in retirement, the fact that today’s pre-retirees are less well prepared than older generations is worrying. Waiting until your fifties before starting a pension plan is obviously not ideal but people in this situation need to consider what they can do – as there are options available – rather than what they failed to do in the past.”Clive Bolton, ‘at-retirement director’ for Aviva
RETIREREPORT_V7_32694_BRO.indd 8 15/09/2011 10:38

Aviva Real Retirement Report 9
The retiring (65 - 74) have seen the biggest change in those deriving an income from this source – 32% (Q3 2011) vs. 40% (Q3 2010). While this is obviously due – in part – to the financial environment, as this group has median savings of £16,175 (Q3 2011) it may simply mean that they are choosing to forgo any income from savings and investments at this point – preferring to increase their savings for the future.
Income from property:Residential property is often the largest asset people own when they move into retirement. As a result, income from property wealth, be it in the form of buy-to-let, downsizing, renting out a room, or equity release forms part of many people’s plans for their finances in retirement.
At the moment, 18% of over-55s claim to own a second property (in some shape or form) but only 4% say rental income provides them with a source of funds. Thus it can be assumed that many over-55s own holiday homes, time-shares, properties used by other family members or are not deriving sufficient rent from their buy-to-let property to cover costs and provide an income.
However, while the majority of these properties don’t yield an income at the moment, they are a potentially valuable asset for the future. The mean value of a second property is £174,564 (Sep 2011) with £104,169 (Sep 2011) worth of equity being held.
Income Changes:In September, the median monthly income for the over-55s was £1,216 (£1,294 – June 2011) – the lowest since the Real Retirement Report started tracking the three age groups in February 2010. All age groups have seen a fall since June 2011 with pre-retirees (55 – 64) seeing the biggest drop in income from £1,304 (June 2011) to £1,230 (Sep 2011).
In addition, monthly income for the long-term retired (over-75) dipped below the psychologically important £1,000 barrier (£1,067 – June 2011 vs. £999 – Sep 2011) for the first time. The retiring (65 - 74) saw the lowest overall decrease as their income dipped from £1,379 (June 2011) to £1,314 (Sep 2011).
Almost a quarter (23%) of over-55s now survive on £750 or less a month - with the oldest age group (over-75s) most likely to be facing this situation (26%).
From the recent Aviva Family Finances Report, we can identify that housing (21% - Aug 2011) is generally the largest single expenditure for most people in the UK. Therefore, with the majority (59%) of over-55s owning their own home without a mortgage, they are likely to be able to survive on a lower income. However, it is worrying to see that 30% (Sep 2011) of over-55s in private rental accommodation have an income of less than £750 per month so some older people are likely to be struggling to pay their rent and meet the rising cost of living.
At the other end of the scale, 17% of over-55s have an income of more than £2,500 per month. In keeping with the general trend toward decreasing income, this percentage has fallen from 21% (Q3 2010).
£1,000.00 £1,050.00 £1,100.00 £1,150.00 £1,200.00 £1,250.00 £1,300.00 £1,350.00 £1,400.00 £1,450.00 £1,500.00
Inco
me
(£)
Date
55-64
65-74
75+
Mar
-10
Feb-
10
Apr
-10
May
-10
Jun-
10
Jul-1
0
Aug
-10
Sep-
10
Oct
-10
Nov
-10
Dec
-10
Jan-
11
Feb-
11
Mar
-11
Apr
-11
May
-11
Jun-
11
Jul-1
1
Aug
-11
Sep-
11
RETIREREPORT_V7_32694_BRO.indd 9 15/09/2011 10:38

Aviva Real Retirement Report 10
Expenditure is naturally different for each age group, region and martial status so this section focuses on the expenditure of those who actively pay for or purchase these goods and services. The top five typical expenses for the over-55s are housing (22%), food (15%), debt repayment (13%), fuel and light (9%) and entertainment, recreation and holidays (7%).
Food spending falls as debt repayment rises:The percentage of income spent on food (15% - Q3 2011) has fallen significantly since the same time last year (23% - Q3 2010) as over-55s choose to cut ‘discretionary’ food spending and opt for cheaper options. Clear signs of this are the steadily increasing market share of lower cost supermarkets and the fall in the sales of organic produce as recorded by the Soil Association.
While the amount of money spent on groceries has fallen, the amount put towards debt repayment has increased from 11% (June 2011) to 13% (Sep 2011). This is good news as it shows that the 28% of over-55s who repay debt on a monthly basis are actively working to make their financial future as secure as possible.
In previous quarters, motoring (6% - Sep 2011) was the fifth biggest expense for the typical over-55 household. However, as we have hit the traditional British holiday season, we have seen spending on entertainment, recreation and holidays (7%) in fifth spot.
Age Specific Costs:It is interesting to see the part employment plays in over-55s’ spending patterns. Indeed, while 60% of pre-retirees (55 – 64) pay fares and other travel costs, this drops to 48% for the retiring (65 - 74) before rising to 50% for the long-term retired (over-75). This highlights an initial drop when people stop work and then a slight increase as older age makes public transport the most practical solution.
Expenditurel Top five expenses are housing (22%), food (15%), debt repayment (13%),
fuel and light (9%) and entertainment, recreation and holidays (7%).
RETIREREPORT_V7_32694_BRO.indd 10 15/09/2011 10:38
The typical over-55 has £10,468 (Sep 2011) in savings and investments and has housing equity worth £213,462 (Sep 2011). The median amount of savings (£10,468 – Sep 2011) has fallen by 12% since June 2011 (£11,907) and 36% since Q3 2010 (£16,296).
Pre-retirees (£5,967) have the smallest savings pots followed by the long-term retired (£10,999) and the retiring (£16,175). While the fact that the retiring have the largest savings pots is good news, it is likely to be due to a boost from a lump sum payment from the purchase of an annuity rather than excellent savings habits.
The number of over-55s (17%) who have no savings is up from Q3 2010 (15%) but slightly down from last quarter (19% - June 2011). Digging deeper into these statistics, a worrying trend is developing.
Pre-retirees (55-64) are more likely to be working than the other two age groups but also have the smallest savings pots (£5,967) and the highest number of people without any savings at all (21%). This is a theme which has been relatively constant across all the Real Retirement Reports since February 2010 and illustrates the lack of savings ethic among those who ideally should be putting away the most.
A quarter (25%) of over-55s have savings of less than £500 – this figure has remained stable since the last quarter (June 2011). At the other end of the scale, the number of people with savings of more than £100,000 has fallen from 17% (June 2011) to 15% (Sep 2011) – as it appears that people are dipping into their savings to meet the rising cost of living.
Regular Savers:While the median savings pot has fallen, the median amount saved monthly has increased from £32.94 (June 2011) to £35.35 (Sep 2011). While this is good news, it appears to be a seasonal trend as we saw this slight increase between Q2 (£28.90) and Q3 (£38.69) in 2010.
While we have seen an uplift in monthly savings, there appears to be a hardcore group who are unable or unwilling to save monthly (40% - Sep 2011). Since the report started in February 2010, we have only seen a four percentage point shift between the quarter with the lowest number of people saving nothing (Feb 2010 – 39%) and the quarter who are (March 2011 – 43%).
Almost half of pre-retirees (46% - Sep 2011) save nothing each month compared to the retiring (36% - Sep 2011) and long-term retired (26% - Sep 2010). In addition in monetary terms, they save under half (£19.00 – Sep 2011) of what the other age groups save each month – retiring (£45.44 – Sep 2011) and long-term retired (£44.38).
Assetsl Base rate unchanged for 31 months but over-55s continue to save
l Almost half of all pre-retirees save nothing per month
l Among those who save the average amount has increased
Aviva Real Retirement Report 11
“It is concerning that despite the concerted push by the Government and financial services industry some people are still not saving anything monthly. There appears to be a hard-core set of people who are either unable or unwilling to save who need to be educated and encouraged further.”Clive Bolton, ‘at retirement’ director for Aviva.
RETIREREPORT_V7_32694_BRO.indd 11 15/09/2011 10:38
Aviva Real Retirement Report 12
Gender Divide:Women (£25.69 – Sep 2011) continue to save almost half of what men save each month (£45.77). However, while they do save less, women have increased the amount they save over the last quarter (£15.75 - June 2011) by a significant percentage while men have actually decreased the amount they save (£47.65 – June 2011)
Homeownership:The number of over-55s who own their home either with a mortgage or outright has fallen slightly from 81% (June 2011) to 79% (Sep 2011). At the same time, the percentage of people in rental accommodation has increased from 7% (June 2011) to 9% (Sep 2011) – indicating that due to circumstances or necessity some people are looking to the private rental sector.
In addition, the number of over-55s who own their own home outright has fallen slightly from 62% (June 2011) to 59% (Sep 2011) and the number with mortgages has risen 19% (June 2011) to 21% (Sep 2011). This in itself is a minor fluctuation but may very well be the start of a trend where we see people celebrating their 55th birthday with a larger proportion of their mortgage to pay off than previous generations.
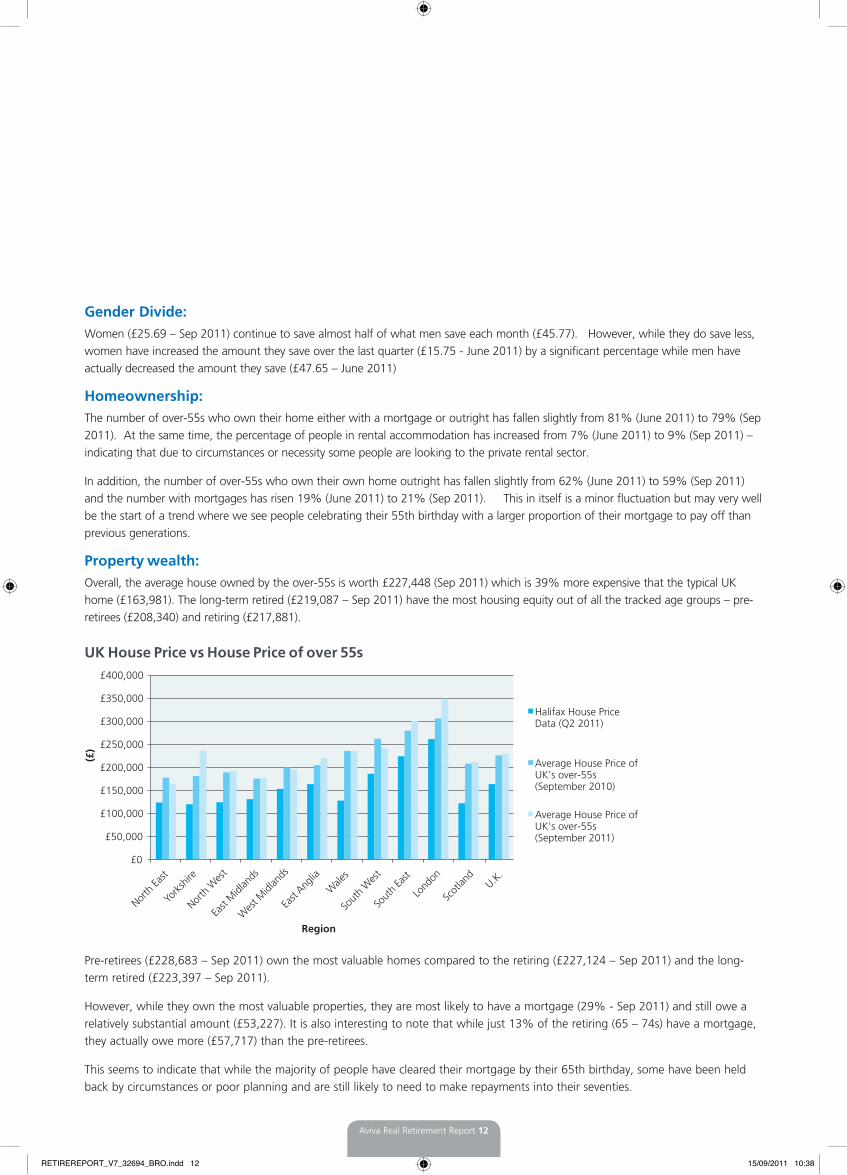
Property wealth:Overall, the average house owned by the over-55s is worth £227,448 (Sep 2011) which is 39% more expensive that the typical UK home (£163,981). The long-term retired (£219,087 – Sep 2011) have the most housing equity out of all the tracked age groups – pre-retirees (£208,340) and retiring (£217,881).
UK House Price vs House Price of over 55s
Pre-retirees (£228,683 – Sep 2011) own the most valuable homes compared to the retiring (£227,124 – Sep 2011) and the long-term retired (£223,397 – Sep 2011).
However, while they own the most valuable properties, they are most likely to have a mortgage (29% - Sep 2011) and still owe a relatively substantial amount (£53,227). It is also interesting to note that while just 13% of the retiring (65 – 74s) have a mortgage, they actually owe more (£57,717) than the pre-retirees.
This seems to indicate that while the majority of people have cleared their mortgage by their 65th birthday, some have been held back by circumstances or poor planning and are still likely to need to make repayments into their seventies.
£0
£50,000
£100,000
£150,000
£200,000
£250,000
£300,000
£350,000
£400,000
North
East
York
shire
North
Wes
t
East
Midl
ands
Wes
t Midl
ands
East
Anglia
Wale
s
Sout
h W
est
Sout
h Ea
st
Lond
on
Scot
land
U.K.
(£)
Region
Halifax House Price Data (Q2 2011)
Average House Price of UK's over-55s (September 2010)
Average House Price of UK's over-55s (September 2011)
RETIREREPORT_V7_32694_BRO.indd 12 15/09/2011 10:38
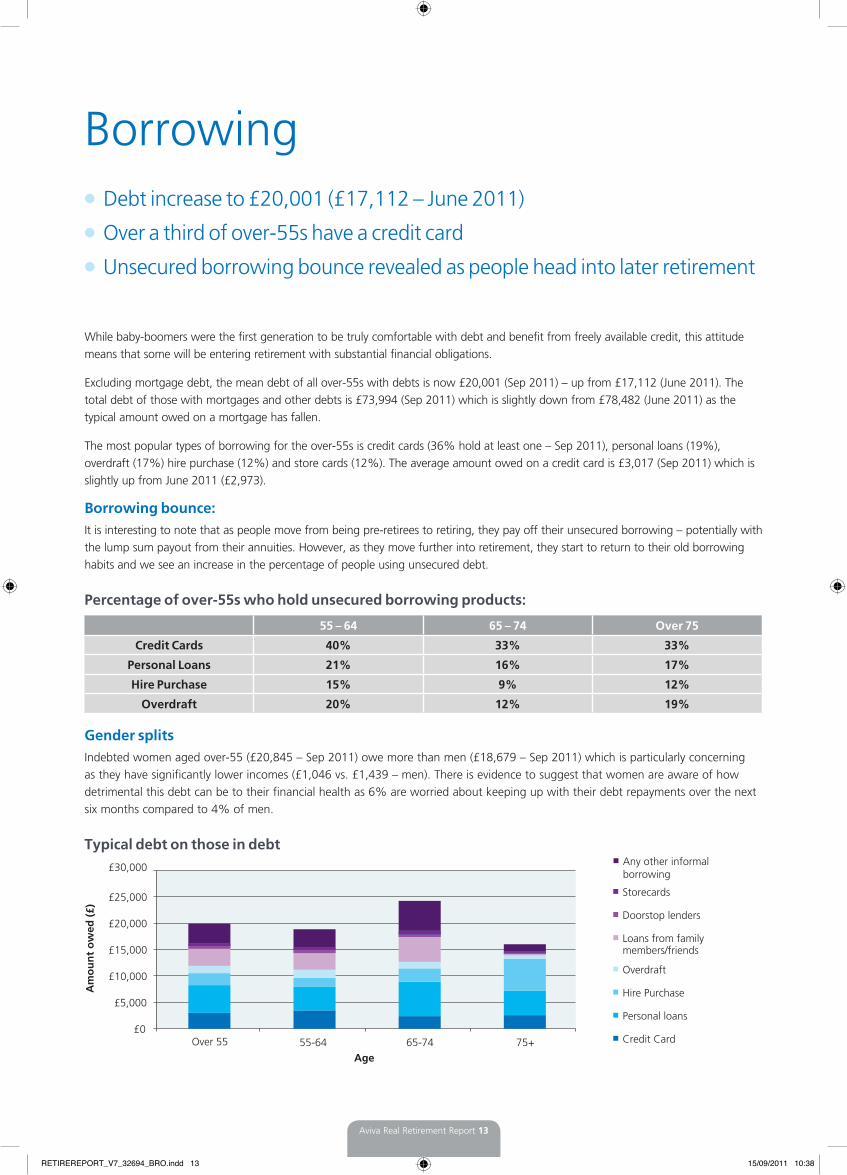
While baby-boomers were the first generation to be truly comfortable with debt and benefit from freely available credit, this attitude means that some will be entering retirement with substantial financial obligations.
Excluding mortgage debt, the mean debt of all over-55s with debts is now £20,001 (Sep 2011) – up from £17,112 (June 2011). The total debt of those with mortgages and other debts is £73,994 (Sep 2011) which is slightly down from £78,482 (June 2011) as the typical amount owed on a mortgage has fallen.
The most popular types of borrowing for the over-55s is credit cards (36% hold at least one – Sep 2011), personal loans (19%), overdraft (17%) hire purchase (12%) and store cards (12%). The average amount owed on a credit card is £3,017 (Sep 2011) which is slightly up from June 2011 (£2,973).
Borrowing bounce:It is interesting to note that as people move from being pre-retirees to retiring, they pay off their unsecured borrowing – potentially with the lump sum payout from their annuities. However, as they move further into retirement, they start to return to their old borrowing habits and we see an increase in the percentage of people using unsecured debt.
Percentage of over-55s who hold unsecured borrowing products:
Gender splitsIndebted women aged over-55 (£20,845 – Sep 2011) owe more than men (£18,679 – Sep 2011) which is particularly concerning as they have significantly lower incomes (£1,046 vs. £1,439 – men). There is evidence to suggest that women are aware of how detrimental this debt can be to their financial health as 6% are worried about keeping up with their debt repayments over the next six months compared to 4% of men.
Typical debt on those in debt
Borrowingl Debt increase to £20,001 (£17,112 – June 2011)
l Over a third of over-55s have a credit card
l Unsecured borrowing bounce revealed as people head into later retirement
Aviva Real Retirement Report 13
Am
ou
nt
ow
ed (
£)
55-64 Over 55 65-74 75+ Age
£0
£5,000
£10,000
£15,000
£20,000
£25,000
£30,000
Storecards
Any other informalborrowing
Doorstop lenders
Loans from family members/friends
Overdraft
Hire Purchase
Personal loans
Credit Card
55 – 64 65 – 74 Over 75
Credit Cards 40% 33% 33%
Personal Loans 21% 16% 17%
Hire Purchase 15% 9% 12%
Overdraft 20% 12% 19%
RETIREREPORT_V7_32694_BRO.indd 13 15/09/2011 10:38

Over-55 optimism:As part of the Real Retirement Report, Aviva has been tracking over-55s’ optimism about how they feel their standard of living will change over the next quarters for almost two years.
This age group is significantly more pessimistic than they were a year ago. Indeed, fewer people believe they will see an improvement (4% vs. 6% - Aug 2010), fewer people believe it will stay the same (60% vs. 65% - Aug 2010) and more feel their standard of living will decline (35% vs. 29% - Aug 2010).
However, while they are more pessimistic than in August 2010 (29%), there have been some small improvements since March 2011 (37%) when a record number of people felt they would see a deterioration in their standard of living.
What do you believe will happen to your standard of living over the next quarter?
Six month overview:The rising cost of living (73%) was the biggest fear for the over-55s over the next six months followed by falling return on savings (34%) and unexpected expenses (30%). This demographics fears about the rising cost of living have remained constant since June (73%) but have fallen significantly since March 2011 (83%).
They are currently marginally less worried about unexpected expenses (30%) than in June (31%). However, as interest rates remain at historically low levels for the 31st consecutive month, over-55s are dipping into their savings and the lack of returns is becoming increasingly worrying (34% - Sep 2011 vs. 29% - June 2011).
Over-55s Worries:l Over-55s less optimistic than last year
l Unexpected expenses are a consistent worry over six months and five years
l Redundancy (16%) a key fear for pre-retirees in the near future (6 months)
Aviva Real Retirement Report 14
Improve Stay the same Deteriorate
Feb 2010 3% 75% 22%
May 2010 5% 67% 27%
Aug 2010 6% 65% 29%
Dec 2010 4% 64% 32%
March 2011 5% 59% 37%
June 2011 3% 63% 34%
Sep 2011 4% 60% 35%
RETIREREPORT_V7_32694_BRO.indd 14 15/09/2011 10:38

Aviva Real Retirement Report 15
Age specific worries:When comparing the worries of each age group, some interesting differences are evident.
The pre-retirees (55 – 64) are most concerned about losing their jobs or redundancy (16%) in the lead up to retirement – an issue which the June Real Retirement Report highlighted as a real possibility. The loss of Government benefits (9%) is also a concern for this age group as many of them have yet to start drawing a state pension so are vulnerable to these types of changes.
The retiring (65 – 74) - who are likely to be learning to live on a more fixed income - are the most concerned of all the age groups about the rising cost of living (79%), unexpected expenses (31%) and an increase in taxes (14%).
At the other end of the spectrum, the long-term retired (over-75), while most concerned about falling returns on investments (27%) are also the most likely to say that they don’t think there are any threats to their lifestyle over the next six months (19%).
Long-term outlook:Over the next five years, over-55s are again worried about the rising cost of living (70% vs. 68% - June 2011), unexpected expenses (31% vs. 31% - June 2011) and the falling returns on savings (30% vs. 27% – June 2011). The fact that the base rate has remained at historically low levels for 31 months and significant inflation has been experienced appears to be behind the slight shift in over-55s’ perception.
However, the overall precarious nature of some people’s finances is clearly highlighted by the fact their fears focus on these issues rather than worries about a serious illness for them or their partner (20%) or the death of their partner (11%).
RETIREREPORT_V7_32694_BRO.indd 15 15/09/2011 10:38

Average house price Average mortgage Own house outright Number of Over 55s
1 East £218,934 £47,020 62% 1,706,000
2 London £346,667 £51,039 54% 1,574,100
3 East Midlands £175,536 £77,974 55% 1,305,200
4 West Midlands £192,892 £34,373 64% 1,568,900
5 North East £162,162 £46,427 61% 765,700
6 North West £190,586 £43,448 59% 1,977,600
7 Scotland £210,536 £47,498 51% 1,512,000
8 South East £298,934 £63,087 57% 2,458,000
9 South West £239,610 £65,336 60% 1,696,900
10 Wales £233,696 £37,500 74% 938,100
11 Yorkshire £233,696 £41,175 61% 1,475,100
UK £227,448 £53,993 59% 16,977,600
Regional overviewl Over-55s in Scotland and South East have highest incomes
l However, those in Wales are most likely to own their own homes
The over-55s in the South East (£1,414) and Scotland (£1,388) have the highest monthly incomes in the UK. At the other end of the scale those in the West Midlands (£1,036) and East Midlands (£1,067) have the least.
In terms of sources of income – excluding the State pension which all eligible pensioners receive – those in the North East (45%), Wales (44%), and the West Midlands (43%) are the most likely to have a personal pension. Those in the South West and London (both 29%) are the regions least likely to have taken out a personal pension.
Over-55s in the North East are the most likely be saving each month (78%) and those in Wales (50%) are the least likely to be saving something each month.
Those in the North East have the largest savings pots out of any region (£23,332), followed by North West (£18,998) and the West Midlands (£14,999). This is more than double the average savings of the over-55s in East (£4,284) who have the smallest savings pot out of any of the regions. A fifth (20%) of the over-55s in Scotland has savings that exceed £100,000, whereas in Wales just 10% of over-55s have more than £100,000 in savings.
In contrast to their savings habits the over-55s in Wales are the most likely to own their own home outright (74%) compared to just 51% of those in Scotland. While those in the North East are the most savings conscious group they are also the most likely group to still be paying off their mortgage (29%).
With mortgage rates currently low, should they rise in the future it could prove a strain for those on a relatively fixed income. Just 51% of over-55s living in Scotland own their own home outright and 54% of over-55s in London own their own home – possibly as a result of high house prices in these areas.
Aviva Real Retirement Report 16
RETIREREPORT_V7_32694_BRO.indd 16 15/09/2011 10:38

Aviva Real Retirement Report 17
RETIREREPORT_V7_32694_BRO.indd 17 15/09/2011 10:38

So what does this tell us?
This edition of the Real Retirement Report takes another look at over-55s’ finances and focuses a spotlight on the issues around long-term care. How do people intend to pay for it? What do they expect it to cost? What are their major concerns? All these questions are addressed and lead us to conclude that when planning for care in retirement the following need to be taken into account:
1. Have a financial plan – Care in retirement is often an immediate needs purchase so it is essential that consumers have a financial plan in place to pay for this if they don’t want to be forced to make some difficult choices.
2. There are lots of different care options – Each person has a preference as to what type of care they would like in retirement but it is essential to research each of them so they are aware of what is available.
3. Your home is your largest asset so take it into account - For most people entering retirement, their home is their largest asset so they need to take this into account when planning how to pay for their retirement as well as any care fees.
4. Incomes can go up as well as down – When people enter retirement, they often assume that their income will remain steady or match inflation, this is often not the case and people need to plan carefully for the future.
5. Plan for your concerns – Most over-55s are worried about the rising cost of living so it make sense to look for investments and pensions which provide some form of protection against high inflation.
Aviva Real Retirement Report 18
“Following these simple tips will mean that people enjoy a better standard of living in retirement with fewer worries.”Clive Bolton, ‘at retirement’ director for Aviva.
RETIREREPORT_V7_32694_BRO.indd 18 15/09/2011 10:38

RETIREREPORT_V7_32694_BRO.indd 19 15/09/2011 10:38

RETIREPORT_V7_32694 09/2011 © Aviva plc
MethodologyThe Real Retirement Report was designed and produced by Wriglesworth Research. As part of this more than 10,300 UK consumers aged over 55 were interviewed between February 2010 and September 2011.
This data was used to form the basis of the Aviva Real Retirement Report. Wherever possible, the same data parameters have been used for analysis but some additions or changes have been made as other tracking topics become apparent.
Additional data sources include:
l Office of National Statistics – Inflation Data – Sep 2011
l Halifax House Price – July 2011 – House Price Figures
l Family Finances Report – Aviva – Sep 2011
l Soil Association – Sales of Organic Food - Aug 2011
l Kantar Worldpanel – Supermarket Trends - Aug 2011
l Prestige Nursing & Care – Average Cost of Residential Care – June 2011
Technical notesl A median is described as the numeric value separating the upper half of a sample, a population, or a probability distribution, from
the lower half. Thus for this report, the median is the person who is the utter middle of a sample.
l An average or mean is a single value that is meant to typify a list of values. This is derived by adding all the values on a list together and then dividing by the number of items on said list. This can be skewed by particularly high or low values.
For further details please contact
Tom Wilson
Aviva Press Office
01904 684 283
RETIREREPORT_V7_32694_BRO.indd 20 15/09/2011 10:38


![[ARCHIVE] Aviva Real Retirement report, March 2012](https://static.fdocuments.in/doc/165x107/559d57001a28abd2258b473a/archive-aviva-real-retirement-report-march-2012.jpg)