
The Atomic Spectrum of Hydrogen - Department of …physlabs/manuals/Experiment14.pdf · The Atomic...
19
Name___________________________________ Date: ________________ Course number: _________________ MAKE SURE TA & TI STAMPS EVERY PAGE BEFORE YOU START TA or TI Signature ___________________________________ 1 of 14 Laboratory Section: ____________ Partners’ Names: ______________________ Last Revised on September 21, 2016 Grade: ______________________ EXPERIMENT 14 The Atomic Spectrum of Hydrogen 0. Pre-Laboratory Work [2 pts] 1. You will be using a diffraction grating in this lab exercise as a dispersive element in a spectrometer. When you begin to examine the Balmer series of atomic hydrogen, you will observe an indigo line, a red line and a violet line as you move the spectrometer’s telescope away from the zero angle (zeroeth order) position. What will be the sequence of the spectral lines, starting from the zero angle position? Explain why, showing some calculations or a diagram. (1pt) 2. What is the expected measured grating separation, d, if you use a 600 groove/mm grating? A 300 groove/mm grating? Show your work. (1pt)
Transcript of The Atomic Spectrum of Hydrogen - Department of …physlabs/manuals/Experiment14.pdf · The Atomic...
Name___________________________________ Date: ________________ Course number: _________________
MAKE SURE TA & TI STAMPS EVERY PAGE BEFORE YOU START
TA or TI Signature ___________________________________ 1 of 14
Laboratory Section: ____________ Partners’ Names: ______________________
Last Revised on September 21, 2016 Grade: ______________________
EXPERIMENT 14 The Atomic Spectrum of Hydrogen
0. Pre-Laboratory Work [2 pts]
1. You will be using a diffraction grating in this lab exercise as a dispersive element in a
spectrometer. When you begin to examine the Balmer series of atomic hydrogen, you
will observe an indigo line, a red line and a violet line as you move the spectrometer’s
telescope away from the zero angle (zeroeth order) position. What will be the sequence
of the spectral lines, starting from the zero angle position? Explain why, showing some
calculations or a diagram. (1pt)
2. What is the expected measured grating separation, d, if you use a 600 groove/mm
grating? A 300 groove/mm grating? Show your work. (1pt)
Name___________________________________ Date: ________________ Course number: _________________
MAKE SURE TA & TI STAMPS EVERY PAGE BEFORE YOU START
TA or TI Signature ___________________________________ 2 of 14
EXPERIMENT 14
The Atomic Spectrum of Hydrogen
1. Purpose
The purpose of this experiment is to verify the quantum nature of the Balmer series,
specifically for atomic hydrogen, using sodium as a calibration source.
2. Introduction
One of the earliest successes of quantum mechanics was the explanation of the spectrum of
atomic hydrogen. It has long been known that atomic hydrogen had some regular features in its
spectrum. These regularities can be expressed as,
22
,
111
jiji nnR
Equation 14.1
where ji nn are both integers and R is a constant. The spectral lines are classified into series
that are sets of lines with a common value of the integer, in . The expression for wavelength has
been written as the wavenumber (inverse wavelength, usually quoted in units of cm-1
) of the thj member of the thi series. The various series of the spectrum of atomic hydrogen are listed in
Table 14.1.
According to the Bohr theory, the Rydberg constant, R, is given to first approximation by,
12
3
42
10097.14
nmxc
mekR
Equation 14.2
where e and m are the electron charge and mass, respectively, c is the velocity of light, is
Planck's constant divided by 2 , and o
k4
1 . Sometimes there is a small correction that
takes into account the mass, M, of the nucleus. This involves replacing the mass of the electron,
m, with its reduced mass, μ, given by,
Mm
111
Equation 14.3
In this lab you will examine the spectrum of atomic hydrogen in the visible region. This will
restrict your test of the theory to three spectral lines of the Balmer Series. The chart on the wall
of the laboratory should be sufficient to verify the quantum nature of the expression for the
Balmer series and allow you to obtain an estimate of the hydrogen spectrum. You can also
verify the value of the Rydberg constant by explicit calculation using Equation 14.2.
The apparatus for this experiment consists of a telescope spectrometer with a diffraction
grating as its dispersive element, as in Figure 14.1. A diffraction grating is a planar device with
a certain number of parallel “grooves” per unit length. These grooves are separated by a
constant distance, d. The grating is situated on one side or face of a slab of glass. The grating
Name___________________________________ Date: ________________ Course number: _________________
MAKE SURE TA & TI STAMPS EVERY PAGE BEFORE YOU START
TA or TI Signature ___________________________________ 3 of 14
holder should specify the face upon which the grating has been placed. The grating will also be
labeled with the number of grooves per mm. This number is approximate only and the true
grating separation must be measured.
In Section 3.1 you will align your spectrometer so that the telescope and collimator are
focused properly on the slit image, and the grating is perfectly perpendicular to the optical path.
In Section 3.2 you will measure the groove separation of your particular grating by using a
known wavelength of the sodium spectrum. In Section 3.3 you will measure the angles of some
of the spectral lines of the Balmer series. These angles will be converted to wavelength using the
calibration value obtained in Section 3.2.
Series Name Wavelength
Range Series Expression
Lyman Ultraviolet 2,1
1
1122
n
nR
Balmer Near UV & Visible 3,1
2
1122
n
nR
Paschen Infrared 4,1
3
1122
n
nR
Brackett Infrared 5,1
4
1122
n
nR
Pfund Infrared 6,1
5
112
n
nR
Table 14. 1
3. Laboratory Work
3.1 Spectrometer Alignment
The spectrometer needs to be aligned to ensure accurate measurements of the sodium
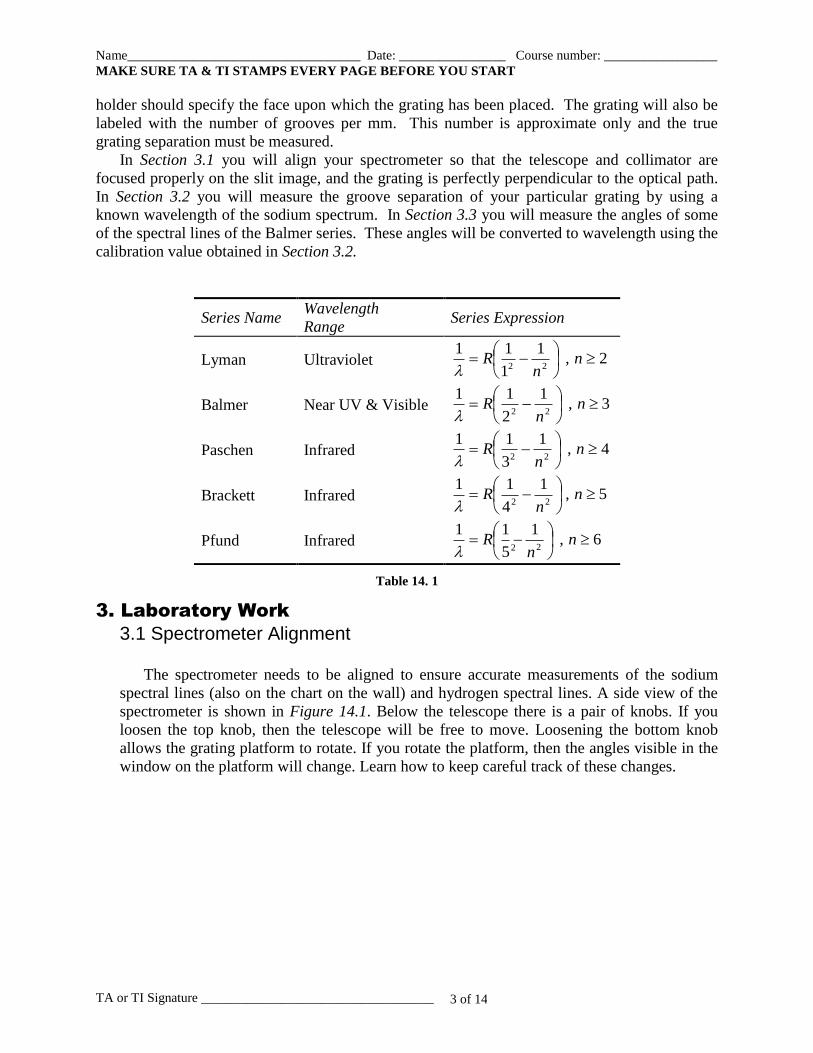
spectral lines (also on the chart on the wall) and hydrogen spectral lines. A side view of the
spectrometer is shown in Figure 14.1. Below the telescope there is a pair of knobs. If you
loosen the top knob, then the telescope will be free to move. Loosening the bottom knob
allows the grating platform to rotate. If you rotate the platform, then the angles visible in the
window on the platform will change. Learn how to keep careful track of these changes.
2
Name___________________________________ Date: ________________ Course number: _________________
MAKE SURE TA & TI STAMPS EVERY PAGE BEFORE YOU START
TA or TI Signature ___________________________________ 4 of 14
Procedure Setting up the Spectrometer
1. Turn on the sodium lamp and set it aside. (The sodium lamp is has a label that says “Na
Light Source” on the back near the switch.) It needs a few minutes to warm up. You will
know it is ready when the emitted light has a warm, yellow glow instead of a harsh
purple, glow.
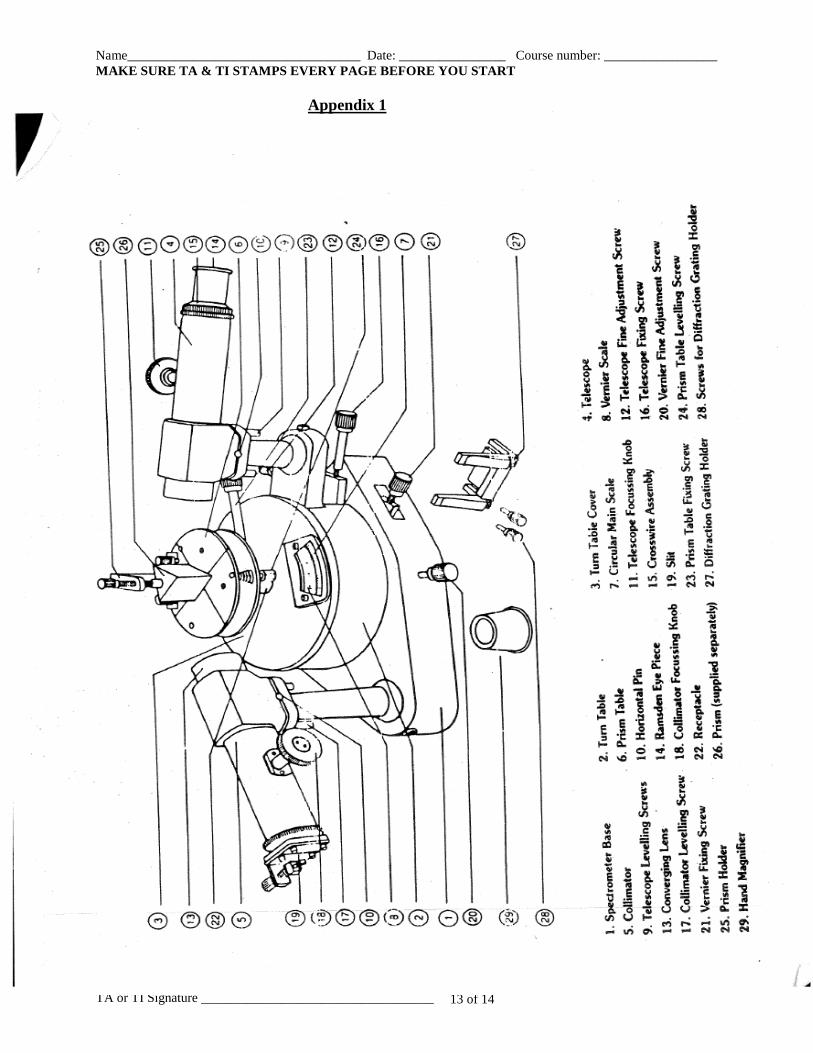
2. In the meantime, familiarize yourself with all of the controls on the spectrometer (listed
in Appendix 1 of this laboratory). Learn the effect of loosening and tightening each knob
as described in the paragraph above. By mastering the operation of the spectrometer
now, you will save yourself time and frustration were you to loosen or tighten something
incorrectly later.
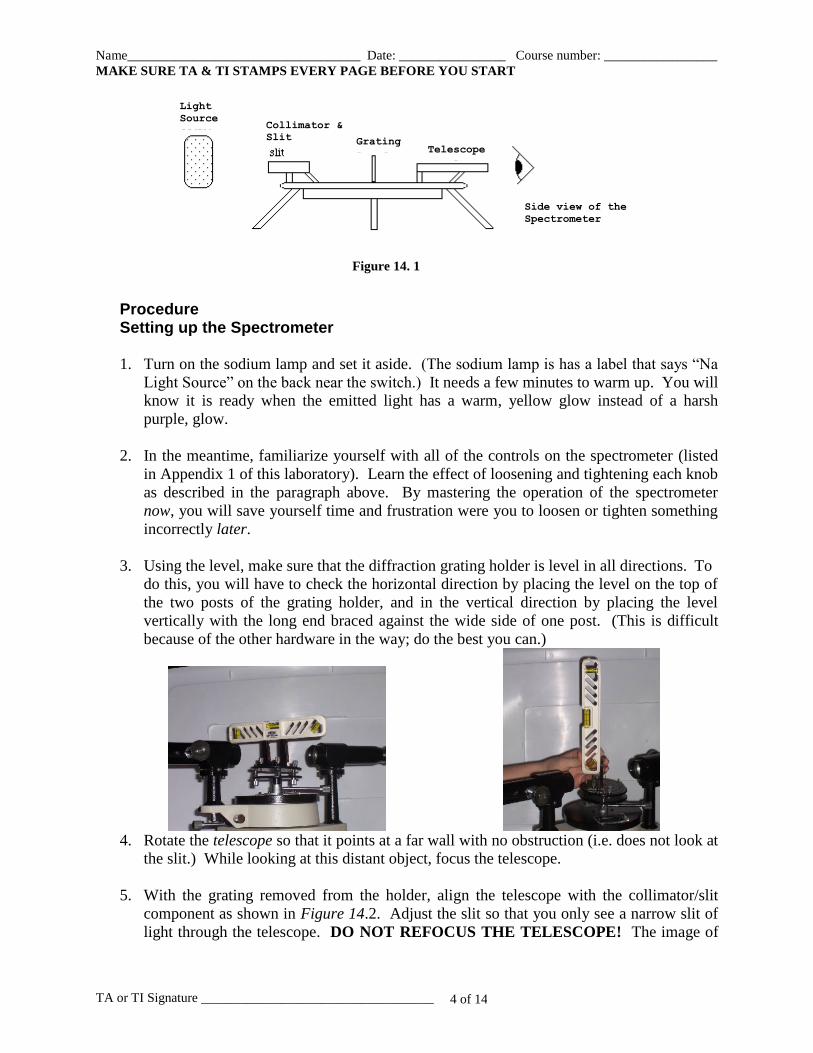
3. Using the level, make sure that the diffraction grating holder is level in all directions. To
do this, you will have to check the horizontal direction by placing the level on the top of
the two posts of the grating holder, and in the vertical direction by placing the level
vertically with the long end braced against the wide side of one post. (This is difficult
because of the other hardware in the way; do the best you can.)
4. Rotate the telescope so that it points at a far wall with no obstruction (i.e. does not look at
the slit.) While looking at this distant object, focus the telescope.
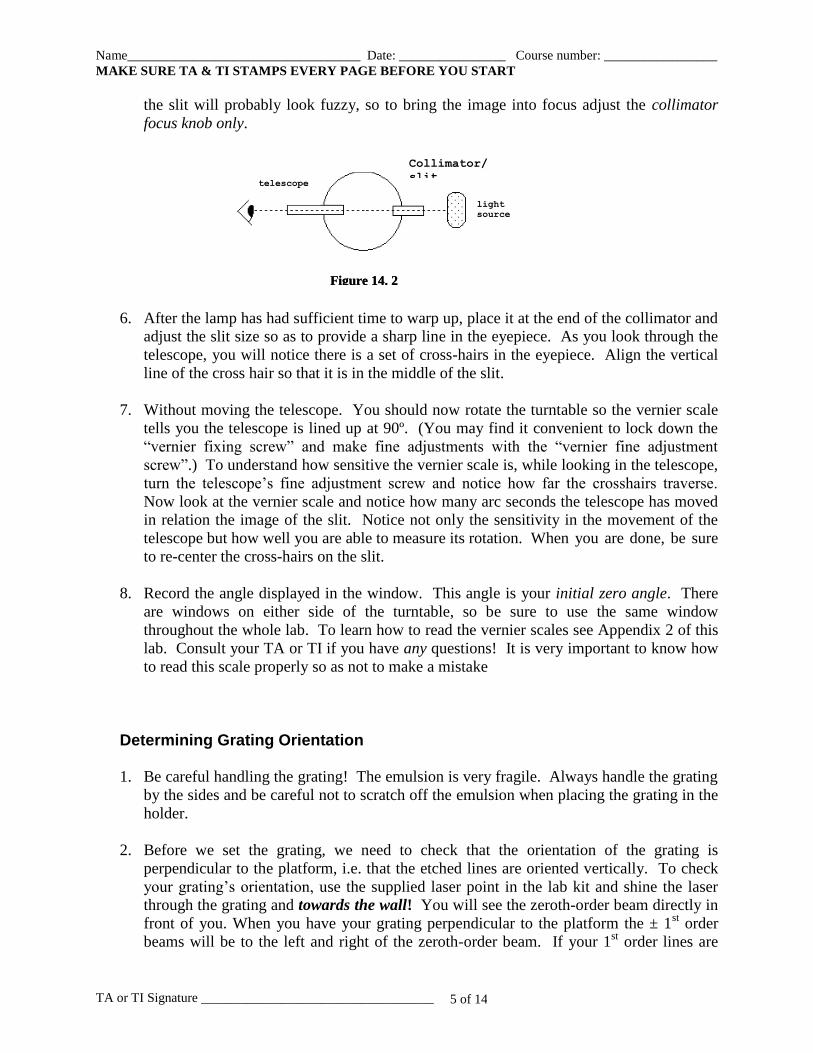
5. With the grating removed from the holder, align the telescope with the collimator/slit
component as shown in Figure 14.2. Adjust the slit so that you only see a narrow slit of
light through the telescope. DO NOT REFOCUS THE TELESCOPE! The image of
Figure 14. 1
Collimator &
Slit GratingTelescope
Side view of the
Spectrometer
Light
Source
Name___________________________________ Date: ________________ Course number: _________________
MAKE SURE TA & TI STAMPS EVERY PAGE BEFORE YOU START
TA or TI Signature ___________________________________ 5 of 14
the slit will probably look fuzzy, so to bring the image into focus adjust the collimator
focus knob only.
6. After the lamp has had sufficient time to warp up, place it at the end of the collimator and
adjust the slit size so as to provide a sharp line in the eyepiece. As you look through the
telescope, you will notice there is a set of cross-hairs in the eyepiece. Align the vertical
line of the cross hair so that it is in the middle of the slit.
7. Without moving the telescope. You should now rotate the turntable so the vernier scale
tells you the telescope is lined up at 90º. (You may find it convenient to lock down the
“vernier fixing screw” and make fine adjustments with the “vernier fine adjustment
screw”.) To understand how sensitive the vernier scale is, while looking in the telescope,
turn the telescope’s fine adjustment screw and notice how far the crosshairs traverse.
Now look at the vernier scale and notice how many arc seconds the telescope has moved
in relation the image of the slit. Notice not only the sensitivity in the movement of the
telescope but how well you are able to measure its rotation. When you are done, be sure
to re-center the cross-hairs on the slit.
8. Record the angle displayed in the window. This angle is your initial zero angle. There
are windows on either side of the turntable, so be sure to use the same window
throughout the whole lab. To learn how to read the vernier scales see Appendix 2 of this
lab. Consult your TA or TI if you have any questions! It is very important to know how
to read this scale properly so as not to make a mistake
Determining Grating Orientation
1. Be careful handling the grating! The emulsion is very fragile. Always handle the grating
by the sides and be careful not to scratch off the emulsion when placing the grating in the
holder.
2. Before we set the grating, we need to check that the orientation of the grating is
perpendicular to the platform, i.e. that the etched lines are oriented vertically. To check
your grating’s orientation, use the supplied laser point in the lab kit and shine the laser
through the grating and towards the wall! You will see the zeroth-order beam directly in
front of you. When you have your grating perpendicular to the platform the ± 1st order
beams will be to the left and right of the zeroth-order beam. If your 1st order lines are
telesco
pe
collimator/
slit
ligh
t
sour
ce Figure 14. 2
telescope
Collimator/
slit
light
source
Figure 14. 2
Name___________________________________ Date: ________________ Course number: _________________
MAKE SURE TA & TI STAMPS EVERY PAGE BEFORE YOU START
TA or TI Signature ___________________________________ 6 of 14
above and below your zeroth-order beam, then you need to rotate your grating 90
degrees. If you have any questions ask your TA or TI for assistance for this is a crucial
step!
3. Place the grating back into the grating holder with the emulsion side of the grating facing
the Na lamp and the grating lines perpendicular to the platform. Record the number of
lines/mm of your grating in Section 4.
Aligning the Grating
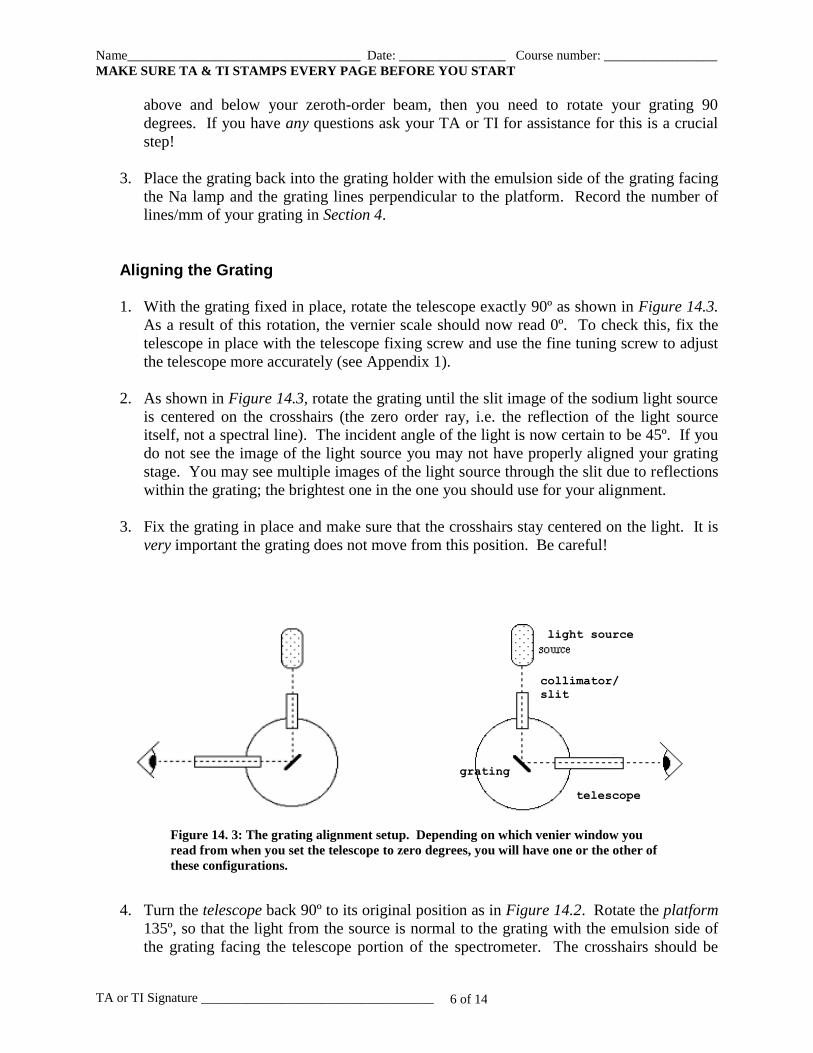
1. With the grating fixed in place, rotate the telescope exactly 90º as shown in Figure 14.3.
As a result of this rotation, the vernier scale should now read 0º. To check this, fix the
telescope in place with the telescope fixing screw and use the fine tuning screw to adjust
the telescope more accurately (see Appendix 1).
2. As shown in Figure 14.3, rotate the grating until the slit image of the sodium light source
is centered on the crosshairs (the zero order ray, i.e. the reflection of the light source
itself, not a spectral line). The incident angle of the light is now certain to be 45º. If you
do not see the image of the light source you may not have properly aligned your grating
stage. You may see multiple images of the light source through the slit due to reflections
within the grating; the brightest one in the one you should use for your alignment.
3. Fix the grating in place and make sure that the crosshairs stay centered on the light. It is
very important the grating does not move from this position. Be careful!
4. Turn the telescope back 90º to its original position as in Figure 14.2. Rotate the platform
135º, so that the light from the source is normal to the grating with the emulsion side of
the grating facing the telescope portion of the spectrometer. The crosshairs should be
telescope
collimator/
slit
light source
grating
Figure 14. 3: The grating alignment setup. Depending on which venier window you
read from when you set the telescope to zero degrees, you will have one or the other of
these configurations.
Name___________________________________ Date: ________________ Course number: _________________
MAKE SURE TA & TI STAMPS EVERY PAGE BEFORE YOU START
TA or TI Signature ___________________________________ 7 of 14
centered on the slit. Record the final zero angle, if different. You will be using this final
zero angle in all subsequent measurements with the spectrometer, as you will be
subtracting it from your measured values of angle for all spectral lines.
3.2 Spectrometer Calibration
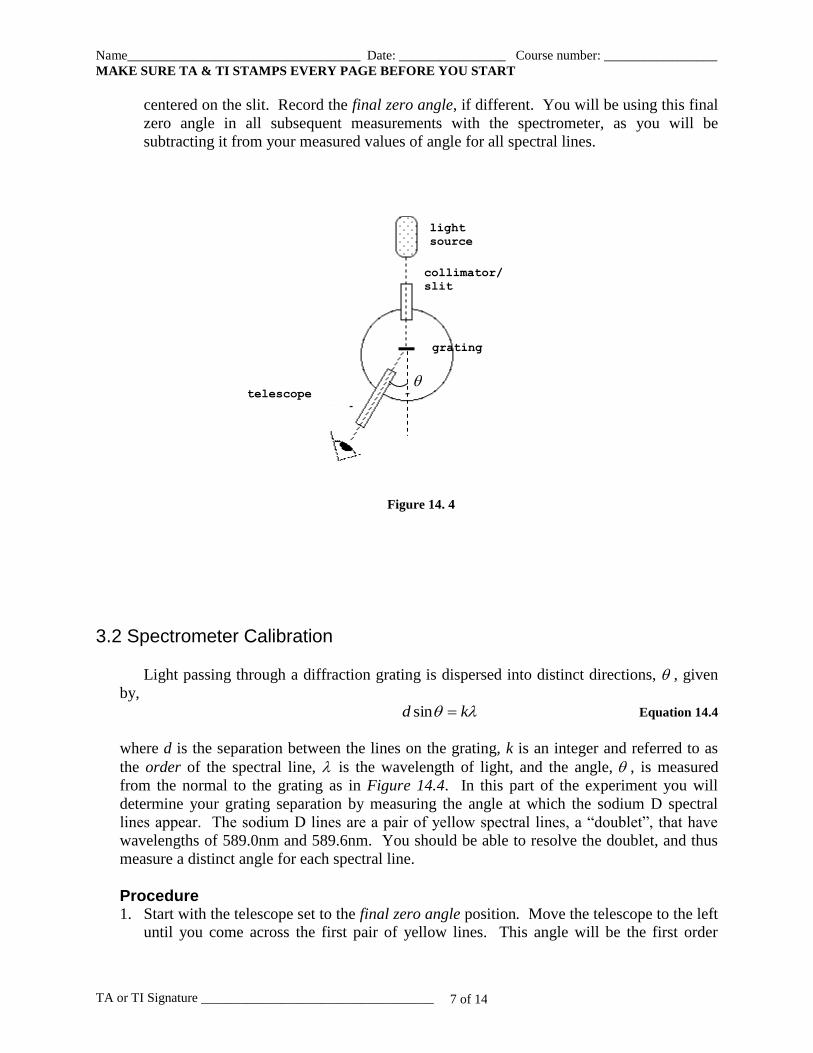
Light passing through a diffraction grating is dispersed into distinct directions, , given
by,
kd sin Equation 14.4
where d is the separation between the lines on the grating, k is an integer and referred to as
the order of the spectral line, is the wavelength of light, and the angle, , is measured
from the normal to the grating as in Figure 14.4. In this part of the experiment you will
determine your grating separation by measuring the angle at which the sodium D spectral
lines appear. The sodium D lines are a pair of yellow spectral lines, a “doublet”, that have
wavelengths of 589.0nm and 589.6nm. You should be able to resolve the doublet, and thus
measure a distinct angle for each spectral line.
Procedure 1. Start with the telescope set to the final zero angle position. Move the telescope to the left
until you come across the first pair of yellow lines. This angle will be the first order
telescope
collimator/
slit
light
source
grating
Figure 14. 4
Name___________________________________ Date: ________________ Course number: _________________
MAKE SURE TA & TI STAMPS EVERY PAGE BEFORE YOU START
TA or TI Signature ___________________________________ 8 of 14
spectrum value (k = 1). Record the angles of the two lines in the doublet in Table 14.2.
(If you are having difficulty resolving the doublet, it might be because your light source
is too close to the slit giving lines that are too bright. Try moving the lamp further from
the slit.)
2. Now measure the first order position(s) in the opposite direction (the right side). Record
this angle(s) in Table 14.2. You should now be able to determine the grating spacing of
your particular grating, using Equation 14.4 and the average first order angle(s) of the
sodium line(s). You do not need to measure the second order lines (k = 2).
3. In filling out Table 14.2, the Measured Angle is the number read from the vernier scale,
the Difference Angle is the positive angle difference of the final zero angle and the
Measured Angle, and the Average Angle is the average of the two Difference Angles.
Average Angle is the value you use to calculate the grating separation according to
Equation 14.4.
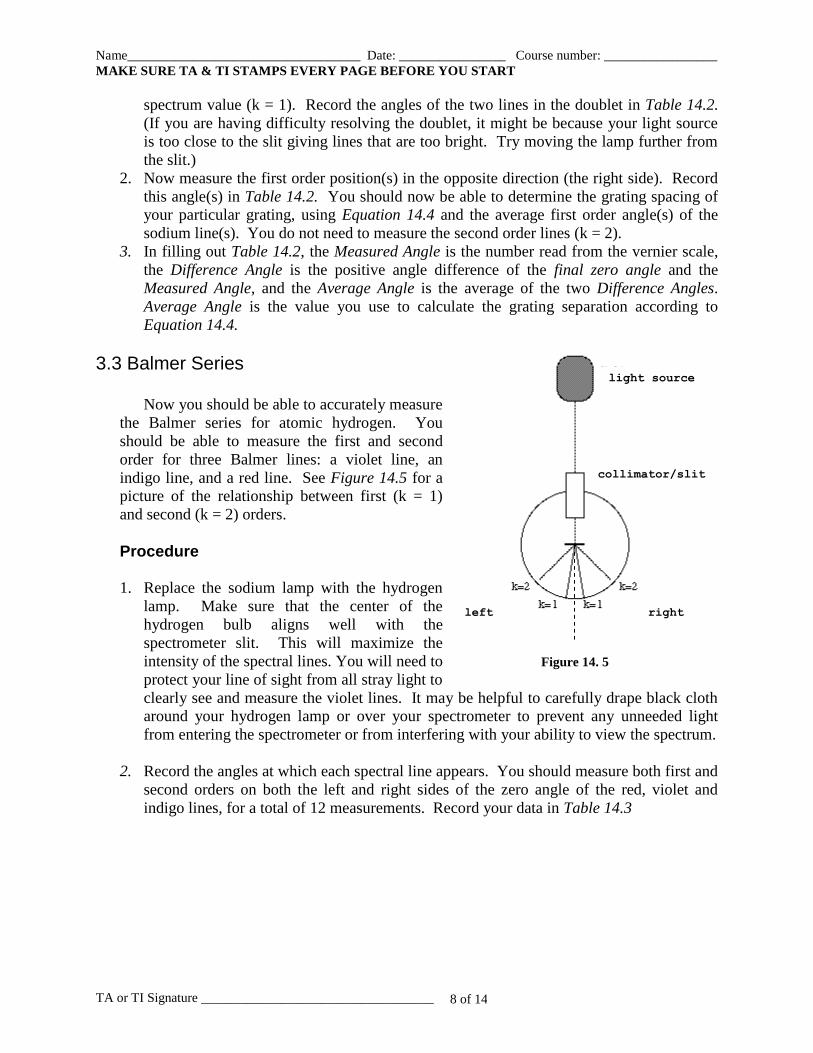
3.3 Balmer Series Now you should be able to accurately measure
the Balmer series for atomic hydrogen. You
should be able to measure the first and second
order for three Balmer lines: a violet line, an
indigo line, and a red line. See Figure 14.5 for a
picture of the relationship between first (k = 1)
and second (k = 2) orders.
Procedure 1. Replace the sodium lamp with the hydrogen
lamp. Make sure that the center of the
hydrogen bulb aligns well with the
spectrometer slit. This will maximize the
intensity of the spectral lines. You will need to
protect your line of sight from all stray light to
clearly see and measure the violet lines. It may be helpful to carefully drape black cloth
around your hydrogen lamp or over your spectrometer to prevent any unneeded light
from entering the spectrometer or from interfering with your ability to view the spectrum.
2. Record the angles at which each spectral line appears. You should measure both first and
second orders on both the left and right sides of the zero angle of the red, violet and
indigo lines, for a total of 12 measurements. Record your data in Table 14.3
light source
collimator/slit
left right
Figure 14. 5
Name___________________________________ Date: ________________ Course number: _________________
MAKE SURE TA & TI STAMPS EVERY PAGE BEFORE YOU START
TA or TI Signature ___________________________________ 9 of 14
Last Revised on September 21, 2016
EXPERIMENT 14 The Atomic Spectrum of Hydrogen
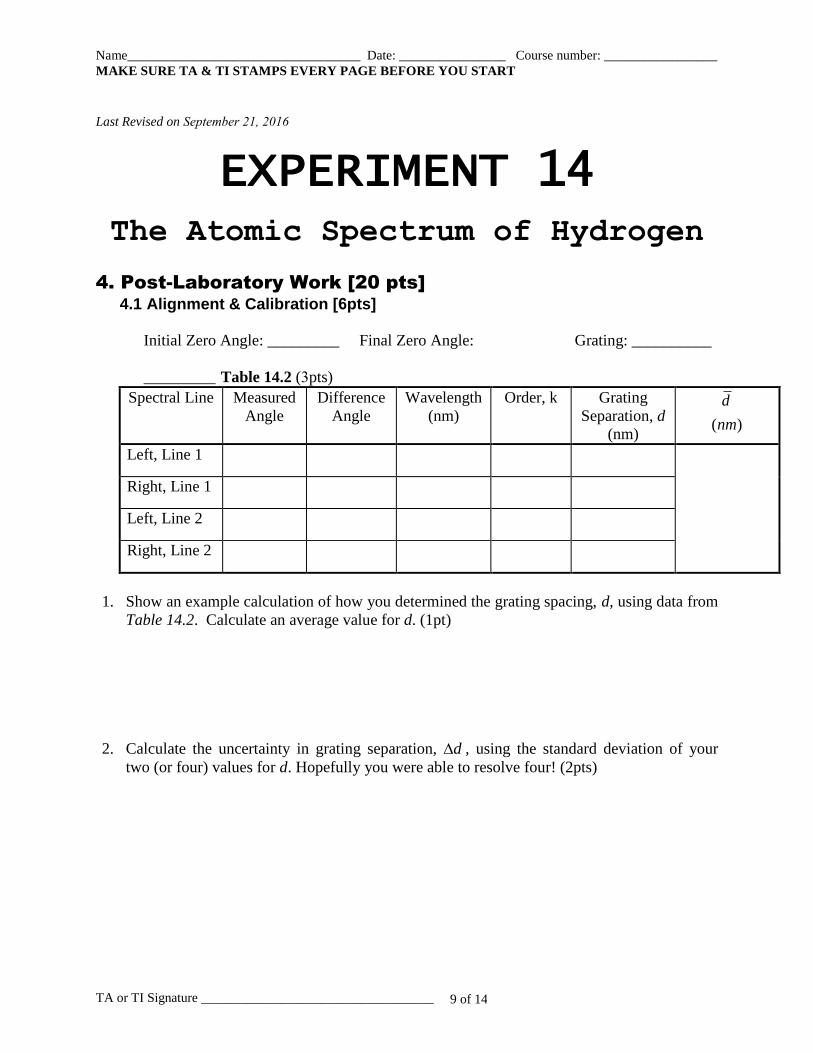
4. Post-Laboratory Work [20 pts]
4.1 Alignment & Calibration [6pts]
Grating: __________ Initial Zero Angle: _________ Final Zero Angle:
_________ Table 14.2 (3pts)
Spectral Line Measured
Angle
Difference
Angle
Wavelength
(nm)
Order, k Grating
Separation, d
(nm) )(nm
d
Left, Line 1
Right, Line 1
Left, Line 2
Right, Line 2
1. Show an example calculation of how you determined the grating spacing, d, using data from
Table 14.2. Calculate an average value for d. (1pt)
2. Calculate the uncertainty in grating separation, d , using the standard deviation of your
two (or four) values for d. Hopefully you were able to resolve four! (2pts)
TA or TI Signature ___________________________________ 10 of 14
Name___________________________________ Date: ________________ Course number: _________________
MAKE SURE TA & TI STAMPS EVERY PAGE BEFORE YOU START
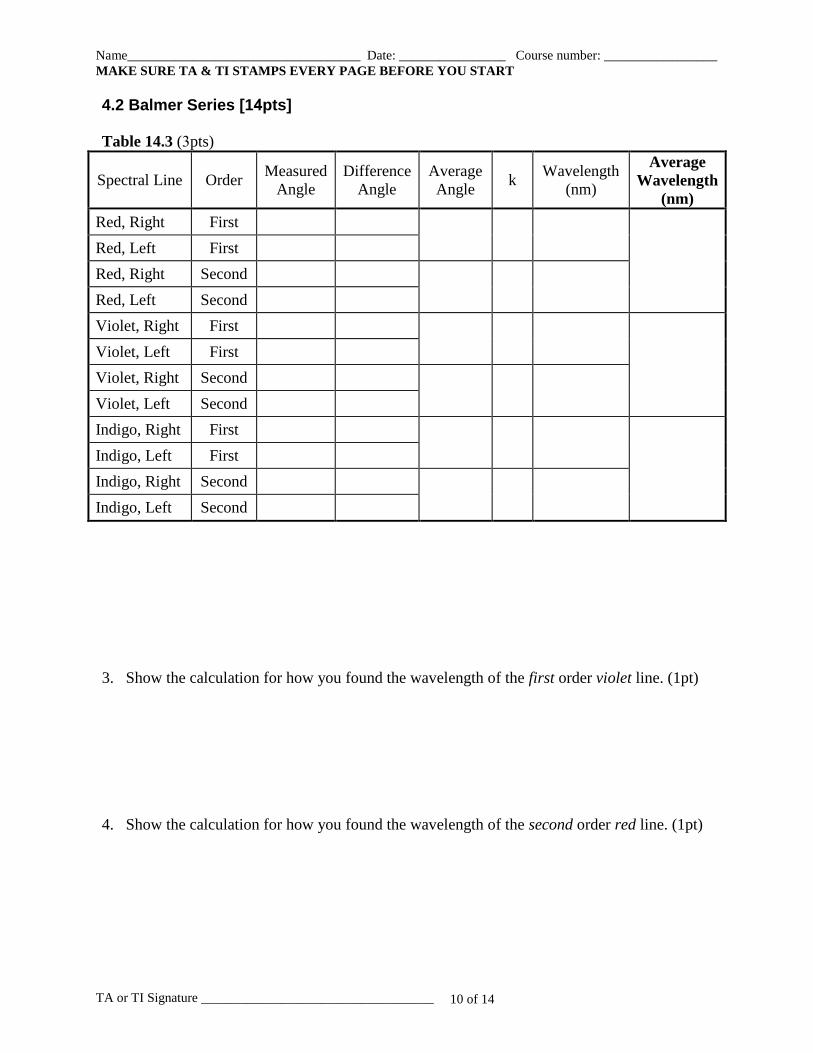
4.2 Balmer Series [14pts]
Table 14.3 (3pts)
Spectral Line Order Measured
Angle
Difference
Angle
Average
Angle k
Wavelength
(nm)
Average
Wavelength
(nm)
Red, Right First
Red, Left First
Red, Right Second
Red, Left Second
Violet, Right First
Violet, Left First
Violet, Right Second
Violet, Left Second
Indigo, Right First
Indigo, Left First
Indigo, Right Second
Indigo, Left Second
3. Show the calculation for how you found the wavelength of the first order violet line. (1pt)
4. Show the calculation for how you found the wavelength of the second order red line. (1pt)
Name___________________________________ Date: ________________ Course number: _________________
MAKE SURE TA & TI STAMPS EVERY PAGE BEFORE YOU START
TA or TI Signature ___________________________________ 11 of 14
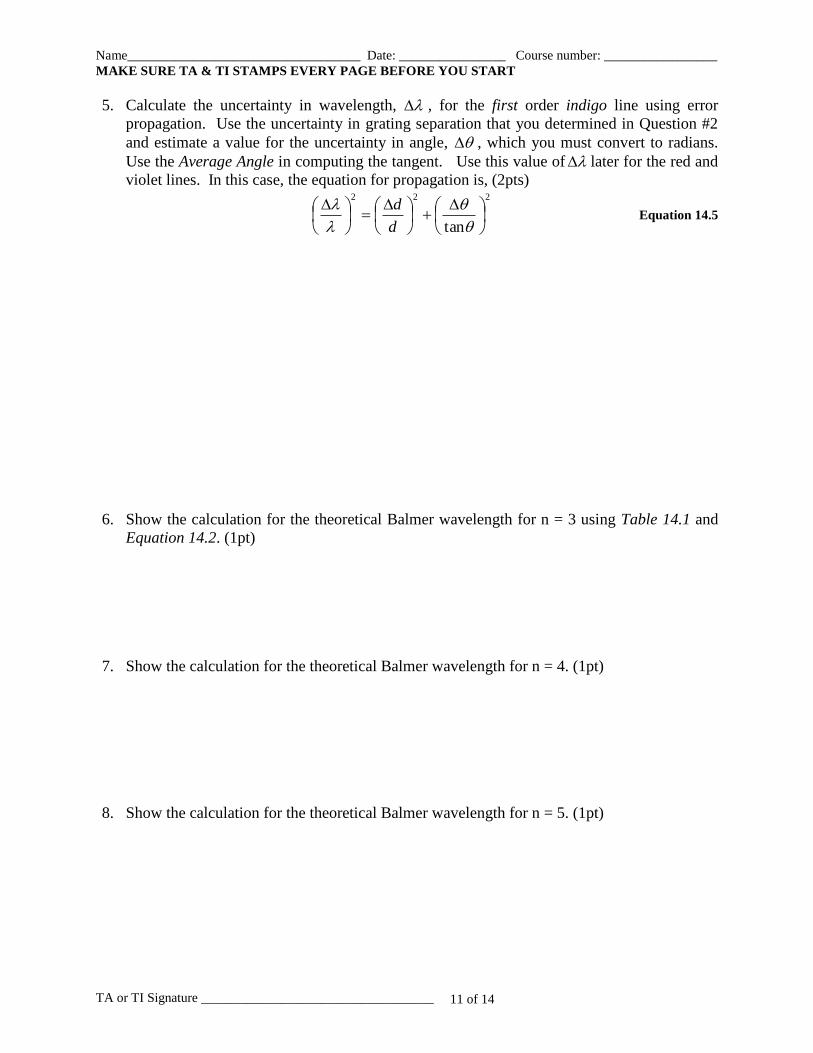
5. Calculate the uncertainty in wavelength, , for the first order indigo line using error
propagation. Use the uncertainty in grating separation that you determined in Question #2
and estimate a value for the uncertainty in angle, , which you must convert to radians.
Use the Average Angle in computing the tangent. Use this value of later for the red and
violet lines. In this case, the equation for propagation is, (2pts)222
tan
d
dEquation 14.5
6. Show the calculation for the theoretical Balmer wavelength for n = 3 using Table 14.1 and
Equation 14.2. (1pt)
7. Show the calculation for the theoretical Balmer wavelength for n = 4. (1pt)
8. Show the calculation for the theoretical Balmer wavelength for n = 5. (1pt)
Name___________________________________ Date: ________________ Course number: _________________
MAKE SURE TA & TI STAMPS EVERY PAGE BEFORE YOU START
TA or TI Signature ___________________________________ 12 of 14
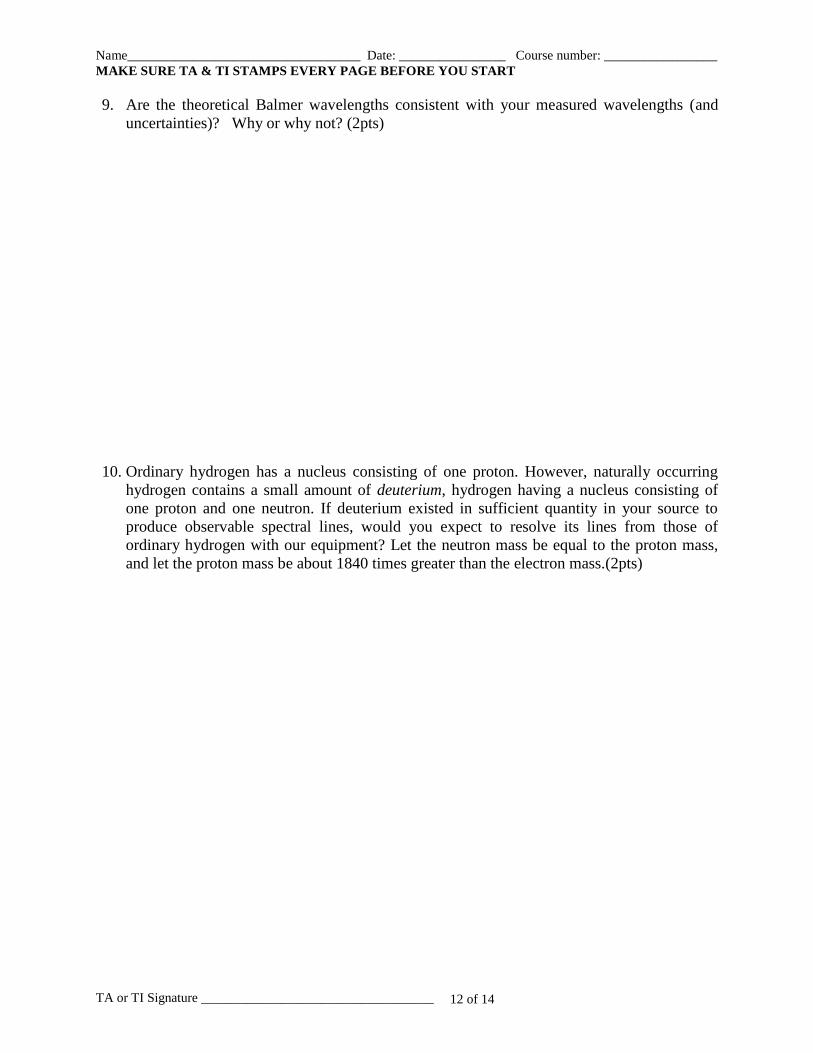
9. Are the theoretical Balmer wavelengths consistent with your measured wavelengths (and
uncertainties)? Why or why not? (2pts)
10. Ordinary hydrogen has a nucleus consisting of one proton. However, naturally occurring
hydrogen contains a small amount of deuterium, hydrogen having a nucleus consisting of
one proton and one neutron. If deuterium existed in sufficient quantity in your source to
produce observable spectral lines, would you expect to resolve its lines from those of
ordinary hydrogen with our equipment? Let the neutron mass be equal to the proton mass,
and let the proton mass be about 1840 times greater than the electron mass.(2pts)
Name___________________________________ Date: ________________ Course number: _________________
MAKE SURE TA & TI STAMPS EVERY PAGE BEFORE YOU START
TA or TI Signature ___________________________________ 13 of 14
Appendix 1
Name___________________________________ Date: ________________ Course number: _________________
MAKE SURE TA & TI STAMPS EVERY PAGE BEFORE YOU START
TA or TI Signature ___________________________________ 14 of 14
Appendix 2
3
012-02135G Student Spectrometer
®
Equipment Setup
Leveling the Spectrometer
For accurate results, the diffracting element must be prop-erly aligned with the optical axes of the telescope and col-limator. This requires that both the spectrometer and thespectrometer table be level.
1. Place the spectrometer on a flat surface. If necessaryuse paper or 3 X 5 cards to shim beneath the woodbase until the fixed-base of the spectrometer is level.
2. Level the spectrometer table by adjusting the threethumbscrews on the underside of the table.
Focusing the Spectrometer
1. While looking through the telescope, slide the eye-piece in and out until the cross-hairs come into sharpfocus. Loosen the graticule lock ring, and rotate thegraticule until one of the cross-hairs is vertical. Re-tighten the lock ring and then refocus if necessary.
2. Focus the telescope at infinity. This is best accom-plished by focusing on a distant object (e.g.; out thewindow).
3. Check that the collimator slit is partially open (usethe slit width adjust screw).
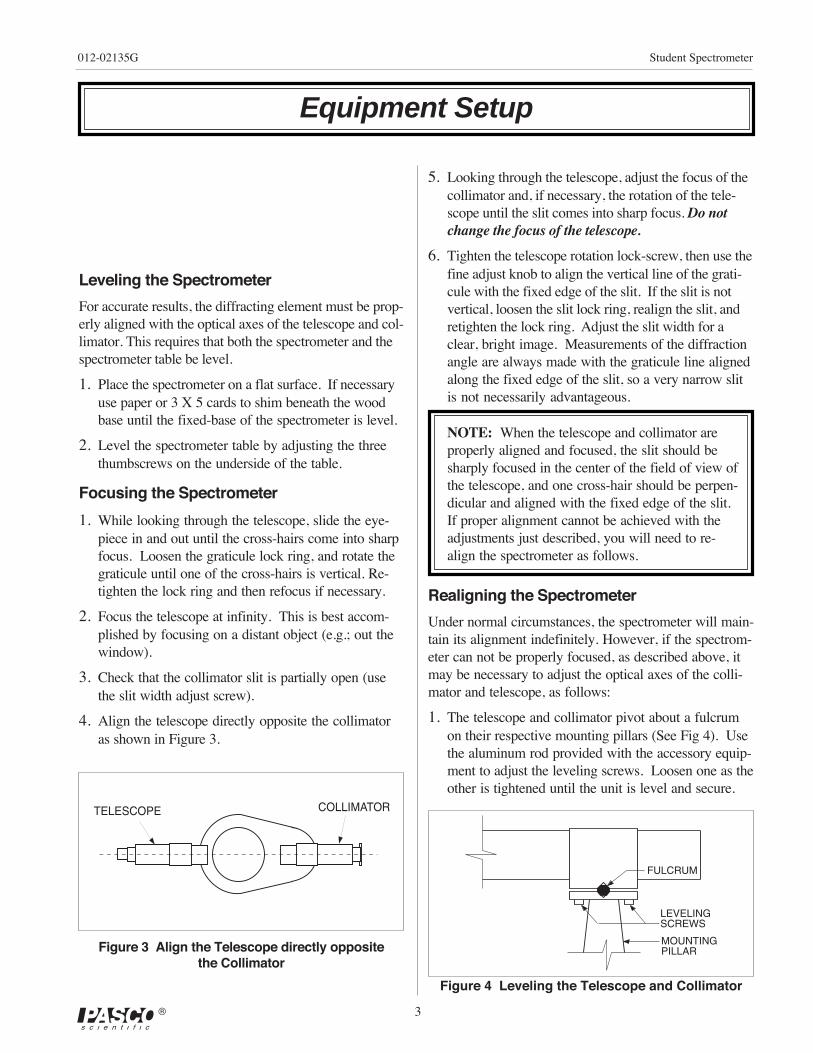
4. Align the telescope directly opposite the collimatoras shown in Figure 3.
5. Looking through the telescope, adjust the focus of thecollimator and, if necessary, the rotation of the tele-scope until the slit comes into sharp focus. Do notchange the focus of the telescope.
6. Tighten the telescope rotation lock-screw, then use thefine adjust knob to align the vertical line of the grati-cule with the fixed edge of the slit. If the slit is notvertical, loosen the slit lock ring, realign the slit, andretighten the lock ring. Adjust the slit width for aclear, bright image. Measurements of the diffractionangle are always made with the graticule line alignedalong the fixed edge of the slit, so a very narrow slitis not necessarily advantageous.
NOTE: When the telescope and collimator areproperly aligned and focused, the slit should besharply focused in the center of the field of view ofthe telescope, and one cross-hair should be perpen-dicular and aligned with the fixed edge of the slit.If proper alignment cannot be achieved with theadjustments just described, you will need to re-align the spectrometer as follows.
Realigning the Spectrometer
Under normal circumstances, the spectrometer will main-tain its alignment indefinitely. However, if the spectrom-eter can not be properly focused, as described above, itmay be necessary to adjust the optical axes of the colli-mator and telescope, as follows:
1. The telescope and collimator pivot about a fulcrumon their respective mounting pillars (See Fig 4). Usethe aluminum rod provided with the accessory equip-ment to adjust the leveling screws. Loosen one as theother is tightened until the unit is level and secure.
������������
�����
������������
Figure 4 Leveling the Telescope and Collimator
Figure 3 Align the Telescope directly oppositethe Collimator
����� ������������
4
Student Spectrometer 012-02135G
®
2. The mounting pillars of the telescope and collimatorcan be rotated by using an Allen wrench to loosen thescrews that attach the pillars to their respective bases.To loosen the screw for the collimator, the spec-trometer must be removed from the wood base.
3. To be sure both optical units are square to the axis ofrotation, follow the focusing procedure describedabove, adjusting the mounting pillars as necessary sothe slit image is well centered in the viewing field ofthe telescope.
Measuring Angles of Diffraction
When analyzing a light source, angles of diffraction aremeasured using the vernier scales. However, the scalesonly measure the relative rotational positions of the tele-scope and the spectrometer table base. Therefore, beforemaking a measurement, it's important to establish a ver-nier reading for the undeflected beam. All angles of dif-fraction are then made with respect to that initial reading(see Fig 5).
To obtain a vernier reading for the undeflected beam,first align the vertical cross-hair with the fixed edge ofthe slit image for the undeflected beam. Then read thevernier scale. This is the zero point reading (θθθθθ0
).
Now rotate the telescope to align the vertical cross-hairwith the fixed edge of a deflected image. Read the ver-nier scale again. If this second reading is θθθθθ, then the ac-tual angle of diffraction is θθθθθ – θθθθθ0
. If the table base is ro-tated for some reason, the zero point changes, and mustbe remeasured.
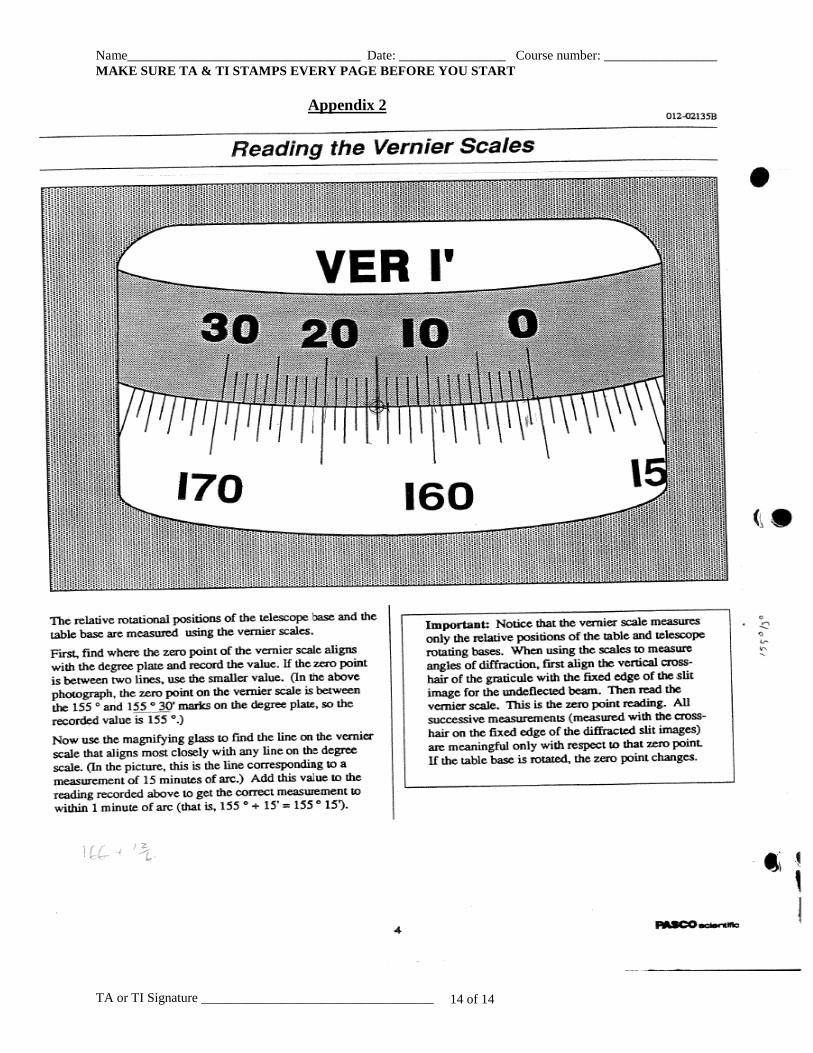
Reading the Vernier Scales
To read the angle, first findwhere the zero point of thevernier scale aligns withthe degree plate and recordthe value. If the zero pointis between two lines, usethe smaller value. In Fig-ure 6, below, the zeropoint on the vernier scale is between the 155 ° and 155 °30' marks on the degree plate, so the recorded value is155 °.
Now use the magnifying glass to find the line on the ver-nier scale that aligns most closely with any line on thedegree scale. In the figure, this is the line correspondingto a measurement of 15 minutes of arc. Add this value tothe reading recorded above to get the correct measure-ment to within 1 minute of arc: that is, 155 ° + 15' = 155 °15'.�����
����
� ��������������
�� ������ ����� ������������
��
�� ������� �����������������
�
� ����
�
�
�� ��������
Figure 5 Measuring an Angle of Diffraction
Figure 6 Reading the Vernier Scales
����������� �
�� ��� ��
��������������� !���"#$%�&��'���������(�!�)�!�"#$%�&
�����*���'����������'
5
012-02135G Student Spectrometer
®
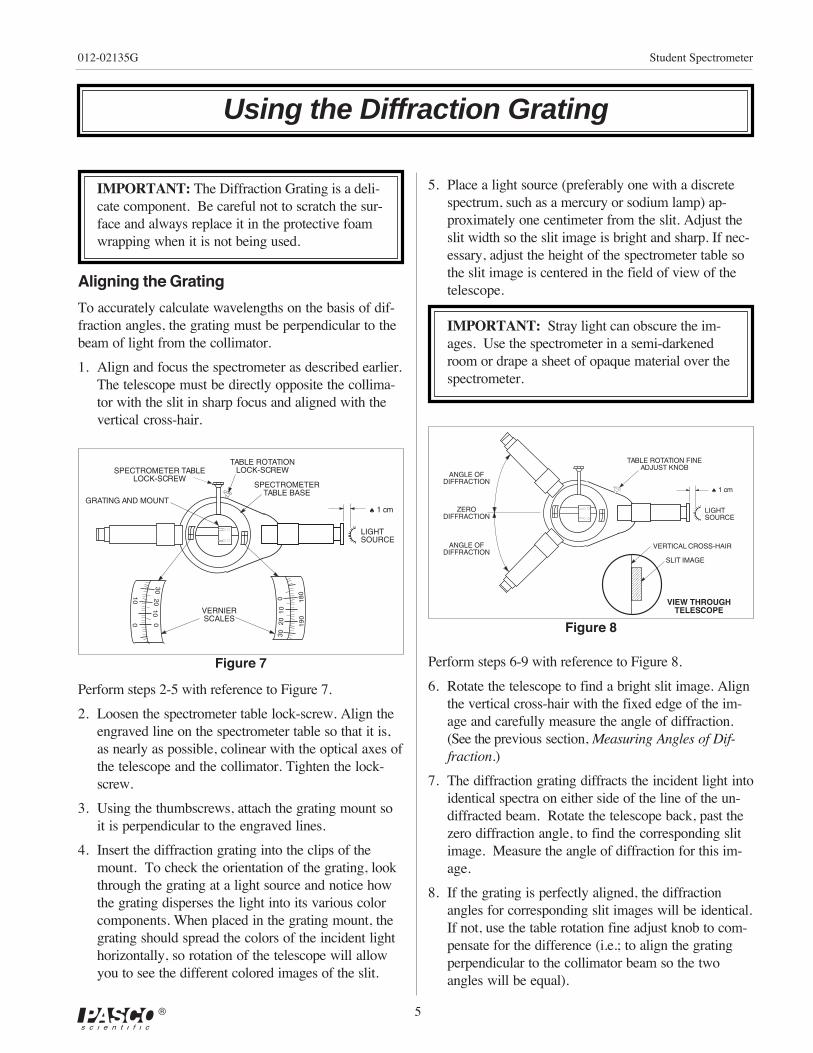
Using the Diffraction Grating
IMPORTANT: The Diffraction Grating is a deli-cate component. Be careful not to scratch the sur-face and always replace it in the protective foamwrapping when it is not being used.
Aligning the Grating
To accurately calculate wavelengths on the basis of dif-fraction angles, the grating must be perpendicular to thebeam of light from the collimator.
1. Align and focus the spectrometer as described earlier.The telescope must be directly opposite the collima-tor with the slit in sharp focus and aligned with thevertical cross-hair.
Figure 7
Perform steps 2-5 with reference to Figure 7.
2. Loosen the spectrometer table lock-screw. Align theengraved line on the spectrometer table so that it is,as nearly as possible, colinear with the optical axes ofthe telescope and the collimator. Tighten the lock-screw.
3. Using the thumbscrews, attach the grating mount soit is perpendicular to the engraved lines.
4. Insert the diffraction grating into the clips of themount. To check the orientation of the grating, lookthrough the grating at a light source and notice howthe grating disperses the light into its various colorcomponents. When placed in the grating mount, thegrating should spread the colors of the incident lighthorizontally, so rotation of the telescope will allowyou to see the different colored images of the slit.
5. Place a light source (preferably one with a discretespectrum, such as a mercury or sodium lamp) ap-proximately one centimeter from the slit. Adjust theslit width so the slit image is bright and sharp. If nec-essary, adjust the height of the spectrometer table sothe slit image is centered in the field of view of thetelescope.
IMPORTANT: Stray light can obscure the im-ages. Use the spectrometer in a semi-darkenedroom or drape a sheet of opaque material over thespectrometer.
���������
�� �����������������
������
��� ��
����
����
���
����
���
����������������
����������� ��� ���
������������ ���������
����������
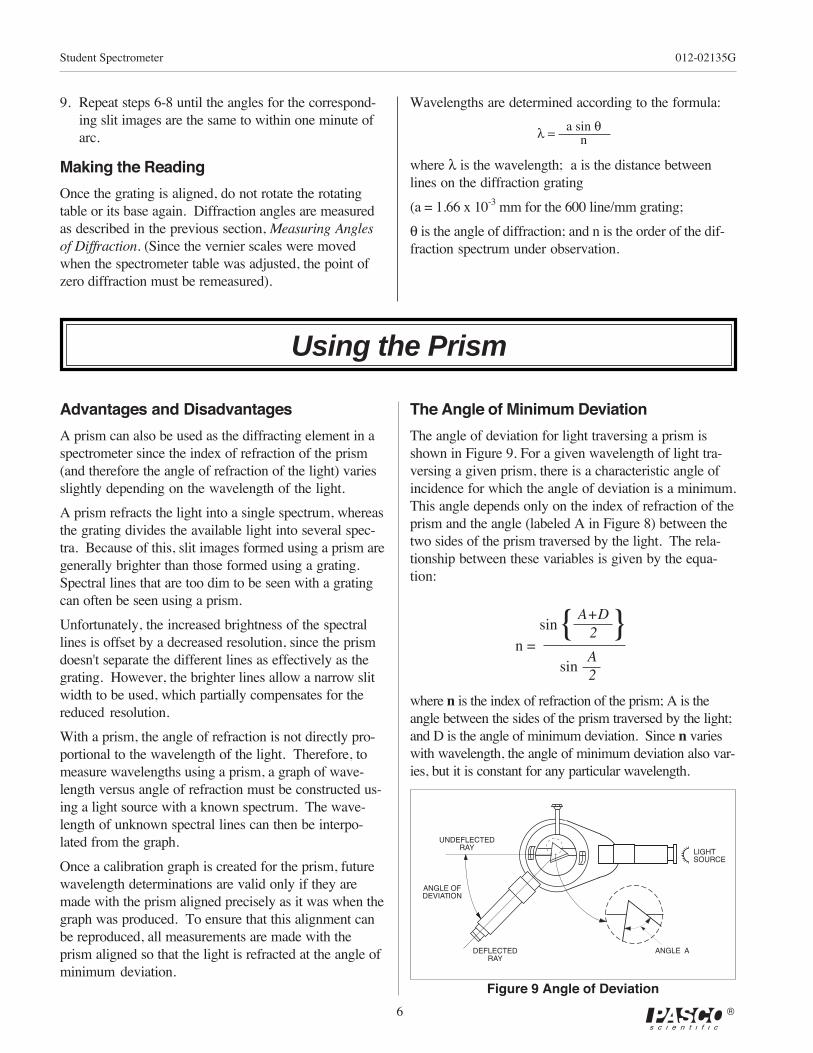
Figure 8
���������
������
�����������������
�����������
�����������������
����������
��������������
�������������� ���
�� �����������������!�������
Perform steps 6-9 with reference to Figure 8.
6. Rotate the telescope to find a bright slit image. Alignthe vertical cross-hair with the fixed edge of the im-age and carefully measure the angle of diffraction.(See the previous section, Measuring Angles of Dif-fraction.)
7. The diffraction grating diffracts the incident light intoidentical spectra on either side of the line of the un-diffracted beam. Rotate the telescope back, past thezero diffraction angle, to find the corresponding slitimage. Measure the angle of diffraction for this im-age.
8. If the grating is perfectly aligned, the diffractionangles for corresponding slit images will be identical.If not, use the table rotation fine adjust knob to com-pensate for the difference (i.e.; to align the gratingperpendicular to the collimator beam so the twoangles will be equal).
6
Student Spectrometer 012-02135G
®
9. Repeat steps 6-8 until the angles for the correspond-ing slit images are the same to within one minute ofarc.
Making the Reading
Once the grating is aligned, do not rotate the rotatingtable or its base again. Diffraction angles are measuredas described in the previous section, Measuring Anglesof Diffraction. (Since the vernier scales were movedwhen the spectrometer table was adjusted, the point ofzero diffraction must be remeasured).
Wavelengths are determined according to the formula:
��� ��������
where λ is the wavelength; a is the distance betweenlines on the diffraction grating
(a = 1.66 x 10⁻³ mm for the 600 line/mm grating;
θ is the angle of diffraction; and n is the order of the dif-fraction spectrum under observation.
Using the Prism
Advantages and Disadvantages
A prism can also be used as the diffracting element in aspectrometer since the index of refraction of the prism(and therefore the angle of refraction of the light) variesslightly depending on the wavelength of the light.
A prism refracts the light into a single spectrum, whereasthe grating divides the available light into several spec-tra. Because of this, slit images formed using a prism aregenerally brighter than those formed using a grating.Spectral lines that are too dim to be seen with a gratingcan often be seen using a prism.
Unfortunately, the increased brightness of the spectrallines is offset by a decreased resolution, since the prismdoesn't separate the different lines as effectively as thegrating. However, the brighter lines allow a narrow slitwidth to be used, which partially compensates for thereduced resolution.
With a prism, the angle of refraction is not directly pro-portional to the wavelength of the light. Therefore, tomeasure wavelengths using a prism, a graph of wave-length versus angle of refraction must be constructed us-ing a light source with a known spectrum. The wave-length of unknown spectral lines can then be interpo-lated from the graph.
Once a calibration graph is created for the prism, futurewavelength determinations are valid only if they aremade with the prism aligned precisely as it was when thegraph was produced. To ensure that this alignment canbe reproduced, all measurements are made with theprism aligned so that the light is refracted at the angle ofminimum deviation.
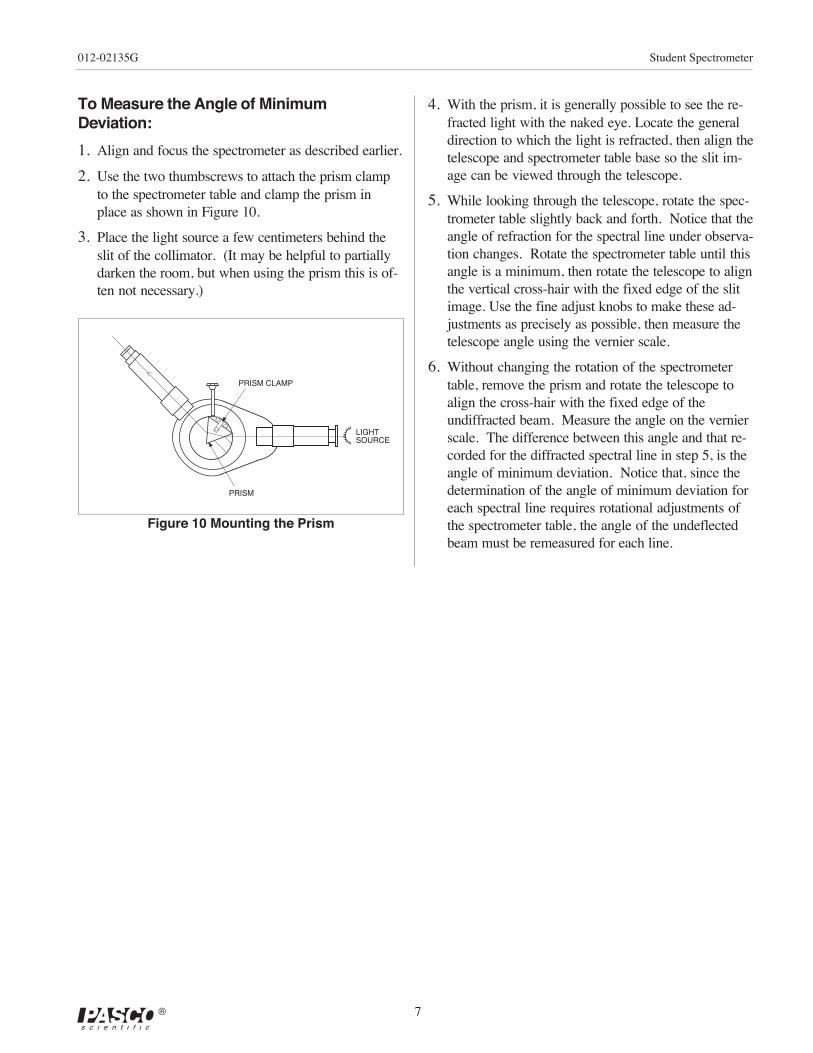
The Angle of Minimum Deviation
The angle of deviation for light traversing a prism isshown in Figure 9. For a given wavelength of light tra-versing a given prism, there is a characteristic angle ofincidence for which the angle of deviation is a minimum.This angle depends only on the index of refraction of theprism and the angle (labeled A in Figure 8) between thetwo sides of the prism traversed by the light. The rela-tionship between these variables is given by the equa-tion:
������
����������
�����
where n is the index of refraction of the prism; A is theangle between the sides of the prism traversed by the light;and D is the angle of minimum deviation. Since n varieswith wavelength, the angle of minimum deviation also var-ies, but it is constant for any particular wavelength.
���������
�� ������ ��
������ ��
�������� ��������
��������
Figure 9 Angle of Deviation
7
012-02135G Student Spectrometer
®
To Measure the Angle of MinimumDeviation:
1. Align and focus the spectrometer as described earlier.
2. Use the two thumbscrews to attach the prism clampto the spectrometer table and clamp the prism inplace as shown in Figure 10.
3. Place the light source a few centimeters behind theslit of the collimator. (It may be helpful to partiallydarken the room, but when using the prism this is of-ten not necessary.)
4. With the prism, it is generally possible to see the re-fracted light with the naked eye. Locate the generaldirection to which the light is refracted, then align thetelescope and spectrometer table base so the slit im-age can be viewed through the telescope.
5. While looking through the telescope, rotate the spec-trometer table slightly back and forth. Notice that theangle of refraction for the spectral line under observa-tion changes. Rotate the spectrometer table until thisangle is a minimum, then rotate the telescope to alignthe vertical cross-hair with the fixed edge of the slitimage. Use the fine adjust knobs to make these ad-justments as precisely as possible, then measure thetelescope angle using the vernier scale.
6. Without changing the rotation of the spectrometertable, remove the prism and rotate the telescope toalign the cross-hair with the fixed edge of theundiffracted beam. Measure the angle on the vernierscale. The difference between this angle and that re-corded for the diffracted spectral line in step 5, is theangle of minimum deviation. Notice that, since thedetermination of the angle of minimum deviation foreach spectral line requires rotational adjustments ofthe spectrometer table, the angle of the undeflectedbeam must be remeasured for each line.
���������
��� ��� �
���
Figure 10 Mounting the Prism


![The Atomic Hydrogen Maser By NORMAN F. RAMSEY · 8 N ORMAN F. RAMSEY: The Atomic Hydrogen Maser Metrologia published [4, 9 -12] and a detailed analysis of the theory. of the hydrogen](https://static.fdocuments.in/doc/165x107/5c17775609d3f29c288b9885/the-atomic-hydrogen-maser-by-norman-f-8-n-orman-f-ramsey-the-atomic-hydrogen.jpg)