The ASTHMA EPIDEMIOLOGY UpdateThe Asthma Epi-Update / Spring/Summer 2013 5 ED Visits for Asthma...
10
Spring/Summer 2013 Adult Asthma Prevalence The Behavioral Risk Factor Surveillance System (BRFSS) is a health survey of state residents aged 18 and older in households with telephones. As part of the core BRFSS survey, adult respondents are asked two asthma prevalence questions: 1) Have you ever been told you have asthma? 2) Do you still have asthma? As presented in Figure 1, the prevalence of both current and lifetime asthma among North Carolina resident adults decreased from 2011 to 2012, however these differences were not statistically significant. 1,2 Due to significant changes in methodologies for sampling and weighting the BRFSS survey data, comparisons with data collected prior to 2011 are not available. 3 Figure 2 presents current adult asthma prevalence by gender. Asthma prevalence was higher for females (9.7%) than males (5.4%) in 2012. This difference was statistically significant. N.C. Department of Health and Human Services v Division of Public Health The ASTHMA EPIDEMIOLOGY Update Cont. on p. 2 This Asthma Epidemiology Update presents the most recent available data on North Carolina adult asthma prevalence, asthma among school children, emergency department (ED) visits for asthma, and inpatient hospitalizations for asthma. Source: 2011-2012 North Carolina Behavioral Risk Factor Survey System (N.C. BRFSS). 2 15 10 5 0 Percent Lifetime Asthma Current Asthma 2011 2012 13.2 11.7 8.8 7.7 Figure 1. Prevalence of Adults with Lifetime and Current Asthma, North Carolina, 2011-2012 Source: 2012 North Carolina Behavioral Risk Factor Survey System (N.C. BRFSS). 2 12 10 8 6 4 2 0 Percent Female Male 9.7 5.4 Figure 2. Prevalence of Adults with Current Asthma by Gender, North Carolina 2012
Transcript of The ASTHMA EPIDEMIOLOGY UpdateThe Asthma Epi-Update / Spring/Summer 2013 5 ED Visits for Asthma...

S p r i n g / S u m m e r 2 0 1 3
Adult Asthma Preva lence The Behavioral Risk Factor Surveillance System (BRFSS) is a health survey of state residents aged 18 and older in households with telephones. As part of the core BRFSS survey, adult respondents are asked two asthma prevalence questions:
1) Have you ever been told you have asthma?
2) Do you still have asthma?
As presented in Figure 1, the prevalence of both current and lifetime asthma among North
Carolina resident adults decreased from 2011 to 2012, however these differences were not statistically significant.1,2 Due to significant changes in methodologies for sampling and weighting the BRFSS survey data, comparisons with data collected prior to 2011 are not available.3
Figure 2 presents current adult asthma prevalence by gender. Asthma prevalence was higher for females (9.7%) than males (5.4%) in 2012. This difference was statistically significant.
N . C . D e p a r t m e n t o f H e a l t h a n d H u m a n S e r v i c e s v D i v i s i o n o f P u b l i c H e a l t h
The ASTHMAEPIDEMIOLOGY Update
C o n t . o n p . 2
This Asthma Epidemiology Update presents the most recent available dataon North Carolina adult asthma prevalence, asthma among school children,emergency department (ED) visits for asthma, and inpatient hospitalizationsfor asthma.
Source: 2011-2012 North Carolina Behavioral Risk Factor Survey System (N.C. BRFSS).2
15
10
5
0
Perc
ent
Lifetime Asthma Current Asthma
2011 2012
13.211.7
8.8 7.7
Figure 1. Prevalence of Adultswith Lifetime and Current Asthma, North Carolina, 2011-2012
Source: 2012 North Carolina Behavioral Risk Factor Survey System (N.C. BRFSS).2
12
10
8
6
4
2
0
Perc
ent
Female Male
9.7
5.4
Figure 2. Prevalence of Adults withCurrent Asthma by Gender, NorthCarolina 2012
C o n t . o n p . 3 T h e A s t h m a E p i - U p d a t e / S p r i n g / S u m m e r 2 0 1 32
A d u l t A s t h m a P r e v a l e n c e c o n t . f r o m p . 1
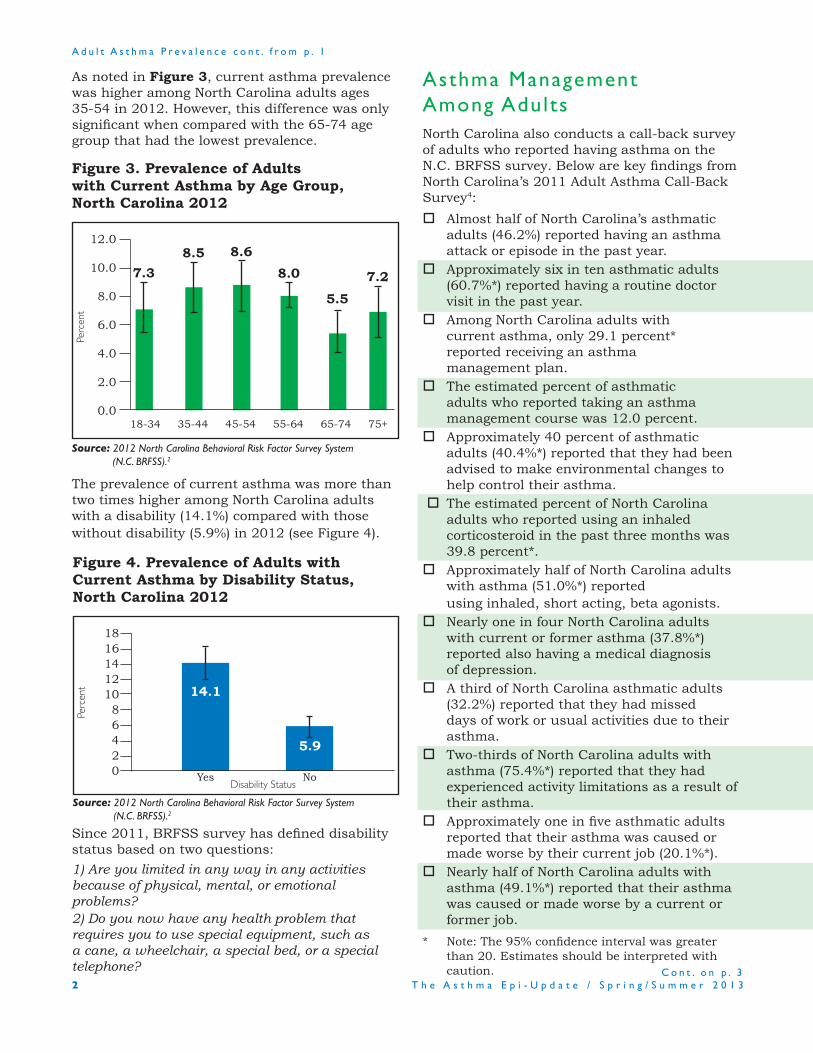
As noted in Figure 3, current asthma prevalence was higher among North Carolina adults ages 35-54 in 2012. However, this difference was only significant when compared with the 65-74 age group that had the lowest prevalence.
Source: 2012 North Carolina Behavioral Risk Factor Survey System (N.C. BRFSS).2
12.0
10.0
8.0
6.0
4.0
2.0
0.0
Perc
ent
18-34 35-44 45-54 55-64 65-74 75+
7.3
Figure 3. Prevalence of Adultswith Current Asthma by Age Group,North Carolina 2012
8.5 8.6
8.0
5.5
7.2
The prevalence of current asthma was more than two times higher among North Carolina adults with a disability (14.1%) compared with those without disability (5.9%) in 2012 (see Figure 4).
Source: 2012 North Carolina Behavioral Risk Factor Survey System (N.C. BRFSS).2
181614121086420
Perc
ent
Yes
14.1
Figure 4. Prevalence of Adults with Current Asthma by Disability Status,North Carolina 2012
Disability StatusNo
Asthma ManagementAmong AdultsNorth Carolina also conducts a call-back survey of adults who reported having asthma on the N.C. BRFSS survey. Below are key findings from North Carolina’s 2011 Adult Asthma Call-Back Survey4:
Almost half of North Carolina’s asthmatic adults (46.2%) reported having an asthma attack or episode in the past year.
Approximately six in ten asthmatic adults (60.7%*) reported having a routine doctor visit in the past year.
Among North Carolina adults with current asthma, only 29.1 percent* reported receiving an asthma management plan. The estimated percent of asthmatic adults who reported taking an asthma management course was 12.0 percent. Approximately 40 percent of asthmatic
adults (40.4%*) reported that they had been advised to make environmental changes to help control their asthma.
The estimated percent of North Carolina adults who reported using an inhaled
corticosteroid in the past three months was 39.8 percent*.
Approximately half of North Carolina adults with asthma (51.0%*) reported
using inhaled, short acting, beta agonists. Nearly one in four North Carolina adults with current or former asthma (37.8%*) reported also having a medical diagnosis of depression. A third of North Carolina asthmatic adults
(32.2%) reported that they had missed days of work or usual activities due to their asthma.
Two-thirds of North Carolina adults with asthma (75.4%*) reported that they had experienced activity limitations as a result of their asthma.
Approximately one in five asthmatic adults reported that their asthma was caused or made worse by their current job (20.1%*).
Nearly half of North Carolina adults with asthma (49.1%*) reported that their asthma was caused or made worse by a current or former job.
* Note: The 95% confidence interval was greater than 20. Estimates should be interpreted with caution.
5.9
Since 2011, BRFSS survey has defined disability status based on two questions:
1) Are you limited in any way in any activities because of physical, mental, or emotional problems?2) Do you now have any health problem that requires you to use special equipment, such as a cane, a wheelchair, a special bed, or a special telephone?

T h e A s t h m a E p i - U p d a t e / S p r i n g / S u m m e r 2 0 1 3 3
C o n t . o n p . 4
Asthma Preva lencein North Carol ina Publ ic Schools5
According to the North Carolina School Health Services Report, more than 1.4 million children (1,417,657) were enrolled in North Carolina K-12 public schools during the 2011-2012 school year; an increase of 8,473 students from the2010-2011 school year.5
The unduplicated number of students with chronic health conditions, as reported by school nurses, was 232,183 in 2011-2012; equating to approximately 16.4 percent of all public school students in the state. As shown in Table 1, in 2011-12, asthma was the most common chronic health condition reported by school nurses; with 105,542 public school students (7.4%) known to school nurses to haveasthma.
Table 1: Number of K-12 Public School Students with Chronic Conditions, North Carolina School Year 2011-2012
All Chronic
Conditions*--- Asthma
Elementary 148,994 57,718
Middle 70,584 25,724
High School 66,384 22,100
Total 285,962 105,542
*Includes students diagnosed with multiple chronic conditions Source: North Carolina Annual School Health Services Report, 2011-12.
Approximately half (52%) of K-12 students with asthma had an Individual Health Plan (IHP) completed by a school nurse. A total of 823 asthmatic students (1%) had a related 504 plan.
During the 2011-2012 school years, asthma was the most frequent topic for school nurse counseling sessions. School nurses conducted a total of 47,379 health counseling sessions in 2011-12; representing 19 percent of all counseling sessions conducted. The majority of asthma counseling sessions (63%) were conducted with elementary school students.
In school year 2011-12, a total of 59 North Carolina school districts had formalized case management programs aimed at increasing the ability of students to manage chronic health conditions. As shown in Table 2 below, the majority of asthmatic students demonstrated positive health improvements as a result of school nurse case management.

T h e A s t h m a E p i - U p d a t e / S p r i n g / S u m m e r 2 0 1 34
A s t h m a P r e v a l e n c e i n N o r t h C a r o l i n a P u b l i c S c h o o l s c o n t . f r o m p . 3
C o n t . o n p . 5
Table 2: Student Outcomes of School Nurse Case Management for Asthma,North Carolina 2011-12
Asthma Student OutcomesNumber ofStudentsMeasured
Number of students who demonstrated
improvement
Percent ofstudents measured who demonstrated
improvement
1. Consistently verbalized accurate knowledge of patho-physiology of their condition
2,124 1,770 83%
2. Consistently demonstrated correct use of asthma inhaler and/or spacer
2,328 2,062 89%
3. Accurately listed his/her asthma triggers
2,142 1,827 85%
4. Remained within acceptable peak flow/pulse oximetry parameters according to care plan
506 395 78%
5. Improved amount and frequency of regular physical activity
1,169 956 82%
6. Improved grades 810 600 74%
7. Decreased number of absences
1,168 941 81%
Source: North Carolina Annual School Health Services Report, 2011-12.
Asthma education is important for both staff and students. In school year 2011-12, 50 North Carolina school districts (43%) presented asthma education programs for staff and 33 school districts (29%) provided asthma education programs for students.
Emergency Depar tment (ED) Vis i ts for Asthma6
In 2012, nearly 97,000 emergency department visits were recorded with a primary or secondary diagnosis of asthma. Among those visits, 49.5 percent (47,646) had a primary diagnosis of asthma and 50.5 percent (48,914) had a secondary diagnosis of asthma (ICD-9CM codes 493.00 - 493.99). Since there is no evidence that the patients were treated for asthma based on their secondary diagnosis, only those visits with a primary diagnosis of asthma are reported here. In 2012, slightly more than half (54.3%) of North Carolina ED visits for asthma occurred among females and 45.7 percent occurred among males, as shown in Figure 5.
Source: North Carolina Disease Event Tracking and Epidemiological Tool (N.C. DETECT) Emergency Department Data, 20126
100
80
60
40
20
0
Perc
ent
Male
45.7
Figure 5. Emergency Department Visits with a Primary Diagnosis of Asthma by Gender, North Carolina 2012
Female
54.3
6.8
11.4
T h e A s t h m a E p i - U p d a t e / S p r i n g / S u m m e r 2 0 1 3 5
E D V i s i t s f o r A s t h m a c o n t . f r o m p . 4
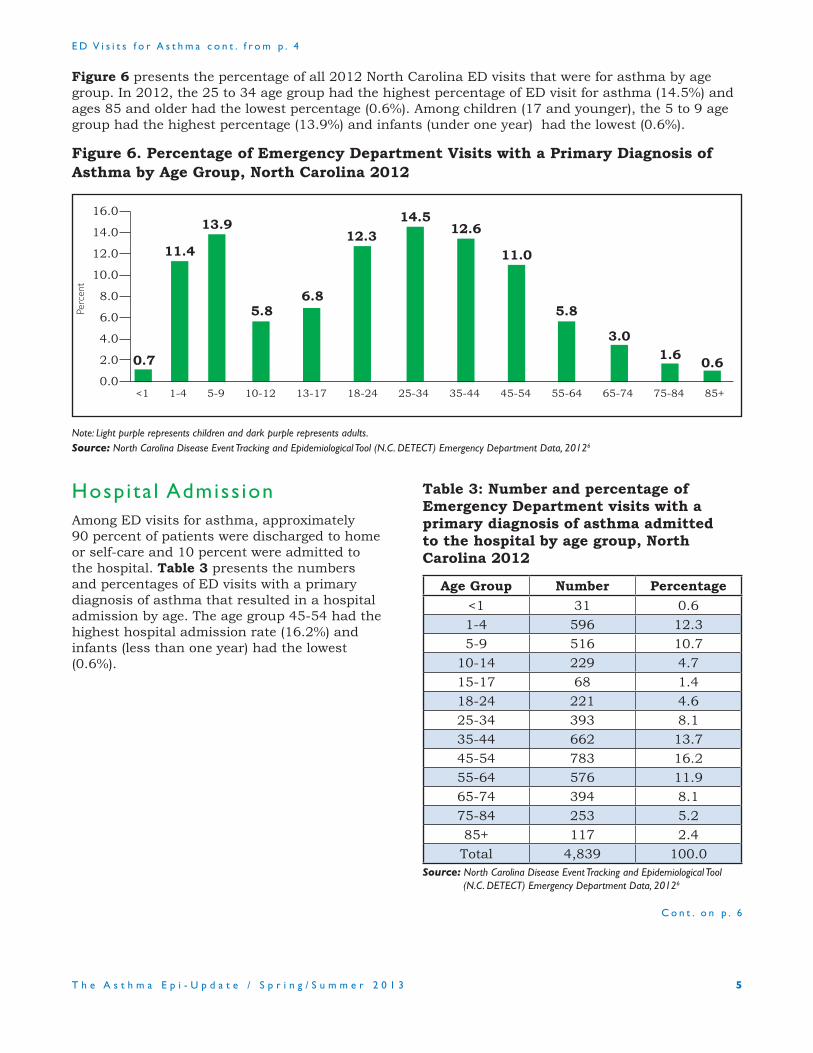
Figure 6 presents the percentage of all 2012 North Carolina ED visits that were for asthma by age group. In 2012, the 25 to 34 age group had the highest percentage of ED visit for asthma (14.5%) and ages 85 and older had the lowest percentage (0.6%). Among children (17 and younger), the 5 to 9 age group had the highest percentage (13.9%) and infants (under one year) had the lowest (0.6%).
C o n t . o n p . 6
Figure 6. Percentage of Emergency Department Visits with a Primary Diagnosis of Asthma by Age Group, North Carolina 2012
Note: Light purple represents children and dark purple represents adults.Source: North Carolina Disease Event Tracking and Epidemiological Tool (N.C. DETECT) Emergency Department Data, 20126
Hospita l Admiss ionAmong ED visits for asthma, approximately90 percent of patients were discharged to home or self-care and 10 percent were admitted tothe hospital. Table 3 presents the numbers and percentages of ED visits with a primary diagnosis of asthma that resulted in a hospital admission by age. The age group 45-54 had the highest hospital admission rate (16.2%) and infants (less than one year) had the lowest (0.6%).
Table 3: Number and percentage of Emergency Department visits with aprimary diagnosis of asthma admittedto the hospital by age group, NorthCarolina 2012
Age Group Number Percentage
<1 31 0.6
1-4 596 12.3
5-9 516 10.7
10-14 229 4.7
15-17 68 1.4
18-24 221 4.6
25-34 393 8.1
35-44 662 13.7
45-54 783 16.2
55-64 576 11.9
65-74 394 8.1
75-84 253 5.2
85+ 117 2.4
Total 4,839 100.0Source: North Carolina Disease Event Tracking and Epidemiological Tool
(N.C. DETECT) Emergency Department Data, 20126
16.0
14.0
12.0
10.0
8.0
6.0
4.0
2.0
0.0
Perc
ent
<1 1-4 5-9 10-12 13-17 18-24 25-34 35-44 45-54 55-64 65-74 75-84 85+
0.7
13.9
5.8
12.314.5
12.6
11.0
5.8
3.01.6
0.6

T h e A s t h m a E p i - U p d a t e / S p r i n g / S u m m e r 2 0 1 36
Source of PaymentA little more than half of all emergency department visits with a primary diagnosis of asthma (52.3%) listed government sources (Medicaid, Medicare and other government) as the primary source of payment. Medicaid represented the largest percentage of ED visits (40.1%). More than one in five asthma ED visits (23.4%) occurred to self-pay patients.
Table 4: Principal source of payment for ED visits with a Primary Diagnosis of Asthma, North Carolina 2012
Principal Sourceof Payment
Number of visits %
Private Insurance 9,651 20.1
Medicaid 19,249 40.1
Medicare 4,,567 9.5
Other government pay 1,308 2.7
Self-pay 11,256 23.4
Workers compensation 61 0.1
Unknown 322 0.7
Missing 1,603 3.3
Total 48,017 100.0Source: North Carolina Disease Event Tracking and Epidemiological Tool
(N.C. DETECT) Emergency Department Data, 20126
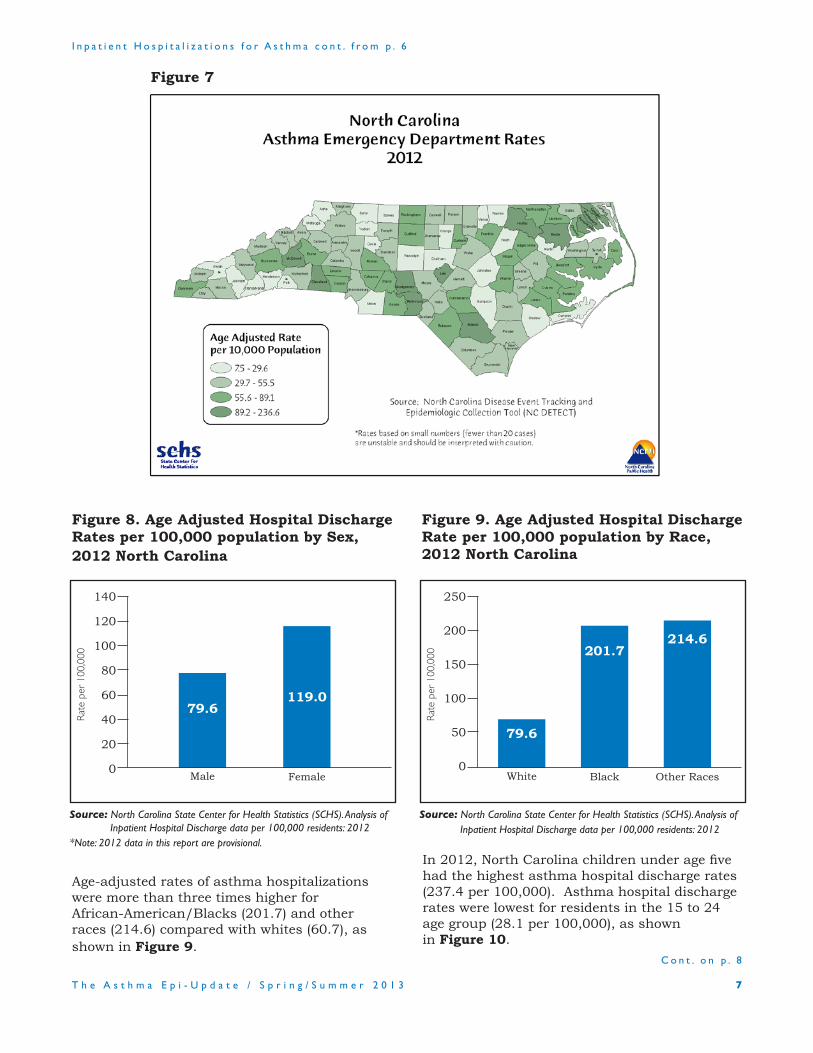
ED RatesRates of emergency department visits for asthma vary by county of residence. Pasquotank County had the highest age-adjusted asthma ED rate in 2012 (236.6 visits per 10,000) and Jackson County had the lowest age-adjusted asthma ED rate (7.5 visits per 10,000). Table 5 shows the counties with highest age-adjusted asthma ED rates in 2012 and Figure 7 presents a map of 2012 North Carolina ED rates for asthma by county of residence. Based on this data, it seems that the north east counties have higher rates of emergency department visits for asthma than the other parts of North Carolina.
Table 5: Counties with the HighestAge-Adjusted Emergency Department Rates for Asthma, North Carolina 2012
County Count Adjusted rate/10,000
Pasquotank 897 236.6
Richmond 602 137.0
Lee 719 123.0
Halifax 581 121.6
Camden 111 120.8
Perquimans 126 118.4
Cleveland 965 107.7
Bladen 338 103.6
Bertie 184 103.5
McDowell 403 102.4Source: North Carolina Disease Event Tracking and Epidemiological Tool
(N.C. DETECT) Emergency Department Data, 20126
Inpat ient Hospita l izat ionsfor Asthma*7 In 2012*, asthma was the primary diagnosisfor 9,786 North Carolina resident hospital discharges (ICD-9CM code 493). Overall in 2012, there were 100.3 asthma hospital discharges per 100,000 North Carolina residents. These numbers do not represent the number of patients since some patients may have been hospitalized more than one time during the 2012 calendar year.
Females had a higher age-adjusted asthma hospital discharge rate than males (119.0 vs.79.6 per 100,000 residents), as shown in Figure 8.
*Note: 2012 data is this report are provisional.
T h e A s t h m a E p i - U p d a t e / S p r i n g / S u m m e r 2 0 1 3 7
I n p a t i e n t H o s p i t a l i z a t i o n s f o r A s t h m a c o n t . f r o m p . 6
C o n t . o n p . 8
Figure 8. Age Adjusted Hospital Discharge Rates per 100,000 population by Sex, 2012 North Carolina
Source: North Carolina State Center for Health Statistics (SCHS). Analysis of Inpatient Hospital Discharge data per 100,000 residents: 2012
*Note: 2012 data in this report are provisional.
Age-adjusted rates of asthma hospitalizations were more than three times higher forAfrican-American/Blacks (201.7) and other races (214.6) compared with whites (60.7), as shown in Figure 9.
140
120
100
80
60
40
20
0
Rat
e pe
r 10
0,00
0
Male
79.6
Female
119.0
Figure 9. Age Adjusted Hospital Discharge Rate per 100,000 population by Race, 2012 North Carolina
Source: North Carolina State Center for Health Statistics (SCHS). Analysis of Inpatient Hospital Discharge data per 100,000 residents: 2012
250
200
150
100
50
0
Rat
e pe
r 10
0,00
0
White
79.6
Black
201.7
Other Races
214.6
Figure 7
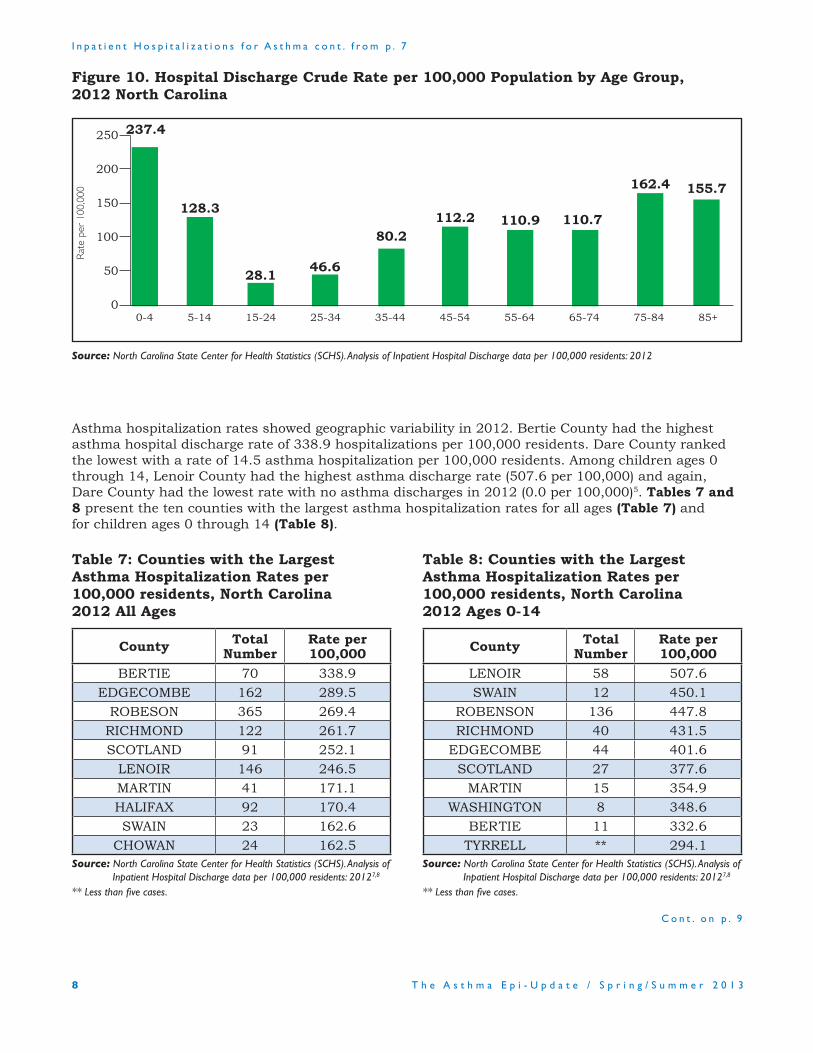
In 2012, North Carolina children under age five had the highest asthma hospital discharge rates (237.4 per 100,000). Asthma hospital discharge rates were lowest for residents in the 15 to 24 age group (28.1 per 100,000), as shown in Figure 10.
T h e A s t h m a E p i - U p d a t e / S p r i n g / S u m m e r 2 0 1 38
I n p a t i e n t H o s p i t a l i z a t i o n s f o r A s t h m a c o n t . f r o m p . 7
Asthma hospitalization rates showed geographic variability in 2012. Bertie County had the highest asthma hospital discharge rate of 338.9 hospitalizations per 100,000 residents. Dare County ranked the lowest with a rate of 14.5 asthma hospitalization per 100,000 residents. Among children ages 0 through 14, Lenoir County had the highest asthma discharge rate (507.6 per 100,000) and again, Dare County had the lowest rate with no asthma discharges in 2012 (0.0 per 100,000)5. Tables 7 and 8 present the ten counties with the largest asthma hospitalization rates for all ages (Table 7) and for children ages 0 through 14 (Table 8).
Table 8: Counties with the LargestAsthma Hospitalization Rates per 100,000 residents, North Carolina2012 Ages 0-14
County Total Number
Rate per 100,000
LENOIR 58 507.6
SWAIN 12 450.1
ROBENSON 136 447.8
RICHMOND 40 431.5
EDGECOMBE 44 401.6
SCOTLAND 27 377.6
MARTIN 15 354.9
WASHINGTON 8 348.6
BERTIE 11 332.6
TYRRELL ** 294.1Source: North Carolina State Center for Health Statistics (SCHS). Analysis of
Inpatient Hospital Discharge data per 100,000 residents: 20127,8 ** Less than five cases.
Figure 10. Hospital Discharge Crude Rate per 100,000 Population by Age Group,2012 North Carolina
Source: North Carolina State Center for Health Statistics (SCHS). Analysis of Inpatient Hospital Discharge data per 100,000 residents: 2012
250
200
150
100
50
0
Rat
e pe
r 10
0,00
0
0-4 5-14 15-24 25-34 35-44 45-54 55-64 65-74 75-84 85+
237.4
128.3
28.146.6
80.2112.2 110.9 110.7
162.4 155.7
Table 7: Counties with the LargestAsthma Hospitalization Rates per 100,000 residents, North Carolina2012 All Ages
County Total Number
Rate per 100,000
BERTIE 70 338.9
EDGECOMBE 162 289.5
ROBESON 365 269.4
RICHMOND 122 261.7
SCOTLAND 91 252.1
LENOIR 146 246.5
MARTIN 41 171.1
HALIFAX 92 170.4
SWAIN 23 162.6
CHOWAN 24 162.5Source: North Carolina State Center for Health Statistics (SCHS). Analysis of
Inpatient Hospital Discharge data per 100,000 residents: 20127,8 ** Less than five cases.
C o n t . o n p . 9

T h e A s t h m a E p i - U p d a t e / S p r i n g / S u m m e r 2 0 1 3 9
Figure 11
Source: North Carolina State Center for Health Statistics (SCHS). Analysis of Inpatient Hospital Discharge data per 100,000 residents (age-adjusted): 2012
References
1. North Carolina State Center for Health Statistics (SCHS). Behavioral Risk Factor Surveillance System (BRFSS) Annual Survey Results: 2011. Available at: www.schs.state.nc.us/schs/brfss/2011/ Published November 19, 2012. Accessed January 27, 2014.
2. North Carolina State Center for Health Statistics (SCHS). Behavioral Risk Factor Surveillance System (BRFSS) Annual Survey Results: 2012. Available at: www.schs.state.nc.us/schs/brfss/2012/ Published August 20, 2013. Accessed January 27, 2014.
3. North Carolina State Center for Health Statistics (SCHS). Behavioral Risk Factor Surveillance System (BRFSS) BRFSS 2011 Annual Results Technical Notes. Available at: www.schs.state.nc.us/SCHS/brfss/2011/technical.html Published September 19, 2012. Accessed January 27, 2014.
4. Centers for Disease Control and Prevention (CDC). 2011 BRFSS Asthma Call-Back Survey Prevalence Tables by state/territory. Available at: www.cdc.gov/Brfss/acbs/2011/2011_tables.html Published September 10, 2013. Accessed January 27, 2014.
5. North Carolina Department of Health and Human Services, Division of Public Health, Women’s and Children’s Health Section, Child and Youth Section,
School Health Unit. North Carolina Annual School Health Services Report 2011-2012. Available at:
www.ncdhhs.gov/dph/wch/doc/stats/SchoolHealth ServicesAnnualReport2011-2012.pdf Published November 13, 2013. Accessed January 27, 2014.
6. UNC Department of Emergency Medicine Carolina Center for Health Informatics. Analysis of N.C. DETECT
Emergency Department Visit Data: 2012.
I n p a t i e n t H o s p i t a l i z a t i o n s f o r A s t h m a c o n t . f r o m p . 8
Figure 11 presents a map showing 2012 North Carolina age-adjusted hospital discharge rates for asthma by county of residence. Based on this map, hospital discharge rates for asthma are higher on the east part of North Carolina than the west.
C o n t . o n p . 1 0

T h e A s t h m a E p i - U p d a t e / S p r i n g / S u m m e r 2 0 1 310
Future TopicsAdditional data from the North Carolina BRFSS and the North Carolina Childhood Health Assessment and Monitoring Program (CHAMP) will allow us to provide further information on behavioral risk factors, and asthma management and control. We continue to explore other sources of surveillance data and will share asthma-related information of interest with you. As always, we welcome your comments and suggestions on this issue and for future topics. Please contact the North Carolina Asthma Program at 919-707-5213.
State of North CarolinaPat McCrory, Governor
Department of Health and Human ServicesAldona Z. Wos, M.D., Secretary
Division of Public Healthwww.ncdhhs.gov
N.C. DHHS is an equal opportunity employer and provider.
7/14
This publication was supported by the Cooperative Agreement Number 5U59EH000518-05 from theCenters for Disease Control and Prevention. Its
contents are solely the responsibility of the authors and do not necessarily represent the official viewsof the Centers for Disease Control and Prevention.
7. North Carolina State Center for Health Statistics (SCHS). County Health Data Book: Asthma Hospital Discharges (Total and Ages 0-14) per 100,000 Popula-tion 2011. Available at: www.schs.state.nc.us/schs/data/databook/2013/CD18%20Asthma%20hospitaliza-tions%20by%20county.html Published December 04, 2012. Accessed January 27, 2014.
8. North Carolina State Center for Health Statistics (SCHS). Analysis of Inpatient Hospital Discharge data per 100,000 residents: 2012.
R e f e r e n c e s c o n t . f r o m p . 9