THE ASSOCIATION BETWEEN PAYDAY LENDING AND …
38
THE ASSOCIATION BETWEEN PAYDAY LENDING AND ECONOMIC WELL BEING, EVIDENCE FROM STATE LEVEL PANEL DATA FROM 1991-2013 A Thesis submitted to the Graduate School of Arts and Sciences at Georgetown University in partial fulfillment of the requirements for the degree of Master of Public Policy in Public Policy By Alistair M. Johnston, B.A. Washington, D.C. April 7, 2015
Transcript of THE ASSOCIATION BETWEEN PAYDAY LENDING AND …

THE ASSOCIATION BETWEEN PAYDAY LENDING AND ECONOMIC WELL BEING, EVIDENCE FROM STATE LEVEL PANEL DATA FROM 1991-2013
A Thesis submitted to the
Graduate School of Arts and Sciences at Georgetown University
in partial fulfillment of the requirements for the degree of
Master of Public Policy in Public Policy
By
Alistair M. Johnston, B.A.
Washington, D.C.
April 7, 2015

ii
THE ASSOCIATION BETWEEN PAYDAY LENDING AND ECONOMIC WELL BEING, EVIDENCE FROM STATE LEVEL PANEL DATA FROM 1991-2013
Alistair M. Johnston, B.A.
Thesis Advisor: Thomas Wei, PhD ABSTRACT
Payday lending, short-term loans for small amounts of money with high interest and fees,
is a controversial practice. Many have argued that it creates cycles of debt that harm
borrowers long-term economic well being. The research to this point has measured
different outcomes of economic well being with mixed results. In this paper I use panel
data from 1991 through 2013 for all states and Washington DC to measure the
association between laws allowing payday lending and two measures of economic well
being: income and the poverty rate. Although my results are largely mixed, contrary to
the prevailing popular notion, I find some evidence that payday lending may be
associated with benefits to economic well being.

iii
TABLE OF CONTENTS
I. INTRODUCTION..................................................................................................1
II. LITERATURE REVIEW.......................................................................................2
III. CONCEPTUAL MODEL.......................................................................................7
IV. EMPIRICAL STRATEGY....................................................................................10
V. DATA DESCRIPTION.........................................................................................12
VI. ANALYSIS.........................................................................................................21
VII. LIMITATIONS OF THIS STUDY..........................................................................28
VIII. CONCLUSION...................................................................................................31
BIBLIOGRAPHY................................................................................................32

iv
LIST OF TABLES AND FIGURES
Conceptual Model..............................................................................................................7
Figure 1: Mean Per Capita Income per Year in 2013 Dollars (in all states and DC)....................................................................................................................................13
Figure 2: Proportion in Poverty over Time (in all states and DC)..............................14
Figure 3: Proportion of States and DC Permitting and Restricting Payday Lending over Time..........................................................................................................................17
Figure 4: Unemployment Rate over Time (in all states and DC)................................19
Table 1: Regression of Income on Payday Lending Laws and Controls....................23
Table 2: Regression of Proportion in Poverty on Payday Lending Laws and Controls.............................................................................................................................25

1
I. Introduction Payday loans are short-term loans, usually 2-4 weeks, for small amounts of
money, usually under $400 and capped at $500 in many states (CFPB 2013). For
example, a payday borrower might write a post-dated check for $300 in exchange for
$255 in cash. When the borrower’s payday arrives, the lender will cash the check
(Stegman 2007). The borrower, however, need not use a check or be able to repay the
loan at the end of the period. The fees associated with payday lending can add up. The
average annual percentage interest from these loans is 339% (CFPB 2013). After taking
out one loan and not being able to repay it, a borrower might be forced to take another
loan to cover the money from the first loan, falling into a cycle that can be difficult to
escape from. Although 48% of new borrowers take out only one loan, and 74% have no
more than two loan sequences, 15% of new loans last 10 cycles or longer. This string of
borrowing can become difficult to repay. Over 80% of the loan sequences that extend
beyond one loan feature the same or more money owed on the last loan as was owed on
the first (CFPB 2014).
These cycles of debt have led to much criticism of the payday lending market.
Some states that had previously allowed payday-lending organizations have changed the
laws to forbid them. The Consumer Financial Protection Bureau (CFPB) is thought to be
close to introducing regulations that would put some limits on short-term loans including
payday lenders (Silver-Greenberg 2015).
On the other hand, these loans may be beneficial. They could be made to people
who are otherwise unable to borrow who are able to stave off catastrophe through the
instant liquidity payday lending provides. Today, 12 million people borrow $50 billion a
2
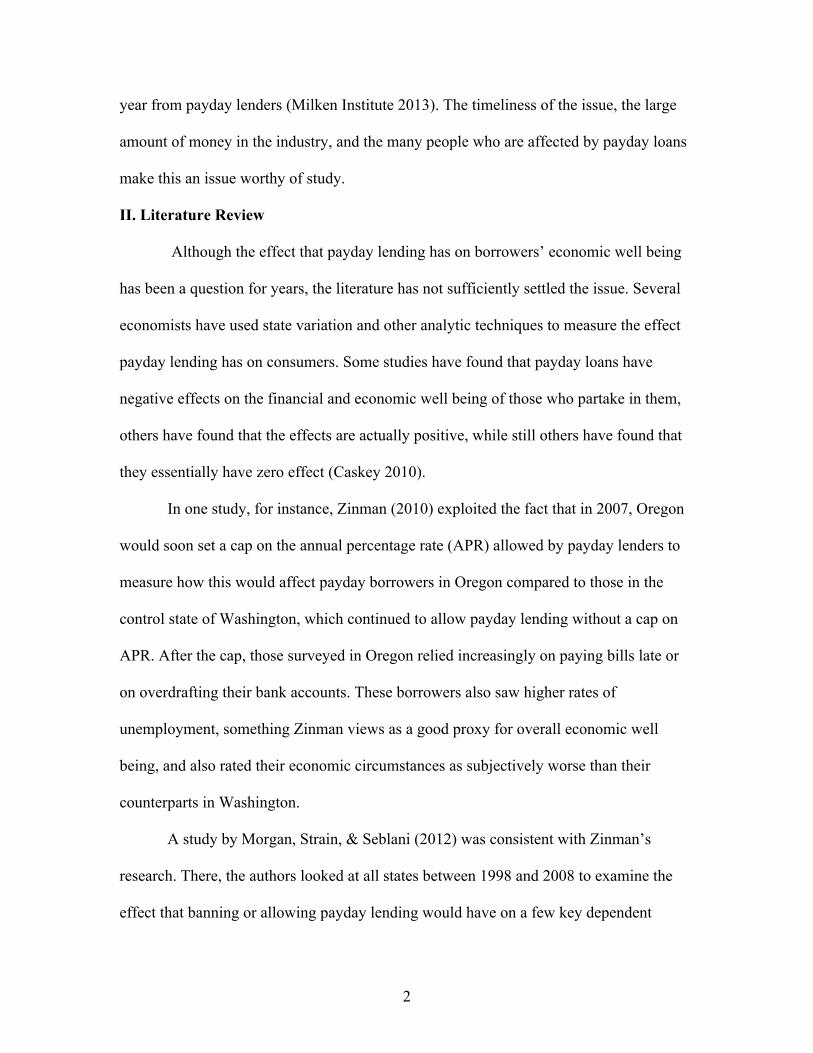
year from payday lenders (Milken Institute 2013). The timeliness of the issue, the large
amount of money in the industry, and the many people who are affected by payday loans
make this an issue worthy of study.
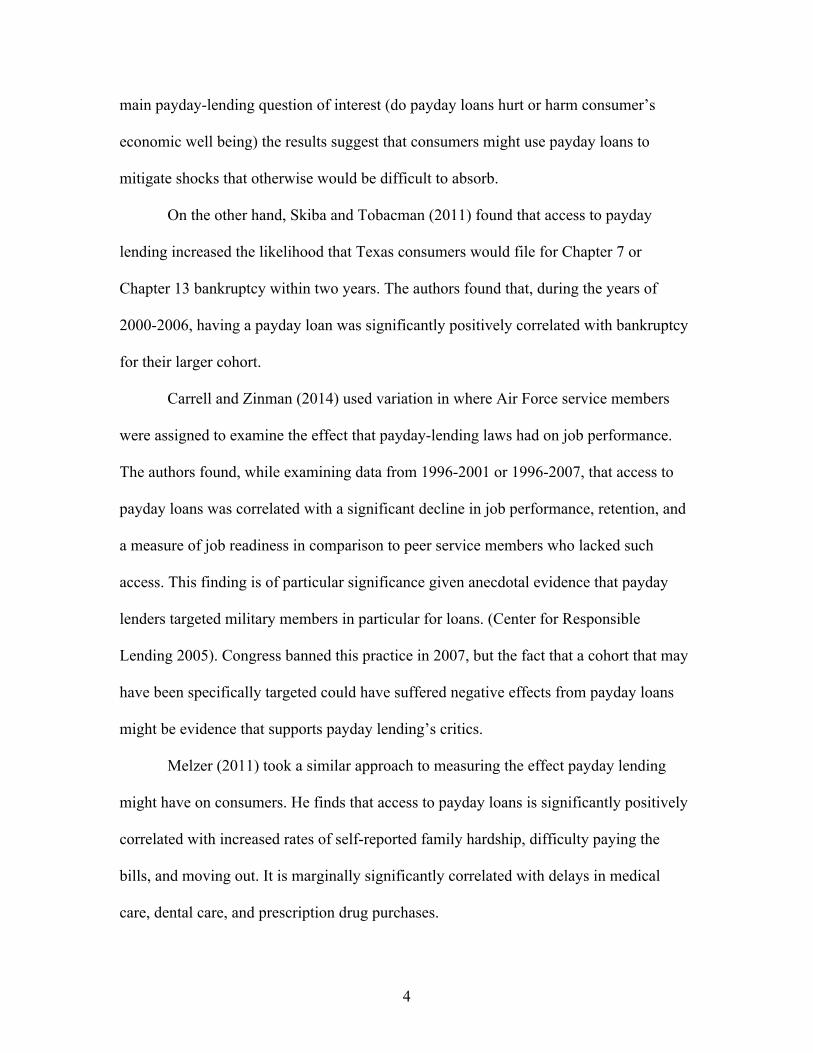
II. Literature Review
Although the effect that payday lending has on borrowers’ economic well being
has been a question for years, the literature has not sufficiently settled the issue. Several
economists have used state variation and other analytic techniques to measure the effect
payday lending has on consumers. Some studies have found that payday loans have
negative effects on the financial and economic well being of those who partake in them,
others have found that the effects are actually positive, while still others have found that
they essentially have zero effect (Caskey 2010).
In one study, for instance, Zinman (2010) exploited the fact that in 2007, Oregon
would soon set a cap on the annual percentage rate (APR) allowed by payday lenders to
measure how this would affect payday borrowers in Oregon compared to those in the
control state of Washington, which continued to allow payday lending without a cap on
APR. After the cap, those surveyed in Oregon relied increasingly on paying bills late or
on overdrafting their bank accounts. These borrowers also saw higher rates of
unemployment, something Zinman views as a good proxy for overall economic well
being, and also rated their economic circumstances as subjectively worse than their
counterparts in Washington.
A study by Morgan, Strain, & Seblani (2012) was consistent with Zinman’s
research. There, the authors looked at all states between 1998 and 2008 to examine the
effect that banning or allowing payday lending would have on a few key dependent

3
variables: the overdrafting of accounts, the filing of Chapter 13 bankruptcy, and the filing
of FTC complaints against lenders and debt collectors. The authors found that banning
payday lending was significantly correlated with a decrease in filing for bankruptcy, but
that it was significantly correlated with an increase in FTC complaints and overdrafting.
The authors hypothesized that their results might mean that the absence of payday loans
forced consumers into informal bankruptcy in which they had to rely on repossession and
overdrafting to clear debts instead of borrowing through payday loans. If so, such an
approach may be more costly in many circumstances, which might mean that the absence
of payday loans is associated with a net decrease in economic well being. Morgan and
Strain (2008) performed a similar study in Georgia and North Carolina, where payday
lending was banned in successive years. The authors found that compared to other states
where payday lending remained in effect, check bouncing, complaints and Chapter 7
bankruptcy increased, while Chapter 13 bankruptcy decreased, but by a smaller amount
than Chapter 7 bankruptcy increased. Chapter 13 filing is used to protect substantive
assets, while chapter 7 is not and, the authors argue, a better fit for payday borrowers.
Overall, the authors argue their results suggest not having access to payday loans harms
consumers’ economic well being.
Morse (2011) takes this logic further by using propensity score matching to
compare credit constrained zip codes that have access to payday lenders with those that
do not during the years 1996-2002. She found that those communities that had access to
payday loans were less likely to suffer foreclosures after a disaster than those that lacked
them. The author concluded from this that payday lending can help keep consumer well
being high when exogenous shocks occur. Although this is not a direct measure of the
4
main payday-lending question of interest (do payday loans hurt or harm consumer’s
economic well being) the results suggest that consumers might use payday loans to
mitigate shocks that otherwise would be difficult to absorb.
On the other hand, Skiba and Tobacman (2011) found that access to payday
lending increased the likelihood that Texas consumers would file for Chapter 7 or
Chapter 13 bankruptcy within two years. The authors found that, during the years of
2000-2006, having a payday loan was significantly positively correlated with bankruptcy
for their larger cohort.
Carrell and Zinman (2014) used variation in where Air Force service members
were assigned to examine the effect that payday-lending laws had on job performance.
The authors found, while examining data from 1996-2001 or 1996-2007, that access to
payday loans was correlated with a significant decline in job performance, retention, and
a measure of job readiness in comparison to peer service members who lacked such
access. This finding is of particular significance given anecdotal evidence that payday
lenders targeted military members in particular for loans. (Center for Responsible
Lending 2005). Congress banned this practice in 2007, but the fact that a cohort that may
have been specifically targeted could have suffered negative effects from payday loans
might be evidence that supports payday lending’s critics.
Melzer (2011) took a similar approach to measuring the effect payday lending
might have on consumers. He finds that access to payday loans is significantly positively
correlated with increased rates of self-reported family hardship, difficulty paying the
bills, and moving out. It is marginally significantly correlated with delays in medical
care, dental care, and prescription drug purchases.

5
Finally, Bhutta (2013) finds that, with respect to credit scores, access to payday
loans has very little effect. His results show no significant effect on credit scores. He
hypothesizes that this may be consistent with past research that found that without
payday lending, consumers would rely on other means of borrowing, which may yield
roughly the same results. Bhutta, Skiba, and Tobacman (2014) found similar results when
using payday-lending data from 2000-2004 to measure the effect of taking out payday
loans on credit scores—there was little measurable change in the scores of those who
received a payday loan.
All of these studies face potential omitted variable problems, as explained by
Caskey (2010). They also studied a variety of outcomes, which can help explain the mix
of findings. There are larger macroeconomic trends, similarities between states that allow
(or ban) payday lending, and other factors that might be correlated with the dependent
variables of interest, potentially leading payday lenders to locate in areas for reasons that
also effect economic well being. To some extent, these problems will always be a
challenge to any non-experimental approach.
Still, some of these problems could be mitigated by a natural experimental
framework that used more states and more years of payday-lending data in its
regressions. In my analysis, I used more years data than previous studies, helping to
ensure that any observed effects would be less easily attributable to a particular moment
in time and whatever economic effects happened to be occurring then. States have also
changed a lot over the 25-year period that payday lending has existed. Their
demographics have changed and political control has shifted hands several times. With
these changes have come changes in regulation. This does not mean that the ban or

6
authorization of payday loans is completely uncorrelated to a state’s other laws and
general makeup, but it is less tied to these features over time than at any given point.
Finally, states have changed their laws with regards to payday loans both before and after
the period that these studies measure. With more variance in both strong and weak
economies and across various regulatory philosophies, the isolated effect of payday loans
on economic well being might be more carefully measured.
Past studies have focused on outcomes that are not directly related to economic
well being. Although some do an admirable job of finding creative ways to measure
economic well being, most are heavily focused only on characteristics associated with
borrowing and credit. Admittedly, this is the primary mechanism by which payday loans
affect well being, but if the critics or proponents of payday loans are correct, there are
likely to be other effects. Finally, this debate is currently at a stand still, with some
studies seeming to show that payday lending helps consumers, others showing that it
harms them, and others showing no effect at all. By examining more years of data and
looking at a different dependent variable, I hope my research can add to this debate.

7
III. Conceptual Model
Key:
Causes or leads to Negative correlation Unclear
Independent Variable of Interest Dependent Variable
Laws Allowing Payday Lending
Macroeconomic Indicators
High Fees & Interest Rates
Economic Well Being
Avoidance of Catastrophe
Amount of Payday Business
Minority Population
Education
8
My conceptual model builds on the research that has already been done in this
field in an attempt to show the connection between having access to payday lending and
consumer economic well being. The current research is mixed on this connection but
seems to be consistent with the idea that payday lending might be harmful for some
groups who fall into cycles of debt and struggle to meet the high fees and interest rates,
while at the same time helpful for other groups who borrow only to avoid truly
calamitous situations. Indeed, data from the CFPB seems to support this idea. While the
majority of first time payday loans within an observed timeframe are paid back relatively
quickly, the majority of all loans over the timeframe last several loan periods (CFPB
2014). Perhaps many first-time borrowers are people responding to a momentary shock,
while another group is caught in a difficult-to-escape cycle of debt.
Unfortunately, policies that ban or limit payday lending do so for all lenders, so
the data available in my approach cannot easily separate these groups. Still, it would be
interesting to try to tease out the two different effects. My conceptual model attempts to
do this by including both the avoidance of catastrophe and high fees and interest rates,
which can breed a cycle of debt, as pathways by which access to payday loans could have
a positive and negative effect, respectively, on economic well being.
The research seems to be mixed about the effect that access to payday lending has
on unemployment. One study (Zinman 2010) found that the introduction of payday
lending was associated with a rise in unemployment over and above what was seen in a
control state. Although there may be reasons to doubt this result—Oregon generally saw
a faster and worse response to the great recession than Washington did (Caskey 2011)—it
could well be that access to payday loans can help employees avoid truly horrible

9
situations and retain their jobs. On the other hand, another study (Carrell and Zinman
2014) found that being posted in a state with payday lending made Air Force members
more likely to lose their jobs than their counterparts in other states. This could occur
through the stress of a debt cycle. It could also be that those states that allow payday
lending also have other policies that could harm service members’ careers, legalized
gambling perhaps (Caskey 2010). Still, this is an interesting debate that seems like the
larger debate about payday loans in miniature, and it is well worth studying.
According to critics of payday lending, payday lenders target minority
communities and those with low education. My conceptual model accounts for the
possibility of this behavior by including both the racial composition of a state as well as
the state’s education level. If these characteristics are really leading to payday lenders
targeting certain areas, then one should see more payday lending in areas with higher
minority concentration and with lower education levels. In this case, education level
might be a stand in for financial acumen. Alternatively, education could be a measure of
general income levels, and lower education could therefore mean a greater likelihood
payday loans would be needed to make ends meet.
The amount of payday lending itself must also be taken into account. If a state has
legal payday lending but very few actual payday lenders there is unlikely to be much of
an effect from payday lending on economic well being. This characteristic is therefore
included in my conceptual model.
Finally, my conceptual model takes into account larger macroeconomic factors,
something that is likely correlated with unemployment and other measures of economic
well being. There is no a priori reason to think that they will have any effect on the

10
presence or absence of payday lending, but it could turn out to be the case that when
economies are in recession, individuals rely more heavily on payday loans than at other
times. Of course, the reverse could also be true, if individuals respond to a recession with
decreased borrowing and increased caution, payday loans could go down.
Prior to performing any analysis, my hypothesis was that once the avoidance of
catastrophe is controlled for (which I hoped to do in part by including a measure of
natural disasters), payday loans will have a negative effect on overall economic well
being. I thought that the research that backs this hypothesis was a little bit more plausible.
I also thought it was a better fit of anecdotal reporting about payday lending leading to
debt cycles than a theory that posits that there is no effect or that the effect is positive.
Still, the empirical evidence is mixed, and my conceptual model has competing effects.
Therefore, no result would be unexpected.
IV. Empirical Strategy
The primary equations I used were the following
Incomest = ß1*paydayst lending allowed + ß2*payday lending limitedst +ß3 *proportion African Americanst +ß4 *proportion Hispanicst +ß5 *proportion college educationst +ß6 *unemployment ratest + µst
Poverty Ratest = ß1*paydayst lending allowed + ß2*payday lending limitedst +ß3
*proportion African Americanst +ß4 *proportion Hispanicst +ß5 *proportion college educationst +ß6 *unemployment ratest +µst
where s is a given state and t is a given year. I also used different specifications that
included measures of payday lending businesses in a state, natural disaster, recession, and
political control of a state. As discussed in the next section, payday lending allowed is a
dummy variable marked as a 1 for every year after payday lending is first made legal and
11
0 in all other years. Payday lending limited is a dummy variable that will be marked as a
1 for every year that payday lending is limited by a legislative act, beginning the year
after enactment. Number of payday businesses is the number of payday businesses per
capita recorded by the Economic Census in the nearest year for which data are available.
Proportion Black and proportion Hispanic are the proportions of the state’s population
that are Black and Hispanic. Proportion college education is the proportion of the state’s
population that has a college education or higher. The unemployment rate is the
proportion of the state’s population that is unemployed. Natural disaster is the money
FEMA spends on a state’s natural disasters in a given year. Recession is the NBER
measure of whether the U.S. economy was in recession. And Political control is a
measure of whether a dummy variable, coded as 1 if the state’s entire legislature is
controlled by Democrats. I also included a year fixed effect in all my estimates.
I ran several fixed effects regressions to exploit the fact that states shifted to allow
payday lending over a long time period in an attempt to measure how access to payday
loans effects consumer well being. Legislation that allows payday loans may not be an
entirely exogenous event. It could be influenced by lobbyists, targeting certain states for
an exception to usury laws, after payday lenders have deemed those states would be the
most receptive to payday loans. It could also be linked to a whole host of other political
and philosophical beliefs about regulation that work independently of this one law.
Although I included a control (total FEMA spending on a disaster in a state in a
given year) for this theory, I find it unlikely. There is no clear regional or political pattern
to which states have allowed payday lending and which have forbidden it (except
perhaps, the states of New England, which tend to disproportionately ban it). States with

12
very different political party control have allowed payday lending or banned it. They
have also done so at different times over the course of the 24-year period I will be
studying. Currently 32 states allow payday lending. It strikes me as very unlikely that
there is some immeasurable common characteristic among these states that can explain
their having allowed payday lending. Indeed, states controlled by both parties have
passed laws allowing the practice. Several of these states have undergone drastic swings
in political control and demographic makeup over this time period with little effect on the
legality of payday lending. For these reasons, I think that treating laws allowing or
banning payday lending as a mostly exogenous characteristic makes sense.
V. Data Description
To test my hypothesis, I created my own panel data set for the 23 years between
1991 and 2013. All 50 states and D.C. are included in this data and the unit of analysis is
a state by year.
Dependent Variables
To measure economic well being I used two variables: per capita income in each
state and the proportion of people in each state living at or below the poverty line: the
proportion of a state’s population in poverty. Income data is available every year from the
Bureau of Economic Analysis. It is based on a large survey sample of prices in each state
with corrections for regional purchasing power parity. I adjusted all dollar values into
2013 dollars, using the Bureau of Labor’s Consumer Price Index. I used data collected by
the Census and the American Community Survey in order to measure the proportion in
poverty.

13
During the entire range of 23 years, the lowest recorded income in a state was
$23,716 in Mississippi in 1991. The state with the highest income in my original data was
the District of Columbia in 2012 at $77,062. When the District of Columbia is dropped
the highest state income is Connecticut in 2007, $62,387. The overall mean income for
all states and DC over all years is $39,569 with a standard deviation of $7,471. On the
whole, this period of time, from 1991 to 2013 saw a relatively strong economy, in which
income tended to grow every year, as shown in Figure 1: Mean Per Capita Income per
Year in 2013 Dollars (in all states and DC).
Figure 1: Mean Per Capita Income per Year in 2013 Dollars (in all states and DC)
Source: Bureau of Economic Analysis
The proportion in poverty ranged from .052 for New Hampshire in 2000 to .264
in Louisiana in 1993. Overall, during the 23-year period, the mean poverty rate for all
states and DC was .13 Unlike income, however, the proportion in poverty’s trajectory
was not the same during the period. It dropped throughout the 1990s until reaching its
010
,000
20,0
0030
,000
40,0
0050
,000
mea
n of
Inco
me
1991 1992 1993 1994 1995 1996 1997 1998 1999 2000 2001 2002 2003 2004 2005 2006 2007 2008 2009 2010 2011 2012 2013

14
nadir in 2000. Then it continued on a mostly steady trajectory for the rest of the time
period. The proportion in poverty was, however, mostly stable; never falling below .10
on average, or rising above .15 as shown in Figure 2: Proportion in Poverty over Time (in
all states and DC).
Figure 2: Proportion in Poverty over Time (in all states and DC)
Source: Census
Independent Variables of Interest
To measure the introduction of payday lending, I exploited the fact that all states
ban usury lending in the abstract and have to actively legalize payday lending for it to be
allowed in order to measure the introduction of payday lending. Each state begins in a
position in which lending above a certain level, usually 36% APR, is forbidden. One by
one, most states proceeded to allow exceptions for payday lenders, beginning in the early
nineties and continuing through the next two decades. This allows me to use a dummy
variable to measure whether payday lending is allowed or forbidden. This variable will be
coded as a 1 in a state that allows payday loans; beginning one year after payday lending
0.0
5.1
.15
Mea
n of
Pro
porti
on in
Pov
erty
1991 1992 1993 1994 1995 1996 1997 1998 1999 2000 2001 2002 2003 2004 2005 2006 2007 2008 2009 2010 2011 2012 2013
15
is introduced. Over the same time period, some states changed their laws to limit payday
lending. I also used these laws to create a separate dummy variable, marked as a 1 in a
state that limits payday loans, beginning the year after the change in law. Because states
that never allowed payday lending in the first place never had a need to limit its practice,
all the states in this category allowed payday lending to occur at one time.
These two categories are not mutually exclusive. Oregon, for example, capped the
amount of interest that could accrue on payday loans in 2007, but still allows the process
to continue. Whether or not payday lending is allowed or forbidden is based on the
determination of the Consumer Federation of America in its analysis of payday lending
laws in every state.
Colorado presents one example of what a limit on payday lending looks like. In
2010, Colorado passed a law that significantly limited payday loans in a number of ways.
A minimum loan period of six months was set up for loans on any unpaid checks.
Annualized interest is capped at 45%, but monthly interest can grow at various rates
depending on the size of the loan. There is no penalty to prepaying the balnce of a loan,
which can occur at any time, and all payments must reduce the principle amount owed.
Average interest rates are 115%. The years following the law’s passage have seen a large
reduction in payday lending in Colorado and a higher percentage of loans repaid. (Pew
Trusts 2014).
Payday lending in Iowa, in contrast, is perhaps the least regulated of anywhere in
the country. There is no cap in what can be charged in annualized interest. Idaho law still,
however, offers some limitations on payday lending. Payday loans are limited to 25% or
1,000 of a borrower’s gross monthly income. Payday loans cannot be paid back by other
16
loans made by the same company. (Idaho Department of Finance). What I call an outright
ban is the model adopted by Connecticut. In that state, annualized percentage interest on
loans is capped at 36% and can only be made by those licensed through the banking
department (Kirby 2013).
Washington is in between Colorado and Idaho in its regulation of payday loans.
While there is no annualized cap on loans, fees are limited at $15 per $100 in loans, and
loans are capped at $500. There is, however, no minimum loan term (Zinman 2010).
Given the general looseness of Washington’s laws, I treat payday lending as allowed and
not limited in Washington.
States employ a variety of different annual rate caps and other requirements on
payday lenders. Pew Charitable Trusts (2012) presents the law in every state, which can
be compared across multiple dimensions. I have simplified them for the purpose of this
study into those that do or do not allow payday lending and those that do or do not limit
it.
Over the period of analysis, states were almost exactly evenly split between
allowing payday loans and subjecting them to hard usury caps. Observing states one at a
time every year, 50.64% allowed payday lending and 49.36% did not. The distribution of
states allowing payday loans is not, however, uniform over time. In 1991, the first year of
my dataset, around 10% of states allowed payday loans. The number of states allowing
payday lending steadily rose over the next several years, reaching its peak in 2007 when
nearly 80% of states allowed payday loans. The rate then began to fall slightly and was a
little above 60% of states in 2013. See Figure 3: Proportion of States and DC Permitting
and Restricting Payday Lending over Time.

17
On the other hand, the number of states limiting payday lending has been far
smaller than those that have not limited it. Over the entire timespan of the dataset only
5.88% of states limited the practice. This all occurred over the last several years. No
states had any limitations on payday lending before 2003, when Delaware began to limit
the practice. From that year on, more states began to limit it until over 20% did in 2013.
See Figure 3: Proportion of States and DC Permitting and Restricting Payday Lending
over Time.
Figure 3: Proportion of States and DC Permitting and Restricting Payday Lending over Time
Source: Consumer Federation of America; State Law
Control Variables
I used the Census and the American Community Survey to measure a state’s
racial and ethnic makeup and education levels by collecting data on the proportion of
African Americans and Hispanic or Latino Americans in a given state and the proportion
of residents who have graduated from college. These data are available every year, save
one, 1992, for which there is no information on education levels. For all these variables a
0.2
.4.6
.8
1991 1992 1993 1994 1995 1996 1997 1998 1999 2000 2001 2002 2003 2004 2005 2006 2007 2008 2009 2010 2011 2012 2013
mean of Payday_Lending_Restricted mean of Payday_Lending_Allowed

18
value of 1 means that the entire population of a state has the characteristic in question. In
all my regressions I used a standardized version of all these variables, with units
expressed in standard deviations.
Following past research, I attempted to control for some of the positive effects
payday lending can have in the avoidance of catastrophe by measuring on natural
disasters. I used money FEMA spent every year in a state on natural disasters, adjusted
into 2013 dollars using the CPI index. Although this does not capture all of the negative
economic shocks that payday loans could be used to protect against, it is one shock that
one study seems to show they do protect against (Morse 2011). Measuring this can,
hopefully, account for at least some of the negative shocks that might require payday
loans. Using spending is not a perfect measure of the severity of a disaster, but it is at
least a good guide. This information is available every year beginning in 1998, so I will
only use this in some estimations of my model. In my regressions I used a standardized
variable for disaster spending, with units being expressed in standard deviations.
I used data available from the Bureau of Labor Statistics to measure state
unemployment every year. These data are based on a large sample of surveyed
households. These data are a stand in for the general macroeconomic conditions that are
occurring in a state, which might be affecting income, poverty rates, and economic well
being through channels independent of payday loans. In my regressions, I also used a
standardized version of this variable, with units expressed in standard deviations.
The unemployment rate was at its lowest for any state in any year in 2000 for
Virginia and Connecticut (both had an unemployment rate of 2.3%). It was at its highest,
a rate of 13.8%, in Nevada in 2010. Overall, for all years in all states, the mean

19
unemployment rate was 5.72% with a standard deviation of 1.93%. Unemployment fell
throughout the nineties, but rose following the recessions that bookended the first decade
of the new century. See Figure 4: Unemployment Rate over Time (in all states and DC).
Figure 4: Unemployment Rate over Time (in all states and DC)
Source: Bureau of Labor Statistics
I also attempted to measure the business cycle by including a control for
recessions. I included a dummy, measured as a 1 for all states during years the U.S. was
in recession, using the measure of recessions provided by the National Bureau of
Economic Research.
To control for the fact that laws about payday lending might be correlated with
other policies that would significantly affect economic well being, I included measures of
a state’s legislative makeup. I created a dummy variable measuring whether a state
legislature was entirely controlled by Democrats. It was set equal to 1 if both a state’s
lower house and a state’s upper house were controlled by Democrats, and otherwise set to
0. These data are collected by the Census and the District of Columbia was not included.
02
46
8m
ean
of U
nem
ploy
men
t_R
ate
1991 1992 1993 1994 1995 1996 1997 1998 1999 2000 2001 2002 2003 2004 2005 2006 2007 2008 2009 2010 2011 2012 2013

20
Data are only collected in two-year increments until 2005, as most elections for state
legislatures occur every two years in synch with national elections. For the odd years
during this period, I simply assumed that the legislative makeup was the same as the time
of the last election. After 2005 data are available every year.
A Measure of Payday Lending
To measure the amount of payday lending that actually occurs in a state, I used
information collected by the Economic Census on the prevalence of businesses that
provide unsecure cash loans (NAICS code 522291) and check cashing services (NAICS
code 522390). The measure I used was businesses fitting into these categories per capita.
A past study found that these categories do a fairly good job of capturing payday lending
(Bhutta 2013). These data are collected through a survey of businesses. Information from
the Economic Census is only available for the period ranging from 2001-2012.
Data were only available on the number of payday lending businesses from 2002-
2012. Furthermore, the Economic Census categories that capture these businesses also
capture a number of other consumer credit businesses, like wire transfer and check
cashing shops, that are not payday lending (though they are likely close substitutes). The
lowest per capita rate of these businesses was 0, which occurred in Vermont in 2002. The
highest rate was .000375, occurring in Mississippi in 2007. Given the lack of clarity in
these categories, I wondered if they were even actually a good measure of payday
lending. I used a t-test to compare the mean number of establishments per capita for
states that had allowed payday lending and states that had a prohibitively low annualized
percentage interest cap (.0001244 and .0000549). With a t-statistic of 11.187, I found that
the mean number of establishments in states without payday lending was significantly

21
lower than in states where payday lending was authorized. This is consistent with what I
would expect.
VI. Analysis
I am primarily interested in how payday lending affects economic well being. To
measure this, I ran a series of regressions using mean income and poverty rates as
measures of economic well being. Using income as a dependent variable, I first regressed
income on my measures of payday lending being allowed, my measure of regulations
affecting payday lending, unemployment to control for macroeconomic factors, and my
minority and education measures to control for any targeting payday lenders might
perform on those characteristics. The results of this first regression were mixed. Payday
lending being legal was negatively correlated with income, but at a statistically
insignificant level. Legalizing payday lending was associated with a decrease of $83 in
mean state income. Laws limiting payday lending were, however, also negatively
correlated with state income, specifically a decrease of $664. This was significant for
p<.05. See Table 1: Regression of Income on Payday Lending Laws and Controls.
Interested in separating out the extent to which payday lending was being used to
mitigate catastrophe, I included a measure of how badly disaster had affected a given
state in a given year, the amount of money FEMA had designated to the state for disaster
recovery, adjusted for inflation in to 2013 dollars. Adding this variable into the model
had a dramatic effect. Payday lending was now associated with a $435 decrease in mean
income, significant for p<.05. The negative association between limiting payday lending
and income also remained. Limiting payday lending was now associated with a loss of

22
$1,031 in mean per capita income, at a stronger significant level of p<.01. See Table 1:
Regression of Income on Payday Lending Laws and Controls.
Although this change in the model could be caused by the control for disaster
spending weeding out some of those who are using payday lending responsibly—briefly
borrowing money in order to stave off a disaster—it could also be caused by the fewer
years this variable brings to the model. Data on FEMA spending is mostly only available
from 1998 going forward. This removes several observations, narrowing the scope of the
analysis. It also removes a period where there was some interesting variation among
states in payday lending laws. Rather than a finding about how controlling for natural
disasters affects the association between payday lending laws and income, this could
simply be a finding that payday lending laws (both allowing and limiting the practice)
were negatively correlated with income in the years after 1998. Indeed, running the first
regression with only these years produces a very similar result, suggesting this is the real
cause of these results.
Finally, I included another iteration of this model in an attempt to control for
political and economic effects that could be correlated with both payday lending laws and
income. I included a measure of whether a state’s legislature was controlled by
Democrats. This measure has a correlation with the lower chamber being controlled by
Democrats of about .79 and with the upper chamber being controlled by Democrats of
.85. The results were essentially the same no matter which measure of Democratic
control was used, and I did not include the other findings in my tables. In addition to this
control, I included a control for economic recessions, on the theory that it might be the
troubled economy of the 2000s, which happened to occur during a time when laws
23
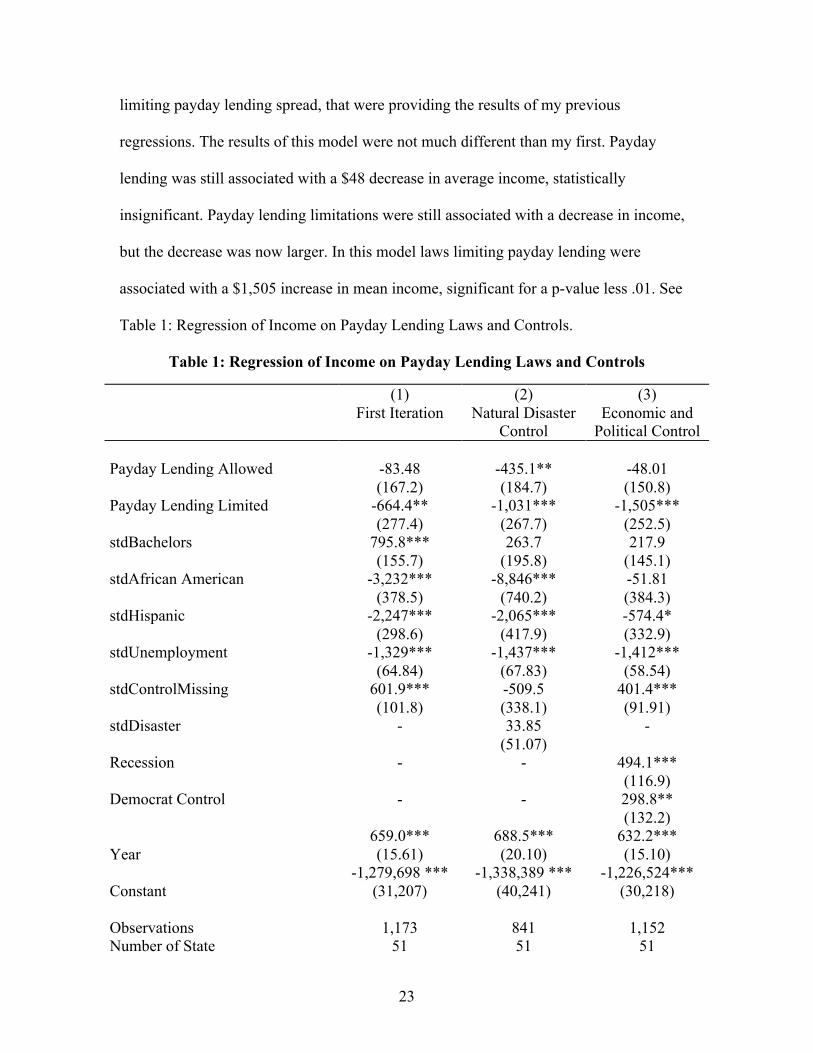
limiting payday lending spread, that were providing the results of my previous
regressions. The results of this model were not much different than my first. Payday
lending was still associated with a $48 decrease in average income, statistically
insignificant. Payday lending limitations were still associated with a decrease in income,
but the decrease was now larger. In this model laws limiting payday lending were
associated with a $1,505 increase in mean income, significant for a p-value less .01. See
Table 1: Regression of Income on Payday Lending Laws and Controls.
Table 1: Regression of Income on Payday Lending Laws and Controls
(1) (2) (3) First Iteration Natural Disaster
Control Economic and
Political Control Payday Lending Allowed -83.48 -435.1** -48.01 (167.2) (184.7) (150.8) Payday Lending Limited -664.4** -1,031*** -1,505*** (277.4) (267.7) (252.5) stdBachelors 795.8*** 263.7 217.9 (155.7) (195.8) (145.1) stdAfrican American -3,232*** -8,846*** -51.81 (378.5) (740.2) (384.3)
stdHispanic -2,247*** -2,065*** -574.4* (298.6) (417.9) (332.9) stdUnemployment -1,329*** -1,437*** -1,412*** (64.84) (67.83) (58.54) stdControlMissing 601.9*** -509.5 401.4*** (101.8) (338.1) (91.91) stdDisaster - 33.85 - (51.07) Recession - - 494.1*** (116.9) Democrat Control - - 298.8** (132.2) 659.0*** 688.5*** 632.2*** Year (15.61) (20.10) (15.10) -1,279,698 *** -1,338,389 *** -1,226,524*** Constant (31,207) (40,241) (30,218) Observations 1,173 841 1,152 Number of State 51 51 51

24
R-squared 0.856 0.794 0.873 Notes: Standard errors in parentheses. *** p<0.01, ** p<0.05, * p<0.1. Payday Lending Allowed = laws allowing payday loan businesses; Payday Lending Limited = laws placing limitations on payday loans; stdBachelors = the proportion of the population with a bachelors degree or higher, standardized so the unit of measurement is 1 standard deviation; stdAfrican American = the proportion of the population who is African American, standardized so the unit of measurement is 1 standard deviation; stdHispanic = the proportion of the population who is Hispanic, standardized so the unit of measurement is 1 standard deviation; stdUnemployment = the percentage of the population who is unemployed, standardized so the unit of measurement is 1 standard deviation; stdControlMissing = a variable equal to 1 when data on education are missing (only for 1992), standardized so the unit of measurement is 1 standard deviation; stdDisasters = FEMA spending on disasters in 2013 dollars, standardized so the unit of measurement is 1 standard deviation; Recession = a binary variable measuring whether the US was in a recession; Democrat Control = a binary variable equal to 1 when Democrats controlled both houses of a state’s legislature; Year = a variable measuring the year. The second model is missing a number of observations prior to 1998, the first year FEMA consistently recorded its disaster spending. All models include all states and DC except for the third, which does not include DC.
I ran the same dependent models with a different measure of economic well being
as my dependent variable: the proportion in poverty. Because the proportion in poverty
was fairly small and potential changes in it did not have intuitive meaning, I thought it
best to standardize the dependent variable and report the association between the
independent variables and standard deviation changes in the poverty proportion. In this
case, laws allowing payday lending were associated with an increase in economic well
being. In the model’s first iteration, a change in the law allowing payday lending was
associated with a .135 decrease in the proportion in poverty, significant for p<.01. The
correlation between laws limiting payday lending and the poverty rate was positive, but it
was insignificant in both magnitude (an increase of .03 standard deviations) and
statistically. This was mostly the same across all iterations of the model, where the
magnitude increased, but the correlation never became statistically significant. The
statistical significance of the correlation between laws allowing payday and the poverty
rate dropped, slightly, with different iterations of the model, but it remained significant
for p<.05. The magnitude of the effect was a bit smaller, meaning that a law allowing
payday lending was associated only with a .1 standard deviation decrease in the

25
proportion in poverty. See Table 2: Regression of Proportion in Poverty on Payday
Lending Laws and Controls.
Table 2: Regression of Proportion in Poverty on Payday Lending Laws and Controls
(1) (2) (3) First Iteration Natural
Disaster Control
Economic and Political Control
Payday Lending Allowed -0.135*** -0.100** -0.100** (0.0415) (0.0474) (0.0415) Payday Lending Limited 0.0374 0.0323 0.0731 (0.0689) (0.0687) (0.0696) stdBachelors -0.131*** -0.200*** -0.107*** (0.0387) (0.0502) (0.0400) stdAfrican American -0.0283 0.165 -0.127 (0.0940) (0.190) (0.106) stdHispanic 0.176** 0.163 -0.0541 (0.0742) (0.107) (0.0917) stdUnemployment 0.330*** 0.272*** 0.341*** (0.0161) (0.0174) (0.0161) stdControlMissing -0.0567** -0.102 -0.0487* (0.0253) (0.0867) (0.0253) stdDisaster - 0.0170 - (0.0131) Recession - - -0.106*** (0.0322) Democrat Control - - 0.0863** (0.0364) Year -.00000509 0.0187*** 0.00542 (0.00388) (0.00516) (0.00416) Constant 0.168 -37.41*** -10.85 (7.752) (10.32) (8.323) Observations 1,173 841 1,152 Number of State 51 51 51 R-squared 0.352 0.441 0.359
Notes: Standard errors in parentheses. *** p<0.01, ** p<0.05, * p<0.1. Proportion of the population in poverty, the dependent variable, is measured in standard deviations. Payday Lending Allowed = laws allowing payday loan businesses; Payday Lending Limited = laws placing limitations on payday loans; stdBachelors = the proportion of the population with a bachelors degree or higher, standardized so the unit of measurement is 1 standard deviation; stdAfrican American = the proportion of the population who is African American, standardized so the unit of measurement is 1 standard deviation; stdHispanic = the proportion of the population who is Hispanic, standardized so the unit of measurement is 1 standard deviation; stdUnemployment = the percentage of the population who is unemployed, standardized so the unit of measurement is 1 standard
26
deviation; stdControlMissing = a variable equal to 1 when data on education are missing (only for 1992), standardized so the unit of measurement is 1 standard deviation; stdDisasters = FEMA spending on disasters in 2013 dollars, standardized so the unit of measurement is 1 standard deviation; Recession = a binary variable measuring whether the US was in a recession; Democrat Control = a binary variable equal to 1 when Democrats controlled both houses of a state’s legislature; Year = a variable measuring the year. The second model is missing a number of observations prior to 1998, the first year FEMA consistently recorded its disaster spending. All models include all states and DC except for the third, which does not include DC.
Discussion
The results of my analysis surprised me. I expected either a negative correlation
between laws legalizing payday lending and economic well being, or little link at all. I
also expected a positive correlation between laws limiting payday lending and economic
well being, or no link. Instead my analysis points more towards the opposite conclusion.
A few caveats are, however, in order. There was not a consistent association between
payday lending laws and economic well being across my two measures of economic well
being. Although laws allowing payday lending were positively correlated with a decrease
in the poverty rate, they were negatively correlated with income (albeit not at a
statistically significant level or with strong magnitude, except in the case of the natural
disasters model). While laws limiting payday lending were negatively associated with
income and positively associated with an increase in the poverty rate, the association was
only statistically significant in the first case. Both the positive correlation between laws
allowing payday lending and the proportion in poverty and the negative correlation
between laws limiting payday lending and income were fairly robust, maintaining their
association through all variants of my model.
There is some evidence for the theory that payday lending has a negative effect on
economic well being, once the avoidance of catastrophe is controlled for. Using disaster
spending as a proxy for natural disasters, exogenous shocks that may well require payday
borrowing for many consumers to stay afloat, I found that when that variable was

27
controlled for, payday lending was statistically significantly correlated with a loss in
income. This association did not, however, persist when the proportion in poverty was
used as my dependent variable. It also persisted when I simply reran my first regression
during the years for which data on FEMA spending were available. This suggests that,
instead of the control for disaster spending being the cause of the change in the
association between allowing payday lending and income, laws allowing for payday
lending were negatively correlated with income from the year 1998 onward and
positively correlated before that date. This could itself simply be a chance correlation,
brought on by the fact that both income and laws allowing payday lending happened to
increase during the 90s, whereas income faltered with the change of century but laws
allowing payday lending continued to grow.
It could very well be the case that the effect laws allowing payday lending has on
economic well being is complicated. These laws could reduce per capita income, while
also decreasing the proportion of a state’s residence living in poverty. Similarly, laws
limiting payday lending could harm per capita income, while leaving a state’s
impoverished population relatively untouched. It could also be that shifting from a
regime in which payday lending is allowed to one in which it is not momentarily harms
per capita income, but ultimately leads to an equilibrium as consumers adjust. Given that
most of the laws limiting payday lending occurred over the past decade, there may not
currently be enough data to say for sure.
Even if the practice of payday lending is generally associated with gains in
economic well being for an entire state, and limits on it are associated with statewide
losses, this might not tell us what is going on with individual borrowers. It could, of

28
course, be the case that payday lending is good for economic well being in the populace
at large, but still significantly harms some of the people who engage in the practice. The
effect on individual people is, unfortunately, something that my broad model, focused
only on aggregate measures among states, cannot capture.
Many scholars have questioned whether laws allowing payday lending or laws
banning it matter at all. They point to the fact that when payday lending is banned other
risky economic activities, like taking out title loans, seem to completely take its place.
While this may be the case, my analysis points in the other direction. Although there is
undoubtedly some substitution between payday loans and other risky lines of credit for
those who lack access to payday loans, my dataset suggests that it is not perfect, at least
with regards to businesses providing small amounts of consumer credit. There is a
statistically significant difference in the number of businesses aimed at providing small
amount consumer credit—including title loan, wire transfer, check cashing, and other
businesses—in states that ban payday loans and those that allow it. There are
significantly fewer in the former. This suggests that, while some substitution may be
occurring, it is not absolute.
Consumers in these states may, however, be seeking other risky substitutes not
measured by this variable, such as overdrafting their checking accounts. Other studies
have found that consumers rely more heavily on these methods when payday lending is
not accessible. If these substitutes for payday lending are even more deleterious to
economic well being, as some authors have argued, then that could explain the positive
association between payday lending and economic well being that my analysis suggests.
VII. Limitations of This Study

29
Although I think that the case is a relatively weak one, as discussed in my
empirical strategy section, the fact that certain states allow payday lending might not be
linked to several unobserved variables that could also affect economic well being. This is
a concern that is, to some extent, impossible to fully answer in the confines of a non-
experimental study.
There might also be trouble in accurately measuring when the effects of allowing
payday lending can best be felt. Studies use very different time frames to measure this
quality, ranging from a few months to years. I have elected to use a single year delay.
There is also the problem that most data are only available every year, but states legalize
payday lending at various points throughout the year. Therefore, in my data, a state that
allowed payday lending at the beginning of January is treated the same as one that
allowed it in December of the same year.
Along similar lines, information on FEMA spending for natural disasters is only
available for most states going back to 1998. Although I think measuring levels of
disaster in an attempt to look at how exogenous shocks affect payday lending is
worthwhile, doing so sacrifices part of what will make my study an expansion on what
came before: its greater time span. None of the studies that currently exist have measured
payday lending in the early 1990s or early 2010s. I believe that by including these
periods, I can capture more of the effects of payday lending across a range of larger
macroeconomic periods. I am, however, limited to a smaller period for my regressions
that use data on natural disasters. As discussed in the previous section, changes that
appear to be caused by the inclusion of this variable may simply be caused by a
difference in timeframe.

30
Another potential problem with my dataset is the different schemes states have
adopted when legalizing payday lending. States can have very different requirements on
interest or fees, or differences in who is granted a license to open a payday lending
business. Although there are several different regimes, there are not so many that they do
not fall into general patterns. A future study could guard against any problems that arise
in this arena by creating different dummy variables for different types of laws that allow
payday lending, grouping, for instance, those states with similar interest caps together in
one category. The fact that my study used only binary categories is a weakness.
There is a similar and perhaps more serious problem in the differences between
how strictly states enforce their laws against usury. There may be some states that take
their laws very seriously and enforce any infractions and others that allow de facto
payday lending to sprout up, even if it is illegal on the books. There is not an easy way to
address this problem. Furthermore, there could be spill over when a state changes its
laws, where it takes time to begin prosecuting the laws or for lenders to get the message
that they will not be prosecuted.
Just because someone lives in a state where payday lending is illegal does not
mean that she cannot travel to a state where it is legal to take out a loan. This is the
problem that recent studies of payday lending have attempted to mitigate by comparing
data from counties near other states where payday loans are legal with other counties in
the interiors of the same states (Melzer 2011). The picture that arises may not be all that
plausible on its face, as some of the counties that have been focused on are near
incredibly rural parts of a state with legal payday lending, areas that are unlikely to have
payday-lending businesses (Caskey 2010). Still, there is likely to be a problem with
31
seepage in which some citizens of a state where payday lending is illegal are taking out
payday loans in a neighboring state. Although this may be a problem for my research
project, it is again one that is inherent in non-experimental research based on states.
Although comparing members of a state in counties that border payday lending states
with those in the interior may be an attractive option, it is not clear that there are not a
host of other omitted variables, unique to those who live on a state’s border, that might
not also be contributing to economic well being in unpredictable ways. This can be
mitigated by using propensity score matching, but this is not a sure bet.
Finally, my chosen dependent variables may not be the best at measuring
economic well being. So many things feed into income and the proportion in poverty that
any changes made by the legality of payday loans might be so small that they would be
difficult if not impossible to measure. Using state level data presents a far more crude
picture than a dataset of individuals, their incomes, and their payday lending usage. My
approach, however, has one advantage over that one. To the extent that changes in
payday lending laws are exogenous to characteristics associated with the decision to take
out loans, this approach can help remove the omitted variable problems that will always
plague a model in which payday loan consumers are themselves examined. In a model
looking at individual behavior, one can never be sure that an omitted variable, such as a
love of risk or financial incompetence, was not affecting both the decision to seek a
payday loan and economic well being.
VIII. Conclusion
How payday lending affects consumers’ economic well being is a very interesting
question at the present moment in time. Criticism of the practice is high, and the federal

32
government is set to soon release rules that govern how payday lending and other risky
consumer credit practices will operate in the future. Research on the issue is, however, far
from settled. There is not a consistent consensus among economists studying the issue
about whether payday lending is good or bad for consumers or the ways in which it might
help or harm them. Some of this can be attributed to differences in the outputs measured,
but some economists have found contradictory evidence for how payday lending affects a
given measure. While my analysis cannot settle the dispute, I hope it can add more
information. My results are fairly mixed, but are more consistent with a view that payday
lending contributes to economic well being than with one that the practice produces
economic harms. There are many plausible definitions of economic well being and it
could be the case that payday lending positively affects some while harming others.
Indeed, the results of my analysis suggest that allowing payday lending may positively
affect the proportion of a population in poverty while having little impact on income.
Conversely, limiting payday lending once it has been allowed may negatively affect
income, while leaving the proportion of a state’s population in poverty untouched.
Alternatively, payday lending might be bad for consumers’ economic well being, but less
bad than the alternatives they are forced to rely on when the practice is banned. Overall,
however, these results point to a positive association between states allowing payday
lending and the economic well being of the citizens who live within them. At a time in
which payday lending is about to be further limited, this should be of some interest.
Bibliography
Bhutta, Neal “Payday Credit Access and Household Financial Health: Evidence from Consumer Credit Records,” Working Paper (June 2012)

33
Bhutta et. al. “Payday Loan Choices and Consequences,” Working Paper (April 2014). Carrell, Scott & Zinman, Jonathan “In Harm’s Way? Payday Loan Access and Military Personnel Perfomance,” The Review of Financial Studies, 27:9 (2014), pp. 2805-2840. Caskey, John “Payday Lending: New Research and the Big Question,” Federal Reserve Bank of Philadelphia Working Paper 10-32 (October 2010). Center for Responsible Lending “Payday Lenders Target the Military,” (Semptember 2005), available at http://www.responsiblelending.org/payday-lending/research-analysis/ip011-PaydayMilitary-0905.pdf. CFPB “CFPB Data Point: Payday Lending,” Government Report (March 2014), available at http://files.consumerfinance.gov/f/201403_cfpb_report_payday-lending.pdf. CFPB “Payday Loans and Deposit Advance Products: A White Paper of Initial Data Findings,” Government White Paper (April 2013), available at http://files.consumerfinance.gov/f/201304_cfpb_payday-dap-whitepaper.pdf. Idaho Department of Finance, “Payday Loans in Idaho,” available at http://www.finance.idaho.gov/education/documents/payday-loans-in-idaho.pdf. Kirby, Michelle, “Payday Lending” Report to Connecticut General Assembly (February 2013), available at http://www.cga.ct.gov/2013/rpt/2013-R-0084.htm. Melzer, Brian T. “The Real Costs of Credit Access: Evidence from the Payday Lending Market,” The Quarterly Journal of Economics, 126:1 (2011) , pp. 517-555. Morgan, Donald P. et. al. “How Payday Credit Access Affects Overdrafts and Other Outcomes,” Journal of Money, Credit and Banking, 44:2-3 (2012), pp. 519-531. Morgan, Donald P. & Strain, Michael R. “Payday Holliday: How Households Fare After Payday Credit Bans,” Working Paper (February 2008). Morse, Adair “Payday Lenders: Heroes or Villains?,” Journal of Financial Economics, 102:1 (2011), pp. 28-44. Pew Charitable Trusts, “Trial, Error, and Success in Colorado’s Payday Lending Reforms,” (December 2014), available at http://www.pewtrusts.org/~/media/Assets/2014/12/Pew_CO_Payday_Law_Comparison_Dec2014.pdf?la=en. Pew Charitable Trusts, “State Payday Loan Regulation and Usage Rates,” (July 2012), available at http://www.pewtrusts.org/en/multimedia/data-visualizations/2014/~/media/Data%20Visualizations/Interactives/2014/State%20Payday

34
%20Loan%20Regulation%20and%20Usage%20Rates/Report/State_Payday_Loan_Regulation_and_Usage_Rates.pdf. Silver-Greenberg, Jessica “Consumer Protection Agency Seeks Limit on Payday Lenders,” NY Times, Dealbook (February 8, 2015), available at http://dealbook.nytimes.com/2015/02/08/consumer-protection-agency-seeks-limits-on-payday-lenders/?_r=1&module=ArrowsNav&contentCollection=Business%20Day&action=keypress®ion=FixedLeft&pgtype=Blogs. Skiba, Paige M. & Tobacman, Jeremy “Payday Loans and Credit Cards: New Liquidity and Credit Scoring Puzzles?” NBER Working Paper 14659 (August 2008). Skiba, Paige M. & Tobacman, Jeremy “Payday Loans, Uncertainty, and Discounting: Explaining Patterns of Borrowing, Repayment, and Default,” Working Paper (August 2008). Stegman, Michael A. “Payday Lending,” Journal of Economic Perspectives, 21:1 (Winter 2007), pp. 169-190. Zinman, Jonathan “Restricting Consumer Credit Access: Household Survey Evidence on Effects Around the Oregon Rate Cap,” Journal of Banking & Finance, 34:3 (2010), pp. 546-556.