The assessment of minimal residual disease versus that of ...
15
Salehzadeh et al. Cancer Cell Int (2019) 19:83 https://doi.org/10.1186/s12935-019-0807-0 PRIMARY RESEARCH The assessment of minimal residual disease versus that of somatic mutations for predicting the outcome of acute myeloid leukemia patients Serena Salehzadeh 1,4,5* , Francesca Guerrini 1 , Umberto Pizzano 1 , Susanna Grassi 1 , Elena Ciabatti 1 , Lorenzo Iovino 1 , Gabriele Buda 1 , Francesco Caracciolo 1 , Edoardo Benedetti 1 , Enrico Orciuolo 1 , Matteo Pelosini 1 , Giovanni Consani 1 , Giovanni Carulli 1 , Maria Rita Metelli 3 , Francesca Martini 1 , Francesco Mazziotta 1,2 , Elisa Mazzantini 1 , Pietro Rossi 1 , Rita Tavarozzi 1 , Federica Ricci 1 , Mario Petrini 1† and Sara Galimberti 1† Abstract Background: In addition to morphological and cytogenetic features, acute myeloid leukemias are characterized by mutations that can be used for target-therapy; also the minimal/measurable residual disease (MRD) could be an important prognostic factor. The purpose of this retrospective study was to investigate if somatic mutations could represent an additional prognostic value in respect of MRD alone. Method: At baseline, 98 patients were tested for NPM1, FLT3, and for WT1 expression; 31 for ASXL1, TET2, IDH1, IDH2, N-RAS, WT1, c-KIT, RUNX1, and DNMT3A. The same genes have been also tested after induction and consolidation. Results: Overall, 60.2% of our patients resulted mutated: 24.5% carried mutations of FLT3-ITD, 38.7% of NPM1, 48.4% of c-KIT, 25.8% of N-RAS and 19.3% of IDH2. The probability of achieving a complete response (CR) was higher for younger patients, with low ELN risk score, NPM1-mutated, with low WT1 levels, and without FLT3. The presence of additional mutations represented a poor predictive factor: only 19% of these cases achieved CR in comparison to 43% of subjects without any of it. Concerning survival, it was conditioned by a lower ELN risk score, younger age, reduc- tion > 1 log of the NPM1 mutational burden, disappearance of FLT3 mutations and lower WT1 expression. Regard- ing the role of the additional mutations, they impaired the outcome of 20% of the already MRD-negative patients. Concerning the possibility of predicting relapse, we observed an increase of the NPM1 mutational burden at the time- point immediately preceding the relapse (about 2 months earlier) in 50% of subjects. Similarly concerning WT1, an increase of its expression anticipated disease recurrence in 64% of cases. Conclusions: We demonstrated that additional somatic mutations are able to impair outcome of the already MRD- negative subjects. About MRD, we suggest a prognostic role also for the WT1 expression. Finally, we considered as relevant the assessment of NPM1 quantity clearance instead of the presence/absence of mutations alone. Still remains in doubt the utility in terms of long-term prognosis of a baseline more complex mutational screening; we could hypothesize that it would be useful for those patients where other markers are not available or who reached the MRD negativity. © The Author(s) 2019. This article is distributed under the terms of the Creative Commons Attribution 4.0 International License (http://creativecommons.org/licenses/by/4.0/), which permits unrestricted use, distribution, and reproduction in any medium, provided you give appropriate credit to the original author(s) and the source, provide a link to the Creative Commons license, and indicate if changes were made. The Creative Commons Public Domain Dedication waiver (http://creativecommons.org/ publicdomain/zero/1.0/) applies to the data made available in this article, unless otherwise stated. Open Access Cancer Cell International *Correspondence: [email protected] † Mario Petrini and Sara Galimberti equally contributed to the work 1 Department of Clinical and Experimental Medicine, Section of Hematology, University of Pisa, Pisa, Italy Full list of author information is available at the end of the article
Transcript of The assessment of minimal residual disease versus that of ...

Salehzadeh et al. Cancer Cell Int (2019) 19:83 https://doi.org/10.1186/s12935-019-0807-0
PRIMARY RESEARCH
The assessment of minimal residual disease versus that of somatic mutations for predicting the outcome of acute myeloid leukemia patientsSerena Salehzadeh1,4,5* , Francesca Guerrini1, Umberto Pizzano1, Susanna Grassi1, Elena Ciabatti1, Lorenzo Iovino1, Gabriele Buda1, Francesco Caracciolo1, Edoardo Benedetti1, Enrico Orciuolo1, Matteo Pelosini1, Giovanni Consani1, Giovanni Carulli1, Maria Rita Metelli3, Francesca Martini1, Francesco Mazziotta1,2, Elisa Mazzantini1, Pietro Rossi1, Rita Tavarozzi1, Federica Ricci1, Mario Petrini1† and Sara Galimberti1†
Abstract
Background: In addition to morphological and cytogenetic features, acute myeloid leukemias are characterized by mutations that can be used for target-therapy; also the minimal/measurable residual disease (MRD) could be an important prognostic factor. The purpose of this retrospective study was to investigate if somatic mutations could represent an additional prognostic value in respect of MRD alone.
Method: At baseline, 98 patients were tested for NPM1, FLT3, and for WT1 expression; 31 for ASXL1, TET2, IDH1, IDH2, N-RAS, WT1, c-KIT, RUNX1, and DNMT3A. The same genes have been also tested after induction and consolidation.
Results: Overall, 60.2% of our patients resulted mutated: 24.5% carried mutations of FLT3-ITD, 38.7% of NPM1, 48.4% of c-KIT, 25.8% of N-RAS and 19.3% of IDH2. The probability of achieving a complete response (CR) was higher for younger patients, with low ELN risk score, NPM1-mutated, with low WT1 levels, and without FLT3. The presence of additional mutations represented a poor predictive factor: only 19% of these cases achieved CR in comparison to 43% of subjects without any of it. Concerning survival, it was conditioned by a lower ELN risk score, younger age, reduc-tion > 1 log of the NPM1 mutational burden, disappearance of FLT3 mutations and lower WT1 expression. Regard-ing the role of the additional mutations, they impaired the outcome of 20% of the already MRD-negative patients. Concerning the possibility of predicting relapse, we observed an increase of the NPM1 mutational burden at the time-point immediately preceding the relapse (about 2 months earlier) in 50% of subjects. Similarly concerning WT1, an increase of its expression anticipated disease recurrence in 64% of cases.
Conclusions: We demonstrated that additional somatic mutations are able to impair outcome of the already MRD-negative subjects. About MRD, we suggest a prognostic role also for the WT1 expression. Finally, we considered as relevant the assessment of NPM1 quantity clearance instead of the presence/absence of mutations alone. Still remains in doubt the utility in terms of long-term prognosis of a baseline more complex mutational screening; we could hypothesize that it would be useful for those patients where other markers are not available or who reached the MRD negativity.
© The Author(s) 2019. This article is distributed under the terms of the Creative Commons Attribution 4.0 International License (http://creativecommons.org/licenses/by/4.0/), which permits unrestricted use, distribution, and reproduction in any medium, provided you give appropriate credit to the original author(s) and the source, provide a link to the Creative Commons license, and indicate if changes were made. The Creative Commons Public Domain Dedication waiver (http://creativecommons.org/publicdomain/zero/1.0/) applies to the data made available in this article, unless otherwise stated.
Open Access
Cancer Cell International
*Correspondence: [email protected] †Mario Petrini and Sara Galimberti equally contributed to the work1 Department of Clinical and Experimental Medicine, Section of Hematology, University of Pisa, Pisa, ItalyFull list of author information is available at the end of the article
Page 2 of 15Salehzadeh et al. Cancer Cell Int (2019) 19:83
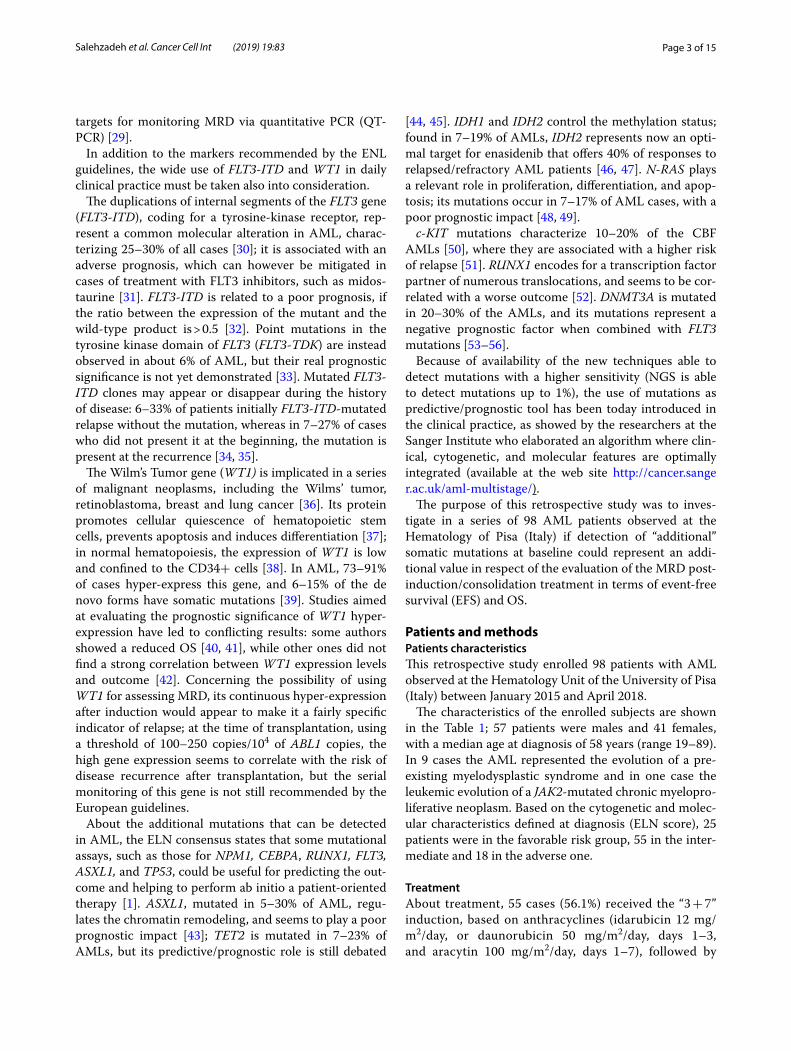
BackgroundAcute myeloid leukemia (AML), like other human malig-nant neoplasms, is a “dynamic” pathology, characterized by the acquisition of multiple somatic mutations, co-existing competing cellular clones, and clonal evolution over time. The individual and the genetic characteristics of the pathology represent the “classical” pre-treatment predictive and prognostic factors, but they are correct only in 75–80% of cases, indicating the importance of considering also further prognostic elements, such as the minimal/measurable residual disease (MRD) [1, 2].
Regarding the individual characteristics the most important parameters are represented by the perfor-mance status and age; in addition, the platelet count, the secondary nature of leukemia, the serum albumin and creatinine values, the leukocyte count and the percentage of blasts are other relevant variables.
According to the European Leukemia Network (ELN) classification, that includes also the cytogenetics, there are 3 classes of risk: favorable, intermediate and adverse. Compared to the previous version of guidelines edited in 2008, the ELN reccomandations state that, in the case of mutations of NPM1 and of the biallelic aberrations of CEBPA, the coexistence of chromosomal alterations does not seem to modify their respective prognostic impact [3, 4]. Furthermore, the association of mutations of NPM1 and FLT3-ITD with a low mutant/wild-type ratio (< 0.5), determines a similar (favorable) outcome, compared to that of patients carrying the mutation of NPM1 but without FLT3-ITD; on the contrary, the prognosis wors-ens with a mutant/wild-type ratio > 0.5 [5]. Analogously, mutations in RUNX1, ASXL1 and TP53, and the mono-somal karyotype [6] have been now added to the adverse category.
The MRD is now considered as an independent prog-nostic indicator: it can be evaluated using cytofluorimet-ric or molecular tools: quantitative PCR is the molecular method generally preferred, but new technologies are today emerging, such as digital PCR (d-PCR) and next-generation sequencing (NGS). The MRD denotes the presence of leukemic cells with a sensitivity between 1:10−4 and 1:10−6, much greater than that offered by the morphological evaluation (5%), and by cytogenetic tools (1%). The sensitivity of flow cytometry is estimated to be at least 10−4 [7, 8], and also this method is today available from many laboratories. Nonetheless important differ-ences between individual studies, an ever-growing body of data demonstrates that a positive MRD test at various time points identifies patients at particularly high risk
of relapse and short survival, even after adjustment for other risk factors [9–11]. The currently used molecular markers are represented by NPM1 mutations and rear-rangements of RUNX1-RUNXT1, CBFB-MYH11 and PML-RARA ; for cases without these alterations, the flow cytometry is considered the best technique for investigat-ing MRD.
The NPM1 gene gives rise to nucleophosmin, a protein involved in DNA repair, apoptosis and regulation of the ARF-TP53 axis [12]. NPM1 shuttles normally between the nucleus and the cytoplasm; it is a molecular chaper-one that prevents protein aggregation in the nucleolus and regulates the assembly and transport of preriboso-mal particles through the nuclear membrane [13, 14]. NPM1 mutations result in traffic alterations and aber-rant cytoplasmic dislocations of nucleophosmin. This unique immunohistochemical pattern led in 2005 to the discovery of NPM1 mutations in AML [15]. Although more than 50 types of mutations have been detected in exon 12, 3 specific types (A, B and D) cover the 95% of all possible NPM1 alterations [16]. The type A is the most common mutation, it is a duplication of a TCTG tetra-nucleotide at position 956 to 959 and accounts for up to 80% of cases. Mutations B and D are present in about 10% and 5% of NPM1-mutated AML [17]. The muta-tions of this gene characterize 30% of all forms of AML in adults [15], and reach a prevalence of 60% in cases with normal karyotype. NPM1 mutations have been demon-strated to have an important prognostic value: in patients without cytogenetic alterations, without the co-presence of FLT3-ITD, they are associated with an overall survival (OS) longer than 5 years in 50–60% of cases [18, 19]. The same prognostic role this gene played also when used as marker of MRD, both on bone marrow and peripheral blood [20–23]. Literature shows conflicting data about relapsed NPM1-mutated AML; in 10% of cases, patients relapsed without NPM1 mutations, so making confusing and debated the predictive role of this gene [20, 24, 25].
The “core-binding factor” (CBF) AMLs are charac-terized by specific chromosomal alterations: inv(16)(p13q22), t(16;16)(p13q22) leads to the CBFB-MYH11 fusion gene, and t(8;21)(q22; q22) leads to the RUNX1/RUNXT1, formerly known as AML1/ETO fusion gene [26]. These fusion genes are found in 5–10% of the AMLs [27]; the prognosis of these forms is generally positive, with the achievement of complete remission (CR) in 80–95% of cases, and a 5-year OS of 48% [28]. In case of relapse (30% of cases), both fusion genes reoccur before the frank hematological relapse, which makes them good
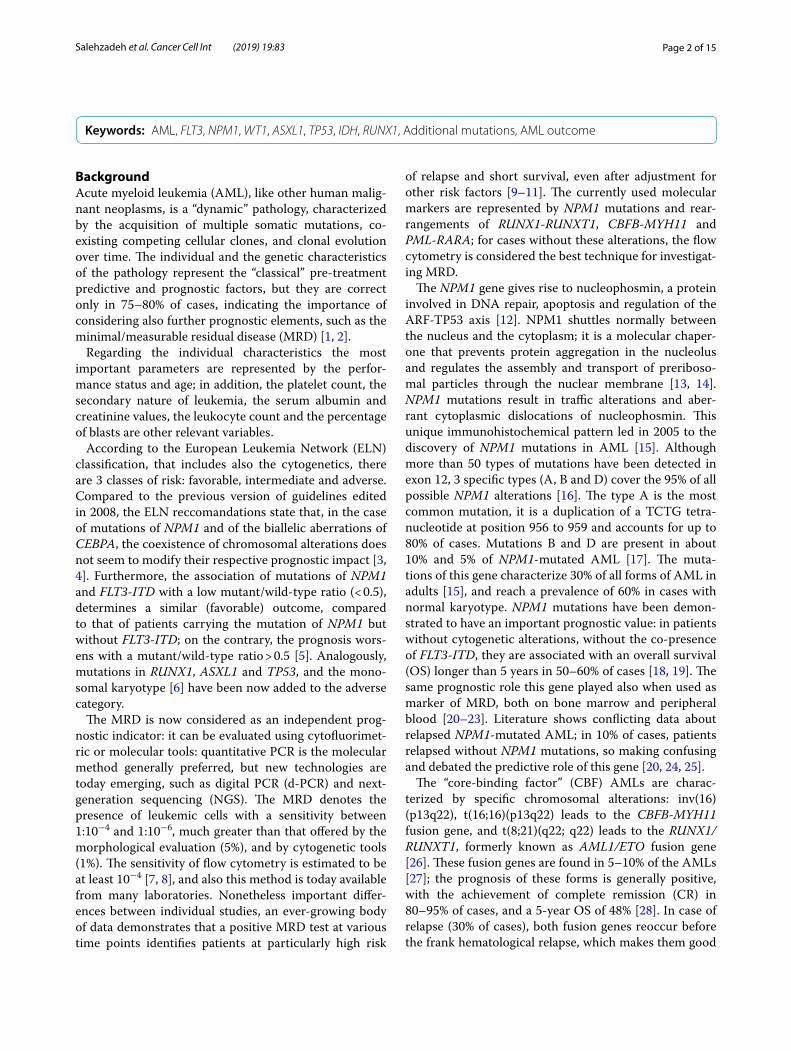
Keywords: AML, FLT3, NPM1, WT1, ASXL1, TP53, IDH, RUNX1, Additional mutations, AML outcome
Page 3 of 15Salehzadeh et al. Cancer Cell Int (2019) 19:83
targets for monitoring MRD via quantitative PCR (QT-PCR) [29].
In addition to the markers recommended by the ENL guidelines, the wide use of FLT3-ITD and WT1 in daily clinical practice must be taken also into consideration.
The duplications of internal segments of the FLT3 gene (FLT3-ITD), coding for a tyrosine-kinase receptor, rep-resent a common molecular alteration in AML, charac-terizing 25–30% of all cases [30]; it is associated with an adverse prognosis, which can however be mitigated in cases of treatment with FLT3 inhibitors, such as midos-taurine [31]. FLT3-ITD is related to a poor prognosis, if the ratio between the expression of the mutant and the wild-type product is > 0.5 [32]. Point mutations in the tyrosine kinase domain of FLT3 (FLT3-TDK) are instead observed in about 6% of AML, but their real prognostic significance is not yet demonstrated [33]. Mutated FLT3-ITD clones may appear or disappear during the history of disease: 6–33% of patients initially FLT3-ITD-mutated relapse without the mutation, whereas in 7–27% of cases who did not present it at the beginning, the mutation is present at the recurrence [34, 35].
The Wilm’s Tumor gene (WT1) is implicated in a series of malignant neoplasms, including the Wilms’ tumor, retinoblastoma, breast and lung cancer [36]. Its protein promotes cellular quiescence of hematopoietic stem cells, prevents apoptosis and induces differentiation [37]; in normal hematopoiesis, the expression of WT1 is low and confined to the CD34+ cells [38]. In AML, 73–91% of cases hyper-express this gene, and 6–15% of the de novo forms have somatic mutations [39]. Studies aimed at evaluating the prognostic significance of WT1 hyper-expression have led to conflicting results: some authors showed a reduced OS [40, 41], while other ones did not find a strong correlation between WT1 expression levels and outcome [42]. Concerning the possibility of using WT1 for assessing MRD, its continuous hyper-expression after induction would appear to make it a fairly specific indicator of relapse; at the time of transplantation, using a threshold of 100–250 copies/104 of ABL1 copies, the high gene expression seems to correlate with the risk of disease recurrence after transplantation, but the serial monitoring of this gene is not still recommended by the European guidelines.
About the additional mutations that can be detected in AML, the ELN consensus states that some mutational assays, such as those for NPM1, CEBPA, RUNX1, FLT3, ASXL1, and TP53, could be useful for predicting the out-come and helping to perform ab initio a patient-oriented therapy [1]. ASXL1, mutated in 5–30% of AML, regu-lates the chromatin remodeling, and seems to play a poor prognostic impact [43]; TET2 is mutated in 7–23% of AMLs, but its predictive/prognostic role is still debated
[44, 45]. IDH1 and IDH2 control the methylation status; found in 7–19% of AMLs, IDH2 represents now an opti-mal target for enasidenib that offers 40% of responses to relapsed/refractory AML patients [46, 47]. N-RAS plays a relevant role in proliferation, differentiation, and apop-tosis; its mutations occur in 7–17% of AML cases, with a poor prognostic impact [48, 49].
c-KIT mutations characterize 10–20% of the CBF AMLs [50], where they are associated with a higher risk of relapse [51]. RUNX1 encodes for a transcription factor partner of numerous translocations, and seems to be cor-related with a worse outcome [52]. DNMT3A is mutated in 20–30% of the AMLs, and its mutations represent a negative prognostic factor when combined with FLT3 mutations [53–56].
Because of availability of the new techniques able to detect mutations with a higher sensitivity (NGS is able to detect mutations up to 1%), the use of mutations as predictive/prognostic tool has been today introduced in the clinical practice, as showed by the researchers at the Sanger Institute who elaborated an algorithm where clin-ical, cytogenetic, and molecular features are optimally integrated (available at the web site http://cance r.sange r.ac.uk/aml-multi stage /).
The purpose of this retrospective study was to inves-tigate in a series of 98 AML patients observed at the Hematology of Pisa (Italy) if detection of “additional” somatic mutations at baseline could represent an addi-tional value in respect of the evaluation of the MRD post-induction/consolidation treatment in terms of event-free survival (EFS) and OS.
Patients and methodsPatients characteristicsThis retrospective study enrolled 98 patients with AML observed at the Hematology Unit of the University of Pisa (Italy) between January 2015 and April 2018.
The characteristics of the enrolled subjects are shown in the Table 1; 57 patients were males and 41 females, with a median age at diagnosis of 58 years (range 19–89). In 9 cases the AML represented the evolution of a pre-existing myelodysplastic syndrome and in one case the leukemic evolution of a JAK2-mutated chronic myelopro-liferative neoplasm. Based on the cytogenetic and molec-ular characteristics defined at diagnosis (ELN score), 25 patients were in the favorable risk group, 55 in the inter-mediate and 18 in the adverse one.
TreatmentAbout treatment, 55 cases (56.1%) received the “3 + 7” induction, based on anthracyclines (idarubicin 12 mg/m2/day, or daunorubicin 50 mg/m2/day, days 1–3, and aracytin 100 mg/m2/day, days 1–7), followed by

Page 4 of 15Salehzadeh et al. Cancer Cell Int (2019) 19:83
two cycles of consolidation with aracytin 500 mg/m2 every 12 h, days 1–6, plus daunorubicin 50 mg/m2/day, days 4–6. Seventeen patients (17.3%) were enrolled in the GIMEMA LAM1310 protocol, so they received as induction cytarabine 100 mg/m2/day (days 1–10), etoposide 50 mg/m2/day (days 1–5), daunorubicin 50 mg/m2/day (days 1, 3, 5) followed by a consolidation with cytarabine 500 mg/m2 every 12 h (days 1–6) and daunorubicin 50 mg/m2/day (days 4, 5, 6).
Thirteen subjects (13.3%) were treated with demethyl-ating agents, whereas 13 (13.3%) received only supportive therapies (etoposide, low-dose aracytin, fludarabine). In our series, 22 patients underwent to the myeloablative or reduced-intensity allogeneic transplant.
Clinical response assessmentComplete remission (CR) was defined as bone mar-row blasts < 5%, absence of circulating blasts or blasts with Auer rods, absence of extramedullary disease, ANC ≥ 1 × 10⁹/L, platelet count ≥ 100 × 109/L. CR with-out minimal residual disease (CRMRD−) required CR plus negativity for a genetic marker by PCR, or flow cytome-try. Partial remission (PR) was defined by all hematologic criteria of CR, decrease of bone marrow blast percentage to 5–25%, and decrease of pre-treatment bone marrow blast percentage by at least 50%.
Hematologic relapse required bone marrow blast per-centage ≥ 5% or reappearance of blasts in the blood or development of extramedullary disease. Molecu-lar relapse was defined as reoccurrence of pre-exist-ing molecular markers when assessed by PCR or flow cytometry.
Molecular analysesMolecular analyses were performed at the time of diagno-sis or just before the beginning of therapy, and repeated 30 days after induction and 30 days after consolidation. All cases were censored at the allogeneic transplantation time-point; during the follow-up, patients were followed for MRD every 3 months for 2–3 years, according to the medical decision.
At baseline, all samples were tested for BCR/ABL1, AML1/ETO, inv(16), NPM1 mutations, FLT3 mutations (FLT3-ITD and TDK), and WT1 expression. In addition, mutations of 11 genes already considered as significant in AML were assessed by PCR (see in the following).
Patients suffering from promyelocytic leukemia, which is a separate entity, were excluded from the study.
Nucleic acids extractionThe DNA extraction from 12 mL of bone marrow/periph-eral blood anti-coagulated with EDTA was performed using the automatic apparatus BioRobot EZ1, theEZ1 DNA Blood Card, and the EZ1 DNA Blood 350 µL Kit (Qiagen®, Valencia, CA, USA).
RNA extraction was performed using automatic appa-ratus Maxwell16 Promega and the Maxwell® RSC simply RNA Blood Kit (Promega®).
The extracted nucleic acids was quantitated using the Thermo Scientific Nano Drop 2000 spectrophotometer (Thermo Fisher Scientific®, Wilmington, DE, USA).
Quantitative analysis of NPM1 and WT1 expressionThe expression of NPM1 was evaluated by Ipsogen® NPM1 mutA MutaQuant® Kit, and Ipsogen® NPM1 mutB&D MutaQuant® Kit. Quantitative PCR for WT1
Table 1 Characteristics of patients
Number of patients 98
Age (median, range) 58 (19–89)
Sex
M 57
F 41
Onset
Primary 78 (80%)
Post-MDS/MPN 10 (10%)
Post-therapy 10 (10%)
Blasts % (median, range) 70 (20-95)
WBC, (median, range) x 109/L 7.9 (0.8–35)
Hb, (median, range) x g/dL 9.6 (4–15.5)
PLT, (median, range) x 109/L 50.5 (1.7–656)
Karyotype
Normal 40 (41%)
Abnormal 43 (44%)
Complex 15 (15%)
WHO classification
With recurrent abnormalities 44 (44%)
MDS-related 10 (10%)
Post-therapy 10 (10%)
Provisional entities 12 (12%)
NOS 19 (19%)
Myeloid sarcoma 3 (3%)
ELN risk
Favorable 25 (25.5%)
Intermediate 55 (56.1%)
Adverse 18 (18.4%)
Treatment
3 + 7 55 (56.1%)
Demethylating agents 13 (13.3%)
LAM 1310 17 (17.3%)
Supportive therapies 13 (13.3%)
AlloBMT 22 (22%)
Page 5 of 15Salehzadeh et al. Cancer Cell Int (2019) 19:83
expression was performed with the Ipsogen® WT1 ProfileQuant® Kit. The sensitivities specified by the man-ufacturer were 0.01%. Both analyses were performed on CFX Connect® (Bio-Rad).
Qualitative analysis for FLT3 ITD mutationsQualitative PCR for FLT3-ITD mutations was performed as already described [30, 57]; sensitivity was 0.5% and PCR products were analyzed by capillary electrophoresis.
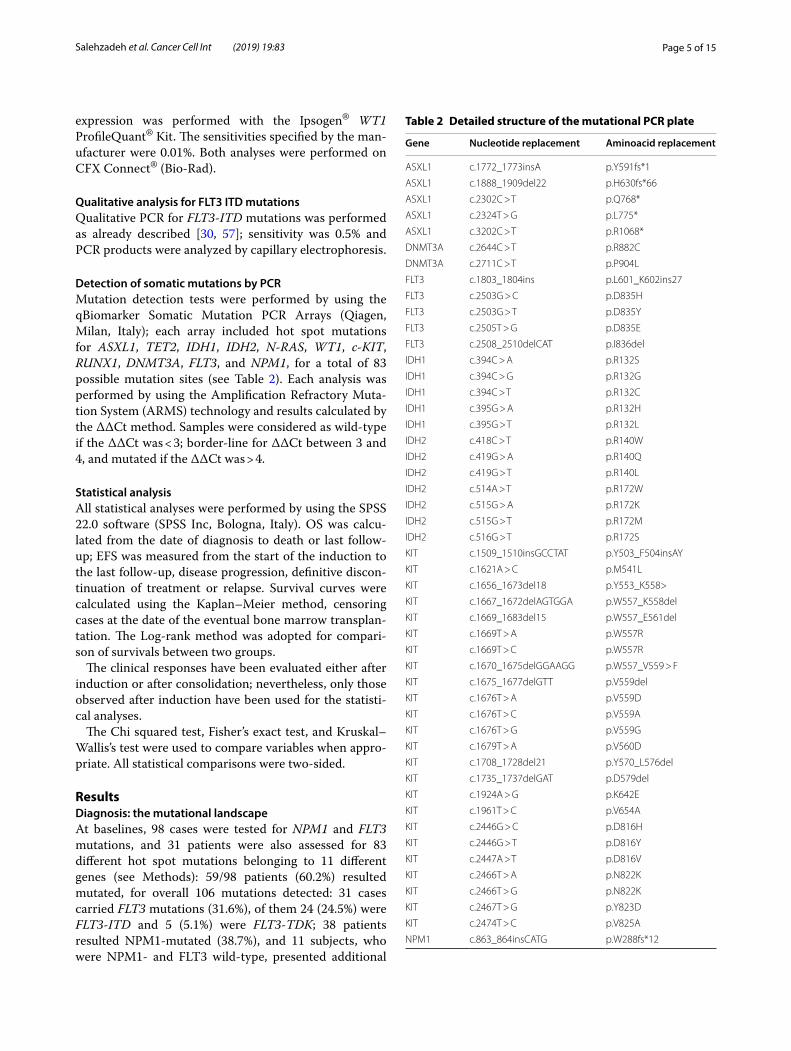
Detection of somatic mutations by PCRMutation detection tests were performed by using the qBiomarker Somatic Mutation PCR Arrays (Qiagen, Milan, Italy); each array included hot spot mutations for ASXL1, TET2, IDH1, IDH2, N-RAS, WT1, c-KIT, RUNX1, DNMT3A, FLT3, and NPM1, for a total of 83 possible mutation sites (see Table 2). Each analysis was performed by using the Amplification Refractory Muta-tion System (ARMS) technology and results calculated by the ΔΔCt method. Samples were considered as wild-type if the ΔΔCt was < 3; border-line for ΔΔCt between 3 and 4, and mutated if the ΔΔCt was > 4.
Statistical analysisAll statistical analyses were performed by using the SPSS 22.0 software (SPSS Inc, Bologna, Italy). OS was calcu-lated from the date of diagnosis to death or last follow-up; EFS was measured from the start of the induction to the last follow-up, disease progression, definitive discon-tinuation of treatment or relapse. Survival curves were calculated using the Kaplan–Meier method, censoring cases at the date of the eventual bone marrow transplan-tation. The Log-rank method was adopted for compari-son of survivals between two groups.
The clinical responses have been evaluated either after induction or after consolidation; nevertheless, only those observed after induction have been used for the statisti-cal analyses.
The Chi squared test, Fisher’s exact test, and Kruskal–Wallis’s test were used to compare variables when appro-priate. All statistical comparisons were two-sided.
ResultsDiagnosis: the mutational landscapeAt baselines, 98 cases were tested for NPM1 and FLT3 mutations, and 31 patients were also assessed for 83 different hot spot mutations belonging to 11 different genes (see Methods): 59/98 patients (60.2%) resulted mutated, for overall 106 mutations detected: 31 cases carried FLT3 mutations (31.6%), of them 24 (24.5%) were FLT3-ITD and 5 (5.1%) were FLT3-TDK; 38 patients resulted NPM1-mutated (38.7%), and 11 subjects, who were NPM1- and FLT3 wild-type, presented additional
Table 2 Detailed structure of the mutational PCR plate
Gene Nucleotide replacement Aminoacid replacement
ASXL1 c.1772_1773insA p.Y591fs*1
ASXL1 c.1888_1909del22 p.H630fs*66
ASXL1 c.2302C > T p.Q768*
ASXL1 c.2324T > G p.L775*
ASXL1 c.3202C > T p.R1068*
DNMT3A c.2644C > T p.R882C
DNMT3A c.2711C > T p.P904L
FLT3 c.1803_1804ins p.L601_K602ins27
FLT3 c.2503G > C p.D835H
FLT3 c.2503G > T p.D835Y
FLT3 c.2505T > G p.D835E
FLT3 c.2508_2510delCAT p.I836del
IDH1 c.394C > A p.R132S
IDH1 c.394C > G p.R132G
IDH1 c.394C > T p.R132C
IDH1 c.395G > A p.R132H
IDH1 c.395G > T p.R132L
IDH2 c.418C > T p.R140W
IDH2 c.419G > A p.R140Q
IDH2 c.419G > T p.R140L
IDH2 c.514A > T p.R172W
IDH2 c.515G > A p.R172K
IDH2 c.515G > T p.R172M
IDH2 c.516G > T p.R172S
KIT c.1509_1510insGCC TAT p.Y503_F504insAY
KIT c.1621A > C p.M541L
KIT c.1656_1673del18 p.Y553_K558>
KIT c.1667_1672delAGT GGA p.W557_K558del
KIT c.1669_1683del15 p.W557_E561del
KIT c.1669T > A p.W557R
KIT c.1669T > C p.W557R
KIT c.1670_1675delGGA AGG p.W557_V559 > F
KIT c.1675_1677delGTT p.V559del
KIT c.1676T > A p.V559D
KIT c.1676T > C p.V559A
KIT c.1676T > G p.V559G
KIT c.1679T > A p.V560D
KIT c.1708_1728del21 p.Y570_L576del
KIT c.1735_1737delGAT p.D579del
KIT c.1924A > G p.K642E
KIT c.1961T > C p.V654A
KIT c.2446G > C p.D816H
KIT c.2446G > T p.D816Y
KIT c.2447A > T p.D816V
KIT c.2466T > A p.N822K
KIT c.2466T > G p.N822K
KIT c.2467T > G p.Y823D
KIT c.2474T > C p.V825A
NPM1 c.863_864insCATG p.W288fs*12

Page 6 of 15Salehzadeh et al. Cancer Cell Int (2019) 19:83
mutations (11.2%). The overall prevalence of mutations in our series is reported in the Table 3 and in more detail in the Heat Map (see Additional file 1).
In the 38 cases with NPM1 mutations, 29 (76.3%) were type A, 3 (7.9%) were type B and 6 (15.8%) were type D. Regarding ELN risk category, 25 (65.8%) were in the ”favorable” group, 12 (31.6%) were in the “interme-diate”, and 1 (2.6%) case presented an “adverse” score, due to the finding of a complex karyotype (p < 0.01). The quantitative PCR showed at baseline a NPM1 mean mutational burden of 380 (range 0.03–940).
In subjects with FLT3-ITD mutations, 5 (20.8%) were included in the ”favorable” ELN category, 14 (58.4%) in
the “intermediate”, and 5 (20.8%) in the “adverse” one. In 16 out of 24 cases (66.7%), the mutant/wild-type allelic ratio was > 0.5; at baseline, the median allelic ratio was 0.72 (range 0.01–4.4).
Overall 71% of our patients showed at least an addi-tional mutation: the most common are resulted c-KIT, with 15 out of the 31 tested patients (48.4%) showing these DNA abnormalities, followed by N-RAS, mutated in 8 cases (25.8%). Moreover, 6 cases (19.3%) carried muta-tions of IDH2, and 3 patients (9.6%) of IDH1; 3 patients were mutated for RUNX1 (9.6%), 4 cases (12.9%) for WT1, while DNMT3A mutations were found in 3 cases (9.6%). No patients presented TET2 or ASXL1 mutations. Overall, 34.7% of all patients presented > 1 mutation; no clustered associations were observed in our series.
Concerning WT1, patients were distinguished based on its expression level in WT1high and WT1low, consider-ing as cut-off values those identified by the manufacturer (50/10−4 ABL1 copies for PB and 250/10−4 ABL1 copies for BM) [58]. Eighty-three of our patients (84.6%) showed a high WT1 expression, with values ranging from 499 to 18,885, and a mean of 6145. WT1 expression levels were not significantly different according to sex, age, WHO classification, or cytogenetic score.
Predictive and prognostic value of the clinical and genomic features at diagnosisAt the end of the induction, 77 of the initial 98 cases were evaluable; the 21 cases lost to follow-up were those who came back to the near local centers that usually refer patients to Pisa for the initial centralized diagnosis and therapeutic decisions.
After induction, 60% of our patients achieved a CR, and 12.3% a PR, for an overall response rate (ORR) of 72.3%; after consolidation, the CR rate increased to 76.3%, and the PR rate to 15.8%, for an ORR of 92.1%. When CR rates where compared between the classic “3 + 7” and the GIMEMA LAM 1310 trial, no differences were observed.
We evaluated the predictive value (in terms of qual-ity of response) of the clinical and genetic features: gen-der (female versus male), age (cut off 65 years), ELN risk score, presence or absence of a complex karyotype, white blood cells count (WBC), platelets count (PLT), hemoglobin values (Hb), number of blasts, mutational landscape (FLT3, NPM1, additional mutations and WT1 expression levels).
We found that the age at diagnosis < 65 years and a “favorable” ELN score were the parameters capable of significantly predicting the attainment of CR. In particu-lar, 85% of subjects younger than 65 years achieved CR versus 46% of patients over 65 (p = 0.002); on the other hand, in the group of non-responsive patients, only 11% were in the “favorable” ELN risk category, while 42% and
Table 2 (continued)
Gene Nucleotide replacement Aminoacid replacement
NPM1 c.863_864insCCGG p.W288fs*12
NPM1 c.863_864insCCTG p.W288fs*12
NPM1 c.863_864insTATG p.W288fs*12
NPM1 c.863_864insTCTG p.W288fs*12
NRAS c.181C > A p.Q61K
NRAS c.182A > C p.Q61P
NRAS c.182A > G p.Q61R
NRAS c.182A > T p.Q61L
NRAS c.183A > C p.Q61H
NRAS c.183A > T p.Q61H
NRAS c.34G > A p.G12S
NRAS c.34G > T p.G12C
NRAS c.35G > A p.G12D
NRAS c.35G > C p.G12A
NRAS c.35G > T p.G12V
NRAS c.37G > C p.G13R
NRAS c.37G > T p.G13C
NRAS c.38G > A p.G13D
NRAS c.38G > C p.G13A
NRAS c.38G > T p.G13V
NRAS c.52G > A p.A18T
RUNX1 c.167T > C p.L56S
RUNX1 c.319C > T p.R107C
RUNX1 c.496C > T p.R166*
RUNX1 c.592G > A p.D198 N
RUNX1 c.593A > G p.D198G
RUNX1 c.602G > A p.R201Q
RUNX1 c.611G > A p.R204Q
TET2 c.1648C > T p.R550*
TET2 c.2746C > T p.Q916*
WT1 c.1168C > T p.R390*
WT1 c.906_907insT p.V303fs*14
WT1 c.938C > A p.S313*
WT1 c.940_941insTCGG p.A314fs*4

Page 7 of 15Salehzadeh et al. Cancer Cell Int (2019) 19:83
46% were at “intermediate” and “adverse” risk, respec-tively (p = 0.042).
As concerns the molecular variables, a significant corre-lation emerged between NPM1 status and the probability of obtaining CR: as expected, 78% of the NPM1-mutated patients obtained an excellent response compared to 42% of NPM1-wild type subjects (p = 0.008). When CR rate were compared between the two induction regi-mens (“3 + 7” vs GIMEMA LAM 1310), the impact of the NPM1 mutations on the CR achievement still remained significant only in the 3 + 7 cohort (p = 0.006).
The presence of FLT3 mutations did not significantly correlate with CR; however, even in this case, the initial mutational burden was predictive of the response, with mutated/wild-type allele ratio of 1.37 ± 0.44 in failing cases versus 0.67 ± 0.55 of cases achieving CR (p = 0.034).
Finally, also the presence of additional mutations repre-sented a poor predictive factor: indeed, only 19% of cases with additional mutations achieved CR after induction in comparison to 43% of the subjects without any somatic mutations, independently from the presence of NPM1 or FLT3 mutations (p = 0.041).
On the contrary, basal WT1 expression levels did not significantly impact on the CR achievement.
During follow-up, 45 out of the 77 evaluable cases (58.4%) died, 56 (72.7%) relapsed and underwent to a re-induction treatment with the re-obtainment of response in half of the cases, mostly after the FLANG regimen (association of fludarabine, cytarabine and mitoxantrone).
Concerning the prognostic value, we assessed firstly if the clinical and mutational characteristics found at
baseline could significantly affect OS and EFS of our patients.
In the whole series, the 12- and 24-months OS were 43% and 30%, respectively; 24-months OS reached 90% in cases enrolled in the GIMEMA AML 1310 trial (see “Patients and methods” section), probably because in that study younger cases with a better performance sta-tus were enrolled (p < 0.001). No differences in terms of length of survival have been observed between cases treated with demethylating agents in comparison to 3 + 7 regimen (anthracyclines and aracytin) (Fig. 1a). EFS was 32% at 12 months, and 19% at 24 months in the whole series; even in this case, patients enrolled in the GIMEMA trial showed a clear advantage, with 24 months-EFS of 65% versus 12% of the subjects receiv-ing 3 + 7 and 8% of those receiving demethylating drugs (p < 0.01) (Fig. 1b).
Regarding the clinical features, OS was significantly higher for younger subjects, with a median OS of 20 months for patients < 65 years versus 4 months for those > 65 years (p < 0.001). The OS was significantly con-ditioned by the response to induction therapy, with the median not reached at 12 months by patients in CR com-pared to only 3 months for those who achieved only a PR or did not respond to treatment (p < 0.001) (Fig. 2a). Also EFS was significantly conditioned by the response to therapy, with 43% of patients in CR who were free from events at 12-months versus 18% of those who did not reach a complete response (p < 0.001) (Fig. 2b).
Moreover, OS, but not EFS, was significantly condi-tioned by the ELN risk score, with 57% of patients liv-ing at 12 months in the subgroup of those at “favorable” risk versus 40% of those at “intermediate/adverse risk” (p = 0.04) (Fig. 3a, b).
Concerning the mutational landscape, none of the molecular parameters analyzed at baseline (mutation of NPM1, FLT3-ITD including their mutational burden, over-expression of WT1, presence of somatic mutations) resulted to significantly condition OS or EFS.
MRD: FLT3, NPM1 and WT1After induction, 39% of the initially NPM1-mutated cases became MRD-negative; in the still positive subjects, the mutational burden reduced from a mean value of 380 to 35 (reduction > 1 log).
On the other end, 60% of the FLT3-mutated cases became negative; differently from the NPM1, for this marker no significant quantitative changes were measured.
Finally, in the subgroup of patients with concomitant NPM1 and FLT3 mutations, 60% of patients achieved the MRD negativity; interestingly, in 12% of them a dif-ferent behavior between FLT3 and NPM1 was observed
Table 3 Prevalence of all mutation
Mutation % in whole series (%)
Overall mutational rate 60.2
NPM1 38.7
FLT3-ITD 24.5
c-KIT 48.4
N-RAS 25.8
IDH1 9.6
FLT3-TDK 5.1
IDH2 19.3
DNMT3A 9.6
WT1 12.9
RUNX1 9.6
TET2 0
ASXL1 0
WT1 high (expression) 84.6

Page 8 of 15Salehzadeh et al. Cancer Cell Int (2019) 19:83
(cases already FLT3-ITD-negative sometimes still remaining NPM1-positive). This phenomenon could be probably related to a different sensitivity of the used molecular techniques (10−4 for NPM1 and 10−2 for FLT3-ITD).
After induction, 55% of WT1high cases reduced their molecular burden, whereas 25% of WT1low patients increased the gene expression levels; nevertheless,
therapy allowed the mutational burden to reduce from 4575/10−4 to 93.50/10−4.
Overall, after the initial treatment, the number of patients carrying mutations decreased from 74 to 57.4%.
Predictive and prognostic value of MRDIn the MRD predictive and prognostic evaluation all patients who achieved CR (46) were included.
Fig. 1 Therapeutic regimens. No differences in terms of length of survival have been observed between cases treated with demethylating agents in comparison to 3 + 7 regimen (a). EFS was 32% at 12 months, and 19% at 24 months in the whole series; even in this case, patients enrolled in the GIMEMA trial showed a clear advantage, with 24 months-EFS of 65% versus 12% of the subjects receiving 3 + 7 and 8% of those receiving demethylating drugs (p < 0.001) (b)

Page 9 of 15Salehzadeh et al. Cancer Cell Int (2019) 19:83
When we assessed the prognostic role of MRD, we found that: 1) the entity of clearance of NPM1 muta-tional load significantly conditioned both OS and EFS, with 100% of subjects being alive at 12 months in the cohort of those showing a reduction > 1 log versus 44% of those with a reduction < 1 log (p = 0.05). Analogously, the 12-months EFS was 71% for patients with a reduction > 1 log versus 0% of those with a reduction < 1 log (p = 0.005).
The one log reduction has been chosen as a cut-off as it represented the average reduction of mutational burden of our patients between diagnosis and post-induction. It has to be considered that, at the opposite, the qualitative status of NPM1 (mutated or wild-type) after induction treatment did not significantly impact on survival.
2) the clearance of FLT3 played a favorable impact on both OS and EFS: indeed, the median OS was 4 months
Fig. 2 Response to induction therapy. The OS was significantly conditioned by the response to therapy, with the median not reached at 12 months by patients in CR compared to only 3 months for those who achieved only a PR or did not respond to treatment (p < 0.001) (a). Also EFS was significantly conditioned, with 43% of patients in CR who were free from events at 12-months versus 18% of those who did not reach a complete response (p < 0.001) (b)

Page 10 of 15Salehzadeh et al. Cancer Cell Int (2019) 19:83
for still FLT3-mutated cases versus not reached in the group of patients who became FLT3-negative (p = 0.008), and EFS was 0% for MRD-positive cases versus 73% for the MRD-negative ones (p = 0.004).
3) the WT1 expression levels significantly impacted on survival: the 12-months OS was 83% for cases with low levels after induction versus 29% for those with high WT1 expression levels (p = 0.008) (Fig. 4a), and
EFS was 0% for cases with high versus 61% for those with low WT1 expression (p < 0.001) (Fig. 4b).
4) about somatic mutations, nor OS or EFS were signif-icantly conditioned by the presence/absence of additional mutations at baseline.
Then, we combined data becoming from the MRD sta-tus with the presence/absence of some somatic muta-tions at baseline in order to test if these mutations could
Fig. 3 ELN risk score. OS (a), but not EFS (b), was significantly conditioned by the ELN risk score, with 57% of patients living at 12 months in the subgroup of those at “favorable” risk versus 40% of those at “intermediate/adverse risk” (p = 0.04)

Page 11 of 15Salehzadeh et al. Cancer Cell Int (2019) 19:83
represent an adjunctive value to the assessment of MRD, so to justify a further molecular analysis in all our patients at diagnosis. No differences were observed in terms of EFS; concerning OS, we observed that in the subgroup of MRD-negative cases the presence of additional mutations
at baseline impaired OS of 20%, even if this value did not reach the statistical significance probably because of the small number of patients enrolled.
In conclusion, even if the somatic mutations revealed to have a significant negative predictive power in terms of
Fig. 4 WT1 expression levels. The WT1 expression levels significantly impacted on survival: the 12-months OS was 83% for cases with low levels after induction versus 29% for those with high WT1 expression levels (p = 0.008) (a), and EFS was 0% for cases with high versus 61% for those with low WT1 expression (p < 0.001) (b)

Page 12 of 15Salehzadeh et al. Cancer Cell Int (2019) 19:83
quality of response to the induction, their prognostic role remains a matter of debate.
Regarding the possibility of predicting relapse/pro-gression by NPM1, FLT3-ITD or WT1 behavior, we per-formed longitudinal molecular assays during follow-up in 26 cases.
Among patients with NPM1 mutations at diagnosis, 22% relapsed: when we backtracked the molecular sta-tus of this gene, we observed in half of cases an increase of the mutational burden at the time-point immediately preceding the hematological relapse (about 2 months earlier).
In the subgroup of the FLT3-mutated patients, neither the persistence of mutations nor their ratio showed any “anticipatory” predictive power.
Concerning WT1, an increase of its expression levels was able to anticipate disease recurrence in 7/11 relapsed cases (64%).
Overall, even if a small series of cases, we would sug-gest that the quantitative monitoring of NPM1 and WT1 could be worth of being performed in the routine clinical practice.
DiscussionThe use in the clinical practice of MRD evaluation for predicting response to the induction treatment or long-term prognosis is still a hot topic for discussion, given the lack of variables that represent certain powerful factors, even if the use of advanced cytofluorimetric and molecu-lar techniques in the definition of MRD largely improved the sensitivity deriving only from the morphological evaluations.
In this work, even if with the limit of a retrospective and small study, we reviewed the histories of 98 patients affected by AML afferent to our Hematology Unit from 2015 to 2018, focusing mainly on the identification of fac-tors eventually able to predict response and survival.
In particular, we wondered if: (1) the evaluation of molecular MRD could have a real prognostic value; (2) which of the possible candidate genes among FLT3-ITD, NPM1, and WT1 would reveal the highest prognostic significance, but especially (3) if the assessment of some additional somatic mutations at diagnosis could repre-sent an adjunctive prognostic value in respect to the eval-uation of MRD alone.
Obviously, we have firstly to consider that ELN suggests the monitoring of MRD as part of the standards of care for AML patients and that the recommended molecular markers are the core-binding factors translocations, the NPM1 mutations and, in acute promyelocytic leuke-mia, the PML-RARA translocation.
According to the ELN suggestions, WT1 expression should not be used, except in cases that do not show
other “validated” molecular markers, because of the low sensitivity and specificity of this gene.
Finally, also monitoring of FLT3-ITD mutations is not yet recommended, because mutations of this gene may occur at relapse with several additional gene segments or deletions different from those observed at diagnosis [2].
Concerning the molecular markers, our attention was mainly focused on three genes already commonly used in the clinical practice: mutations of NPM1 and FLT3-ITD, and WT1 expression levels.
Regarding NPM1, our study, in accordance with the ELN recommendations and literature [23, 59], confirmed its important prognostic role, reaching the conclusion that the rapid reduction of its mutational burden after induction (> 1 log) would be a potential valid predictive/prognostic tool. In addition, this observation well fits with what emerged in the context of other hematologi-cal diseases, such as in chronic myeloid leukemia, where the early and rapid reduction of the BCR-ABL1 transcript during treatment with tyrosine kinase inhibitors is asso-ciated with a greater probability of obtaining the deep molecular response and prolonged OS [60].
Contrary to what suggested by ELN, our study also attributed a significant prognostic value to the WT1 expression and to the FLT3-ITD mutations. We observed that MRD negativity for FLT3-ITD were obtained earlier than that for NPM1, although no specific FLT3 inhibitors were used in combination with the induction therapy. This observation could be probably linked to the differ-ent sensitivity of methods used for molecular analyses: in fact, the sensitivity of the tests for NPM1 resulted, in our hands, more than one logarithm higher than that of PCR used for assessing the FLT3 mutations.
As further novelty, we assessed by a simple PCR meth-ods the presence of 83 possible hot spot mutations (in 11 genes) at baseline, in order to initially better charac-terize our patients. Of course we analyzed only few and arbitrarily chosen genes, but we supposed that this addi-tional mutational load (selected among the most relevant genes in AML) could play an important prognostic/pre-dictive role. Indeed, we already demonstrated that the addition of these mutational evaluations to the Sanger’s algorithm (see Introduction) impaired the prognosis of more than half of cases (data submitted). Moreover, the technical novelty was also the employ of PCR instead of NGS for detecting mutations, with an evident and prac-tical advantage also for small laboratories where NGS is not still suitable. In our series the additional mutations clearly played a negative impact on the achievement of a satisfying response to the induction. On the contrary, they did not achieve the statistical significance in terms of OS or EFS probably because the small number of patients tested in this study (31), nevertheless the presence of

Page 13 of 15Salehzadeh et al. Cancer Cell Int (2019) 19:83
these mutations impaired the prognosis in the 20% of cases defined as MRD-negative. Obviously, further and larger prospective studies will be necessary for defini-tively understand if the assessment of these mutations could be really cost-effective in the daily routine.
ConclusionsIn conclusion, our results, even if coming from a quite small and retrospective study, are substantially in line with the international recommendations. In addition to data already published, we demonstrated that additional somatic mutations, present in a large number of cases, are able to impair outcome of the already MRD-negative subjects. About MRD, our results suggest a prognostic role also for the WT1 expression. Finally we considered as relevant the assessment of NPM1 quantity clearance instead of the presence/absence of mutations alone.
Still remains in doubt the utility in terms of long-term prognosis of a baseline more complex and large muta-tional screening (perhaps performed by NGS); on the basis of our results, we could hypothesize that it would be useful for those patients where other markers (such as WT1, FLT3-ITD, and NPM1) are not available. Neverthe-less, we have to not forget that a good characterization of our AML patients is today more and more necessary for leading ab initio the choice of the most appropriate treatment, in the new era where target therapies, such as those against FLT3, c-KIT, IDH1 or IDH2 are a reality.
Additional file
Additional file 1. Mutation prevalence heat map. Graphical representa-tion of the overall prevalence of mutations in each patient of our series at baseline. Mutated in red, wild-type in green, yellow for normal expression level, orange for higher gene expression.
AbbreviationsAML: acute myeloid leukemia; EFS: event free survival; OS: overall survival; MRD: minimal/measurable residual disease; ELN: European Leukemia Network; NGS: next-generation sequencing; CBF: core-binding factor; CR: complete remission; CRMRD−: complete remission without minimal/measurable residual disease; PR: partial remission; ORR: overall response rate; WBC: white blood count; PLT: platelets count; Hb: hemoglobin values.
Authors’ contributionsSG, MP, and SS conceived and designed the study. FG, SS, SG, EC and UP performed PCR assays. MRM supervised PCR performances. GC performed the cytofluorimetric analysis. FC, GB, EB, EO, MP, GC, LI, FM, FM, EM, PR, RT and FR treated patients. SG, SS and MP analyzed data and wrote the manuscript. All authors revised the paper. All authors read and approved the final manuscript.
Author details1 Department of Clinical and Experimental Medicine, Section of Hematol-ogy, University of Pisa, Pisa, Italy. 2 GeNOMEC School of Doctorate, University of Siena, Siena, Italy. 3 Molecular Laboratory of Hematology, AOUP, Pisa, Italy. 4 University of Rome Tor Vergata, Rome, Italy. 5 Ospedale S. Chiara, UO Emato-logia, Via Roma, 67, 56126 Pisa, Italy.
AcknowledgementsAuthors thank all patients who participated to the study and the AIL Pisa for its financial support.
Competing interestsThe authors declare that they have no competing interests.
Availability of data and materialsThe data of the study are available from the corresponding author on reason-able request.
Consent of publicationNot applicable.
Ethics approval and consent to participateThis study was carried out in accordance with the recommendations of Good Clinical Practice. All subjects gave written informed consent to leave leftover from the routine diagnostic samples for further no-profit studies, in accord-ance with the Declaration of Helsinki.
FundingThis work was partially supported by the Italian Leukemia Association (AIL) Pisa and by the University of Pisa.
Publisher’s NoteSpringer Nature remains neutral with regard to jurisdictional claims in pub-lished maps and institutional affiliations.
Received: 3 December 2018 Accepted: 28 March 2019
References 1. Döhner H, Estey E, Grimwade D, Amadori S, Appelbaum FR, Büchner T,
et al. Diagnosis and management of AML in adults: 2017 ELN recommen-dations from an international expert panel. Blood. 2017;129:424–47.
2. Schuurhuis GJ, Heuser M, Freeman S, Béné M-C, Buccisano F, Cloos J, et al. Minimal/measurable residual disease in AML: a consensus docu-ment from the European LeukemiaNet MRD Working Party. Blood. 2018;131:1275–91.
3. Micol JB, Boissel N, Renneville A, Castaigne S, Gardin C, Preudhomme C, et al. The role of cytogenetic abnormalities in acute myeloid leukemia with NPM1 mutations and no FLT3 internal tandem duplication. Blood. 2009;114:4601–2 (author reply 4602-4603).
4. Haferlach C, Mecucci C, Schnittger S, Kohlmann A, Mancini M, Cuneo A, et al. AML with mutated NPM1 carrying a normal or aberrant karyotype show overlapping biologic, pathologic, immunophenotypic, and prog-nostic features. Blood. 2009;114:3024–32.
5. Gale RE, Green C, Allen C, Mead AJ, Burnett AK, Hills RK, et al. The impact of FLT3 internal tandem duplication mutant level, number, size, and inter-action with NPM1 mutations in a large cohort of young adult patients with acute myeloid leukemia. Blood. 2008;111:2776–84.
6. Breems DA, Van Putten WLJ, De Greef GE, Van Zelderen-Bhola SL, Gerssen-Schoorl KBJ, Mellink CHM, et al. Monosomal karyotype in acute myeloid leukemia: a better indicator of poor prognosis than a complex karyotype. J Clin Oncol. 2008;26:4791–7.
7. Terwijn M, van Putten WLJ, Kelder A, van der Velden VHJ, Brooimans RA, Pabst T, et al. High prognostic impact of flow cytometric minimal residual disease detection in acute myeloid leukemia: data from the HOVON/SAKK AML 42A study. J Clin Oncol. 2013;31:3889–97.
8. Vidriales MB, San-Miguel JF, Orfao A, Coustan-Smith E, Campana D. Mini-mal residual disease monitoring by flow cytometry. Best Pract Res Clin Haematol. 2003;16:599–612.
9. Buccisano F, Hourigan CS, Walter RB. The prognostic significance of measurable (“Minimal”) residual disease in acute myeloid leukemia. Curr Hematol Malig Rep. 2017;12:547–56.
10. Buccisano F, Maurillo L, Del Principe MI, Di Veroli A, De Bellis E, Biagi A, et al. Minimal residual disease as a biomarker for outcome prediction and

Page 14 of 15Salehzadeh et al. Cancer Cell Int (2019) 19:83
therapy optimization in acute myeloid leukemia. Expert Rev Hematol. 2018;11:307–13.
11. Del Principe MI, Buccisano F, Maurillo L, Sconocchia G, Cefalo M, Consalvo MI, et al. Minimal residual disease in acute myeloid leukemia of adults: determination, prognostic impact and clinical applications. Mediterr J Hematol Infect Dis. 2016;8:e2016052.
12. Lindström MS. NPM1/B23: a multifunctional chaperone in ribosome bio-genesis and chromatin remodeling. Biochem Res Int. 2011;2011:195209.
13. Borer RA, Lehner CF, Eppenberger HM, Nigg EA. Major nucleolar proteins shuttle between nucleus and cytoplasm. Cell. 1989;56:379–90.
14. Dumbar TS, Gentry GA, Olson MO. Interaction of nucleolar phosphopro-tein B23 with nucleic acids. Biochemistry. 1989;28:9495–501.
15. Falini B, Mecucci C, Tiacci E, Alcalay M, Rosati R, Pasqualucci L, et al. Cyto-plasmic nucleophosmin in acute myelogenous leukemia with a normal karyotype. N Engl J Med. 2005;352:254–66.
16. Falini B, Martelli MP, Bolli N, Sportoletti P, Liso A, Tiacci E, et al. Acute myeloid leukemia with mutated nucleophosmin (NPM1): is it a distinct entity? Blood. 2011;117:1109–20.
17. Falini B, Nicoletti I, Martelli MF, Mecucci C. Acute myeloid leukemia carry-ing cytoplasmic/mutated nucleophosmin (NPMc + AML): biologic and clinical features. Blood. 2007;109:874–85.
18. Schnittger S, Schoch C, Kern W, Mecucci C, Tschulik C, Martelli MF, et al. Nucleophosmin gene mutations are predictors of favorable progno-sis in acute myelogenous leukemia with a normal karyotype. Blood. 2005;106:3733–9.
19. Schlenk RF, Döhner K, Krauter J, Fröhling S, Corbacioglu A, Bullinger L, et al. Mutations and treatment outcome in cytogenetically normal acute myeloid leukemia. N Engl J Med. 2008;358:1909–18.
20. Hills RK, Ivey A, Grimwade D, UK National Cancer Research Institute (NCRI) AML Working Group. Assessment of minimal residual disease in standard-risk AML. N Engl J Med. 2016;375:9.
21. Krönke J, Schlenk RF, Jensen K-O, Tschürtz F, Corbacioglu A, Gaidzik VI, et al. Monitoring of minimal residual disease in NPM1-mutated acute myeloid leukemia: a study from the German-Austrian acute myeloid leukemia study group. J Clin Oncol. 2011;29:2709–16.
22. Mencia-Trinchant N, Hu Y, Alas MA, Ali F, Wouters BJ, Lee S, et al. Minimal residual disease monitoring of acute myeloid leukemia by massively multiplex digital PCR in patients with NPM1 mutations. J Mol Diagn. 2017;19:537–48.
23. Patkar N, Kodgule R, Kakirde C, Raval G, Bhanshe P, Joshi S, et al. Clinical impact of measurable residual disease monitoring by ultradeep next generation sequencing in NPM1 mutated acute myeloid leukemia. Onco-target. 2018;9:36613–24.
24. Krönke J, Bullinger L, Teleanu V, Tschürtz F, Gaidzik VI, Kühn MWM, et al. Clonal evolution in relapsed NPM1-mutated acute myeloid leukemia. Blood. 2013;122:100–8.
25. Höllein A, Meggendorfer M, Dicker F, Jeromin S, Nadarajah N, Kern W, et al. NPM1 mutated AML can relapse with wild-type NPM1: persistent clonal hematopoiesis can drive relapse. Blood Adv. 2018;2:3118–25.
26. Sangle NA, Perkins SL. Core-binding factor acute myeloid leukemia. Arch Pathol Lab Med. 2011;135:1504–9.
27. Mrózek K, Heerema NA, Bloomfield CD. Cytogenetics in acute leukemia. Blood Rev. 2004;18:115–36.
28. Appelbaum FR, Kopecky KJ, Tallman MS, Slovak ML, Gundacker HM, Kim HT, et al. The clinical spectrum of adult acute myeloid leukaemia associated with core binding factor translocations. Br J Haematol. 2006;135:165–73.
29. Hantel A, Stock W, Kosuri S. Molecular minimal residual disease testing in acute myeloid leukemia: a review for the practicing clinician. Clin Lymphoma Myeloma Leuk. 2018;18:636–47.
30. Kottaridis PD, Gale RE, Frew ME, Harrison G, Langabeer SE, Belton AA, et al. The presence of a FLT3 internal tandem duplication in patients with acute myeloid leukemia (AML) adds important prognostic information to cytogenetic risk group and response to the first cycle of chemotherapy: analysis of 854 patients from the United Kingdom Medical Research Council AML 10 and 12 trials. Blood. 2001;98:1752–9.
31. Stone RM, Mandrekar SJ, Sanford BL, Laumann K, Geyer S, Bloomfield CD, et al. Midostaurin plus chemotherapy for acute myeloid leukemia with a FLT3 mutation. N Engl J Med. 2017;377:454–64.
32. Janke H, Pastore F, Schumacher D, Herold T, Hopfner K-P, Schneider S, et al. Activating FLT3 mutants show distinct gain-of-function phenotypes
in vitro and a characteristic signaling pathway profile associated with prognosis in acute myeloid leukemia. PLoS ONE. 2014;9:e89560.
33. Yamamoto Y, Kiyoi H, Nakano Y, Suzuki R, Kodera Y, Miyawaki S, et al. Activating mutation of D835 within the activation loop of FLT3 in human hematologic malignancies. Blood. 2001;97:2434–9.
34. Nazha A, Cortes J, Faderl S, Pierce S, Daver N, Kadia T, et al. Activating internal tandem duplication mutations of the fms-like tyrosine kinase-3 (FLT3-ITD) at complete response and relapse in patients with acute myeloid leukemia. Haematologica. 2012;97:1242–5.
35. Cloos J, Goemans BF, Hess CJ, van Oostveen JW, Waisfisz Q, Corthals S, et al. Stability and prognostic influence of FLT3 mutations in paired initial and relapsed AML samples. Leukemia. 2006;20:1217–20.
36. Rampal R, Figueroa ME. Wilms tumor 1 mutations in the pathogenesis of acute myeloid leukemia. Haematologica. 2016;101:672–9.
37. Ellisen LW, Carlesso N, Cheng T, Scadden DT, Haber DA. The Wilms tumor suppressor WT1 directs stage-specific quiescence and differentiation of human hematopoietic progenitor cells. EMBO J. 2001;20:1897–909.
38. Hosen N, Sonoda Y, Oji Y, Kimura T, Minamiguchi H, Tamaki H, et al. Very low frequencies of human normal CD34 + haematopoietic progenitor cells express the Wilms’ tumour gene WT1 at levels similar to those in leukaemia cells. Br J Haematol. 2002;116:409–20.
39. Hou H-A, Huang T-C, Lin L-I, Liu C-Y, Chen C-Y, Chou W-C, et al. WT1 muta-tion in 470 adult patients with acute myeloid leukemia: stability during disease evolution and implication of its incorporation into a survival scoring system. Blood. 2010;115:5222–31.
40. Brieger J, Weidmann E, Fenchel K, Mitrou PS, Hoelzer D, Bergmann L. The expression of the Wilms’ tumor gene in acute myelocytic leukemias as a possible marker for leukemic blast cells. Leukemia. 1994;8:2138–43.
41. Galimberti S, Ghio F, Guerrini F, Ciabatti E, Grassi S, Ferreri MI, et al. WT1 expression levels at diagnosis could predict long-term time-to-progression in adult patients affected by acute myeloid leukaemia and myelodysplastic syndromes. Br J Haematol. 2010;149:451–4.
42. Schmid D, Heinze G, Linnerth B, Tisljar K, Kusec R, Geissler K, et al. Prog-nostic significance of WT1 gene expression at diagnosis in adult de novo acute myeloid leukemia. Leukemia. 1997;11:639–43.
43. Alvarez Argote J, Dasanu CA. ASXL1 mutations in myeloid neoplasms: pathogenetic considerations, impact on clinical outcomes and survival. Curr Med Res Opin. 2018;34:757–63.
44. Ohgami RS, Ma L, Merker JD, Gotlib JR, Schrijver I, Zehnder JL, et al. Next-generation sequencing of acute myeloid leukemia identifies the significance of TP53, U2AF1, ASXL1, and TET2 mutations. Mod Pathol. 2015;28:706–14.
45. Cher CY, Leung GMK, Au CH, Chan TL, Ma ESK, Sim JPY, et al. Next-gener-ation sequencing with a myeloid gene panel in core-binding factor AML showed KIT activation loop and TET2 mutations predictive of outcome. Blood Cancer J. 2016;6:e442.
46. Medeiros BC, Fathi AT, DiNardo CD, Pollyea DA, Chan SM, Swords R. Isocitrate dehydrogenase mutations in myeloid malignancies. Leukemia. 2017;31:272–81.
47. Salem D, El-Aziz SA, El-Menshawy N, Abouzeid T, Ebrahim M. Prevalence and prognostic value of IDH1 R132 mutation in newly diagnosed AML Egyptian patients with normal karyotype. Indian J Hematol Blood Trans-fus. 2017;33:49–55.
48. Meggendorfer M, de Albuquerque A, Nadarajah N, Alpermann T, Kern W, Steuer K, et al. Karyotype evolution and acquisition of FLT3 or RAS pathway alterations drive progression of myelodysplastic syndrome to acute myeloid leukemia. Haematologica. 2015;100:e487–90.
49. Kadia TM, Kantarjian H, Kornblau S, Borthakur G, Faderl S, Freireich EJ, et al. Clinical and proteomic characterization of acute myeloid leukemia with mutated RAS. Cancer. 2012;118:5550–9.
50. Ayatollahi H, Shajiei A, Sadeghian MH, Sheikhi M, Yazdandoust E, Ghazan-farpour M, et al. Prognostic importance of C-KIT mutations in core bind-ing factor acute myeloid leukemia: a systematic review. Hematol Oncol Stem Cell Ther. 2017;10:1–7.
51. Allen C, Hills RK, Lamb K, Evans C, Tinsley S, Sellar R, et al. The importance of relative mutant level for evaluating impact on outcome of KIT, FLT3 and CBL mutations in core-binding factor acute myeloid leukemia. Leukemia. 2013;27:1891–901.
52. Tang J-L, Hou H-A, Chen C-Y, Liu C-Y, Chou W-C, Tseng M-H, et al. AML1/RUNX1 mutations in 470 adult patients with de novo acute myeloid
Page 15 of 15Salehzadeh et al. Cancer Cell Int (2019) 19:83
• fast, convenient online submission
•
thorough peer review by experienced researchers in your field
• rapid publication on acceptance
• support for research data, including large and complex data types
•
gold Open Access which fosters wider collaboration and increased citations
maximum visibility for your research: over 100M website views per year •
At BMC, research is always in progress.
Learn more biomedcentral.com/submissions
Ready to submit your research ? Choose BMC and benefit from:
leukemia: prognostic implication and interaction with other gene altera-tions. Blood. 2009;114:5352–61.
53. Spencer DH, Russler-Germain DA, Ketkar S, Helton NM, Lamprecht TL, Fulton RS, et al. CpG island hypermethylation mediated by DNMT3A is a consequence of AML progression. Cell. 2017;168(801–816):e13.
54. Chaudry SF, Chevassut TJT. Epigenetic guardian: a review of the DNA methyltransferase DNMT3A in acute myeloid leukaemia and clonal haematopoiesis. Biomed Res Int. 2017;2017:5473197.
55. Tang S, Shen H, Mao X, Dai H, Zhu X, Xue S, et al. FLT3-ITD with DNMT3A R882 double mutation is a poor prognostic factor in Chinese patients with acute myeloid leukemia after chemotherapy or allogeneic hemat-opoietic stem cell transplantation. Int J Hematol. 2017;106:552–61.
56. Brunetti L, Gundry MC, Goodell MA. DNMT3A in leukemia. Cold Spring Harb Perspect Med. 2017;7:a030320.
57. Thiede C, Steudel C, Mohr B, Schaich M, Schäkel U, Platzbecker U, et al. Analysis of FLT3-activating mutations in 979 patients with acute
myelogenous leukemia: association with FAB subtypes and identification of subgroups with poor prognosis. Blood. 2002;99:4326–35.
58. Cilloni D, Renneville A, Hermitte F, Hills RK, Daly S, Jovanovic JV, et al. Real-time quantitative polymerase chain reaction detection of minimal residual disease by standardized WT1 assay to enhance risk stratification in acute myeloid leukemia: a European LeukemiaNet study. J Clin Oncol. 2009;27:5195–201.
59. Forghieri F, Comoli P, Marasca R, Potenza L, Luppi M. Minimal/measurable residual disease monitoring in NPM1-mutated acute myeloid leukemia: a clinical viewpoint and perspectives. Int J Mol Sci. 2018;19:E3492.
60. Baccarani M, Deininger MW, Rosti G, Hochhaus A, Soverini S, Apperley JF, et al. European LeukemiaNet recommendations for the management of chronic myeloid leukemia: 2013. Blood. 2013;122:872–84.