The ASEAN Free Trade Agreement Building Block or...
39
Working Paper No 2007/33 OCTOBER 2007 The ASEAN Free Trade Agreement Building Block or Stumbling Block for Multilateral Trade Liberalization? Andreas Lendle* ABSTRACT This paper investigates empirically whether the ASEAN Free Trade Agreement had a building block or stumbling block effect on subsequent changes in MFN tariffs of four major ASEAN members. The method resembles the one recently used by Nuno Limão. We use tariff data to test whether MFN tariffs were changed differently for preferential products compared to otherwise similar products without a preference. We find a significant building block effect for Indonesia, the Philippines and Thailand. MFN tariffs of preferential products were reduced by more than for non-preferential products. We obtain ambiguous effects for Malaysia. This suggests that overall the ASEAN Free Trade Agreement has rather helped than hindered non-discriminatory trade liberalization. KEY WORDS ASEAN; regionalism; preferential trade agreements. * Andreas Lendle is a research assistant for the NCCR Individual Project “Regionalism; Special and Differential Treatment; and Variable Geometry” and a student at the Graduate Institute of International Studies, Geneva. Contact at [email protected] . NCCR TRADE WORKING PAPERS are preliminary documents posted on the NCCR Trade Regulation website (<www.nccr-trade.org>) and widely circulated to stimulate discussion and critical comment. These papers have not been formally edited. Citations should refer to a “NCCR Trade Working Paper”, with appropriate reference made to the author(s).
Transcript of The ASEAN Free Trade Agreement Building Block or...

Working Paper No 2007/33
OCTOBER 2007
The ASEAN Free Trade Agreement
Building Block or Stumbling Block for Multilateral Trade Liberalization?
Andreas Lendle*
ABSTRACT This paper investigates empirically whether the ASEAN Free Trade Agreement had a building block or stumbling block effect on subsequent changes in MFN tariffs of four major ASEAN members. The method resembles the one recently used by Nuno Limão. We use tariff data to test whether MFN tariffs were changed differently for preferential products compared to otherwise similar products without a preference. We find a significant building block effect for Indonesia, the Philippines and Thailand. MFN tariffs of preferential products were reduced by more than for non-preferential products. We obtain ambiguous effects for Malaysia. This suggests that overall the ASEAN Free Trade Agreement has rather helped than hindered non-discriminatory trade liberalization. KEY WORDS ASEAN; regionalism; preferential trade agreements. * Andreas Lendle is a research assistant for the NCCR Individual Project “Regionalism; Special and Differential Treatment; and Variable Geometry” and a student at the Graduate Institute of International Studies, Geneva. Contact at [email protected] . NCCR TRADE WORKING PAPERS are preliminary documents posted on the NCCR Trade Regulation website (<www.nccr-trade.org>) and widely circulated to stimulate discussion and critical comment. These papers have not been formally edited. Citations should refer to a “NCCR Trade Working Paper”, with appropriate reference made to the author(s).

Contents
1. Introduction ...................................................................................................... 2
2. Literature review .............................................................................................. 3
3. The ASEAN free trade agreement ................................................................... 7
3.1 A short history of the ASEAN free trade agreement ................................. 7
3.2 Trade flows in ASEAN and the importance of AFTA ................................. 9
4. Empirical analysis .......................................................................................... 11
4.1 Introduction ............................................................................................. 11
4.2 Empirical strategy ................................................................................... 12
4.3 Econometric issues ................................................................................. 16
4.4 Data and descriptive statistics ................................................................ 17
5. Estimation results and discussion .................................................................. 20
6. Robustness tests ........................................................................................... 23
7. Conclusion and outlook for further research .................................................. 24
8. References .................................................................................................... 27
9. Figures and tables ......................................................................................... 29

2
1. Introduction1 There has been an ongoing debate for more than 20 years whether regional trade
agreements (bilateral or plurilateral) are “stumbling blocks”2 or “building blocks” for
further multilateral and non-discriminatory liberalization of the world trading system.
Multilateral negotiations by WTO members have shown no serious progress since
the Doha Ministerial, and more and more countries have negotiated FTAs since
then.3 A very similar process took place in the 80ies and early 90ies, prior to the
conclusion of the Uruguay round (see Panagariya, 1999). Baldwin (2007) argues that
the coincidence of temporal failure of the Uruguay round and an increasing number
of FTAs triggered the debate on effects of regionalism on multilateralism.
Most bilateral agreements exist within regions (e.g. EU and surrounding countries)
and much fewer exist so far between regions (e.g. EU and Mexico), but many of the
agreements that are under consideration are inter-regional. Nevertheless, most of
world trade can still be considered as MFN trade4, and this will most probably remain
so. But there is no doubt that FTAs are becoming more important for many trading
partners.
Although an FTA liberalizes trade between its partners, obvious problems emerge
that make many economists believe that regionalism is harmful: Countries outside
the agreement are discriminated against, e.g. because trade diversion leads to fewer
imports from the outsiders. It can also be shown that an FTA can even be welfare
reducing for a member country if it leads to import sourcing from a less efficient
trading partner (the FTA partner), instead of from a more efficient outsider.
1 I would like to thank Richard Baldwin and John Cuddy for valuable advice. Thanks also to Theresa Carpenter for always helpful comments, as well as to my fellow students at HEI Geneva for comments on earlier drafts. I gratefully acknowledge the financial support from the Swiss National Science Foundation via the NCCR Trade Regulation project (IP3). 2 Some authors, including me in a former version of this paper, use the term “building / stumbling bloc” instead of “block”, which is the more correct spelling. “Bloc” is a pun related to the term “trade blocs”. 3 Often-mentioned numbers of such trade agreements are in the range of around 300, though such numbers do not say much, as one has to take into consideration the nature of such agreements. One example: The EU accession of Bulgaria and Romania, together with the conclusion of the CEFTA agreement (which will probably enter into force in May 2007) will reduce the number of bilateral agreements by around 30. The Greater Arab Free Trade agreement (GAFTA, in force since 2006) has practically replaced around 25 bilateral agreements between its members. These developments obviously do not reflect a trend against regionalism. 4 A rough estimate by the authors suggests that at least 75% of world trade in 2005 was between countries not having an FTA with each other (60% if one includes intra-EU trade). In addition, a big part of “FTA trade” is in fact MFN trade, as preferential margins for highly traded goods are often zero.

3
FTAs also have many disadvantages compared to multilateral liberalization: even if
all countries had low-tariff FTAs with all others, world trade would be far from “free”
because the necessity of rules of origin would serve as a substantial barrier to trade.
The Pan-European cumulation system could be seen as an example of how this
problem can be partly solved, but it is hard to imagine that such a system would be
used worldwide. Some FTA partners might also feel less “bound” by their FTA
obligations (compared to bound MFN rates), and many FTAs do not include a
jurisdiction system, as the WTO does.5 Another potential problem is that countries
might become less willing to engage in multilateral or unilateral trade liberalization,
i.e. they see FTAs as a substitute for MFN tariff liberalization. This will be the main
topic of this paper.
There is plenty of theoretical literature that offers explanations why countries might
see FTAs as substitutes (stumbling block) or as complements (building block) to
multilateralism (see for example Bhagwati (1992), or Baldwin (2007) for a very recent
overview), but very little empirical work has been done so far. This paper tries to fill
this gap for one specific regional trade agreement, namely the ASEAN Free Trade
Agreement (AFTA). Liberalization in ASEAN provides a real life example of MFN
liberalization and preferential liberalization at the same time: The major ASEAN
members have substantially lowered their MFN tariffs over the last 15-20 years, while
at the same time bringing down tariffs against their regional partners from high MFN
tariffs to mostly 0-5% preferential tariffs.
We will first provide an overview of the available literature on the building block /
stumbling block discussion. A brief summary of the development of AFTA follows and
we also provide some statistics about trade flows and evidence on utilization of AFTA
preferences. The main part contains an empirical analysis of whether ASEAN can be
seen as a “building block” or “stumbling block”. For that, we analyze tariff data of the
major ASEAN members Indonesia, Malaysia, the Philippines and Thailand.
2. Literature review Since the discussion on the building block / stumbling block effect started, numerous
papers have been written about it. Krueger (1999) summarizes both arguments
5 Worth mentioning is also that FTAs are usually not only about trade in goods or services, but also about investments, IPR, or pure politics, and it is often argued that developing country partners of

4
supporting a positive effect of regionalism on multilateralism (“building blocks”), as
well as a negative effect (“stumbling block”). Another good overview is Bhagwati
(1992). More recently, Baldwin (2007) provides another summary of arguments of
both sides. There is no clear-cut definition of when we would define regionalism as a
building block and when not. The signing of an FTA could for example affect the
probability that a country supports a new WTO trade round; or a preferential tariff on
a specific product could affect the countries’ subsequent setting of the (bound and /
or applied) MFN tariff of that particular product.
The major arguments of the optimists are as follows: FTAs6 can lead to more support
for multilateral liberalization if producers in one country face higher MFN tariffs on
intermediate products than competing producers in the partner country (this could not
happen in a customs union). They might then put increasing pressure on their
government to bring MFN tariffs on inputs down to the MFN level of the partner
country. AFTA might provide a good example where this argument could be used.
Another argument is that because of FTAs, countries outside of FTAs might be more
willing to accept multilateral liberalization because of the disadvantages they face
against the FTA partners. Baldwin (2004) argues that such “competitive liberalization”
might have helped to promote the Kennedy round, as US exporters felt threatened by
the emergence of preferences within the EEC. The opposite effect could be that
countries inside the FTA oppose further MFN liberalization because they take
advantage of their preferences. An example could be if one big country A has an FTA
with small country B, but none with small country C. Exporters in B (to A) have an
advantage, which they would loose if A’s MFN tariff goes down, while exporters of C
(to A) would rather support lower MFN tariffs. Country A might also oppose tariff
reductions because there could be political reasons to support country B. This is why
some developing countries fear MFN tariff liberalization. It partly “erodes” existing
preferences granted by industrial countries.7
such agreements might find it more difficult than in the WTO to reach outcomes which are in their interest. 6 We do not always distinguish between “FTAs” or “regionalism”. Regionalism may of course consist of other forms of preferential agreements, e.g. autonomous preferences or customs union (the former being usually not very far-reaching, the latter do not play a big role in the current discussions, as few new custom unions emerge, except for the EU enlargement). 7 Limão (2005b) provides anecdotal evidence of such a case. The US was reluctant to lower MFN tariffs on certain spirits because that would have eroded preferences for some Caribbean countries.

5
FTAs also have an indirect effect on the political economy within the country: Groups
opposing multilateral liberalization could be weakened through an FTA, which
changes the political economy of the country towards being less opposed to
multilateralism – the “juggernaut” effect (Baldwin, 2007). An example could be the
possible FTA on agricultural products between Switzerland and the EU: Such an FTA
would lead to structural changes in the Swiss agricultural sector and might lower the
pressure on the government to accept MFN liberalization in the WTO. However, the
opposite might be true for export-oriented lobbies: FTAs already allow them to export
more, so they might be less inclined to pressure (through their government) for
additional MFN liberalization in other countries. Krueger also argues that trade
diversion caused by FTAs creates rents whose owners are subsequently opposed to
MFN liberalization.
Another stumbling block argument is the “cherry-picking stumbling block” (Baldwin,
2007): Similar countries could get most of the gains that they would get through
global MFN tariff reduction also through an FTA (i.e. variety effects and comparative
advantage effects), but would have to bear fewer costs (i.e. Stolper-Samuelson
effect).
Several formal models have been developed: Baldwin (2007) shows with a Walrasian
setting that multilateral trade liberalization can be welfare-reducing for a country that
is member of an FTA because gains from the FTA can be higher than gains from
global free trade. Bagwell and Staiger (1997) use a three-country, three-goods model
and conclude that an FTA between two countries could have a lowering effect on
their MFN tariffs, but it can also have an increasing effect, depending on how well
multilateral cooperation works.
Most, though not all of these arguments can also be used for possible effects of
regionalism on unilaterally set MFN tariffs – which is in fact what we can observe in
ASEAN. Because the theoretical models do not provide us with clear-cut predictions,
it remains open whether we should expect a building block or stumbling block effect.
Despite numerous theoretical papers, the building block / stumbling block theory has
hardly been tested empirically. A relatively new attempt is the one by Nuno Limão,
who looked at the effect of preferential tariff schemes of both the EU (2005b) and the
US (2005a, 2006). He tested on product level whether EU and US preferential tariffs
had a significant effect on the reduction of bound MFN rates during the Uruguay

6
round and found a stumbling block effect of preferential schemes for both the EU and
US. Both lowered their bound MFN tariffs by less during the Uruguay round for those
products for which they were granting a preference to other countries. Parts of his
methodology are used in our empirical part, but a crucial difference is that we look at
applied MFN rates.8 Bound rates are almost always lowered or remain unchanged
during a WTO trade round, but are usually not increased. This means that the EU
and US are much more constrained in setting their bound MFN tariffs, and also in
setting the applied rates (which are often close to the bound level). In contrast, the
reduction of MFN tariffs in ASEAN has mostly been done unilaterally – it was not the
result of multilateral WTO negotiations. Bound tariffs are usually well above applied
rates and some tariffs are not bound at all. Therefore, these countries were quite free
to set MFN tariffs and could even increase them over time. Thus, ASEAN members
had much fewer constraints in setting their MFN tariffs after granting preferences to
some products than the EU or US had.
Partly based on Limão’s work, another recent working paper by Estevadeordal et al.
(2006) examines the effects of regional trade agreements in Latin America on MFN
tariff changes. This paper is somehow similar to ours, as it deals with FTAs (but also
customs unions) between developing countries, rather than preferences granted by
industrial countries. They also use applied MFN rates. However, the dataset and the
estimation technique are very different from our approach.9 They find a building block
effect for FTAs, but less or no such effects for CUs.
There is plenty of literature on ASEAN in general and (though less) on AFTA in
particular. However, these papers usually deal with the effect of AFTA on trade, not
on (MFN) tariffs. One example for empirical literature looking at trade effects is Elliott
& Ikemoto (2004). They use a gravity model which suggests that AFTA had no
impact on intra-ASEAN trade. This is not very surprising, given the evidence for low
utilization rates (see below).
8 In the US and EU, applied rates are usually close to the bound rates, which is not the case in developing countries. One could of course look at bound rates in ASEAN, but there is relatively little movement in bound tariff schedules of developing countries. 9 They use tariff data aggregated on the ISIC 4-digit level and therefore only around 100 different products. This allows them to combine tariff data across time and across countries. This panel covers 12 years and 10 countries.

7
Some authors use ASEAN as an example of “open regionalism”, arguing that ASEAN
members have liberalized their MFN tariffs unilaterally while also deepening AFTA
(see for example Bergsten, 1997). However, we are not aware of any empirical
analysis of the building block / stumbling block effect of AFTA or even a detailed
analysis of preferential tariff rates.10 This is rather surprising, as most of the tariff data
is readily available from several sources.
3. The ASEAN free trade agreement
3.1 A short history of the ASEAN free trade agreement ASEAN was founded in 1967.11 A first preferential trading scheme was implemented
in 1977, the so-called “ASEAN Preferential Trading Arrangement” (PTA), which was
further extended in 1987. Tariffs for covered goods were lower than the MFN tariff
(but not necessarily zero). AFTA was signed by Brunei, Indonesia, Malaysia,
Philippines, Singapore and Thailand in 1992 and entered into force on January 1,
1993. At that time it covered a selection of non-agricultural goods, known as the
“inclusion list”. Each country excluded some products temporarily, and some few
products were on a “general exclusion list”. The preferential tariff is called “CEPT”
(“Common Effective Preferential Tariff”).12 Included products were either on a “fast
track”-list13 or in the “normal track”. The tariff reduction scheme for the inclusion list
was as follows (ASEAN 1993): For fast-track-products, tariffs above 20% had to be
reduced to 0-5% until 2003, and other tariffs until 2000. For normal-track products,
tariffs above 20% had to be reduced to 20% until 2001 and to 0-5% until 2008. Tariffs
below 20% had to be reduced to 0-5% until 2003. Members were free to set tariffs
until the end of the implementation periods, but encouraged to use a linear tariff
reduction formula.14
10 An exception is a paper by Manchin & Pelkmans-Balaoing (2007). They calculate preferential margins on HS-6 level to analyze whether AFTA had a trade effect. 11 Original members were Indonesia, Philippines, Malaysia, Singapore and Thailand. Countries that joined later were Brunei (1984), Viet Nam (1995), Lao PDR (1997), Myanmar (1997) and Cambodia (1999). 12 This is a slightly misleading term: ASEAN members do not have a “common tariff” as AFTA is not a customs union, but an FTA. 13 There was only one fast-track list for all six countries, which included 15 product categories, for example textiles, cement and electronics. 14 One principle in the early years of AFTA was reciprocity: A product only enjoyed preferential tariffs in another member country if the product was in the “inclusion list” of both the importing and exporting country and only if the exporting country applied a 20% or lower preferential tariff for that product. If the tariff were above 20%, it only enjoyed preferences in those importing countries that also had

8
In 1995, the six members15 amended the 1992 agreement: Agricultural products
were included and the timeframe for tariff reduction accelerated: Reduction of tariffs
down to 20% had to be concluded until 1998 (instead of 2001), and to 0-5% until
2003 (instead of 2008). In 1999, a protocol was signed which defined country-specific
sensitive16 and highly-sensitive products17 for agricultural products. Those had to be
implemented into the CEPT scheme until 2001 and 2003, and tariffs for sensitive
products have to be reduced to 0-5% until 2010 (20% for highly-sensitive products).18
In 2003, members agreed that tariffs for all products of the inclusion list should be
abolished by 2010.19 In 2004, sector-specific agreements were concluded, which
provide for accelerated tariff reduction for most products within a list of sectors.20
One characteristic of AFTA should be highlighted: Trade will eventually be
completely liberalized within ASEAN members, with only very few exceptions allowed
to remain permanently. But members enjoyed some freedom in choosing products
for which they grant preferences and in setting their preferential tariffs during the
implementation period (which is still ongoing). Starting point for tariff reductions were
initial applied MFN tariffs, but subsequent changes in the MFN rate would have had
no effect on the preferential rate. There was no requirement to apply, for example, a
specific margin of preferences on the applied rate, at least since AFTA started.21 This
allows us to empirically look at how members set both the MFN and the CEPT rate
over time.
What has been the result of these different agreements over the last years? The
direct result is that the CEPT rates of four of the six original members have been
reduced significantly and are now down to 0-5% for most products (Brunei and
Singapore always had low MFN tariffs). A striking result is indeed that Indonesia, the
preferential rates above 20% (see ASEAN 1995). Unfortunately, we do not have data to capture that in our empirical analysis. 15 Vietnam joined in 1995, but did not sign the amendment of the 1992 agreement. 16 The sensitive lists only cover a few products per country and are available here: http://www.aseansec.org/sasp_2.htm 17 The highly sensitive list only included rice (heading 1006) for Indonesia, Malaysia and the Philippines. 18 Lao PDR, Cambodia, Myanmar and Vietnam had then also joined the AFTA agreement. These countries got granted longer implementation periods. 19 Until 2015-2018 for Lao PDR, Cambodia, Myanmar and Vietnam. 20 Sectors are for example: Agro-food products, healthcare, automobiles, fisheries and textiles. See http://www.aseansec.org/16659.htm for details. 21 In the pre-AFTA “ASEAN Preferential Trading Arrangement”, specific preferential margins were used (e.g. 70% of the MFN tariff = preferential tariff).

9
Philippines and Thailand had also lowered their MFN tariffs since AFTA started in
1993 (and also before). Malaysia also lowered its tariffs, but by much less than the
other countries, though Malaysia always had the lowest average tariff of those four
countries since 1993. Table 2 shows the development from 1993-2003 for these four
countries.
The reduction of MFN tariffs was mostly done unilaterally, as developing country’s
concessions in the Uruguay round consisted mainly of binding their tariffs, and / or
reducing bound tariffs only slightly from around 1995-2004.
This MFN liberalization can be seen as preliminary evidence that AFTA and pre-
AFTA preferences were indeed “building blocks”: After agreeing on preferences, the
major ASEAN members did subsequently reduce their MFN tariffs. Of course, we do
not know what would have happened otherwise. Therefore, we have to look at
detailed MFN and CEPT tariffs to see whether this can be confirmed empirically.
3.2 Trade flows in ASEAN and the importance of AFTA This section gives a brief overview of trade flows of the major ASEAN countries and
of their trade with other countries. It also provides some stylized facts of today’s
importance of AFTA. Table 1 shows 2005 imports of the major ASEAN countries.
One can clearly see that ASEANs mostly import from the rest of the world, with
imports from ASEAN being only in the range of 19-30%. The major non-ASEAN
trading partners are Japan, China, the US and the EU-25. However, despite being
low, the share of intra-ASEAN trade has increased over the last decades (see
figure 1). Whether this is due to regional trade liberalization is a disputed issue and it
is sometimes argued that AFTA, at least today, does not really matter. It is certainly
true that many FTAs are not used much (meaning that utilization rates are low), and
might not necessarily have a substantial impact on trade flows. Baldwin (2006) gives
some evidence for low utilization rates of AFTA. For example, utilization rates in 2002
have only been 4% for Malaysia and 11% for Thailand.
We did some calculations to check whether today’s intra-ASEAN trade is mostly
done in products that do receive low or no preference.22 Using 2005 tariff and trade
data of Indonesia, Malaysia, the Philippines and Thailand, we calculated the
22 Manchin & Pelkmans-Balaoing (2007) have done a similar calculation and also found that most intra-ASEAN trade has a low preferential margin.

10
difference between the MFN and CEPT tariff for the 1000 HS-6 products23 that are
mostly traded within ASEAN (table 3). The result is striking: Only few of the products
have any substantial preference, while the MFN tariff is identical to the CEPT tariff for
most of them – which means that both are usually 0-5%. While the average
unweighted preference is between 5-9.8 %-points, the trade-weighted preference is
well below that. This means that ASEANs give few preferences for products they are
trading with each other. A substantial part of intra-ASEAN trade is in crude oil, gas
and electric and electronic products of chapters 84 and 85. Some, though not all, of
these products fall under the ITA and have therefore bound zero MFN tariffs. Tariffs
on oil and gas are usually zero as well. We did similar calculations with the dataset
that we had built for the regression analysis (table 3), and these suggest that simple
and trade-weighted averages of absolute preferential margins were even lower in the
past, with the only exception being Thailand (in 1993). Indonesia, Malaysia and the
Philippines had trade-weighted preferences of 0.6-1.3 %-points in the years that we
used as “base years” for our regression analysis, while Thailand’s weighted average
was at 21.6 %-points.
It is important to keep in mind that these results only show the potential (maximum)
use of the CEPT scheme, not the actual use. The available trade data does not show
whether or how frequently the preferential tariff has actually been applied for imports
of a certain product. Certainly, it will often be too costly or impossible (because of
rules of origin) to obtain a certificate of origin, so that utilization rates for a specific
product could be well below 100%. It would obviously be much better if one had
direct data on utilization, but these are not available.
The fact that AFTA has had and still has a low trade-weighted preferential margin
does indeed not mean that AFTA has no impact on trade flows. First, the impact can
be quite high for certain industries (e.g. the car industry). Second, and more
important for the following parts of our paper, the impact might be an indirect one:
The fact that many MFN tariffs are as low as the CEPT rates does not necessarily
mean that the MFN rates would be as low without AFTA. The preferential scheme
might indeed have worked as a building block towards unilateral MFN liberalization,
23 There exist around 5000 HS-6 codes (subheadings) in the harmonized system. Calculations were not made for all, as trade in the remaining 4000 is very low, and some manual adjustments had to be made with the data, making a full coverage overly time-consuming.

11
and the next part of our paper mainly deals with the question whether this has been
the case or not.
4. Empirical analysis
4.1 Introduction We estimate the building block / stumbling block effect that preferences to other
ASEAN members had on each country’s subsequent setting of applied MFN tariffs.
Our main idea is that granting a preference on a specific product has an effect on the
subsequent change of the applied MFN tariff of that product. Products for which no
preferential tariff is granted should therefore show a different pattern of their changes
in MFN tariffs than those products for which a preference is granted. This can be
done because there has been a substantial (and mostly unilateral) reduction of
applied MFN rates since AFTA started, and because MFN tariffs and tariff reductions
vary considerably across products. For the periods covered by our dataset (which
differ across countries), the MFN tariff was considerably reduced in all countries
except Malaysia. Also, all countries except Malaysia changed 2/3 or more of their
tariffs, and Malaysia changed 41%. Without such a variation in MFN tariffs across
time, we would obviously not be able to test for any effect of preferences on MFN
tariffs.
Supporters of the stumbling block argument would expect that a country had lowered
MFN tariffs by more if it had not granted preferences to other ASEAN countries, and
supporters of the building block argument would assume the opposite. Obviously, we
can not observe what would have happened if a country had granted no, less, or
more preferences than it actually did. However, we can observe different degrees of
preferences for different products. Observing tariffs on products with no preference
can therefore serve as an alternative to the unfeasible option of observing the
situation without a preferential scheme at all. If the stumbling block theory is correct,
then MFN tariffs should, ceteris paribus, be higher (or reduced by less) if the country
had granted a preference for that product.
We obviously have to control for other factors affecting the tariff change of a product.
Doing this on a 6-digit or tariff line level however limits the available explanatory
variables, as the only data we have available on that level is tariff data (MFN and
CEPT over several years), and trade flows (import, export, over several years and by

partner). Dummy variables can identify industry- or sector-specific factors. As tariffs
are set within the political system of a country and as their setting is probably
influenced by lobbying groups, these explanatory variables are certainly not
complete, but we assume that we can at least partly control for that by using industry-
level dummies.
4.2 Empirical strategy How can we now test empirically whether the preferences granted in early years
influenced the MFN tariffs in the years afterwards? Clearly, the dependent variable
must somehow reflect the level of the MFN tariff change between the early years of
AFTA and a recent year, while the explanatory variables have to include a
measurement of AFTA preferences. As far as we know, the only such empirical tests
so far have been done by Nuno Limão (2005a and 2006) for the US, Limão &
Karacaovali (2005b) for the EU and Estevadeordal et al. (2006) for Latin America.
Limão’s basic estimated equation for the US is:24
( ) iiii +V+tpref_D+= εβββτΔ 3010
with if .iiiii )t(MFN)t(MFN))t(MFN+ln())t(MFN+ln(= 0101 -≈1-1τΔ
iτΔ
0≈10 i, )t(MFN 25
Therefore, approximates the absolute reduction in the US bound tariff during the
Uruguay round. The dummy ( )itpref_D 0 (called “ANYPTA” in his paper) takes the
value 1 if the US gave a preference for that product at time zero (before the start of
the Uruguay round tariff reduction) and it has also been imported from a country
eligible for that preference.26 Additional explanatory variables are used, such as NTB
prevalence, pre-UR liberalization, and a trade-weighted difference of GDP growth
between the US and the partner country to represent bargaining power.27 Chapter
dummies are added to control for industry-specific effects. Limão also uses an IV-
24 The approach used in Limão & Karacaovali (2005b) for the EU is quite similar. 25 One can also interpret as the log of the tariff factor growth. Because tariff factors (=1+MFNt) are close to one, the absolute difference of MFN rates and the tariff factor growth are very similar. However, using the log somehow smoothes peaks in tariffs and tariff changes. Regression results are very similar when we use as the explanatory variable.
iτΔ
MFN ii )t(MFN)t( 01 -26 A different dummy is also used for preferential imports from all countries receiving a preference.
12
27 It should be noted that his core results are not much affected by adding additional explanatory variables to the preference dummies or by using instruments.

approach because of possible endogeneity of the preference dummy. Our approach
resembles a basic version of Limão’s approach.28
There are indeed some major differences. We only explain the reduction of applied
MFN tariffs. Whereas applied and bound tariffs are usually very similar in industrial
countries (such as the US), there is usually a wide gap between them in developing
countries, and some tariffs might not even be bound at all. The liberalization in
ASEAN countries has therefore mostly taken place through unilateral reduction of
MFN tariffs, which have usually been below their bound levels all the time. Therefore,
while using bound tariffs is the right choice for the US and EU, using applied tariffs is
the right choice for our study. We use tariffs from two different years. ( )itMFN 0 is the
tariff in the base year, i.e. in the early years of AFTA. ( )itMFN 1 is the tariff in a recent
year.
In addition to the preference dummy used by Limão, we use additional
measurements for preferential treatment: A preference dummy for a preferential tariff,
whether there were any imports from the preference-receiving ASEAN countries, and
the relative preferential margin.29 The latter is a useful measurement for ASEAN
because preferential tariffs are often well above zero. Again, this is not the case for
industrial countries, which rather apply zero preferential tariffs, i.e. a 100%
preferential margin.
We also argue that one should control for the absolute MFN tariff in the base year,
( )itMFN 0 .30 Intuitively, it should be clear that ( )
itMFN 0 has a major impact on the
absolute MFN reduction, just because tariffs cannot become negative.31 Therefore,
one could expect that higher tariffs are reduced by more compared to low tariffs. As
28 Estevadeordal et al. (2006) use a 10 year, 12 countries panel with only around 100 different products aggregated on ISIC-4 level. Similar to Limão (2006), they use the MFN tariff change as the independent variable. However, they use the import-weighted preferential tariff or the import-weighted absolute preferential margin as the main explanatory variable – which is quite different from both Limão’s and our approach. 29 Note that we do not use absolute preferential margins, except in our calculations for trade-weighted preferential margins (see above). 30 Because we use a logarithmic form for the dependent variable, we also use one for ( )
itMFN 0 ( ) in our regression. ii )t(MFN))t(MFN+ln( 00 ≈1
13
31 Estevadeordal et al. (2006) also argue that one should take into account the MFN tariff level. However, they include not the MFN tariff, but a dummy for high MFN tariffs (10% or 25% highest). This dummy is negatively related to the absolute MFN reduction, i.e. high tariffs are reduced by more. This is in line with our findings for ASEAN members.

we will show, this is indeed the case. This issue can well be explained by an
example: In the extreme case of an overall linear tariff reduction formula of, let’s say,
30% (not %-points), then high tariffs obviously will be reduced by more %-points, and
the reduction can be completely explained by the base year tariff. If one then does
not control for the base year tariff, one could wrongly conclude that there is a
significant building block or stumbling block effect, depending on whether high- or
low-tariff products received the preference prior to the reduction. As we will show
below, the distribution of ( )itMFN 0 indeed differs between preferential and non-
preferential products – even in Limão’s dataset on the US.
Our empirical model with the preference dummy is:
(E1) ( ) ( ) iiiii +V+ttpref_D+= MFN+β2 εβββτΔ 30010
Here, i represents the HS-6 or tariff-line code and V is a vector of other explanatory
variables. ( ) 10 =tpref_D i if ( ) ( )ii tMFN<tCEPT 00 and ( ) 00 =tpref_D i if
( ) ( )itMFN 0i =tCEPT 0 .
We also use a slightly different preference dummy ( )itimpASEAN__&pref_D 0 that
only becomes 1 if the product receives a preference and is also imported from any
ASEAN country at . This gives us equation 2: 0t
(E2) ( ) ( ) iiiii +V+tMFN+t_&pref_D+= impASEAN_ εββββτΔ 302010
This dummy resembles the one used by Limão.
Our model with the preferential margin is:
(E3) ( )
( ) ( ) iiii
ii +V+tMFN+)
tMFNtCEPT
(+= εββββτΔ 3020
010 -1
This raises the question whether one should leave out products with ( ) 00 =tMFN i . We
decided to define ( )
( ) 0-10
0 =tMFNtCEPT
i
i if ( ) 00 =tMFN i . This makes ( )
( ) 00
0 =tt
i
i-MFNCEPT
1 easily
comparable with ( )itpref_D 0 because
( )( )
i
i
tMFNtCEPT
0
0-1 has the value 0 if there is no
preference (including cases with ( ) 00 =t iMFN ) and 1 if the preferential tariff is zero. It
has values between 0 and 1 if there is only a tariff reduction (but still a positive CEPT
14

tariff). Note that in our robustness test, we only consider products with ( ) 00 >tMFN i ,
in which case there is no ambiguity in the definition of the preferential margin. We
define ( )
( ) =tMFNtCEPT
i
i
0
0-1 prefmargin from now on.
Chapter dummies are added to all models. With around 96 different chapters, this
should capture any industry-specific effect. Tariffs and tariff changes vary across
industries and can be determined by industry-specific factors (such as political
influence of an industry, perceived strategic importance of an industry etc.). The use
of dummies helps to separate such effects from the building block / stumbling block
effect. We also used 4-digit industry dummies as a robustness test.
( )itimpASEAN 0We decided to use trade data only for defining __&pref_D .
However, we did some preliminary regressions for which we used some indicators
based on trade data (e.g. the share of imports coming from ASEAN or the share of
total imports for a particular product) and found (somehow surprisingly) few
significant results.
Other variables are dummies for agricultural products (chapters 1-24)32 and a dummy
if the product had been subdivided (only when we use HS-6 aggregates instead of
tariff line data). With that, we control for any bias due to the aggregation.
The interpretation of (E1), (E2) and (E3) is straightforward: If 1β is negative, then
there would be a building block effect, and a positive 1β indicates a stumbling block
effect. We test all three models both with and without controlling for ( ) 00 =t iMFN .
It should be noted that all regressions are made for each country separately. The
main reason is that matching tariff data across countries would considerably reduce
the coverage of our dataset because countries use different product classifications
and data is not available for the same years across countries.33
32 This is not exactly the same definition as used by the WTO. For example, it includes fishery products.
15
33 Estevadeordal et al. (2006) matched data across countries, though this comes at a high cost: They aggregated the data on a much higher level (ISIC-4) so that there remain only 100 products, while our dataset covers around 5000-8000 products per country.

16
4.3 Econometric issues Heteroskedasticity is a potential problem. We tested for that using a score test
(“hettest” in Stata) and usually found heteroskedasticity when using OLS. We
therefore used so-called Huber/White/Sandwich estimators for the variance to get
adjusted t-values.
Endogeneity is another potential problem: It could be that preferences were granted
for products by already having in mind future MFN reductions (a reverse-causality). A
country might grant preferences for those products for which they want to reduce the
MFN tariff anyway (or possibly for those for which they do not want to reduce the
MFN tariff). There is no obvious way to solve this potential problem, as we would
have to find an instrument for the preferential tariff. We therefore assume that this
problem is negligible. One can argue that the MFN reductions that happened over a
period of 5-8 years after granting the preferences can only partly have been known at
the time of granting the preferences (and thereby having possibly determined the
preferences).34
Another issue is misspecification. We surely leave out some variables that explain
the change of MFN tariffs. Tariffs are set within the political system of a country, and
unless a common and transparent policy regarding tariff changes (like a formula) is in
place, policy makers can set tariffs discretionary. As long as such variables are not
correlated with our error term, there is no problem, but we obviously do not know
whether that is the case. Given the limited data we have, we assume that adding
dummies for each industry (represented by 96 different chapters of the harmonized
system) should capture specific situations in different industries. We can then still not
explain the MFN change in a particular industry (i.e. chapter), but we assume that all
missing variables that influence a certain chapter do so in the same way for all
products within a chapter. This is of course not completely satisfying, but, again,
there is no better solution for that, given the data that is available.
34 Limão (2006) addresses this as well and also argues that using pre-determined preferences, together with industry dummies, is a sufficient solution for that problem.

17
4.4 Data and descriptive statistics Two types of data were used: Tariff data and trade data.
Tariff data: The main source for tariff data was TRAINS, accessed via World
Integrated Trade Statistics (WITS). WITS contains applied35 tariff data of most major
countries from 1988. We also received some data directly from the ASEAN
secretariat. However, data availability is limited for most countries, especially for
applied preferential rates. Therefore, we had to choose different years for the
different countries, as can be seen from table 5.
Our data is not complete for two reasons: Products with specific tariffs had to be
taken out and products for which the classification changed over time had to be taken
out as well. This is because data was only available separately for different years,
and matching tariff data from different years is a cumbersome procedure: Products
can be grouped differently, subheadings change every few years, etc. However, as
shown in table 5, our dataset covers 95-98% of products representing 78-94% of
base year imports.
We used tariff-line data for both Malaysia and the Philippines. For Indonesia and
Thailand, we aggregated the tariff on HS-6 (subheading) level (simple average)
because product codes changed considerably between the two periods, which does
not allow for the (otherwise preferred) matching on tariff-line level. Conversion tables
from WITS were used to match HS-6 data across different classifications.36
Preferential tariffs were set to be equal to the MFN tariff if they were above the MFN
tariff or non-existent.37
Trade data: We used trade data only to define the dummy for preferential imports,
which is one only if a preferential tariff is applied for a product and if there are any
imports of that product from any ASEAN country. Trade data was taken from
Comtrade or IDB (access via WITS). Imports for the base year, and if not available,
for a year close to that were used. We used trade data of the same aggregation level
(tariff line or HS-6) as the tariff data.
35 Tariffs are always applied – not bound - tariffs. 36 The harmonized system (HS) is slightly changed every 4-5 years.

18
Descriptive statistics:38 Tables 5 and 6 show summary statistics for each country.
Even though there are only a few years between the observations we use for each
country, between 64% and 97% of the MFN tariffs of Indonesia, the Philippines and
Thailand changed over these periods and almost all of them were reduced. The
simple average tariffs of these three countries were reduced by more than half. The
only exception is Malaysia, where we observe many unchanged (59%) and increased
(24%) tariffs and a slight overall increase of 0.4 %-points on average.39
As shown by table 5, preferential products had their tariffs reduced relative to non-
preferential products. The difference-in-difference figures are all negative. In all
countries but Malaysia, MFN tariffs of both product types were reduced, but more so
for preferential products. This is a first indicator for a building block effect.
Between 24% and 83% of products received preferences in the base year. However,
according to trade statistics, many of these products were not imported at all from
any ASEAN country, so the preference could not have been used.40 We use this fact
to distinguish between preferential products and products with preference and
imports in the empirical part. The latter ones have a share of 16% to 42%.
The tariff data is best summarized by using two different graphs per country, showing
the distribution of tariffs and tariff changes for both preferential and non-preferential
products (see figures 2a and 2b).41 As shown by the difference-in-difference
calculation, preferential products show a clear tendency towards more MFN-tariff
reduction in Indonesia, the Philippines and Thailand, while the picture is somewhat
less clear for Malaysia.42 Peaks occur at zero change because many products have
37 There were only few cases with CEPT > MFN. Obviously, the CEPT rate would not be used in such a case, so that the MFN rate applies. 38 All figures are based on the data that is used in the empirical part, by leaving out tariff lines that could not be used for the regressions (e.g. due to non-availability in some years). 39 The average tariff of Malaysia has only been slightly reduced since 1993 (see table 2). However, one should be cautious with any interpretation because these figures show unweighted averages. It may well be that Malaysia has in fact liberalized its import regime by much more than these numbers may suggest. 40 We do not have data on utilization rates. It can be assumed that many preferential products were imported without actually receiving a preference, e.g. due to stringent rules of origin and/or too small preferential margins. 41 Remember that a negative tariff change represents an MFN reduction. 42 We provide additional graphs for Thailand and Malaysia that will be used for the interpretation of the estimation results (see below).

19
a zero tariff in both periods, especially in Malaysia. These products are – by definition
– non-preferential products. These graphs therefore indicate a building block effect
for all countries except for Malaysia: Preferential products had their MFN tariffs
subsequently reduced by more. This is in line with our empirical results. In his paper
on the US, Limão uses such a graph as well, but it looks quite different: Products with
a preference had their MFN tariff reduced by less, indicating a stumbling block effect.
We reproduced the graph with Limão’s dataset (figure 4, left graph). The regression
results in Limão (2006) are also in line with the graph.
However, we argue that one should control for the base year MFN tariff. This is
shown by the graphs on the right-hand side of figures 2a, 2b and 3. They show the
distribution of base year MFN tariffs for both preferential and non-preferential
products. We clearly see that products with a preference tended to have higher MFN
tariffs than products without a preference, at least in Indonesia, Malaysia and the
Philippines. This is confirmed by the different base year MFN averages for
preferential and non-preferential products as shown in table 5 (bottom). Therefore,
we can expect that adding the base year MFN tariff in the regression will lower or
even reverse the building block effect that we observe otherwise. This is indeed
mostly the case.
To see how this graph looks like for the US, we added the US base year MFN tariffs
(i.e. the pre-Uruguay round bound MFN tariffs) to Limão’s dataset, so that we can
calculate the base year MFN tariff distribution.43 Figure 4 (right graph) shows the
somehow surprising result: In the US, preferential products tended to have lower
MFN tariffs than non-preferential products – which is the opposite of what we
observe in ASEAN. Therefore, at least part of the US stumbling block effect might
come from the fact that MFN tariffs on preferential products were reduced by less
because they were already lower than tariffs for non-preferential products. We
replicated the basic OLS regression in Limão (2006) and added the base year MFN
tariff to check whether his stumbling block result remains. It does, but its magnitude
is reduced by half.44
43 Limão only shows the distribution of MFN tariff changes (replicated in figure 4, left), which suggests that preferential products have their MFN tariff reduced by less – as confirmed by his regression results. 44 We could only calculate base year tariffs for 4848 out of 5079 products used by Limão. Preferential products are those with ANYPTA=1 in Limão (2006).

Another useful way to summarize the data is shown in figure 5: Here, we plot the
absolute change in the MFN tariff against the preferential margin (which is between 0
and 1). One can see that products with a high preferential margin tend to have their
MFN tariffs reduced by more. Again, we do not control for the base year MFN tariff,
i.e. the negative relationship might be caused by products that already had zero MFN
tariffs in the base year (and therefore a zero preferential margin and no tariff
reduction).
One can obviously not draw a conclusion from these graphs alone because one has
to control for other factors influencing the tariff change, but the regression results are
mostly in line with what one might expect from the graphs.
5. Estimation results and discussion
20
t
We present six regression results for each country, i.e. using the equations (E1), (E2)
and (E3), and each with and without controlling for the base year tariffs (see tables 7-
10).45 For Indonesia and the Philippines, we find tha 1β is negative and significant
for all six different estimations. We get the same result for Thailand, with the
exception of (E2), the model with ( )itASEAN 0 . This means that we
find strong building block effects for 3 out of 4 countries. For Malaysia, 1β is only
negative when we do trol for
imp__&pref_D
not con ( )itMFN 0 , and positive otherwise, so we rather
get a stumbling block effect.
Indonesia (table 7): Looking at ID-1, we see that preferential products in 1995 had
their MFN tariff subsequently reduced by around 2.7 %-points more until 2001 than
those without a preference. But this result is partly caused by the fact that preferential
products also had much higher MFN tariffs in 1995, as we could already expect from
figure 3a. If we control for the MFN tariff in 1995, ( )itpref_D 0 remains negative and
significant (ID-2), but is much smaller. The results are similar for
( )itimpASEAN__&pref_D 0 (ID-3 and ID-4), but the building block effect is
45 All estimations are tagged with the two-letter country code (ID, MY, PH and TH) and a number, i.e. ID-1.

somewhat smaller. The same effect can be found for the preferential margin. The
higher the preferential margin, the more is the MFN tariff reduced. The high
magnitude of (-30.7 in ID-5 and -5.7 in ID-6) is not surprising because
is on average much smaller than
prefmargin
prefmargin ( )itpref_D 0 or
( )i_ timpASEAN 0_&pref_D , but – to put it simple - has to explain the same
magnitude of MFN reduction.
The dummy D_subdivided is not significant, which suggests that the necessary
aggregation on HS-6 level does not significantly affect our results. Agricultural
products had their MFN tariff reduced by much less than industrial products.
Malaysia (table 8a): We get ambigious results for Malaysia. The first regression (MY-
1) suggests that AFTA had a small building block effect. But when we control for
MFN1997, we see that the sign of ( )itpref_D 0 is reversed (MY-2). This is not
surprising, as we know from the distributions of the MFN tariff change and the initial
MFN tariff that preferential products have no tendency towards more reduction, but
had much higher initial MFN tariffs. With ( )it0impASEAN__&pref_D
prefmargin
, we get a
stumbling block effect in both modifications (MY-3 and MY-4). However, we get a
significant building block effect when using instead of the dummies (MY-
5 and MY-6). The difference between MY-2 and MY-6 is somewhat surprising. A
possible interpretation is the following: Full-margin products (i.e. prefmargin=1) show
on average a high MFN reduction, but products with only a partial preferential margin
(which is usually between 0.2 and 0.6 in Malaysia) show on average a slight
increase. The estimated coefficient for prefmargin goes up when we control for the
initial MFN tariff, but remains negative because both products with a full preferential
margin and those with only a partial preferential margin have a very similar
distribution of their initial MFN tariffs – while non-preferential products have much
lower initial tariffs.46 This means that the initial MFN tariff does not explain the
different MFN reductions of full-margin and partial-margin products.
21
46 We provide two additional distribution graphs to show this (figure 3a, dashed frames). They are constructed in the same way as the other graphs, but distinguish between non-preferential products, products with partial and with full preferential margin.

Philippines (table 9): The results very much resembles those of Indonesia. We find a
significant building block effect in all six modifications, but generally a significant, but
smaller effect when controlling for the MFN tariff in the base year 1998. This is again
what we expected because of the distribution of both the MFN change and the base
year MFN tariff.
Thailand (table 10): The results for ( )itpref_D 0 and are similar to those of
Indonesia and the Philippines – we get a significant building block effect. The effect is
nearly the same if we control for the base year MFN tariff in 1993. One could at least
partly explain this by the fact that preferential products do not show a clear tendency
to have higher or lower base year MFN tariffs than non-preferential products (see
figure 3b) – in contrast to the other countries. The estimations for
prefmargin
( )itimpASEAN__&pref_D 0 are not significant, suggesting that there was neither a
building block nor a stumbling block effect of real preferences – those preferences
given to products that were actually imported from other ASEAN members. Only
around half of all products with a preference in 1993 were also imported from ASEAN
in that year. Figure 3b shows two different distributions of Thailand’s MFN tariff
changes for preferential and non-preferential products: One is based on ( )itpref_D 0
(as the distributions shown for the other countries), and the second one (dashed
frame) is based on ( )it_& 0impASEAN_pref_D , i.e. it compares products that
received a preference and were imported with the other products. The result is
striking: Both types of products show a nearly identical distribution of MFN tariff
changes, while the distribution is very different between non-preferential and
preferential products. This is very much in line with the regression results: ( )itpref_D 0
is significant, and ( )itimpASEAN 0__&pref_D is not.47
Are these results also significant from an economic point of view? The results for
Indonesia, the Philippines and Thailand suggest that granting a preference means
that the MFN tariff is reduced by roughly 1 to 5 %-points more than otherwise. This is
quite a lot compared to the average MFN reduction of Indonesia (8.5 %-points) and
22
47 This additional distribution is only shown for Thailand. For the other countries, there is no such obvious difference between the tow types of distribution.

23
the Philippines (5 %-points) and the average initial tariffs of these countries (15% and
10%). Thailand had very high tariffs in the base year (46%) and reduced them by 30
%-points. Therefore, the average effect of a preference of 2 %-points is relatively
small, but not neligible. Results for Malaysia have mixed signs, but the estimated
coefficients for the preference dummy are also relatively high compared to the
average tariff level of roughly 8%.
6. Robustness tests As a first robustness test, we repeated all regressions, but took out all products that
had a zero MFN tariff in the base year.48 In his paper on the US, Limão (2006) also
only considered products with a positive MFN tariff before the Uruguay round,
arguing that preferences are irrelevant for zero MFN products and that these
products are also “likely to share an unobserved common characteristic”. We do not
necessarily share this notion for the case of ASEAN, but nevertheless checked for
whether our results might be affected by these zero-tariff products. The share of
products with a zero MFN tariff in the base year varies across countries. Malaysia
has the highest share with 46.8% and Indonesia comes second with 10.5%. The
Philippines and Thailand had very few zero tariff products (0.2% and 0.3%, see
table 5). Not surprisingly, the results for Indonesia, the Philippines and Thailand are
very similar to the results of our main regressions.49 But even for Malaysia, the
results are quite similar (see table 8b). The sign and overall magnitude of the
relevant explanatory variable is identical and all results remain significant. The
constant is much lower because tariffs were on average reduced by much more – the
zero MFN tariffs could not have been reduced (in fact, 11% of them were increased,
the others remained zero). It therefore seems that our results do not depend on
whether we include zero tariff products or not.
A few chapters do only conclude products that receive a reference or only those
without a preference. We therefore repeated all regressions, but by including only
chapters that consist of both preferential and non-preferential products.50 The results
48 By definition, the CEPT is then also zero. 49 The results are therefore not shown. 50 We used D_Pref as the definition of preferential products, not D_pref_&_impASEAN. The remaining observations, as a share of total observations, are 69% for Indonesia, 93% for Malaysia, 88% for the Philippines and 83% for Thailand.

were very similar. This is indeed not surprising, since we use chapter dummies in all
regressions.
We also did a robustness test with 4-digit industry dummies (i.e. on “heading” level).
We only include headings that cover at least one preferential product and one non-
preferential product.51 This leaves much less observations compared to our original
dataset: 14% for Indonesia, 45% for Malaysia, 25% for the Philippines and 16% for
Thailand. The reason is that most headings either only consist of preferential
products or only of non-preferential products. Because of that, we do not believe that
the results are particularly meaningful. Table 11 shows the results for the most
relevant estimated variable . We re-estimated only equations 1 and 3. The sign of
in equations 1 and 3 is identical to our main results for Malaysia (for which we
could also use a rather high share of the observations). The estimates for equation 3
are identical for Thailand, but estimates for equation 1 are not significant.
1β
1β
1β
becomes insignificant (Philippines) or positive (Indonesia) when we control for the
initial MFN tariff, but are otherwise identical. This means that our results are not
entirely robust if we control for product-specific characteristics on a 4-digit level, but
our dataset does not allow us to do such a test in a reasonable way because we can
only use a few observations. We therefore believe that chapter dummies are the
most useful level on which we should control for product-specific characteristics.
7. Conclusion and outlook for further research Do free trade agreements affect non-discriminatory trade liberalization? Empirical
research based on tariff schedules has just started recently, and the main available
evidence that we have so far from Nuno Limão suggests that FTAs rather hinder the
reduction of MFN tariffs. Estevadeordal et al. find the opposite effect for some Latin
American countries, but by using a different approach with more aggregated data. By
using a method similar to Limão’s, but applying it to major members of ASEAN and
also controlling for the initial level of MFN tariffs, we get very different results. Our
results for three out of four countries that we looked at (Indonesia, the Philippines
and Thailand) suggest that MFN tariffs were reduced by more if a preferential tariff
24

25
were applied to products – a building block effect. These results do not depend on
whether we use the original approach used by Limão or our slightly different
approach (taking into account the base year MFN tariff). We only get ambiguous
results for Malaysia, which might be related to the fact that our data for Malaysia
covers a period in which the average MFN tariff remained unchanged and a lot of
liberalization had already taken place beforehand. This means that Limão’s results
can not easily be transferred to other countries. In fact, it might well be that FTAs
have worked as building blocks in many countries.
Further research could be done in two directions: Using our dataset on ASEAN, one
could use more advanced econometric techniques, though this most probably won’t
change much of our qualitative results. One could also use more explanatory
variables, especially trade data. Finding interesting relationships between trade data
and tariff data would itself be a very interesting topic and could be done with our
data. This could also be used to shed more light on the question of whether AFTA
preferences had any direct impact on trade flows. So far, economists have almost
exclusively tried to answer that question using the gravity approach on a very
aggregated level of trade flows, but the available data suggests that one could do so
on a much more detailed level.
The other direction would be to apply the same method to other countries. ASEAN
members are a very good example because the preferential agreement has existed
for a sufficiently long period of time, MFN tariffs subsequently changed and the tariff
data is available. But there certainly exist other countries for which these conditions
are fulfilled, e.g. in Latin America or the Middle East.
A conclusion that one could draw from our paper is that AFTA might have had a
bigger impact than the very low utilization rates and trade-weighted preferential
margins might suggest: Even though few traders seem to actually use AFTA, it might
have been a stepping stone to MFN tariff reductions of the major ASEAN members.
The unilateral and non-discriminatory trade liberalization that these countries have
undergone over the last decades is indeed remarkable and was probably necessary
51 Otherwise we would have to use more than 1000 heading dummies, of which many represent only a single product. All preferences are defined using D_Pref, rather than D_pref_&_impASEAN. Limão (2005) uses a very similar robustness check.

26
to develop export-oriented industries that often rely on imports of intermediate
products from many countries, both inside and outside ASEAN.52 Regionalism alone
would not have been sufficient for that.
52 See figure 2 (taken from Baldwin (2006)) for an enlightening example. It shows the sources of inputs for hard disc production in Thailand.

27
8. References ASEAN (1995). AFTA Reader Volume II, March 1995. ASEAN Secretariat, Jakarta.
Found at http://www.aseansec.org/5185.htm
ASEAN (1993). AFTA Reader Volume I, November 1993. ASEAN Secretariat,
Jakarta. Found at http://www.aseansec.org/5185.htm
Austria, M. (2004). The patterns of intra-ASEAN trade in the priority goods sectors.
Regional Economic Policy Support Facility, Jakarta.
Bagwell, K. & Staiger, R. (1997). Regionalism and Multilateral Tariff Cooperation.
NBER Working Paper 5921. NBER, Cambridge MA.
Baldwin, R. (2007). Regionalism and the World Trade System. Draft paper.
Baldwin, R. (2006). Multilateralising Regionalism: Spaghetti Bowls as Building Blocs
on the Path to Global Free Trade. The World Economy, Volume 29, Issue 11.
Baldwin, R. (2004). Stepping stones or building blocs? Regional and multilateral
integration. Forthcoming. Found at http://hei.unige.ch/~baldwin/
Bergsten, F. (1997). Open Regionalism. The World Economy, Volume 20, Issue 5.
Bhagwati, J. (1992). Regionalism versus Multilateralism. The World Economy,
Volume 15, Issue 5.
Elliott, R. & Ikemoto, K. (2004). AFTA and the Asian Crisis: Help or Hindrance to
ASEAN Intra-Regional Trade? Asian Economic Journal, Volume 18, No. 1.
Estevadeordal, A., Freund, C. & Ornelas, E. (2006). Do Regional Trade Agreements
Promote External Trade Liberalization? Evidence from Latin America.
Working Paper.
Found at http://professores.ibmecrj.br/erg/wkshops/papers/20060922.pdf
Krueger, A. (1999). Are Preferential Trading Arrangements Trade-Liberalizing or
Protectionist? The Journal of Economic Perspectives, Vol. 13, No. 4. (Autumn,
1999), pp. 105-124.
Limão, N. (2006). Preferential Trade Agreements as Stumbling Blocks for Multilateral
Trade Liberalization: Evidence for the U.S. American Economic Review, June,
p. 896-914.
Limão, N. (2005a). Preferential Trade Agreements as Stumbling Blocks for
Multilateral Trade Liberalization: Evidence for the U.S. CEPR Discussion
Paper No. 4884.

28
Limão, N. & Karacaovali, B. (2005b). The Clash of Liberalizations: Preferential vs.
Multilateral Trade Liberalization in the European Union. CEPR Discussion
Paper no. 4793.
Manchin, M. & A. Pelkmans-Balaoing (2007). Clothes without an Emperor. Analysis
of the Preferential Tariffs in ASEAN. Development Studies Working Papers
No. 223. Centro Studi Luca D’Agliano, Milano. Found at
http://papers.ssrn.com/sol3/papers.cfm?abstract_id=964161
Panagariya, A. (1999). The Regionalism Debate: An Overview. The World Economy,
Volume 22, Issue 4.

9. Figures and tables Table 1: Trade flows in ASEAN in 2005
importing country To
tal i
n m
illio
n U
SD
ASE
AN
Sin
gapu
r
Thai
land
Mal
aysi
a
Indo
nesi
a
Phi
lippi
nes
othe
r AS
EA
N
extr
a-A
SEA
N
Japa
n
Chi
na
US
EU
-25
othe
r ext
ra-A
SE
AN
Singapur 200050 26.1% 3.8% 13.7% 5.2% 2.3% 1.1% 73.9% 9.6% 10.3% 11.7% 11.5% 30.8%Thailand 118164 19.5% 4.6% 6.8% 2.6% 1.6% 3.8% 80.5% 22.0% 9.4% 7.4% 9.1% 32.6%Malaysia 114584 25.5% 11.7% 5.3% 3.8% 2.8% 1.9% 74.5% 14.5% 11.5% 12.9% 11.6% 23.9%Indonesia 57701 30.0% 16.4% 6.0% 3.7% 0.6% 3.4% 70.0% 12.0% 10.1% 6.7% 10.1% 31.0%Philippines 46954 19.3% 7.9% 3.5% 3.8% 2.3% 1.8% 80.7% 17.1% 6.5% 17.5% 7.8% 31.7%Sum 537453 24.3% 6.0% 3.5% 7.3% 3.5% 1.9% 75.7% 14.3% 10.0% 11.0% 10.5% 29.8% Source: Own calculations, based on ITC TradeMap. Data is for 2005 and is reported by the importing country.
Table 2: Average CEPT and MFN rates by country (in %) Country Scheme 1993 1994 1995 1996 1997 1998 1999 2000 2001 2002 2003
CEPT 17.3 17.3 15.2 10.4 8.5 7.1 5.4 4.8 4.3 3.7 2.2MFN 23.3 20.7 15.4 13.4 11.3 8.7 8.7 8.7CEPT 10.8 10 9.2 4.6 4.1 3.5 3.2 3.3 2.7 2.6 2MFN 16.8 13.6 13.6 13.6 13.4 13.4CEPT 12.5 11.4 10.7 9.6 9.2 7.7 7.3 5.2 4.5 4.1 3.8MFN 27.5 26.6 23.6 13 11.6 9 8.6 6.4 5CEPT 19.9 19.8 18.2 14.2 12.9 10.2 9.6 6.1 5.7 5 4.6MFN 54.6 25.9 19.6 18.9 17.8
Indonesia
Malaysia
Philippines
Thailand
Source: CEPT tariffs are taken from Austria (2004). MFN tariffs are taken from UNCTAD, Handbook of Statistics 2005. The MFN tariff covers only non-agricultural and non-food products. Our own calculations based on raw data therefore differ from figures in this table.
29

Table 3: Weighted and unweighted absolute preferential margins in ASEAN
year MFN minus CEPT Indonesia Malaysia Philippines Thailandsimple average 7.1% 7.7% 5.0% 9.8%
trade-weighted (average) 3.6% 2.5% 2.7% 3.7%trade-weighted (maximum) 5.6% 3.8% 3.3% 4.3%
covered trade 98% 96% 98% 93%year 1995 1997 1998 1993
simple average 2.2% 3.9% 1.5% 22.9%trade-weighted (average) 0.9% 1.3% 0.6% 21.6%
covered trade 90% 78% 94% 91%
2005
base year
Source: 2005: Tariff data is from the ASEAN secretariat, trade data from ITC TradeMap. base year: Same data used as for empirical analysis. Explanations: “Covered trade” shows how much of total imports are covered by the calculations. Preferences were calculated on tariff-line or HS-6 level and then matched with HS-6 trade data by using a simple average. However, the trade-weighted preference for 2005 is calculated in two ways: By using the tariff calculated with a simple average and by using the highest preference within each HS-6 line (“maximum”). This figure therefore shows the hypothetical maximum trade-weighted preference that might exist. The true value could only be calculated with tariff-line import data, which is not available in a form that it can be matched with the tariff data. The simple average was calculated on tariff-line level. Results for 2005 and “base year” are based on different data and should therefore be compared carefully. No calculations have been made for Singapore, as Singapore has zero MFN tariffs on practically all products (except for a few alcoholic beverages).
Table 4: Definitions of variables Variable Description Source
iτΔ (year1,year0) =100*(ln(1+MFN(year1))-ln(1+MFN(year0))) (logarithmic form of MFN tariff reduction, dependent variable)
WITS and ASEAN secretariat
D_prefyear =1 if the CEPT tariff is below the MFN tariff in that year (only used for base year)
WITS
D_prefyear_&_impASEAN
=1 if D_prefyear=1 and if product is imported from any ASEAN country WITS
prefmarginyear = 1-ceptyear/mfnyear (=0 if mfnyear=0) (only used for base year) own calculation
MFNyear =100*(ln(1+MFN_tariff(year)) (logarithmic form of MFN tariff) WITS
D_subdivided = 1 if there is further subdivision below the HS-6 level in the base year (only used Thailand and Indonesia)
-
D_Agri = 1 if the product falls within chapters 1-24 (approximately the WTO agriculture definition) -
30

Table 5: Sources and main indicators by country
Indonesia Malaysia Philippines Thailand
Base year and final year 1995 - 2001 1997 – 2003 1998 - 2003 1993 – 2001
Source for tariff data WITS (TRAINS)
WITS (TRAINS),
ASEAN secretariat
WITS (IDB)
WITS (TRAINS),
ASEAN secretariat
Source for trade data COMTRADE WITS (IDB) WITS (IDB) COMTRADE Level of aggregation HS-6-digit Tariff-line Tariff-line HS-6-digit How many of available product codes could be used?
4928 of 5013 (98%)
8258 of 8733 (95%)
5396 of 5678 (95%)
4774 of 4969 (96%)
Which share of imports in t(0) is covered by available tariff data? 90% 78% 94% 91%
Share of products that received preferences in t(0) 53% 26% 24% 83%
Share of products that received preferences in t(0) and were also imported from ASEAN
35% 17% 16% 42%
Share of products that had their MFN tariff reduced (-), increased (+) or unchanged (=) between t(0) and t(1)
(-) 67% (+) 1%
(=) 32%
(-) 17% (+) 24% (=) 59%
(-) 64% (+) 0%
(=) 36%
(-) 95% (+) 2% (=) 3%
Share of products with MFN=0 in base year 10.5% 46.8% 0.2% 0.3%
Average MFN tariff change (%-points, not with log)
- all products -8.552 0.403 -5.403 -29.798 - preferential products -11.051 -0.888 -12.030 -31.590 - non-preferential products -5.741 1.346 -3.361 -21.065 - difference-in-difference -5.310 -2.234 -8.669 -10.525 Average base year MFN tariff (%-points, not with log)
- all products 15.433 8.128 10.448 45.890 - preferential products 18.607 16.914 19.198 46.553 - non-preferential products 11.861 1.717 7.752 42.661
31

Table 6: Additional summary statistics by country Indonesia (4928 observations) Mean Std. Dev. Min Max
iτΔ (2001,1995) -7.338 8.413 -64 66
D_pref1995 0.529 0.499 0 1 D_pref1995_&_impASEAN 0.348 0.476 0 1 Prefmargin1995 0.091 0.116 0 1 CEPT1995 13.274 11.963 0 200 MFN1995 15.433 13.718 0 200 MFN2001 6.881 9.669 0 170 MFN1995 (log form) 13.720 10.993 0 110 D_subdivided 0.389 0.488 0 1 D_Agri 0.138 0.345 0 1 Malaysia (8258 observations) Mean Std. Dev. Minimum Maximum
iτΔ (2003,1997) 0.296 8.709 -105 69 D_pref1997 0.422 0.494 0 1 D_pref1997_&_impASEAN 0.235 0.424 0 1 Prefmargin1997 0.247 0.347 0 1 CEPT1997 4.199 8.591 0 187 MFN1997 8.128 11.628 0 187 MFN2003 8.532 12.268 0 200 MFN1997 (log form) 7.330 9.503 0 105 D_subdivided - - - - D_Agri 0.124 0.330 0 1 Philippines (5396 observations) Mean Std. Dev. Min Max
iτΔ (2003,1998) -4.738 5.325 -25 17 D_pref1998 0.236 0.424 0 1 D_pref1998_&_impASEAN 0.163 0.369 0 1 Prefmargin1998 0.085 0.170 0 1 CEPT1998 8.904 9.538 0 80 MFN1998 10.448 10.682 0 80 MFN2003 5.046 5.851 0 50 MFN1998 (log form) 9.526 8.816 0 59 D_subdivided - - - - D_Agri 0.142 0.349 0 1 Thailand (4774 observations) Mean Std. Dev. Min Max
iτΔ (2001,1993) -22.135 13.624 -64 21 D_pref1993 0.830 0.376 0 1 D_pref1993_&_impASEAN 0.424 0.494 0 1 Prefmargin1993 0.470 0.291 0 1 CEPT1993 22.950 16.166 0 100 MFN1993 45.890 25.150 0 200 MFN2001 16.092 13.832 0 80 MFN1993 (log form) 36.388 16.348 0 110 D_subdivided 0.035 0.183 0 1 D_Agri 0.132 0.338 0 1 Remark: All tariff data is shown in percentage points.
32
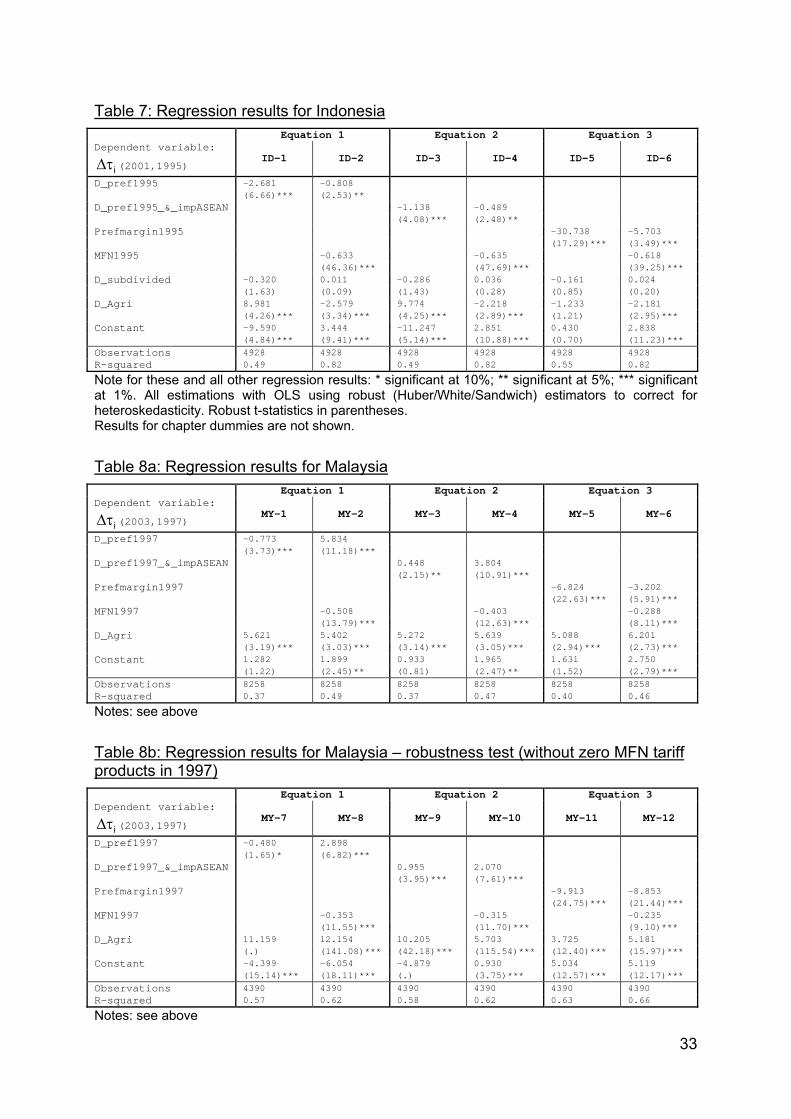
Table 7: Regression results for Indonesia Equation 1 Equation 2 Equation 3 Dependent variable:
iτΔ (2001,1995) ID-1 ID-2 ID-3 ID-4 ID-5 ID-6
D_pref1995 -2.681 -0.808 (6.66)*** (2.53)** D_pref1995_&_impASEAN -1.138 -0.489 (4.08)*** (2.48)** Prefmargin1995 -30.738 -5.703 (17.29)*** (3.49)*** MFN1995 -0.633 -0.635 -0.618 (46.36)*** (47.69)*** (39.25)*** D_subdivided -0.320 0.011 -0.286 0.036 -0.161 0.024 (1.63) (0.09) (1.43) (0.28) (0.85) (0.20) D_Agri 8.981 -2.579 9.774 -2.218 -1.233 -2.181 (4.26)*** (3.34)*** (4.25)*** (2.89)*** (1.21) (2.95)*** Constant -9.590 3.444 -11.247 2.851 0.430 2.838 (4.84)*** (9.41)*** (5.14)*** (10.88)*** (0.70) (11.23)*** Observations 4928 4928 4928 4928 4928 4928 R-squared 0.49 0.82 0.49 0.82 0.55 0.82
Note for these and all other regression results: * significant at 10%; ** significant at 5%; *** significant at 1%. All estimations with OLS using robust (Huber/White/Sandwich) estimators to correct for heteroskedasticity. Robust t-statistics in parentheses. Results for chapter dummies are not shown.
Table 8a: Regression results for Malaysia Equation 1 Equation 2 Equation 3 Dependent variable:
iτΔ (2003,1997) MY-1 MY-2 MY-3 MY-4 MY-5 MY-6
D_pref1997 -0.773 5.834 (3.73)*** (11.18)*** D_pref1997_&_impASEAN 0.448 3.804 (2.15)** (10.91)*** Prefmargin1997 -6.824 -3.202 (22.63)*** (5.91)*** MFN1997 -0.508 -0.403 -0.288 (13.79)*** (12.63)*** (8.11)*** D_Agri 5.621 5.402 5.272 5.639 5.088 6.201 (3.19)*** (3.03)*** (3.14)*** (3.05)*** (2.94)*** (2.73)*** Constant 1.282 1.899 0.933 1.965 1.631 2.750 (1.22) (2.45)** (0.81) (2.47)** (1.52) (2.79)*** Observations 8258 8258 8258 8258 8258 8258 R-squared 0.37 0.49 0.37 0.47 0.40 0.46
Notes: see above
Table 8b: Regression results for Malaysia – robustness test (without zero MFN tariff products in 1997) Equation 1 Equation 2 Equation 3 Dependent variable:
iτΔ (2003,1997) MY-7 MY-8 MY-9 MY-10 MY-11 MY-12
D_pref1997 -0.480 2.898 (1.65)* (6.82)*** D_pref1997_&_impASEAN 0.955 2.070 (3.95)*** (7.61)*** Prefmargin1997 -9.913 -8.853 (24.75)*** (21.44)*** MFN1997 -0.353 -0.315 -0.235 (11.55)*** (11.70)*** (9.10)*** D_Agri 11.159 12.154 10.205 5.703 3.725 5.181 (.) (141.08)*** (42.18)*** (115.54)*** (12.40)*** (15.97)*** Constant -4.399 -6.054 -4.879 0.930 5.034 5.119 (15.14)*** (18.11)*** (.) (3.75)*** (12.57)*** (12.17)*** Observations 4390 4390 4390 4390 4390 4390 R-squared 0.57 0.62 0.58 0.62 0.63 0.66
Notes: see above
33

Table 9: Regression results for the Philippines Equation 1 Equation 2 Equation 3 Dependent variable:
iτΔ (2003,1998) PH-1 PH-2 PH-3 PH-4 PH-5 PH-6
D_pref1998 -5.669 -1.882 (34.26)*** (14.40)*** D_pref1998_&_impASEAN -4.408 -1.315 (28.16)*** (12.41)*** Prefmargin1998 -10.859 -3.265 (25.50)*** (11.23)*** MFN1998 -0.496 -0.515 -0.509 (46.86)*** (50.10)*** (48.51)*** D_Agri 3.758 0.379 7.014 1.261 3.958 0.416 (5.41)*** (0.68) (9.33)*** (3.98)*** (5.65)*** (0.75) Constant -4.224 0.949 -7.479 0.135 -4.423 0.959 (7.92)*** (1.73)* (12.36)*** (0.44) (8.19)*** (1.75)* Observations 5396 5396 5396 5396 5396 5396 R-squared 0.57 0.85 0.52 0.84 0.54 0.85
Notes: see above
Table 10: Regression results for Thailand Equation 1 Equation 2 Equation 3 Dependent variable:
iτΔ (2001,1993) TH-1 TH-2 TH-3 TH-4 TH-5 TH-6
D_pref1993 -2.424 -1.978 (5.85)*** (5.30)*** D_pref1993_&_impASEAN 0.109 0.108 (0.50) (0.58) Prefmargin1993 -10.870 -9.448 (18.43)*** (18.13)*** MFN1993 -0.585 -0.589 -0.553 (29.10)*** (29.55)*** (29.25)*** D_subdivided 2.154 1.573 2.097 1.521 2.707 2.088 (3.73)*** (2.96)*** (3.52)*** (2.80)*** (5.14)*** (4.36)*** D_Agri 20.674 -1.827 21.481 -1.635 3.202 -2.374 (33.52)*** (3.36)*** (45.96)*** (2.72)*** (2.33)** (4.21)*** Constant -19.058 8.167 -21.517 6.359 -15.786 9.629 (30.42)*** (7.57)*** (45.06)*** (6.29)*** (34.79)*** (10.49)*** Observations 4774 4774 4774 4774 4774 4774 R-squared 0.78 0.83 0.78 0.83 0.80 0.85
Notes: see above
Table 11: Robustness test with 4-digit industry dummies (results for β1 only) Dependent variable:
iτΔ Equation 1 (D_pref) Equation 3 (Prefmargin)
Controlling for MFN(t0)i
no yes no yes
Indonesia (671)§ -1.537 1.040 -16.414 7.834 (2.86)*** (4.95)*** (4.34)*** (3.97)***
Malaysia (3676)§ -1.064 2.328 -4.733 -3.18 (4.48)*** (6.27)*** (12.23)*** (7.86)***
Philippines (1338)§ -4.844 -0.193 -8.975 0.145 (17.76)*** (0.38) (14.06)*** (0.35)
Thailand (783)§ -0.514 -0.551 -2.957 -3.052 (1.30) (1.43) (3.32)*** (3.47)***
All estimations with OLS using robust (Huber/White/Sandwich) estimators to correct for heteroskedasticity. Robust absolute t-statistics in parentheses. Only results for are shown. 1β* significant at 10%; ** significant at 5%; *** significant at 1% Results for 4-digit industry dummies are not shown. §: number of observations
34

Figure 1: Share of intra-ASEAN trade 1980-2005
0%
5%
10%
15%
20%
25%
30%19
80
1981
1982
1983
1984
1985
1986
1987
1988
1989
1990
1991
1992
1993
1994
1995
1996
1997
1998
1999
2000
2001
2002
2003
2004
2005
MalaysiaThailandIndonesiaPhilippinesSingaporeASEAN5
Source: WITS (Comtrade). ASEAN5 refers to the 5 countries shown in the graph.
Figure 2: Example of production unbundling in Thailand
Source: Baldwin (2007)
35

Figure 3a: Distribution of MFN tariff changes (left) and MFN tariffs in base year (right) for Indonesia and Malaysia53
0.0
5.1
.15
Den
sity
-40 -20 0 20Change in MFN tariff between 1995 and 2001 (log-linearized)
no preference in 1995 preference in 1995
Indonesia
0.0
2.0
4.0
6.0
8D
ensi
ty
0 10 20 30 40 50Distribution of base-year MFN tariff (1995)
no preference in 1995 preference in 1995
Indonesia
0.1
.2.3
Den
sity
-50 0 50Change in MFN tariff between 1997 and 2003 (log-linearized)
no preference in 1997 preference in 1997
Malaysia0
.1.2
.3.4
Den
sity
0 10 20 30 40 50Distribution of base-year MFN tariff (1997)
no preference in 1997 preference in 1997
Malaysia
36
53 Notes for graphs on this page: Indonesia and Malaysia: only tariffs with ¦MFN¦<50 are shown.
0.1
.2.3
Den
sity
-40 -20 0 20 40Change in MFN tariff between 1997 and 2003 (log-linearized)
no preference in 1997 pref. margin between 0 and 1pref. margin = 1
Malaysia
0.1
.2.3
.4D
ensi
ty
0 10 20 30 40 50Distribution of base-year MFN tariff (1997)
no preference in 1997 pref. margin between 0 and 1pref. margin = 1
Malaysia

Figure 3b: Distribution of MFN tariff changes (left) and MFN tariffs in base year (right) for the Philippines and Thailand54
37
54 Notes for graphs on this page: Thailand: The lower graph shows the distribution based on preferential imports (i.e. preference and imports from ASEAN) as explained in the text. Philippines: The right graph only shows tariffs with MFN<50.
0.0
5.1
.15
.2.2
5D
ensi
ty
0 10 20 30 40 50Distribution of base-year MFN tariff (1998)
no preference in 1998 preference in 1998
Philippines
0.0
5.1
.15
.2.2
5D
ensi
ty
-30 -20 -10 0 10 20Change in MFN tariff between 1998 and 2003 (log-linearized)
no preference in 1998 preference in 1998
Philippines
0.0
2.0
4.0
6D
ensi
ty
-60 -40 -20 0 20Change in MFN tariff between 1993 and 2001 (log-linearized)
no preference in 1993 preference in 1993
Thailand0
.01
.02
.03
.04
Den
sity
0 50 100 150 200Distribution of base-year MFN tariff (1993)
no preference in 1993 preference in 1993
Thailand
0.0
1.0
2.0
3.0
4.0
5D
ensi
ty
-60 -40 -20 0 20Change in MFN tariff between 1993 and 2001 (log-linearized)
no preferential imports in 1993 preferential imp. in 1993
Thailand

Figure 4: Distribution of MFN tariff changes (left) and MFN tariffs in base year (right) for the US55
0.0
5.1
.15
Den
sity
0 10 20 30 40 50Distribution of pre-Uruguay round bound MFN tariff
no preference preference
United States (own calculation)
0.0
5.1
.15
.2.2
5D
ensi
ty
-30 -20 -10 0 10
no preference preference
United States (from Limao, 2006)
Figure 5: MFN changes and preferential margins56
-100
-50
050
100
MFN
tarif
f cha
nge
1995
-200
1 (lo
g-lin
eariz
ed)
0 .2 .4 .6preferential margin in 1995
Indonesia - MFN change vs. preferential margin
-100
-50
050
100
MFN
tarif
f cha
nge
1997
-200
3 (lo
g-lin
eariz
ed)
0 .2 .4 .6 .8 1preferential margin in 1997
Malaysia - MFN change vs. preferential margin
-30
-20
-10
010
20M
FN ta
riff c
hang
e 19
98-2
003
(log-
linea
rized
)
0 .2 .4 .6 .8preferential margin in 1998
Philippines - MFN change vs. preferential margin
-60
-40
-20
020
MFN
tarif
f cha
nge
1993
-200
1 (lo
g-lin
eariz
ed)
0 .2 .4 .6 .8 1preferential margin in 1993
Thailand - MFN change vs. preferential margin
55 Source: left graph: Limão (2006), right graph: own calculation
38
56 Plots are done with Stata. To make clusters more visible, all dots are randomly distributed with a 1% margin around their exact values (using the “jitter”-function of Stata).