Sites of cone system sensitivity loss in retinitis pigmentosa.
THE ARTIFICIAL SILICON RETINA IN RETINITIS PIGMENTOSA PATIENTS (AN AMERICAN OPHTHALMOLOGICAL ASSOCIATION THESIS) BY Alan Y. Chow MD, Ava K. Bittner, OD, and Machelle T. Pardue, PhD
ABSTRACT Purpose: In a published pilot study, a light-activated microphotodiode-array chip, the artificial silicon retina (ASR), was implanted subretinally in 6 retinitis pigmentosa (RP) patients for up to 18 months. The ASR electrically induced retinal neurotrophic rescue of visual acuity, contrast, and color perception and raised several questions: (1) Would neurotrophic effects develop and persist in additionally implanted RP patients? (2) Could vision in these patients be reliably assessed? (3) Would the ASR be tolerated and function for extended periods? Methods: Four additional RP patients were implanted and observed along with the 6 pilot patients. Of the 10 patients, 6 had vision levels that allowed for more standardized testing and were followed up for 7+ years utilizing ETDRS charts and a 4-alternative forced choice (AFC) Chow grating acuity test (CGAT). A 10-AFC Chow color test (CCT) extended the range of color vision testing. Histologic examination of the eyes of one patient, who died of an unrelated event, was performed. Results: The ASR was well tolerated, and improvement and/or slowing of vision loss occurred in all 6 patients. CGAT extended low vision acuity testing by logMAR 0.6. CCT expanded the range of color vision testing and correlated well with PV-16 (r = 0.77). An ASR recovered from a patient 5 years after implantation showed minor disruption and excellent electrical function. Conclusion: ASR-implanted RP patients experienced prolonged neurotrophic rescue of vision. CGAT and CCT extended the range of acuity and color vision testing in low vision patients. ASR implantation may improve and prolong vision in RP patients. Trans Am Ophthalmol Soc 2010;108:120-154
INTRODUCTION
PURPOSE AND REPORT OF PRIOR INVESTIGATIONS Photoreceptor-specific degeneration is known to occur in retinal disorders such as retinitis pigmentosa (RP)1,2 and dry age-related macular degeneration (AMD).3 The absence of effective therapeutic remedies has stimulated the development of strategies to restore some level of visual function to these patients. Since the 1980s, drug and gene therapies4,5 have been investigated along with transplantation of retinal tissues into the damaged retina.6,7
Since the remaining retinal layers in the eyes of patients with photoreceptor degenerations may be relatively spared,1,2,8 a number of approaches have been proposed to artificially stimulate the remaining retina electrically and thereby the visual process. The possibility that the retina may be activated electrically has received support from a number of studies historically. For example, electrical stimulation applied to the eyeball surface is known to evoke visual sensations or phosphenes in normal subjects9-13 and in patients blinded by RP.14 A corresponding electrophysiological response can also be recorded from the visual cortex of RCS rats,15 a model of photoreceptor degeneration,16 when the eye is electrically stimulated. When electrical stimulation was moved to within the eye itself, stimulation of the retinal nerve fiber layer surface was found to result in reproducible cortical potentials in normal animal subjects17 and phosphenes in RP patients.18 Finally, in vitro and in vivo studies demonstrated that electrical potentials may be evoked by electrical stimulation of the outer retina, the initiation point of visual imagery.19-22
On the basis of these observations, two general approaches have evolved for developing retinal-based visual prostheses designed to be implanted into the eye to produce an acute stimulated pattern of vision based on pixelated phosphenes.21-31 They are the epiretinal approach25-27,30,31 and the subretinal approach,21-24,28,29 and they derive their names from the location of their stimulating electrodes relative to the retina. Both require some degree of preservation and intactness of retinal anatomy and function. Although optic nerve32,33 and occipital lobe34-38 electrical stimulation can also produce phosphenes, these latter approaches rely on the intactness of different structures in the visual pathway and use significantly different stimulation apparatus. Because optic nerve and cortical stimulation occurs more distal to the source of the retinal image, greater stimulation complexity would theoretically be needed to re-create visual imagery. Retinal stimulation has the advantage of closeness to the original and possibly simpler-to-replicate analog signals of the photoreceptor and bipolar layers or the early processed digital signals of the nerve fiber layer. Further, stimulating the retina in the pattern of external images can theoretically produce a retinotopically correct representation of the image.
The Epiretinal Approach The epiretinal approach involves a semiconductor-based device powering a patterned electrode grid placed in contact with the nerve fiber layer surface of the retina.18,25-27 In the only chronically implanted device reported,25,26 a 16-platinum electrode grid, embedded in a silicone platform, was inserted into the eye and secured by a retinal tack to the nerve fiber layer surface. The electrode grid was connected via 16 flexible insulated conductors that penetrated the sclera and orbit and ran in a channel drilled along the skull to the temporal bone. At that location, the conductors were connected to a stimulating module powered by an external inductive wireless antenna link. The external antenna received power and signals from a computer that processed the optical signals from an imaging camera placed on a pair of glasses worn by the patient. The vision of the one implant patient was tested with four orientations of
From the Department of Ophthalmology, Rush University Medical Center, Chicago, Illinois, and Optobionics, Wheaton, Illinois.
Trans Am Ophthalmol Soc / 108 / 2010 120

Chow
square-wave gratings, and his accuracy was reported to be better than chance. The logarithm of the minimum angle of resolution (logMAR) acuity was determined to be ~2.5.26
On a theoretical basis, some limitations may occur with this approach. For example, if a nerve fiber is stimulated instead of a ganglion cell or a deeper cell in the retina, the perceived phosphene may not be from the area that is stimulated but rather from the origin of that nerve fiber.31 A patient would have to move his or her head rather than eyes to change the camera position, which may be disorientating. Chronic pressure from the electrode grid, which would be difficult to control with a retinal tack, could cause erosion of the grid into retina, while shearing forces from the fluid-filled vitreous cavity during rapid eye movements could catch the electrode and cause dislodgement. In a report of temporarily placed and then removed wireless epiretinal devices in 6 patients,27 moderate postoperative inflammation was reported and sterile hypopyon occurred in one patient. Mild to moderate gliosis and epiretinal changes also occurred in 3 of 6 eyes, and a retinal break occurred in another patient, requiring silicone oil surgery.
The Subretinal Approach In the early 1990s, Chow and associates21-24 began exploring a subretinal approach to retinal prosthesis involving the implantation of a semiconductor-based microphotodiode array chip into the subretinal space. The basic concept of a subretinal electrical prosthesis is that a device capable of producing localized microscopic, patterned electric currents may be capable of artificially altering the membrane potentials of remnant photoreceptor and bipolar cells and stimulate neuronal activity if placed directly in contact with these cells. Based on the work of earlier research,9,19,20,22 it was determined that very low stimulating currents and voltages may be required for cellular stimulation if applied from within the subretinal space. Electrically induced hyperpolarization of photoreceptor outer segments would theoretically produce a sensation of light, and depolarization would produce a sensation of darkness. The greater the hyperpolarization of the retinal cell, the greater would be the sensation of light, and the greater the depolarization, the greater would be the sensation of darkness.
One of the early researchers of the effect of visual sensation produced by electrical stimulation of the eye was George Brindley. Brindley’s diagrams of his patients’ visual responses to ocular surface electrical stimulation suggested that the light and dark phosphene bands seen by his patients were determined by the direction and strength of stimulating currents, which produced either hyperpolarization or depolarization of the retina at the band locations.9 On the basis of these findings, Chow hypothesized that to create an image that is composed of both light and darkness information, a retinal prosthesis has to be capable of producing both hyperpolarizing and depolarizing currents at the locations of the targeted retinal cells in response to light and darkness in the environment.
Working with this hypothesis, a photovoltaic, silicon chip microphotodiode-based device with a capacitive electrode was fabricated. The device produced a hyperpolarizing, negative direction current from its electrode surface relative to the targeted retinal cell in the presence of light, and a depolarizing, positive direction current in darkness. The depolarization effect in darkness is due to the discharge of the capacitive electrode, which is charged in light. As an implanted patient scans light and dark scenes, the implant would cycle between hyperpolarizing and depolarizing retinal cells to create the sensation of light and darkness.
Although an epiretinal approach was considered, the subretinal approach to retinal stimulation was chosen because of a number of advantages over epiretinal stimulation. One advantage is that the electrical stimulus required for a subretinal prosthesis to activate photoreceptors and bipolar cells is a simple graded analog electrical potential.19,20 Stimulating the retina from the subretinal space, therefore, obviates the need to re-create the complex digital signals of the nerve fiber layer that may be required for epiretinal stimulation of ganglion cells. From the subretinal space, conversion of a simple graded analog potential into the more complex digital signal would theoretically occur in a normal manner in the subsequent amacrine and ganglion cell layers before transmission to the brain.
Another advantage of subretinal stimulation is that only a relatively simple and low-current microphotodiode-based device would be needed9,19,20,22 and could be fabricated with a pixel density approaching that of the photoreceptor matrix. Such a device could also be placed close to its targeted cells from the location of the subretinal space. The use of low-stimulating currents, produced by a subretinal device, is preferable from a biocompatibility standpoint, whereas the closeness of a subretinal implant to its targeted cells is preferable from the standpoint of better stimulation resolution. In comparison, epiretinal stimulation attempts the electrical stimulation of ganglion, bipolar, or photoreceptor cells from the vitreous cavity side of the retina.18,25,26,31 From this more remote location, spreading of the stimulation current would occur as the current traverses through the retinal nerve fiber layer and deeper retinal layers. This effect could theoretically decrease stimulation resolution because other nontargeted cells, including ganglion, amacrine, photoreceptor, and bipolar cells, could also be stimulated along the way.31 In addition, the relatively higher voltages and currents needed for epiretinal stimulation,25,26 compared to subretinal stimulation,9,19,20,22 could increase unintentional collateral stimulation and damage.
The biocompatibility of subretinal and epiretinal devices can also be compared. Because a subretinal device is placed between the choroid and the outer retina, such a device could block localized choroidal circulation to the overlying retina. Compensating for this, subretinal devices could be fabricated with fenestrations or in the form of a mesh to improve cross-flow nourishment.39 An epiretinal device would not likely have a similar problem unless it is pressed too hard against the retina, in which case compression and erosion through the retina may be possible. For stabilization, a subretinal device is simply secured by the natural tendency of the retinal pigment epithelium (RPE) and retina to adhere to each other, which effectively surrounds and restricts the movement of the small implant.23,24 Epiretinal devices require stabilization in the form of a retinal tack or tacks pushed through the implant, retina, and sclera.25,26 These measures are necessary because normal rapid eye movements would impart sheering forces in the vitreous cavity
Trans Am Ophthalmol Soc / 108 / 2010 121
The Artificial Silicon Retina In Retinitis Pigmentosa Patients
upon epiretinal devices created by intraocular fluid movements, which could cause dislodgement of the implant. In comparison, by being underneath the retina, subretinal devices are protected from vitreous cavity fluid movement. Although subretinal implants have been observed to migrate approximately 0.3 mm within the retina in the first several months after implantation, long-term stability has been good and additional stabilization has not been necessary (A.Y. Chow, MD, unpublished report to the US Food and Drug Administration, 2004).
Finally, another advantage of the subretinal approach is that the surgical operation used to implant a subretinal device is simpler24 compared to the operations for epiretinal devices.25,27 A small pars plana incision is made to introduce a vitrector to perform a complete vitrectomy. A cannula is then used to produce a subretinal bleb, and the retinotomy is widened with scissors. The scleral incision is enlarged to allow introduction of the subretinal implant, which is then brought into the subretinal space. A fluid-air exchange is performed, which flattens the retina over the implant, and the sclera is closed. In comparison, epiretinal device implantations require the placement of multiple larger interconnected devices in a number of separate and distant locations and in separate operations.25,27
Initial Studies In initial studies, microphotodiode array implants powered solely by incident light were placed into the subretinal space of rabbits.23 The implants blocked choroidal nourishment to the outer retina, producing a model of outer retinal degeneration in the overlying retina. Postoperative recordings, however, showed that the implants continued to function electrically in response to light stimulation and induced persistent secondary retinal slow-waves.23 Another group, using an implant similar to ours, has also demonstrated electrical functionality of an implant in the rabbit subretinal space.40 However, although a portion of the rabbit retina has both inner and outer retinal circulations, the rabbit is not an ideal animal model for this work because of its lack of the complete dual retinal circulation that is present in the human eye. In the rabbit eye, significant injury was observed in the inner retina overlying the implant, possibly from the blockage of choroidal nourishment. Funduscopic examination showed areas of haziness in that portion of the retina, and histopathologic examination showed injury and disorganization of the retinal architecture.23
To obtain data on artificial silicon retina (ASR) implants from an animal model more similar to humans, studies progressed to the cat eye,41-44 which, like human eyes, possesses complete retinal (inner retinal) and choroidal (outer retinal) circulations. The cat eye provided a suitable model in which to evaluate the following: the characteristics of implant function in vivo, the possibility that the implant makes a functional connection with the neural retina, and the safety and biocompatibility of the implant. In the cat eye it was observed that placement of the solid ASR disc into the subretinal space produced a model of outer retinal degeneration that resembled the degeneration found in RP and AMD patients.41-43 Retinal cell loss was limited to the outer layers of the retina directly overlying the implant, whereas the inner retinal nerve fiber layer, ganglion cell layer, amacrine cell layer, and much of the bipolar cell layer appeared histologically preserved. There was no injury observed to the eyeball as a whole on gross examination, or to the animal as a whole on physical examination. Immunocytochemistry of the retina overlying the implant showed results similar to that found in retinas of naturally occurring retinal degenerations.43 Noted were increases in glial fibrillary acidic protein (GFAP) and glycine and a decrease in γ–aminobutyric acid (GABA).43 The histologic preservation of the inner retina and the increase of GFAP has also been reported by another group using the same type of implant.45 Away from the implant site, no retinal damage was observed.
Electrically, ASRs were observed to continue to function for prolonged periods (exceeding 18 months), and infrared (IR) light stimulation of the implant sometimes produced visual cortex–like responses that were localized over the occipital cortex (IR was used in an attempt to separate the implant response from the normal retinal response to visible light).44 Small background retina responses to IR, however, were also observed, and a clear implant-induced bioelectrical cortical response that was isolated from the background IR native retina response was difficult to obtain.46 Electrophysiological assessment of the retina as a whole by electroretinograms (ERGs) obtained by white light stimulation showed normal to slightly decreased ERG amplitudes compared to the unoperated control eye.42
In early ASR implants, gold was used as the electrode material, and it was observed to dissolve slowly over many months.42 This occurred faster with the cathode than with the anode. Changing the electrode material to iridium/iridium oxide appeared to resolve this problem, and no signs of electrode dissolution were observed to occur in vivo in over 10 months.41 Also, no dissolution of the IrOx electrodes was observed in over 250 million on/off electrical cycles in saline solution at 37°C (A.Y. Chow, MD, unpublished data, 2004).
Finally, to evaluate whether voltage and current provided solely by a photodiode are sufficient to elicit electrically induced phosphenes in the eye, experiments were conducted on visually normal subjects (A.Y. Chow, MD, unpublished data, 2004) and on patients with RP.24 In these studies tiny electric currents provided solely by an external photodiode were applied via a contact lens to the eye (with a return in the mouth) to stimulate the retina. The area of the retina stimulated was ~10 cm2 compared to 0.16 cm2, the area of the external photodiode. Phosphenes were perceived in large areas of the visual field in RP patients, and in almost all of the visual field in normal subjects, and occurred from stimulation currents as low as ~30 μA and 0.4 V (A.Y. Chow, MD, unpublished data, 2004). In RP patients the threshold currents varied from ~200 to 600 μA at 0.4 to 2.0 V.24
The preceding results indicated that (1) in retinas of animals with dual circulations similar to human retinas, a subretinally implanted photodiode-based ASR chip produces a histologic and immunocytochemical picture of outer retinal degeneration in the retina overlying the implant similar to naturally occurring forms of retinal degeneration; (2) ASR chips do not appear to cause injury or inflammation to the retina away from the implant site, to the eyeball as a whole, or to the animal as a whole; (3) ASR chips with IrOx electrodes will function electrically in the subretinal space for extended periods without degradation; and (4) current and voltage
Trans Am Ophthalmol Soc / 108 / 2010 122
Chow
generated by even a single photodiode are sufficient to induce phosphenes. The data generated in these preclinical studies suggested the application of ASR chips in patients with RP and supported the
conduct of a feasibility trial.
HUMAN PILOT STUDY In June 2000 and July 2001, six RP patients were implanted in the right eye with the ASR chip in a pilot feasibility and safety study with Institutional Review Board and US Food and Drug Administration (FDA) approval.24 Informed consent was obtained. Follow-up was 18 months for patients 1, 2, and 3 and 6 months for patients 4, 5, and 6. Visual acuity on enrollment was 20/800 OU or worse and/or 15° or less of visual field on the Humphrey 30-2 III static protocol. All patients were able to perceive electrically induced phosphenes preoperatively when stimulated with a contact lens electrically connected in series to one to six photodiodes, each illuminated by a 940-nm infrared light-emitting diode (LED) driven by 50-mA current. The resultant current produced by each photodiode was 0.40 V and 200 µA with a nominal 5 kΩ of measured impedance between the contact lens and a return electrode placed on the ipsilateral temple. Patients readily perceived phosphenes typically described as generalized wide-field light flashes, like “lightning in the distance,” when two to five photodiodes were connected in series. This demonstrated that the low current and voltage generated by photodiodes illuminated only by LEDs were sufficient to create widely perceived areas of phosphenes.
For patients who were able to perceive phosphenes, Early Treatment Diabetic Retinopathy Study (ETDRS) charts (Lighthouse International, New York, New York) at 0.5 m were used to evaluate visual acuity. On enrollment, only two of the six patients were able to recognize ETDRS letters with either eye. Baseline Humphrey Visual Field Analyzer II (HVFA) (Zeiss Humphrey Systems, Dublin, California) 30-2 and 60-4 protocols were performed with III and V white static targets. Most patients demonstrated none to only bare (<5°) central visual fields to the V white target. Because peripheral retinal sensitivity was poor in most patients, a new method of evaluating peripheral fields was created. This was performed by additional visual field testing in nine sectors of a 3×3 grid composed of one central and eight equally spaced 45° peripheral field sectors (9-Sector Test). A 0.5-inch diameter fiber optic provided illuminations of 300 foot-candles (ft-c) down to 1 e-4 ft-c controlled by stacked neutral density filters, and sensitivity was tested in each sector.
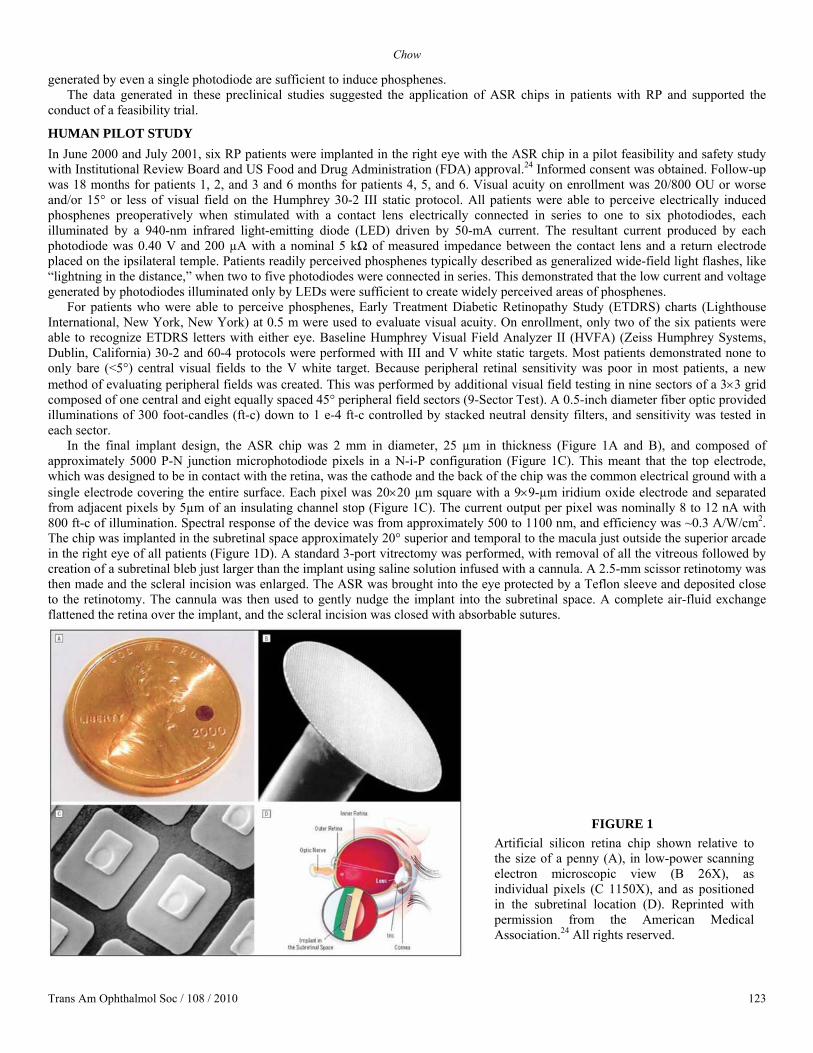
In the final implant design, the ASR chip was 2 mm in diameter, 25 µm in thickness (Figure 1A and B), and composed of approximately 5000 P-N junction microphotodiode pixels in a N-i-P configuration (Figure 1C). This meant that the top electrode, which was designed to be in contact with the retina, was the cathode and the back of the chip was the common electrical ground with a single electrode covering the entire surface. Each pixel was 20×20 µm square with a 9×9-µm iridium oxide electrode and separated from adjacent pixels by 5µm of an insulating channel stop (Figure 1C). The current output per pixel was nominally 8 to 12 nA with 800 ft-c of illumination. Spectral response of the device was from approximately 500 to 1100 nm, and efficiency was ~0.3 A/W/cm2. The chip was implanted in the subretinal space approximately 20° superior and temporal to the macula just outside the superior arcade in the right eye of all patients (Figure 1D). A standard 3-port vitrectomy was performed, with removal of all the vitreous followed by creation of a subretinal bleb just larger than the implant using saline solution infused with a cannula. A 2.5-mm scissor retinotomy was then made and the scleral incision was enlarged. The ASR was brought into the eye protected by a Teflon sleeve and deposited close to the retinotomy. The cannula was then used to gently nudge the implant into the subretinal space. A complete air-fluid exchange flattened the retina over the implant, and the scleral incision was closed with absorbable sutures.
FIGURE 1 Artificial silicon retina chip shown relative to the size of a penny (A), in low-power scanning electron microscopic view (B 26X), as individual pixels (C 1150X), and as positioned in the subretinal location (D). Reprinted with permission from the American Medical Association.24 All rights reserved.
Trans Am Ophthalmol Soc / 108 / 2010 123
The Artificial Silicon Retina In Retinitis Pigmentosa Patients
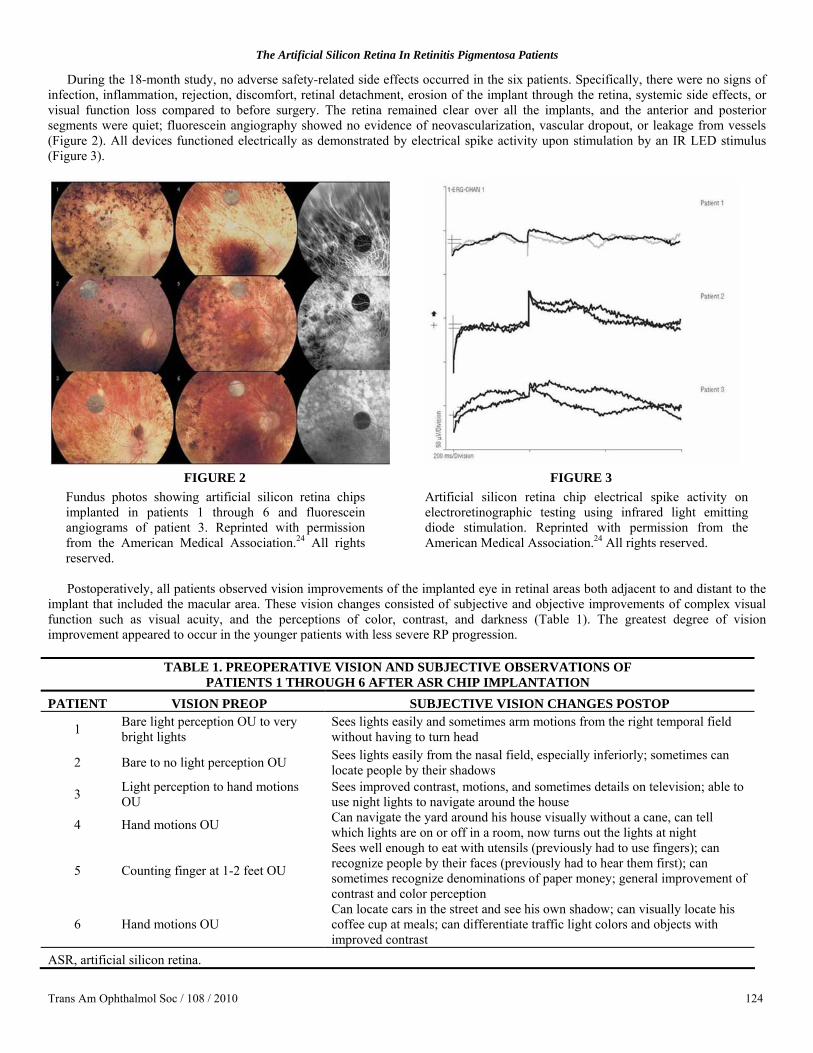
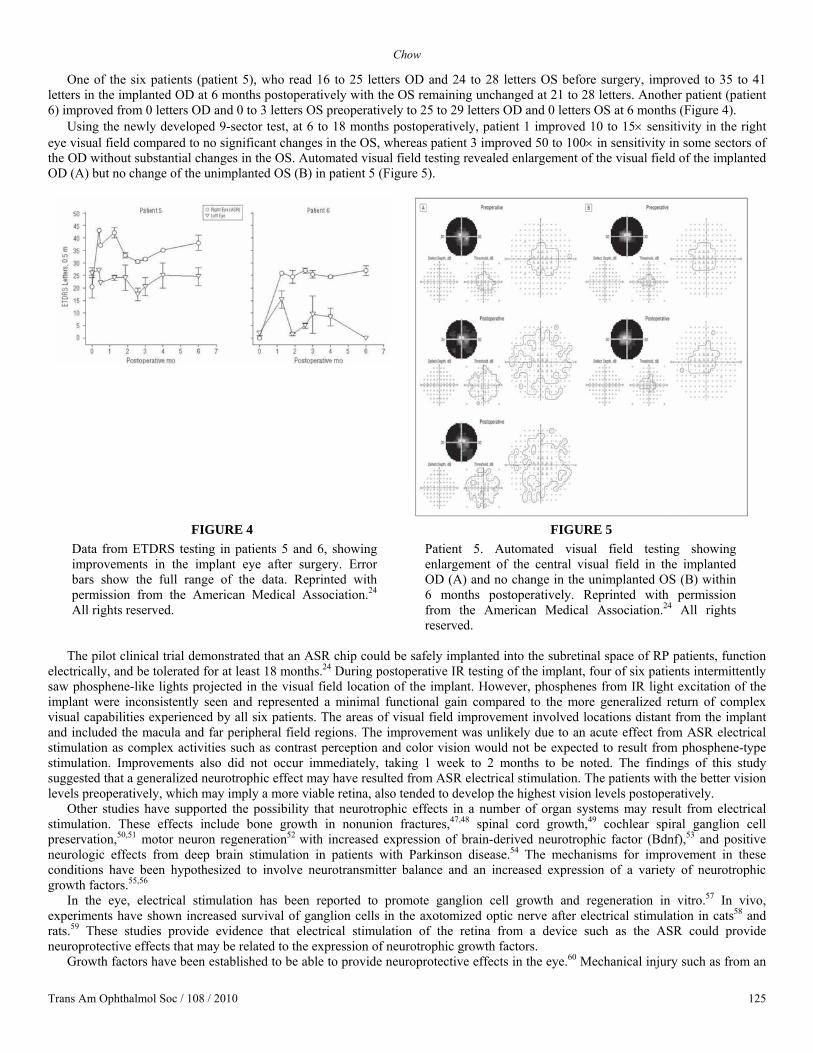
During the 18-month study, no adverse safety-related side effects occurred in the six patients. Specifically, there were no signs of infection, inflammation, rejection, discomfort, retinal detachment, erosion of the implant through the retina, systemic side effects, or visual function loss compared to before surgery. The retina remained clear over all the implants, and the anterior and posterior segments were quiet; fluorescein angiography showed no evidence of neovascularization, vascular dropout, or leakage from vessels (Figure 2). All devices functioned electrically as demonstrated by electrical spike activity upon stimulation by an IR LED stimulus (Figure 3).
FIGURE 2
Fundus photos showing artificial silicon retina chips implanted in patients 1 through 6 and fluorescein angiograms of patient 3. Reprinted with permission from the American Medical Association.24 All rights reserved.
FIGURE 3 Artificial silicon retina chip electrical spike activity on electroretinographic testing using infrared light emitting diode stimulation. Reprinted with permission from the American Medical Association.24 All rights reserved.
Postoperatively, all patients observed vision improvements of the implanted eye in retinal areas both adjacent to and distant to the
implant that included the macular area. These vision changes consisted of subjective and objective improvements of complex visual function such as visual acuity, and the perceptions of color, contrast, and darkness (Table 1). The greatest degree of vision improvement appeared to occur in the younger patients with less severe RP progression.
TABLE 1. PREOPERATIVE VISION AND SUBJECTIVE OBSERVATIONS OF
PATIENTS 1 THROUGH 6 AFTER ASR CHIP IMPLANTATION PATIENT VISION PREOP SUBJECTIVE VISION CHANGES POSTOP
1 Bare light perception OU to very bright lights
Sees lights easily and sometimes arm motions from the right temporal field without having to turn head
2 Bare to no light perception OU Sees lights easily from the nasal field, especially inferiorly; sometimes can locate people by their shadows
3 Light perception to hand motions OU
Sees improved contrast, motions, and sometimes details on television; able to use night lights to navigate around the house
4 Hand motions OU Can navigate the yard around his house visually without a cane, can tell which lights are on or off in a room, now turns out the lights at night
5 Counting finger at 1-2 feet OU
Sees well enough to eat with utensils (previously had to use fingers); can recognize people by their faces (previously had to hear them first); can sometimes recognize denominations of paper money; general improvement of contrast and color perception
6 Hand motions OU Can locate cars in the street and see his own shadow; can visually locate his coffee cup at meals; can differentiate traffic light colors and objects with improved contrast
ASR, artificial silicon retina.
Trans Am Ophthalmol Soc / 108 / 2010 124
Chow
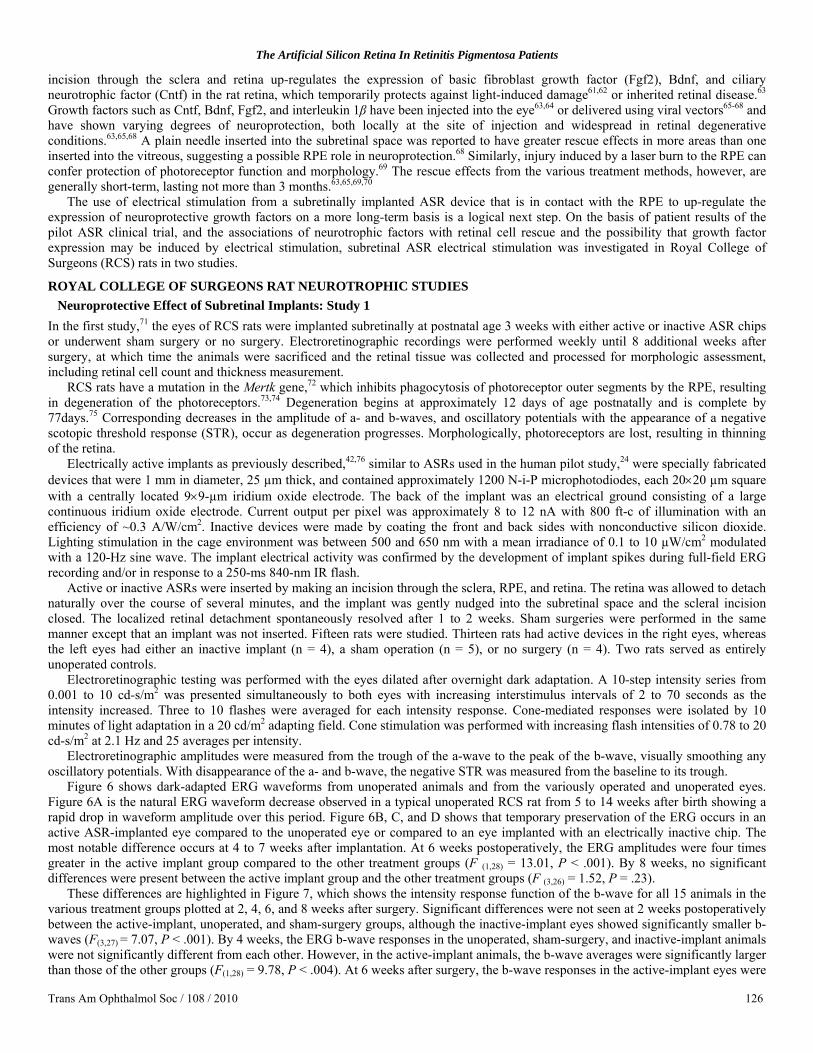
One of the six patients (patient 5), who read 16 to 25 letters OD and 24 to 28 letters OS before surgery, improved to 35 to 41 letters in the implanted OD at 6 months postoperatively with the OS remaining unchanged at 21 to 28 letters. Another patient (patient 6) improved from 0 letters OD and 0 to 3 letters OS preoperatively to 25 to 29 letters OD and 0 letters OS at 6 months (Figure 4).
Using the newly developed 9-sector test, at 6 to 18 months postoperatively, patient 1 improved 10 to 15× sensitivity in the right eye visual field compared to no significant changes in the OS, whereas patient 3 improved 50 to 100× in sensitivity in some sectors of the OD without substantial changes in the OS. Automated visual field testing revealed enlargement of the visual field of the implanted OD (A) but no change of the unimplanted OS (B) in patient 5 (Figure 5).
FIGURE 4
Data from ETDRS testing in patients 5 and 6, showing improvements in the implant eye after surgery. Error bars show the full range of the data. Reprinted with permission from the American Medical Association.24 All rights reserved.
FIGURE 5 Patient 5. Automated visual field testing showing enlargement of the central visual field in the implanted OD (A) and no change in the unimplanted OS (B) within 6 months postoperatively. Reprinted with permission from the American Medical Association.24 All rights reserved.
The pilot clinical trial demonstrated that an ASR chip could be safely implanted into the subretinal space of RP patients, function
electrically, and be tolerated for at least 18 months.24 During postoperative IR testing of the implant, four of six patients intermittently saw phosphene-like lights projected in the visual field location of the implant. However, phosphenes from IR light excitation of the implant were inconsistently seen and represented a minimal functional gain compared to the more generalized return of complex visual capabilities experienced by all six patients. The areas of visual field improvement involved locations distant from the implant and included the macula and far peripheral field regions. The improvement was unlikely due to an acute effect from ASR electrical stimulation as complex activities such as contrast perception and color vision would not be expected to result from phosphene-type stimulation. Improvements also did not occur immediately, taking 1 week to 2 months to be noted. The findings of this study suggested that a generalized neurotrophic effect may have resulted from ASR electrical stimulation. The patients with the better vision levels preoperatively, which may imply a more viable retina, also tended to develop the highest vision levels postoperatively.
Other studies have supported the possibility that neurotrophic effects in a number of organ systems may result from electrical stimulation. These effects include bone growth in nonunion fractures,47,48 spinal cord growth,49 cochlear spiral ganglion cell preservation,50,51 motor neuron regeneration52 with increased expression of brain-derived neurotrophic factor (Bdnf),53 and positive neurologic effects from deep brain stimulation in patients with Parkinson disease.54 The mechanisms for improvement in these conditions have been hypothesized to involve neurotransmitter balance and an increased expression of a variety of neurotrophic growth factors.55,56
In the eye, electrical stimulation has been reported to promote ganglion cell growth and regeneration in vitro.57 In vivo, experiments have shown increased survival of ganglion cells in the axotomized optic nerve after electrical stimulation in cats58 and rats.59 These studies provide evidence that electrical stimulation of the retina from a device such as the ASR could provide neuroprotective effects that may be related to the expression of neurotrophic growth factors.
Growth factors have been established to be able to provide neuroprotective effects in the eye.60 Mechanical injury such as from an
Trans Am Ophthalmol Soc / 108 / 2010 125
The Artificial Silicon Retina In Retinitis Pigmentosa Patients
incision through the sclera and retina up-regulates the expression of basic fibroblast growth factor (Fgf2), Bdnf, and ciliary neurotrophic factor (Cntf) in the rat retina, which temporarily protects against light-induced damage61,62 or inherited retinal disease.63 Growth factors such as Cntf, Bdnf, Fgf2, and interleukin 1β have been injected into the eye63,64 or delivered using viral vectors65-68 and have shown varying degrees of neuroprotection, both locally at the site of injection and widespread in retinal degenerative conditions.63,65,68 A plain needle inserted into the subretinal space was reported to have greater rescue effects in more areas than one inserted into the vitreous, suggesting a possible RPE role in neuroprotection.68 Similarly, injury induced by a laser burn to the RPE can confer protection of photoreceptor function and morphology.69 The rescue effects from the various treatment methods, however, are generally short-term, lasting not more than 3 months.63,65,69,70
The use of electrical stimulation from a subretinally implanted ASR device that is in contact with the RPE to up-regulate the expression of neuroprotective growth factors on a more long-term basis is a logical next step. On the basis of patient results of the pilot ASR clinical trial, and the associations of neurotrophic factors with retinal cell rescue and the possibility that growth factor expression may be induced by electrical stimulation, subretinal ASR electrical stimulation was investigated in Royal College of Surgeons (RCS) rats in two studies.
ROYAL COLLEGE OF SURGEONS RAT NEUROTROPHIC STUDIES Neuroprotective Effect of Subretinal Implants: Study 1
In the first study,71 the eyes of RCS rats were implanted subretinally at postnatal age 3 weeks with either active or inactive ASR chips or underwent sham surgery or no surgery. Electroretinographic recordings were performed weekly until 8 additional weeks after surgery, at which time the animals were sacrificed and the retinal tissue was collected and processed for morphologic assessment, including retinal cell count and thickness measurement.
RCS rats have a mutation in the Mertk gene,72 which inhibits phagocytosis of photoreceptor outer segments by the RPE, resulting in degeneration of the photoreceptors.73,74 Degeneration begins at approximately 12 days of age postnatally and is complete by 77days.75 Corresponding decreases in the amplitude of a- and b-waves, and oscillatory potentials with the appearance of a negative scotopic threshold response (STR), occur as degeneration progresses. Morphologically, photoreceptors are lost, resulting in thinning of the retina.
Electrically active implants as previously described,42,76 similar to ASRs used in the human pilot study,24 were specially fabricated devices that were 1 mm in diameter, 25 µm thick, and contained approximately 1200 N-i-P microphotodiodes, each 20×20 µm square with a centrally located 9×9-µm iridium oxide electrode. The back of the implant was an electrical ground consisting of a large continuous iridium oxide electrode. Current output per pixel was approximately 8 to 12 nA with 800 ft-c of illumination with an efficiency of ~0.3 A/W/cm2. Inactive devices were made by coating the front and back sides with nonconductive silicon dioxide. Lighting stimulation in the cage environment was between 500 and 650 nm with a mean irradiance of 0.1 to 10 µW/cm2 modulated with a 120-Hz sine wave. The implant electrical activity was confirmed by the development of implant spikes during full-field ERG recording and/or in response to a 250-ms 840-nm IR flash.
Active or inactive ASRs were inserted by making an incision through the sclera, RPE, and retina. The retina was allowed to detach naturally over the course of several minutes, and the implant was gently nudged into the subretinal space and the scleral incision closed. The localized retinal detachment spontaneously resolved after 1 to 2 weeks. Sham surgeries were performed in the same manner except that an implant was not inserted. Fifteen rats were studied. Thirteen rats had active devices in the right eyes, whereas the left eyes had either an inactive implant (n = 4), a sham operation (n = 5), or no surgery (n = 4). Two rats served as entirely unoperated controls.
Electroretinographic testing was performed with the eyes dilated after overnight dark adaptation. A 10-step intensity series from 0.001 to 10 cd-s/m2 was presented simultaneously to both eyes with increasing interstimulus intervals of 2 to 70 seconds as the intensity increased. Three to 10 flashes were averaged for each intensity response. Cone-mediated responses were isolated by 10 minutes of light adaptation in a 20 cd/m2 adapting field. Cone stimulation was performed with increasing flash intensities of 0.78 to 20 cd-s/m2 at 2.1 Hz and 25 averages per intensity.
Electroretinographic amplitudes were measured from the trough of the a-wave to the peak of the b-wave, visually smoothing any oscillatory potentials. With disappearance of the a- and b-wave, the negative STR was measured from the baseline to its trough.
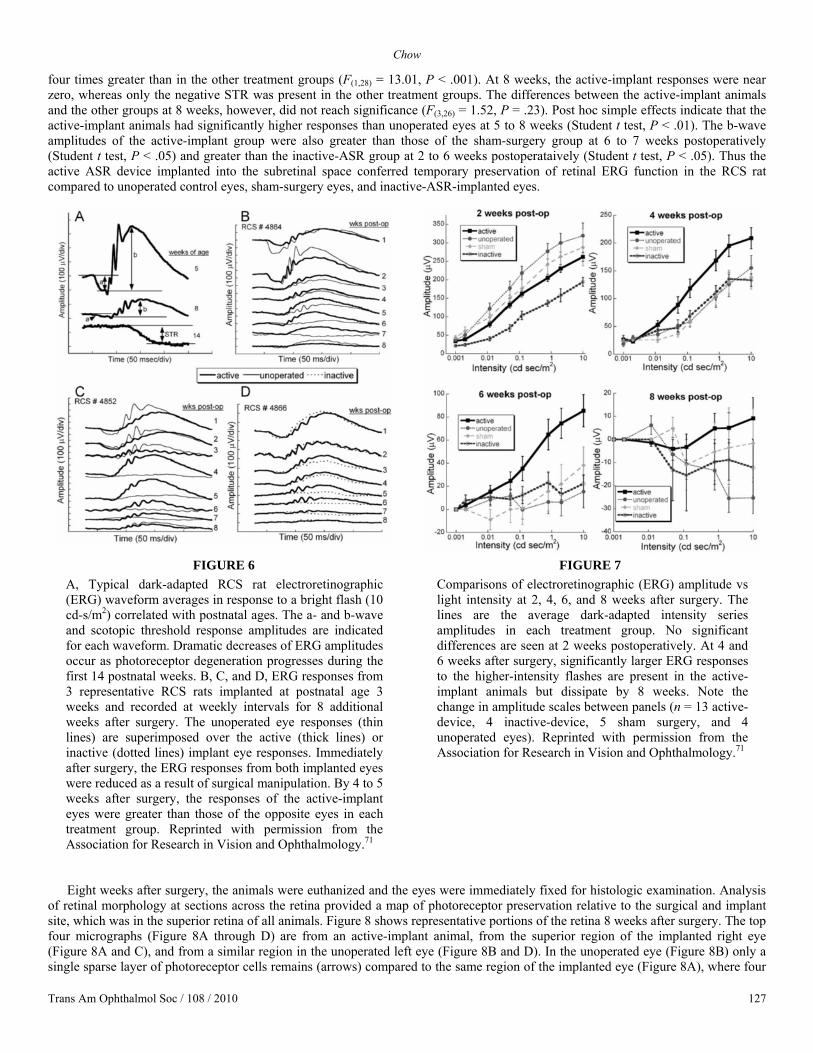
Figure 6 shows dark-adapted ERG waveforms from unoperated animals and from the variously operated and unoperated eyes. Figure 6A is the natural ERG waveform decrease observed in a typical unoperated RCS rat from 5 to 14 weeks after birth showing a rapid drop in waveform amplitude over this period. Figure 6B, C, and D shows that temporary preservation of the ERG occurs in an active ASR-implanted eye compared to the unoperated eye or compared to an eye implanted with an electrically inactive chip. The most notable difference occurs at 4 to 7 weeks after implantation. At 6 weeks postoperatively, the ERG amplitudes were four times greater in the active implant group compared to the other treatment groups (F (1,28) = 13.01, P < .001). By 8 weeks, no significant differences were present between the active implant group and the other treatment groups (F (3,26) = 1.52, P = .23).
These differences are highlighted in Figure 7, which shows the intensity response function of the b-wave for all 15 animals in the various treatment groups plotted at 2, 4, 6, and 8 weeks after surgery. Significant differences were not seen at 2 weeks postoperatively between the active-implant, unoperated, and sham-surgery groups, although the inactive-implant eyes showed significantly smaller b-waves (F(3,27) = 7.07, P < .001). By 4 weeks, the ERG b-wave responses in the unoperated, sham-surgery, and inactive-implant animals were not significantly different from each other. However, in the active-implant animals, the b-wave averages were significantly larger than those of the other groups (F(1,28) = 9.78, P < .004). At 6 weeks after surgery, the b-wave responses in the active-implant eyes were
Trans Am Ophthalmol Soc / 108 / 2010 126
Chow
four times greater than in the other treatment groups (F(1,28) = 13.01, P < .001). At 8 weeks, the active-implant responses were near zero, whereas only the negative STR was present in the other treatment groups. The differences between the active-implant animals and the other groups at 8 weeks, however, did not reach significance (F(3,26) = 1.52, P = .23). Post hoc simple effects indicate that the active-implant animals had significantly higher responses than unoperated eyes at 5 to 8 weeks (Student t test, P < .01). The b-wave amplitudes of the active-implant group were also greater than those of the sham-surgery group at 6 to 7 weeks postoperatively (Student t test, P < .05) and greater than the inactive-ASR group at 2 to 6 weeks postoperataively (Student t test, P < .05). Thus the active ASR device implanted into the subretinal space conferred temporary preservation of retinal ERG function in the RCS rat compared to unoperated control eyes, sham-surgery eyes, and inactive-ASR-implanted eyes.
FIGURE 6
A, Typical dark-adapted RCS rat electroretinographic (ERG) waveform averages in response to a bright flash (10 cd-s/m2) correlated with postnatal ages. The a- and b-wave and scotopic threshold response amplitudes are indicated for each waveform. Dramatic decreases of ERG amplitudes occur as photoreceptor degeneration progresses during the first 14 postnatal weeks. B, C, and D, ERG responses from 3 representative RCS rats implanted at postnatal age 3 weeks and recorded at weekly intervals for 8 additional weeks after surgery. The unoperated eye responses (thin lines) are superimposed over the active (thick lines) or inactive (dotted lines) implant eye responses. Immediately after surgery, the ERG responses from both implanted eyes were reduced as a result of surgical manipulation. By 4 to 5 weeks after surgery, the responses of the active-implant eyes were greater than those of the opposite eyes in each treatment group. Reprinted with permission from the Association for Research in Vision and Ophthalmology.71
FIGURE 7 Comparisons of electroretinographic (ERG) amplitude vs light intensity at 2, 4, 6, and 8 weeks after surgery. The lines are the average dark-adapted intensity series amplitudes in each treatment group. No significant differences are seen at 2 weeks postoperatively. At 4 and 6 weeks after surgery, significantly larger ERG responses to the higher-intensity flashes are present in the active-implant animals but dissipate by 8 weeks. Note the change in amplitude scales between panels (n = 13 active-device, 4 inactive-device, 5 sham surgery, and 4 unoperated eyes). Reprinted with permission from the Association for Research in Vision and Ophthalmology.71
Eight weeks after surgery, the animals were euthanized and the eyes were immediately fixed for histologic examination. Analysis
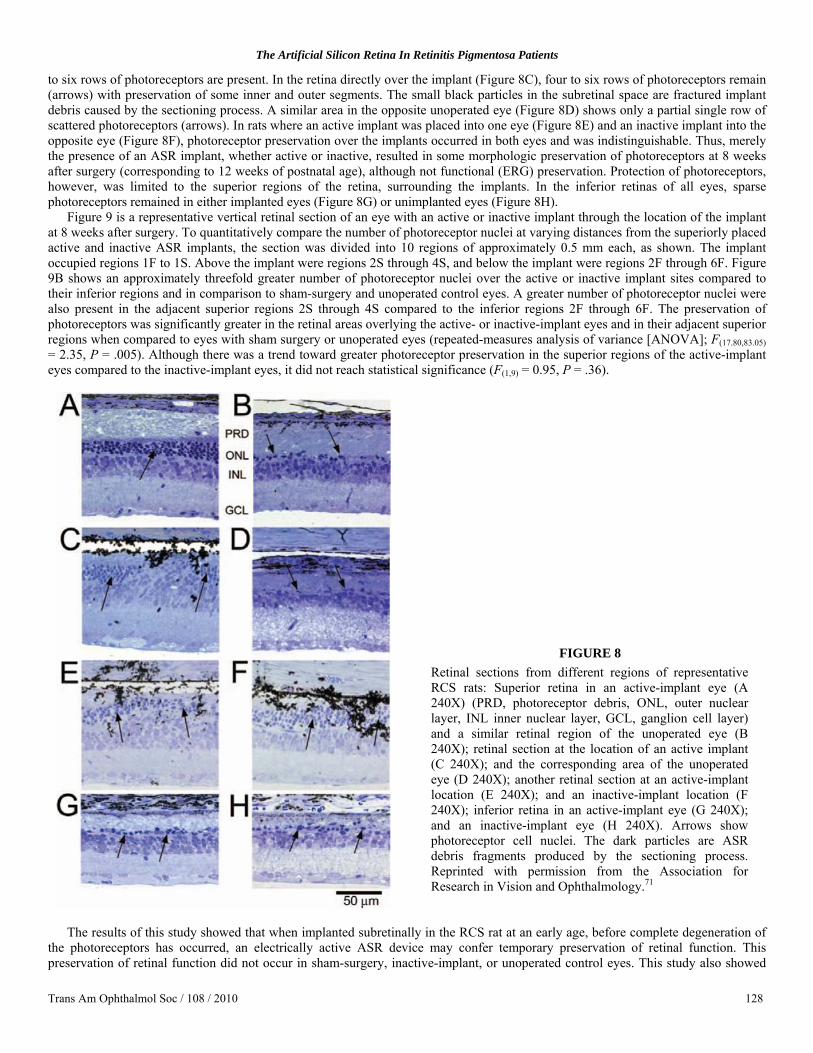
of retinal morphology at sections across the retina provided a map of photoreceptor preservation relative to the surgical and implant site, which was in the superior retina of all animals. Figure 8 shows representative portions of the retina 8 weeks after surgery. The top four micrographs (Figure 8A through D) are from an active-implant animal, from the superior region of the implanted right eye (Figure 8A and C), and from a similar region in the unoperated left eye (Figure 8B and D). In the unoperated eye (Figure 8B) only a single sparse layer of photoreceptor cells remains (arrows) compared to the same region of the implanted eye (Figure 8A), where four
Trans Am Ophthalmol Soc / 108 / 2010 127
The Artificial Silicon Retina In Retinitis Pigmentosa Patients
to six rows of photoreceptors are present. In the retina directly over the implant (Figure 8C), four to six rows of photoreceptors remain (arrows) with preservation of some inner and outer segments. The small black particles in the subretinal space are fractured implant debris caused by the sectioning process. A similar area in the opposite unoperated eye (Figure 8D) shows only a partial single row of scattered photoreceptors (arrows). In rats where an active implant was placed into one eye (Figure 8E) and an inactive implant into the opposite eye (Figure 8F), photoreceptor preservation over the implants occurred in both eyes and was indistinguishable. Thus, merely the presence of an ASR implant, whether active or inactive, resulted in some morphologic preservation of photoreceptors at 8 weeks after surgery (corresponding to 12 weeks of postnatal age), although not functional (ERG) preservation. Protection of photoreceptors, however, was limited to the superior regions of the retina, surrounding the implants. In the inferior retinas of all eyes, sparse photoreceptors remained in either implanted eyes (Figure 8G) or unimplanted eyes (Figure 8H).
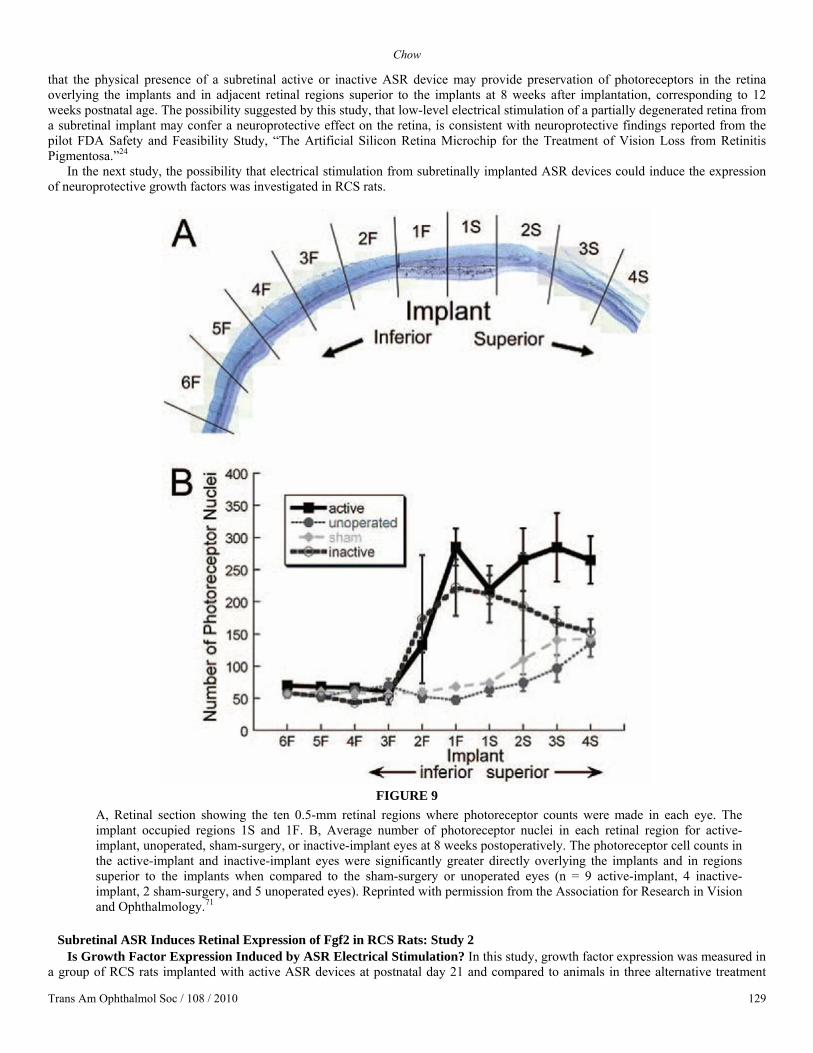
Figure 9 is a representative vertical retinal section of an eye with an active or inactive implant through the location of the implant at 8 weeks after surgery. To quantitatively compare the number of photoreceptor nuclei at varying distances from the superiorly placed active and inactive ASR implants, the section was divided into 10 regions of approximately 0.5 mm each, as shown. The implant occupied regions 1F to 1S. Above the implant were regions 2S through 4S, and below the implant were regions 2F through 6F. Figure 9B shows an approximately threefold greater number of photoreceptor nuclei over the active or inactive implant sites compared to their inferior regions and in comparison to sham-surgery and unoperated control eyes. A greater number of photoreceptor nuclei were also present in the adjacent superior regions 2S through 4S compared to the inferior regions 2F through 6F. The preservation of photoreceptors was significantly greater in the retinal areas overlying the active- or inactive-implant eyes and in their adjacent superior regions when compared to eyes with sham surgery or unoperated eyes (repeated-measures analysis of variance [ANOVA]; F(17.80,83.05) = 2.35, P = .005). Although there was a trend toward greater photoreceptor preservation in the superior regions of the active-implant eyes compared to the inactive-implant eyes, it did not reach statistical significance (F(1,9) = 0.95, P = .36).
FIGURE 8 Retinal sections from different regions of representative RCS rats: Superior retina in an active-implant eye (A 240X) (PRD, photoreceptor debris, ONL, outer nuclear layer, INL inner nuclear layer, GCL, ganglion cell layer) and a similar retinal region of the unoperated eye (B 240X); retinal section at the location of an active implant (C 240X); and the corresponding area of the unoperated eye (D 240X); another retinal section at an active-implant location (E 240X); and an inactive-implant location (F 240X); inferior retina in an active-implant eye (G 240X); and an inactive-implant eye (H 240X). Arrows show photoreceptor cell nuclei. The dark particles are ASR debris fragments produced by the sectioning process. Reprinted with permission from the Association for Research in Vision and Ophthalmology.71
The results of this study showed that when implanted subretinally in the RCS rat at an early age, before complete degeneration of
the photoreceptors has occurred, an electrically active ASR device may confer temporary preservation of retinal function. This preservation of retinal function did not occur in sham-surgery, inactive-implant, or unoperated control eyes. This study also showed
Trans Am Ophthalmol Soc / 108 / 2010 128
Chow
that the physical presence of a subretinal active or inactive ASR device may provide preservation of photoreceptors in the retina overlying the implants and in adjacent retinal regions superior to the implants at 8 weeks after implantation, corresponding to 12 weeks postnatal age. The possibility suggested by this study, that low-level electrical stimulation of a partially degenerated retina from a subretinal implant may confer a neuroprotective effect on the retina, is consistent with neuroprotective findings reported from the pilot FDA Safety and Feasibility Study, “The Artificial Silicon Retina Microchip for the Treatment of Vision Loss from Retinitis Pigmentosa.”24
In the next study, the possibility that electrical stimulation from subretinally implanted ASR devices could induce the expression of neuroprotective growth factors was investigated in RCS rats.
FIGURE 9
A, Retinal section showing the ten 0.5-mm retinal regions where photoreceptor counts were made in each eye. The implant occupied regions 1S and 1F. B, Average number of photoreceptor nuclei in each retinal region for active-implant, unoperated, sham-surgery, or inactive-implant eyes at 8 weeks postoperatively. The photoreceptor cell counts in the active-implant and inactive-implant eyes were significantly greater directly overlying the implants and in regions superior to the implants when compared to the sham-surgery or unoperated eyes (n = 9 active-implant, 4 inactive-implant, 2 sham-surgery, and 5 unoperated eyes). Reprinted with permission from the Association for Research in Vision and Ophthalmology.71
Subretinal ASR Induces Retinal Expression of Fgf2 in RCS Rats: Study 2
Is Growth Factor Expression Induced by ASR Electrical Stimulation? In this study, growth factor expression was measured in a group of RCS rats implanted with active ASR devices at postnatal day 21 and compared to animals in three alternative treatment
Trans Am Ophthalmol Soc / 108 / 2010 129
The Artificial Silicon Retina In Retinitis Pigmentosa Patients
groups.77 The four groups received the following subretinal surgeries or no surgery: (A, n = 19) implantation of an electrically active ASR device; (M, n = 10) implantation of a minimally electrically active ASR device; (S, n = 9) sham surgery; and (C, n = 11) unoperated control. In the A and M groups, the implants were placed into the subretinal space as previously described and remained for the duration of the study. In the S group, the implants were placed within the subretinal space and then immediately removed. One week after implantation, 14, 6, 9, and 8 animals from the A, M, S, and C groups, respectively, underwent dark- and light-adapted full-field bright-flash ERG intensity series testing and were sacrificed 2 days later (postoperative day 9). The remainder of the animals underwent the same weekly bright-flash intensity series ERG testing for 4 weeks and were sacrificed 2 days after the last ERG series (postoperative day 30).
The implanted active ASR A devices were N-i-P microphotodiode array chips, previously described,42,76 with a responsivity of 0.345 A/W/cm2. The minimally active M devices were fabricated similar to the A devices but did not contain purposefully created electrical junctions of the iridium oxide electrodes and were covered on both sides with dielectric silicon dioxide created by thermal oxidation. Their minimal photovoltaic activity resulted from very low levels of dopant that became incorporated during the silicon manufacturing process. Electrically, the A devices delivered approximately 100 times more charge than the M devices (Figure 10) in response to a light stimulus of ~10 mW/cm2 of near IR light (870 nm) and somewhat more so with brighter stimulus. As the lighting conditions used during the study varied from darkness to the brightest ERG flash (2.1 log cd-s/m2), the A group experienced >100 times more current than the M group from the flash stimuli during ERG testing.
After sacrifice, retina portions overlying the implants (A and M groups), or over the incision site (S group), or the over the equivalent retinal area (C group) were processed to isolate the RNA. The RNA was reversed transcribed to produce cDNA that was used in real-time polymerase chain reactions (PCRs) with Fgf1, Fgf2, Gdnf, Bdnf, Cntf, and Igf1. Growth factor transcript expression relative to control eyes or the opposite eye was calculated.
Representative dark-adapted ERGs from a rat in each treatment group at 1 and 4 weeks after surgery are shown in Figure 11. In Figure 11A, animals in all groups at 1 week after surgery displayed prominent a- and b-waves with oscillatory potentials. Figure 11C is the average of ERG a- and b-wave responses for each group at 1 week. Although no significant differences are seen in the a-waves, the b-wave responses are significantly larger for groups A and S compared to groups M and C (two-way repeated ANOVA, P = .02).
At 4 weeks after surgery, significant differences are seen in the dark-adapted A group b-wave amplitude compared to the C and M groups. The representative A group b-wave (Figure 11B) is larger than that of the other groups, and the average of the group A b-wave amplitude (Figure 11D) is greater (two-way repeated ANOVA, P = .003). No significant differences are seen in the a-wave responses between the groups.
Figure 12 shows light-adapted cone responses at 1 and 4 weeks after surgery. The loss of cone function is seen in the smaller representative b-waves in all groups by 4 weeks (Figure 12B) compared to 1 week (Figure 12A). At 1 week no significant differences are present between the b-wave amplitudes of all groups (Figure 12C). However, by 4 weeks, the b-wave amplitude of the A group was significantly larger than in the C and M groups (two-way ANOVA, P = .003: Figure 12D).
Growth Factor Expression Analysis by RT-PCR. As shown in Figure 13, growth factor expression analysis by reverse transcription (RT)–PCR of the treated eye relative to the control eye at 9 days after surgery of Fgf1, Fgf2, Cntf, Igf, Gdnf, and Bdnf (not shown) revealed a consistent and significant elevation of Fgf2 expression in the electrically active group A animals compared to all other treatment group animals, whereas little difference was observed in the other growth factor genes across the treatment groups.
When mean Fgf2 expression was compared between the groups, increased Fgf2 expression was observed at 9 days postoperatively as treatment progressed from no surgery to sham surgery, to minimally active ASR implantation, to active ASR implantation (C: 1.30 ± 0.22, S: 2.03 ± 0.45, M: 2.80 ± 0.45, and A: 4.67 ± 0.72, F(3,36) = 6.67, P = .001: Figure 14A). Post hoc Holm-Sidak analysis revealed significant Fgf2 expression differences between the A and S groups (P < .01) and the A and C groups (P < .001), whereas P = .0501 for the A and M groups.
Thirty days after surgery, Fgf2 expression was still higher in the A group (3.24 ± 0.61) compared to the other treatment groups, M, 1.28 ± 0.32 and C, 1.05 ± 0.04 (P < .05, post hoc Holm-Sidak: Figure 14B). Although the mean A group Fgf2 expression was lower by 30 days after surgery compared to at 9 days, it was not significantly different (P = .076).
The first RCS rat study showed that retinal neuroprotection in the RCS rat can be provided by subretinal ASR electrical stimulation of the eye.71 Growth factors have also been shown to confer neuroprotective effects in rodent models of retinal degeneration.61-70 The present study77 links the two showing that retinal electrical stimulation may be effectuating neuroprotective pathways via the induction of known neuroprotective growth factors. In this study, Fgf2 expression was significantly increased in RCS rats eyes implanted with electrically active ASR chips compared to the unoperated opposite eyes. Also compared to the active implant eyes, Fgf2 expression was significantly less in rat eyes implanted with minimally active ASRs, followed by eyes that underwent sham operations, and was least in the eyes of unoperated animals. The observation that minimally active ASRs and sham operations provided only small increases of Fgf2 compared to active ASRs indicates that subretinal electrical stimulation from the implant and not just mechanical effects of the chip or of the surgery itself, induced the greatest retinal expression of Fgf2 and its associated neuroprotection.
The prospect that subretinal ASR devices implanted in RP patients in the FDA pilot study24 may be electrically inducing retinal neuroprotective and rescue effects is supported by our two RCS rat ASR implant studies.71,77 The long-term follow-up of ASR-implanted patients would be important in determining whether the observed neurotrophic effects may be of longer duration in human RP patients than in the initial 18-month report and whether the ASR device is tolerated and continues to function in the human subretinal environment.
Trans Am Ophthalmol Soc / 108 / 2010 130
Chow
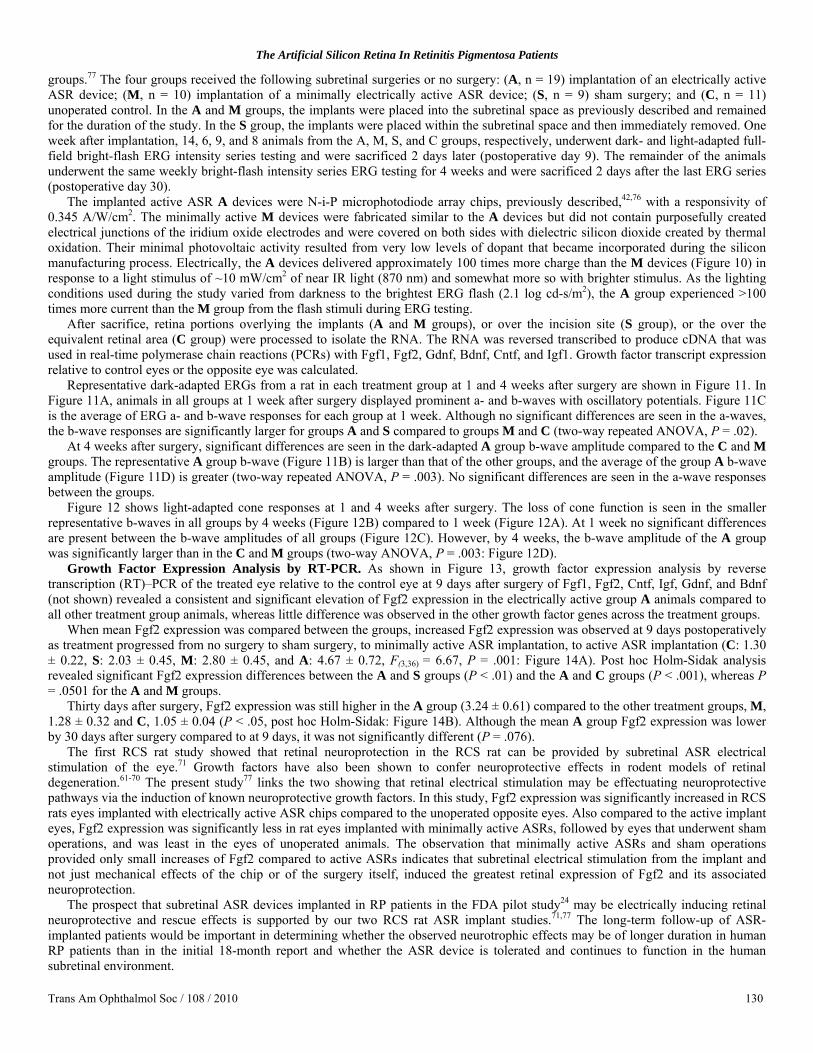
FIGURE 10 In vitro electrical activity of active (A) and minimally active (B) ASR chips in phosphate buffered saline exposed to an 870-nm, 1-msec duration flash. Note the change in electric current scale from microamps to nanoamps from (A) to (B). The active ASR chip produces current approximately two orders of magnitude greater than the minimally active ASR chip (~8 µA vs ~30 nA). Reprinted with permission from the Association for Research in Vision and Ophthalmology.77
FIGURE 11 Comparative retinal function assessed by dark-adapted ERG b-wave measurement at 1 and 4 weeks after surgery. A, Overlaid representative waveforms from each treatment group at 1 week postoperatively in response to a bright flash stimulus (2.1 log cd-s/m2). A and S groups have slightly larger b-wave amplitudes than the C and M groups. The short-duration negative spike at 0.05 msec is an electrical implant spike from the A and M ASR devices. B, Overlaid representative waveforms from A, C, and M groups at 4 weeks postoperatively. The b-wave amplitude from the active implant A group is twice as large as from the C and M groups. C, Average (±SEM) a- and b-wave amplitudes at 1 week postoperatively from the A (n=12), C (n=9), M (n=7), and S (n=7) groups. At the brightest flash intensity, the b-wave amplitudes of the A and S groups are significantly greater than those of the M and S groups. No significant intergroup differences were observed in a-wave amplitudes. D, Average amplitude of a- and b-waves at 4 weeks postoperatively from the A (n=5), C (n=3), and M (n=4) groups. At most intensities, the average b-wave amplitude from the A group is significantly larger than the M and C groups. No significant differences in a-wave amplitudes were observed between the groups. Reprinted with permission from the Association for Research in Vision and Ophthalmology.77
FIGURE 12 Comparative cone function assessed by light-adapted ERGs at 1 and 4 weeks after surgery. A and B, overlaid representative light-adapted ERGs from each treatment group at 1 and 4 weeks postoperatively. Although no significant differences are observed in the 1-week waveforms, at 4 weeks the A group waveform is ~45% larger than the C and M waveforms. C, Average light-adapted b-wave amplitude at 1 week postoperatively from the A (n=12), C (n=9), M (n=7), and S (n=7) groups showed no significant differences. D, Average light-adapted b-wave amplitudes from the A (n=5), C (n=3), and M (n=4) groups at 4 weeks postoperatively showed significantly large b-waves in the A group compared to the other groups at moderate to bright intensities. Reprinted with permission from the Association for Research in Vision and Ophthalmology.77
Trans Am Ophthalmol Soc / 108 / 2010 131

The Artificial Silicon Retina In Retinitis Pigmentosa Patients
FIGURE 13 Growth factor expression of Fgf2, Cntf, Fgf1, Igf, and Gdnf performed by RT-PCR at 9 days postoperatively. Results are growth factor expression in the treated eye relative to the unoperated control eye of the same animal. Fgf2 expression in the A group was greater than in all other groups, P <.05. Error bars are ±SEM. No significant differences were observed for other growth factors between the groups. Reprinted with permission from the Association for Research in Vision and Ophthalmology.77
FIGURE 14 Isolated Fgf2 expression by RT-PCR at 9 and 30 days after surgery. Results are Fgf2 expression in the treated eye relative to the unoperated control eye of the same animal at 9 days and 30 days postoperatively. A, Nine days postoperatively, Fgf2 expression became greater as treatment progressed from C to S to M to A. B, Thirty days after surgery, Fgf2 expression remained significantly greater in the A group compared to the M and C groups. Post hoc Holm-Sidak scores were: #, P = .0501; *, P < .05; **, P < .01, ***, P < .001. Error bars are ± SEM. Reprinted with permission from the Association for Research in Vision and Ophthalmology.77
SCOPE OF THIS THESIS In the previously reported human pilot ASR study,24 ambient light–powered ASRs induced phosphenes and retinal neurotrophic rescue effects on the visual function of RP subjects resulting in the return of some lost vision. The recovered vision consisted of improved visual acuity, improved contrast and color perception, and enlarged visual fields. These results were the basis for two RCS rat studies which showed that electrical stimulation from electrically active subretinal ASR chips (1) may confer temporary preservation of photoreceptor cell count as well as ERG electrical retinal function and (2) may be effectuating neuroprotective pathways via induction of the neurotrophic growth factor, Fgf2.71,77 A number of questions were raised by these studies as they applied to ASR-implanted RP patients and were the subjects of this thesis investigation. They are as follows: (1) Could these neurotrophic effects be demonstrated in additional RP patients, and would the beneficial effects persist over longer periods? (2) Could visual function in the ASR-implanted patients, which as in most very low vision patients is difficult to assess, be reliably measured to show vision changes? (3) Would the ASR continue to be tolerated in the eyes of RP patients and function in the subretinal environment for extended periods and, if so, for how long?
METHODS
The human studies described in this thesis received the Investigational Device Exemption approval G990274 from the US FDA and the Institutional Review Boards of Rush University Medical Center, the Johns Hopkins University School of Medicine, and Central DuPage Hospital and adhered to the guidelines of the Declaration of Helsinki. Informed consent was obtained for all patient subjects.
Trans Am Ophthalmol Soc / 108 / 2010 132
Chow
BIOCOMPATIBILITY AND DURABILITY OF THE ASR IMPLANT IN THE RP SUBRETINAL ENVIRONMENT Histologic Examination of Retina in the ASR-Implanted and Unimplanted Eyes
Background. An important question regarding the feasibility of an electrically active subretinal device involves its in vivo biocompatibility and durability. Some information regarding this issue became available when a 74-year-old man with RP, implanted with an ASR in the right eye on June 28, 2000, died on June 15, 2005, of complications associated with an abdominal aneurysm. His eyes were donated and recovered for study, and the ASR implant was removed for analysis. The histologic appearance of the retina approximately 5 years after ASR implantation is reported. This report describes the advanced nature of the retinal remodeling after ~50 years of symptomatic RP in both eyes and focuses on the area immediately over and surrounding the ASR device compared to the remainder of the retina and to the opposite eye.
The patient was diagnosed as having autosomal dominant RP with decreased vision since approximately age 23. At the time of ASR implantation, visual acuity was light perception to hand motions in the implanted right eye and hand motions in the unoperated left eye. No ERG or visual evoked potential (VEP) response was detectable from either eye, and visual fields were not measurable. Over the next 5 years postimplantation, the patient subjectively reported visual improvements consisting of improved perception of lights and of object contrasts around him, although existing objective testing methods lacked the sensitivity to demonstrate consistent improvements.
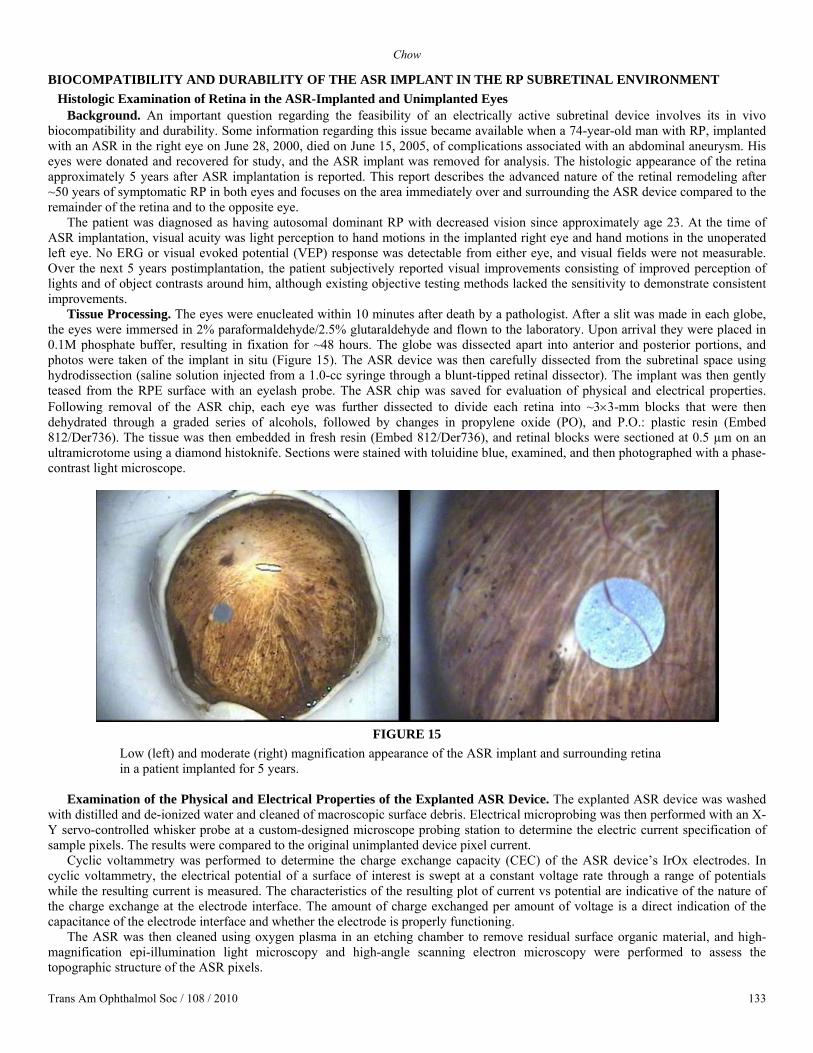
Tissue Processing. The eyes were enucleated within 10 minutes after death by a pathologist. After a slit was made in each globe, the eyes were immersed in 2% paraformaldehyde/2.5% glutaraldehyde and flown to the laboratory. Upon arrival they were placed in 0.1M phosphate buffer, resulting in fixation for ~48 hours. The globe was dissected apart into anterior and posterior portions, and photos were taken of the implant in situ (Figure 15). The ASR device was then carefully dissected from the subretinal space using hydrodissection (saline solution injected from a 1.0-cc syringe through a blunt-tipped retinal dissector). The implant was then gently teased from the RPE surface with an eyelash probe. The ASR chip was saved for evaluation of physical and electrical properties. Following removal of the ASR chip, each eye was further dissected to divide each retina into ~3×3-mm blocks that were then dehydrated through a graded series of alcohols, followed by changes in propylene oxide (PO), and P.O.: plastic resin (Embed 812/Der736). The tissue was then embedded in fresh resin (Embed 812/Der736), and retinal blocks were sectioned at 0.5 µm on an ultramicrotome using a diamond histoknife. Sections were stained with toluidine blue, examined, and then photographed with a phase-contrast light microscope.
FIGURE 15
Low (left) and moderate (right) magnification appearance of the ASR implant and surrounding retina in a patient implanted for 5 years.
Examination of the Physical and Electrical Properties of the Explanted ASR Device. The explanted ASR device was washed
with distilled and de-ionized water and cleaned of macroscopic surface debris. Electrical microprobing was then performed with an X-Y servo-controlled whisker probe at a custom-designed microscope probing station to determine the electric current specification of sample pixels. The results were compared to the original unimplanted device pixel current.
Cyclic voltammetry was performed to determine the charge exchange capacity (CEC) of the ASR device’s IrOx electrodes. In cyclic voltammetry, the electrical potential of a surface of interest is swept at a constant voltage rate through a range of potentials while the resulting current is measured. The characteristics of the resulting plot of current vs potential are indicative of the nature of the charge exchange at the electrode interface. The amount of charge exchanged per amount of voltage is a direct indication of the capacitance of the electrode interface and whether the electrode is properly functioning.
The ASR was then cleaned using oxygen plasma in an etching chamber to remove residual surface organic material, and high-magnification epi-illumination light microscopy and high-angle scanning electron microscopy were performed to assess the topographic structure of the ASR pixels.
Trans Am Ophthalmol Soc / 108 / 2010 133
The Artificial Silicon Retina In Retinitis Pigmentosa Patients
LONG-TERM ASSESSMENT OF VISUAL FUNCTION IN ASR-IMPLANTED RP PATIENTS Background
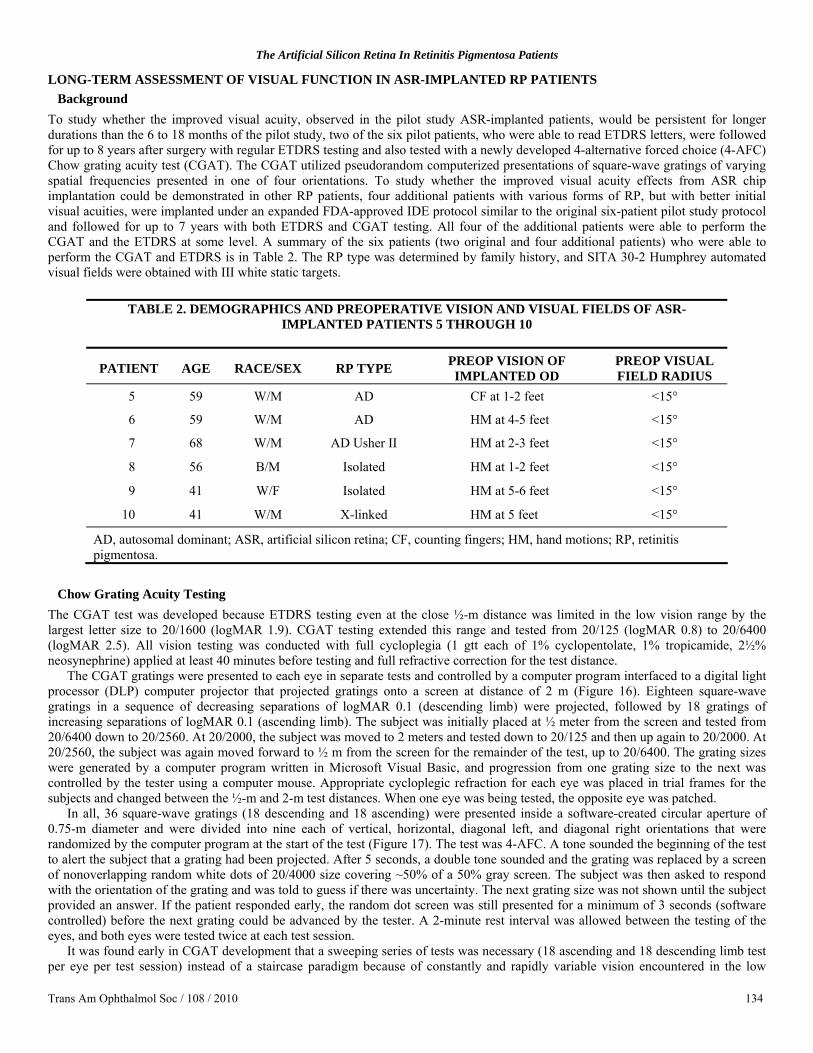
To study whether the improved visual acuity, observed in the pilot study ASR-implanted patients, would be persistent for longer durations than the 6 to 18 months of the pilot study, two of the six pilot patients, who were able to read ETDRS letters, were followed for up to 8 years after surgery with regular ETDRS testing and also tested with a newly developed 4-alternative forced choice (4-AFC) Chow grating acuity test (CGAT). The CGAT utilized pseudorandom computerized presentations of square-wave gratings of varying spatial frequencies presented in one of four orientations. To study whether the improved visual acuity effects from ASR chip implantation could be demonstrated in other RP patients, four additional patients with various forms of RP, but with better initial visual acuities, were implanted under an expanded FDA-approved IDE protocol similar to the original six-patient pilot study protocol and followed for up to 7 years with both ETDRS and CGAT testing. All four of the additional patients were able to perform the CGAT and the ETDRS at some level. A summary of the six patients (two original and four additional patients) who were able to perform the CGAT and ETDRS is in Table 2. The RP type was determined by family history, and SITA 30-2 Humphrey automated visual fields were obtained with III white static targets.
TABLE 2. DEMOGRAPHICS AND PREOPERATIVE VISION AND VISUAL FIELDS OF ASR-IMPLANTED PATIENTS 5 THROUGH 10
PATIENT AGE RACE/SEX RP TYPE PREOP VISION OF IMPLANTED OD
PREOP VISUAL FIELD RADIUS
5 59 W/M AD CF at 1-2 feet <15°
6 59 W/M AD HM at 4-5 feet <15°
7 68 W/M AD Usher II HM at 2-3 feet <15°
8 56 B/M Isolated HM at 1-2 feet <15°
9 41 W/F Isolated HM at 5-6 feet <15°
10 41 W/M X-linked HM at 5 feet <15°
AD, autosomal dominant; ASR, artificial silicon retina; CF, counting fingers; HM, hand motions; RP, retinitis pigmentosa.
Chow Grating Acuity Testing
The CGAT test was developed because ETDRS testing even at the close ½-m distance was limited in the low vision range by the largest letter size to 20/1600 (logMAR 1.9). CGAT testing extended this range and tested from 20/125 (logMAR 0.8) to 20/6400 (logMAR 2.5). All vision testing was conducted with full cycloplegia (1 gtt each of 1% cyclopentolate, 1% tropicamide, 2½% neosynephrine) applied at least 40 minutes before testing and full refractive correction for the test distance.
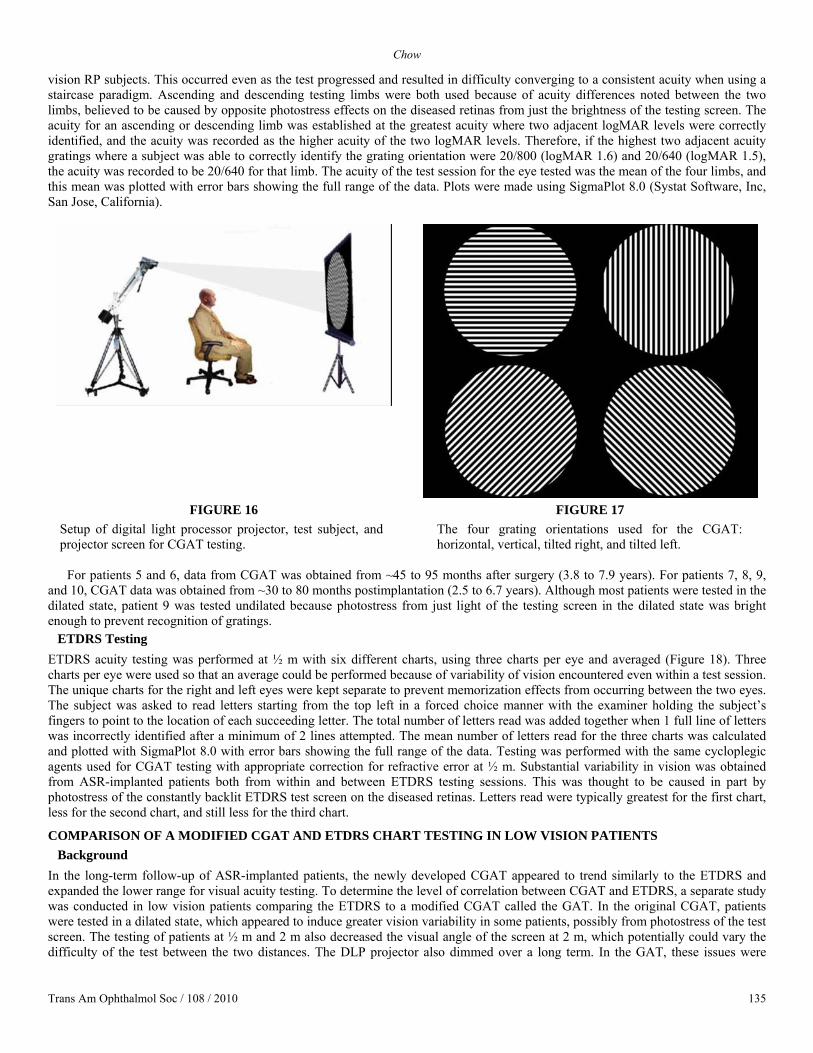
The CGAT gratings were presented to each eye in separate tests and controlled by a computer program interfaced to a digital light processor (DLP) computer projector that projected gratings onto a screen at distance of 2 m (Figure 16). Eighteen square-wave gratings in a sequence of decreasing separations of logMAR 0.1 (descending limb) were projected, followed by 18 gratings of increasing separations of logMAR 0.1 (ascending limb). The subject was initially placed at ½ meter from the screen and tested from 20/6400 down to 20/2560. At 20/2000, the subject was moved to 2 meters and tested down to 20/125 and then up again to 20/2000. At 20/2560, the subject was again moved forward to ½ m from the screen for the remainder of the test, up to 20/6400. The grating sizes were generated by a computer program written in Microsoft Visual Basic, and progression from one grating size to the next was controlled by the tester using a computer mouse. Appropriate cycloplegic refraction for each eye was placed in trial frames for the subjects and changed between the ½-m and 2-m test distances. When one eye was being tested, the opposite eye was patched.
In all, 36 square-wave gratings (18 descending and 18 ascending) were presented inside a software-created circular aperture of 0.75-m diameter and were divided into nine each of vertical, horizontal, diagonal left, and diagonal right orientations that were randomized by the computer program at the start of the test (Figure 17). The test was 4-AFC. A tone sounded the beginning of the test to alert the subject that a grating had been projected. After 5 seconds, a double tone sounded and the grating was replaced by a screen of nonoverlapping random white dots of 20/4000 size covering ~50% of a 50% gray screen. The subject was then asked to respond with the orientation of the grating and was told to guess if there was uncertainty. The next grating size was not shown until the subject provided an answer. If the patient responded early, the random dot screen was still presented for a minimum of 3 seconds (software controlled) before the next grating could be advanced by the tester. A 2-minute rest interval was allowed between the testing of the eyes, and both eyes were tested twice at each test session.
It was found early in CGAT development that a sweeping series of tests was necessary (18 ascending and 18 descending limb test per eye per test session) instead of a staircase paradigm because of constantly and rapidly variable vision encountered in the low
Trans Am Ophthalmol Soc / 108 / 2010 134
Chow
vision RP subjects. This occurred even as the test progressed and resulted in difficulty converging to a consistent acuity when using a staircase paradigm. Ascending and descending testing limbs were both used because of acuity differences noted between the two limbs, believed to be caused by opposite photostress effects on the diseased retinas from just the brightness of the testing screen. The acuity for an ascending or descending limb was established at the greatest acuity where two adjacent logMAR levels were correctly identified, and the acuity was recorded as the higher acuity of the two logMAR levels. Therefore, if the highest two adjacent acuity gratings where a subject was able to correctly identify the grating orientation were 20/800 (logMAR 1.6) and 20/640 (logMAR 1.5), the acuity was recorded to be 20/640 for that limb. The acuity of the test session for the eye tested was the mean of the four limbs, and this mean was plotted with error bars showing the full range of the data. Plots were made using SigmaPlot 8.0 (Systat Software, Inc, San Jose, California).
FIGURE 16
Setup of digital light processor projector, test subject, and projector screen for CGAT testing.
FIGURE 17 The four grating orientations used for the CGAT: horizontal, vertical, tilted right, and tilted left.
For patients 5 and 6, data from CGAT was obtained from ~45 to 95 months after surgery (3.8 to 7.9 years). For patients 7, 8, 9,
and 10, CGAT data was obtained from ~30 to 80 months postimplantation (2.5 to 6.7 years). Although most patients were tested in the dilated state, patient 9 was tested undilated because photostress from just light of the testing screen in the dilated state was bright enough to prevent recognition of gratings.
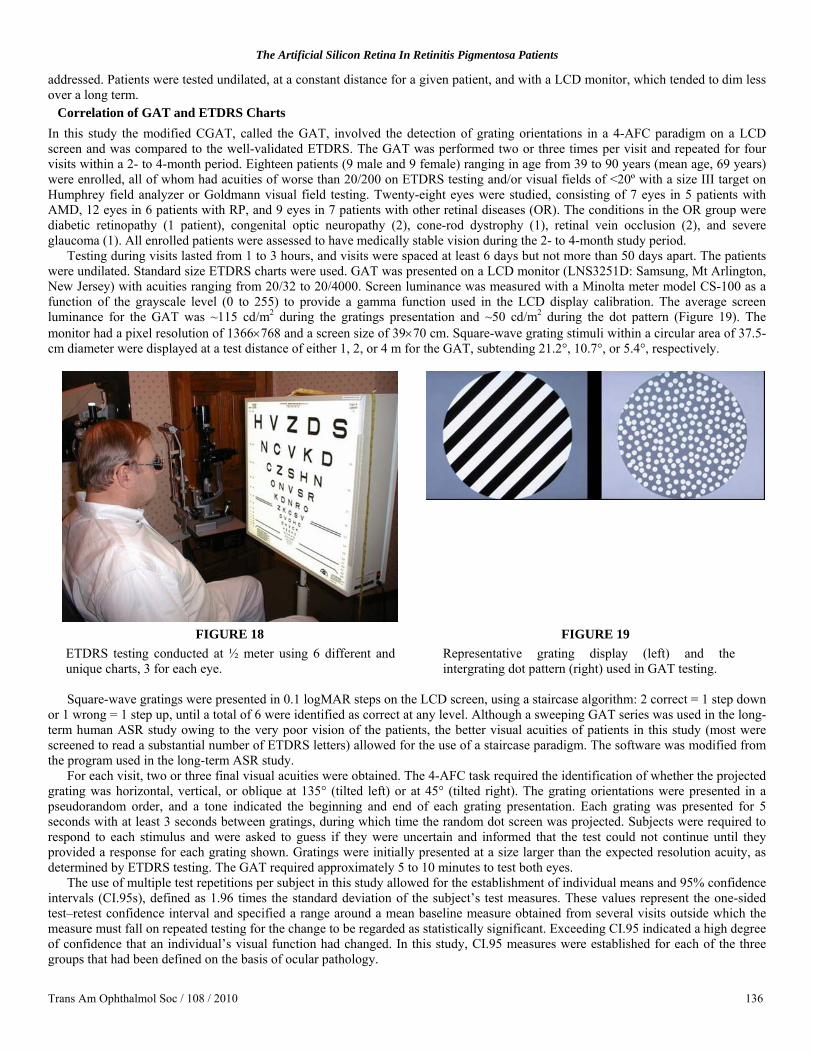
ETDRS Testing ETDRS acuity testing was performed at ½ m with six different charts, using three charts per eye and averaged (Figure 18). Three charts per eye were used so that an average could be performed because of variability of vision encountered even within a test session. The unique charts for the right and left eyes were kept separate to prevent memorization effects from occurring between the two eyes. The subject was asked to read letters starting from the top left in a forced choice manner with the examiner holding the subject’s fingers to point to the location of each succeeding letter. The total number of letters read was added together when 1 full line of letters was incorrectly identified after a minimum of 2 lines attempted. The mean number of letters read for the three charts was calculated and plotted with SigmaPlot 8.0 with error bars showing the full range of the data. Testing was performed with the same cycloplegic agents used for CGAT testing with appropriate correction for refractive error at ½ m. Substantial variability in vision was obtained from ASR-implanted patients both from within and between ETDRS testing sessions. This was thought to be caused in part by photostress of the constantly backlit ETDRS test screen on the diseased retinas. Letters read were typically greatest for the first chart, less for the second chart, and still less for the third chart.
COMPARISON OF A MODIFIED CGAT AND ETDRS CHART TESTING IN LOW VISION PATIENTS Background
In the long-term follow-up of ASR-implanted patients, the newly developed CGAT appeared to trend similarly to the ETDRS and expanded the lower range for visual acuity testing. To determine the level of correlation between CGAT and ETDRS, a separate study was conducted in low vision patients comparing the ETDRS to a modified CGAT called the GAT. In the original CGAT, patients were tested in a dilated state, which appeared to induce greater vision variability in some patients, possibly from photostress of the test screen. The testing of patients at ½ m and 2 m also decreased the visual angle of the screen at 2 m, which potentially could vary the difficulty of the test between the two distances. The DLP projector also dimmed over a long term. In the GAT, these issues were
Trans Am Ophthalmol Soc / 108 / 2010 135
The Artificial Silicon Retina In Retinitis Pigmentosa Patients
addressed. Patients were tested undilated, at a constant distance for a given patient, and with a LCD monitor, which tended to dim less over a long term.
Correlation of GAT and ETDRS Charts In this study the modified CGAT, called the GAT, involved the detection of grating orientations in a 4-AFC paradigm on a LCD screen and was compared to the well-validated ETDRS. The GAT was performed two or three times per visit and repeated for four visits within a 2- to 4-month period. Eighteen patients (9 male and 9 female) ranging in age from 39 to 90 years (mean age, 69 years) were enrolled, all of whom had acuities of worse than 20/200 on ETDRS testing and/or visual fields of <20º with a size III target on Humphrey field analyzer or Goldmann visual field testing. Twenty-eight eyes were studied, consisting of 7 eyes in 5 patients with AMD, 12 eyes in 6 patients with RP, and 9 eyes in 7 patients with other retinal diseases (OR). The conditions in the OR group were diabetic retinopathy (1 patient), congenital optic neuropathy (2), cone-rod dystrophy (1), retinal vein occlusion (2), and severe glaucoma (1). All enrolled patients were assessed to have medically stable vision during the 2- to 4-month study period.
Testing during visits lasted from 1 to 3 hours, and visits were spaced at least 6 days but not more than 50 days apart. The patients were undilated. Standard size ETDRS charts were used. GAT was presented on a LCD monitor (LNS3251D: Samsung, Mt Arlington, New Jersey) with acuities ranging from 20/32 to 20/4000. Screen luminance was measured with a Minolta meter model CS-100 as a function of the grayscale level (0 to 255) to provide a gamma function used in the LCD display calibration. The average screen luminance for the GAT was ~115 cd/m2 during the gratings presentation and ~50 cd/m2 during the dot pattern (Figure 19). The monitor had a pixel resolution of 1366×768 and a screen size of 39×70 cm. Square-wave grating stimuli within a circular area of 37.5-cm diameter were displayed at a test distance of either 1, 2, or 4 m for the GAT, subtending 21.2°, 10.7°, or 5.4°, respectively.
FIGURE 18 ETDRS testing conducted at ½ meter using 6 different and unique charts, 3 for each eye.
FIGURE 19 Representative grating display (left) and the intergrating dot pattern (right) used in GAT testing.
Square-wave gratings were presented in 0.1 logMAR steps on the LCD screen, using a staircase algorithm: 2 correct = 1 step down
or 1 wrong = 1 step up, until a total of 6 were identified as correct at any level. Although a sweeping GAT series was used in the long-term human ASR study owing to the very poor vision of the patients, the better visual acuities of patients in this study (most were screened to read a substantial number of ETDRS letters) allowed for the use of a staircase paradigm. The software was modified from the program used in the long-term ASR study.
For each visit, two or three final visual acuities were obtained. The 4-AFC task required the identification of whether the projected grating was horizontal, vertical, or oblique at 135° (tilted left) or at 45° (tilted right). The grating orientations were presented in a pseudorandom order, and a tone indicated the beginning and end of each grating presentation. Each grating was presented for 5 seconds with at least 3 seconds between gratings, during which time the random dot screen was projected. Subjects were required to respond to each stimulus and were asked to guess if they were uncertain and informed that the test could not continue until they provided a response for each grating shown. Gratings were initially presented at a size larger than the expected resolution acuity, as determined by ETDRS testing. The GAT required approximately 5 to 10 minutes to test both eyes.
The use of multiple test repetitions per subject in this study allowed for the establishment of individual means and 95% confidence intervals (CI.95s), defined as 1.96 times the standard deviation of the subject’s test measures. These values represent the one-sided test–retest confidence interval and specified a range around a mean baseline measure obtained from several visits outside which the measure must fall on repeated testing for the change to be regarded as statistically significant. Exceeding CI.95 indicated a high degree of confidence that an individual’s visual function had changed. In this study, CI.95 measures were established for each of the three groups that had been defined on the basis of ocular pathology.
Trans Am Ophthalmol Soc / 108 / 2010 136
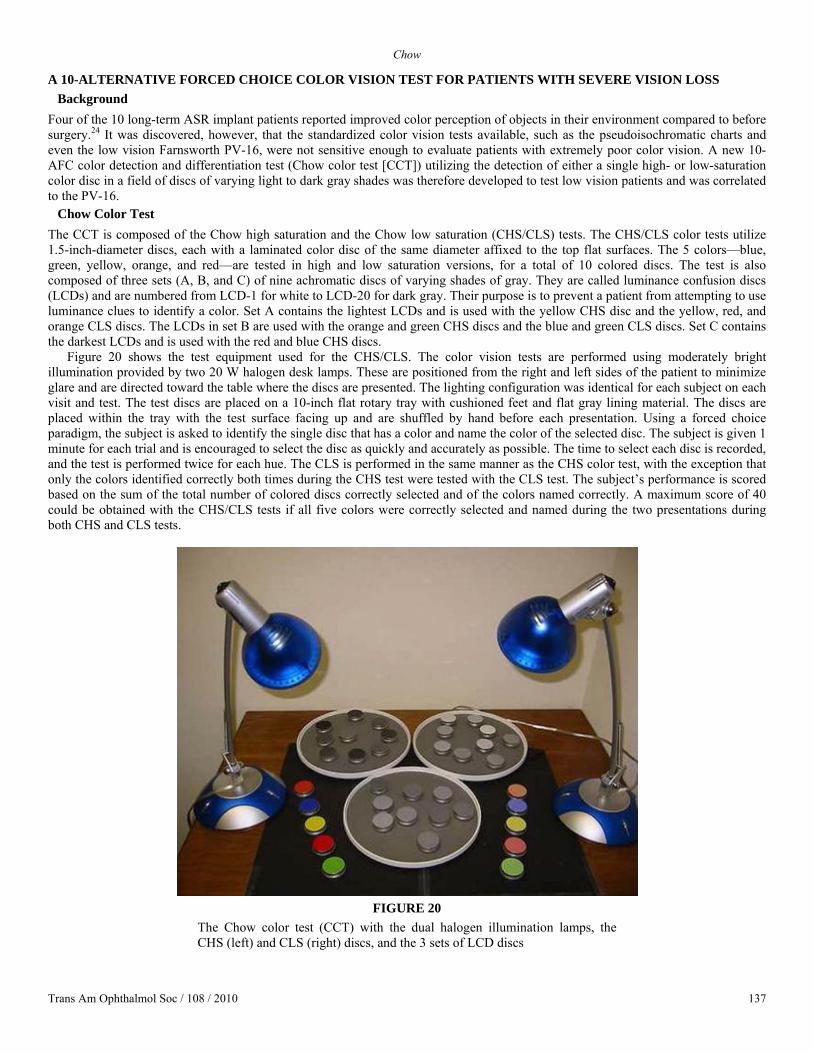
Chow
A 10-ALTERNATIVE FORCED CHOICE COLOR VISION TEST FOR PATIENTS WITH SEVERE VISION LOSS Background
Four of the 10 long-term ASR implant patients reported improved color perception of objects in their environment compared to before surgery.24 It was discovered, however, that the standardized color vision tests available, such as the pseudoisochromatic charts and even the low vision Farnsworth PV-16, were not sensitive enough to evaluate patients with extremely poor color vision. A new 10-AFC color detection and differentiation test (Chow color test [CCT]) utilizing the detection of either a single high- or low-saturation color disc in a field of discs of varying light to dark gray shades was therefore developed to test low vision patients and was correlated to the PV-16.
Chow Color Test The CCT is composed of the Chow high saturation and the Chow low saturation (CHS/CLS) tests. The CHS/CLS color tests utilize 1.5-inch-diameter discs, each with a laminated color disc of the same diameter affixed to the top flat surfaces. The 5 colors—blue, green, yellow, orange, and red—are tested in high and low saturation versions, for a total of 10 colored discs. The test is also composed of three sets (A, B, and C) of nine achromatic discs of varying shades of gray. They are called luminance confusion discs (LCDs) and are numbered from LCD-1 for white to LCD-20 for dark gray. Their purpose is to prevent a patient from attempting to use luminance clues to identify a color. Set A contains the lightest LCDs and is used with the yellow CHS disc and the yellow, red, and orange CLS discs. The LCDs in set B are used with the orange and green CHS discs and the blue and green CLS discs. Set C contains the darkest LCDs and is used with the red and blue CHS discs.
Figure 20 shows the test equipment used for the CHS/CLS. The color vision tests are performed using moderately bright illumination provided by two 20 W halogen desk lamps. These are positioned from the right and left sides of the patient to minimize glare and are directed toward the table where the discs are presented. The lighting configuration was identical for each subject on each visit and test. The test discs are placed on a 10-inch flat rotary tray with cushioned feet and flat gray lining material. The discs are placed within the tray with the test surface facing up and are shuffled by hand before each presentation. Using a forced choice paradigm, the subject is asked to identify the single disc that has a color and name the color of the selected disc. The subject is given 1 minute for each trial and is encouraged to select the disc as quickly and accurately as possible. The time to select each disc is recorded, and the test is performed twice for each hue. The CLS is performed in the same manner as the CHS color test, with the exception that only the colors identified correctly both times during the CHS test were tested with the CLS test. The subject’s performance is scored based on the sum of the total number of colored discs correctly selected and of the colors named correctly. A maximum score of 40 could be obtained with the CHS/CLS tests if all five colors were correctly selected and named during the two presentations during both CHS and CLS tests.
FIGURE 20
The Chow color test (CCT) with the dual halogen illumination lamps, the CHS (left) and CLS (right) discs, and the 3 sets of LCD discs
Trans Am Ophthalmol Soc / 108 / 2010 137

The Artificial Silicon Retina In Retinitis Pigmentosa Patients
PV-16 Testing The PV-16 color test is similar to the Farnsworth panel D15 test, employing the same hues but with larger discs designed for lower-vision patients. The diameter of the colored area is 3.3 cm (1.3 inches). The patient is given the starting “pilot” disc and instructed to order the remaining 15 discs with the one that most closely matches the preceding disc. The patients were allowed to take whatever time was necessary to complete the test, and the test was not timed.
To score the PV-16 test, a quantitative scoring method proposed by Bowman78 was utilized, which takes the sum of the calculated color differences between each adjacent cap of the panel D-15. Perfect cap order with the PV-16 would yield a score of 116.9 with this method, and the score rises with increases in the number of transpositional crossovers or errors. This quantitative scoring technique has been recommended for use in clinical trials for the monitoring of changes in color vision over time.79
Study Patients and Design The study involved a total of 26 eyes in 17 patients (9 male and 8 female), which was a slightly smaller subset of the patients enrolled in the previously described GAT/ETDRS study. All eyes studied had either a best-corrected visual acuity of <20/200 as determined with ETDRS testing, or a visual field diameter <20° as determined by Goldmann and/or Humphrey visual field analyzer testing (size III target). The patients were divided into three groups based on their eye disease—RP, AMD, and OR. Conditions in the OR group were diabetic retinopathy (1), congenital optic neuropathy (2), cone-rod dystrophy (1), retinal vein occlusion (2), and severe glaucoma (1). There were 5 RP patients (10 eyes), 5 AMD patients (7 eyes), and 7 OR patients (9 eyes). The patients’ ages ranged from 39 to 90 with a mean of 69 years, and all were judged to have stable vision during the 1- to 3-month study period as determined by patient history and vision testing where necessary. The ETDRS vision means and ranges for the study patients were as follows: for AMD, 1.46 logMAR (~20/575) with a range of 1.04 to 1.92; for RP, 1.0 logMAR (20/200) with a range of 0.32 to 2.0; and for OR, 1.37 logMAR (~20/475) with a range of 1.0 to 2.0. Two OR patients with diabetic retinopathy initially enrolled were lost to follow-up after their first visit.
The subjects were scheduled for testing during four visits, each lasting between 1 and 3 hours, depending on whether one eye or both eyes were tested. During these visits, ETDRS visual acuity and GAT were performed followed by the PV-16 and the CHS/CLS tests. Three of the subjects performed the color tests during 3 of 4 visits because of time restrictions. For subjects whose better eye did not meet the vision criteria, the color tests were administered in the better eye on one occasion. Subjects were given regular breaks between tests, as deemed necessary by the subject or tester, to minimize fatigue.
Multiple test repetitions per subject allowed for the establishment of individual means and CI.95s, defined as 1.96 times the standard deviation of the subject’s test measures. CI.95 represents the one-sided test–retest confidence interval and specifies a range around a baseline measure outside which the measure must fall on repeated testing for the change to be regarded as significant (ie, not attributable to chance). Exceeding the CI.95 represents a high degree of confidence that an individual’s visual function has changed. In this study, CI.95 measures were established for the three groups defined on the basis of ocular pathology.
RESULTS
BIOCOMPATIBILITY AND DURABILITY OF THE ASR IMPLANT IN THE RP SUBRETINAL ENVIRONMENT Histologic Examination of Retina in the ASR-Implanted and Unimplanted Eyes
The retinas of both eyes appeared to be in the late stages of photoreceptor degeneration. No photoreceptor segments or nuclei were present in any of the sections examined. In addition, the laminar structure of the inner retinal layers was disrupted in various locations across the retina. Figure 21 shows retinal sections from the right, implanted eye. All of the sections shown are within 1 to 2 mm of the implant area or overlie the implant area (Figure 21E and F). In some locations (Figure 21A and C), the inner laminar layers of the retina are still recognizable: the ganglion cell layer, inner plexiform layer, and inner nuclear layer. However, the cells within the layers are not normal, with noticeable cell loss and disorganization within the layers. The other sections (Figure 21B and D) show extreme remodeling and disorganization of the retinal layers. A glial seal has formed on both the inner and outer sides of the retina, which is recognized by the acellular regions on either side of the retina.
Overlying the implant (Figure 21E and F), the retina has a similar appearance as areas adjacent to the implant. No laminar layers were recognizable. Some inner retinal nuclei are still present, but these cells cannot be identified with this stain.
The inner retina has a dense glial seal. The Müller cells make a thick layer on the RPE side of the implant on one end of the implant (Figure 21E), whereas the glial processes are thinner on the RPE side of the other end, but thicker on the retinal side (Figure 21F).
Figure 22 shows an area of the retina directly superior to the implant that appears to correspond to a white spot seen on the fundus. This area has numerous fibrous strands and possible macrophages infiltrating the inner retina. Some inner retinal nuclei are present, but the identity of the cells is not known.
The area of greatest inner retinal nuclei in the ASR implanted right eye was near the macular region, as shown in Figure 23. Although no photoreceptors were present, the three inner retinal layers were recognizable: the ganglion cell layer, inner plexiform layer (large, red arrow), and inner nuclear layer (thin, green arrow). In addition, another group of nuclei was present (short, pink arrow). However, it is unlikely that all of these nuclei have the typical connectivity to other retinal cell types. This stage of degeneration is marked by reorganization of synaptic connections, which will be discussed below. These cells’ nuclei did not have the appearance of photoreceptors.
Trans Am Ophthalmol Soc / 108 / 2010 138
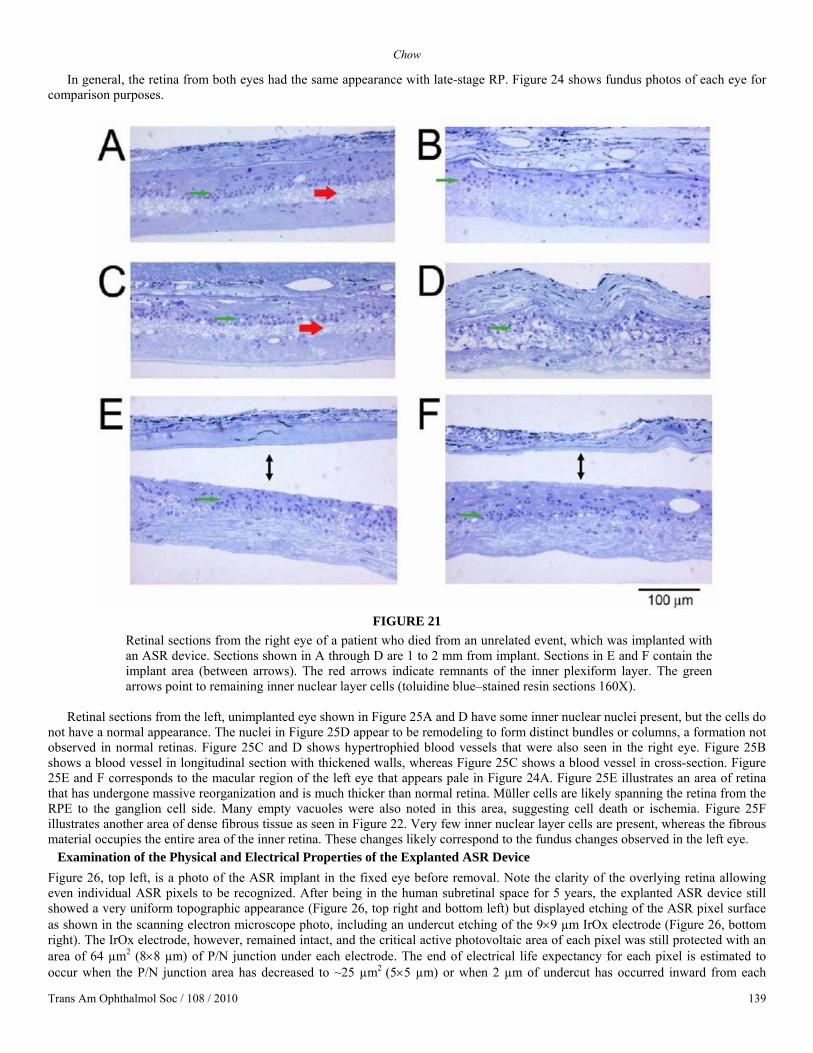
Chow
In general, the retina from both eyes had the same appearance with late-stage RP. Figure 24 shows fundus photos of each eye for comparison purposes.
FIGURE 21
Retinal sections from the right eye of a patient who died from an unrelated event, which was implanted with an ASR device. Sections shown in A through D are 1 to 2 mm from implant. Sections in E and F contain the implant area (between arrows). The red arrows indicate remnants of the inner plexiform layer. The green arrows point to remaining inner nuclear layer cells (toluidine blue–stained resin sections 160X).
Retinal sections from the left, unimplanted eye shown in Figure 25A and D have some inner nuclear nuclei present, but the cells do
not have a normal appearance. The nuclei in Figure 25D appear to be remodeling to form distinct bundles or columns, a formation not observed in normal retinas. Figure 25C and D shows hypertrophied blood vessels that were also seen in the right eye. Figure 25B shows a blood vessel in longitudinal section with thickened walls, whereas Figure 25C shows a blood vessel in cross-section. Figure 25E and F corresponds to the macular region of the left eye that appears pale in Figure 24A. Figure 25E illustrates an area of retina that has undergone massive reorganization and is much thicker than normal retina. Müller cells are likely spanning the retina from the RPE to the ganglion cell side. Many empty vacuoles were also noted in this area, suggesting cell death or ischemia. Figure 25F illustrates another area of dense fibrous tissue as seen in Figure 22. Very few inner nuclear layer cells are present, whereas the fibrous material occupies the entire area of the inner retina. These changes likely correspond to the fundus changes observed in the left eye.
Examination of the Physical and Electrical Properties of the Explanted ASR Device Figure 26, top left, is a photo of the ASR implant in the fixed eye before removal. Note the clarity of the overlying retina allowing even individual ASR pixels to be recognized. After being in the human subretinal space for 5 years, the explanted ASR device still showed a very uniform topographic appearance (Figure 26, top right and bottom left) but displayed etching of the ASR pixel surface as shown in the scanning electron microscope photo, including an undercut etching of the 9×9 µm IrOx electrode (Figure 26, bottom right). The IrOx electrode, however, remained intact, and the critical active photovoltaic area of each pixel was still protected with an area of 64 µm2 (8×8 µm) of P/N junction under each electrode. The end of electrical life expectancy for each pixel is estimated to occur when the P/N junction area has decreased to ~25 µm2 (5×5 µm) or when 2 µm of undercut has occurred inward from each
Trans Am Ophthalmol Soc / 108 / 2010 139

The Artificial Silicon Retina In Retinitis Pigmentosa Patients
electrode edge. At the observed loss rate of 0.4 to 0.5 µm/5 years, an additional 15 years of functional electrical life may have remained for the device, for a total ASR functional life of ~20 years. Observed also was that the original trenches in isolation regions between the pixels that were ~0.3 µm deep had now become 0.9 µm deep. The high-angle scanning electron microscope views of the ASR pixels show the low undercutting of the IrOx electrode (Figure 26, bottom right).
FIGURE 22 Fundus photograph of the right eye of patient 3 showing the location of the ASR device. Note that white spot (black arrow) located superior to the ASR device appears to correspond to the histologic section shown on the right. The ganglion cell layer is composed of thickened fibrous tissue (toluidine blue–stained resin sections, 160X).
FIGURE 23 Retinal section from near the macular region of the right eye. This area of the retina shows evidence of the inner plexiform layer (large, red arrow), remnants of the inner nuclear layer (thin, green arrow), and some additional, presumably inner retinal nuclei (short, pink arrow) (toluidine blue–stained resin sections, 320X).
FIGURE 24 Fundus photos of the right, implanted (A) and left, unimplanted (B) eyes of patient 3.
In Figure 27, cyclic voltammetry sweeps of the explanted ASR chip showed a greater than 2× improvement of charge exchange
capacity (CEC) after being placed in the subretinal space for 5 years compared to the preimplanted device. The CEC of the explanted ASR was 2.8 µC compared to a preimplantation CEC of 1.0 µC.
As shown in Figure 28, 5 years after implantation in the human subretinal space, the ASR device still showed substantial electrical performance assessed by dry whisker probing. Although a greater variability of pixel current was observed, the mean pixel current was 12.5 nA in the explanted ASR device compared to a preimplantation mean pixel current of 13 nA. Individual pixel current varied from 8 nA to 22 nA. The increased current observed in some pixels results from a greater P/N junction area being exposed to light owing to surface silicon dissolution. The charge exchange capacity for the explanted ASR device was also greater at 2.8 µC compared to 1 µC for an unimplanted device. This was believed to be the result of deeper IrOx electrode activation combined with improved photodiode function secondary to the increased area of P/N junction exposure to light.
LONG-TERM ASSESSMENT OF VISUAL FUNCTION IN ASR-IMPLANTED RP PATIENTS Summary of ETDRS and CGAT results
In all 6 patients, preoperative ETDRS testing showed that the ASR-implanted right eyes recognized fewer to the same number of letters compared to the control left eyes before surgery. Postoperatively, for periods that lasted up to 8 years, 4 of 6 patients had mean ETDRS recognition scores higher, sometimes substantially so, in the implanted eyes than in the unoperated eyes, whereas in 2 of 6 patients, the ETDRS scores for both eyes were too close to 0 to be useful for differentiating between the eyes. In one of these last 2 patients (patient 8), the ETDRS was consistently 0 letters preoperatively in the implanted eye and increased to 0 to 3 letters postoperatively but was still too close to the floor level of 0 to be notable. In the opposite eye, the ETDRS score dropped substantially
Trans Am Ophthalmol Soc / 108 / 2010 140
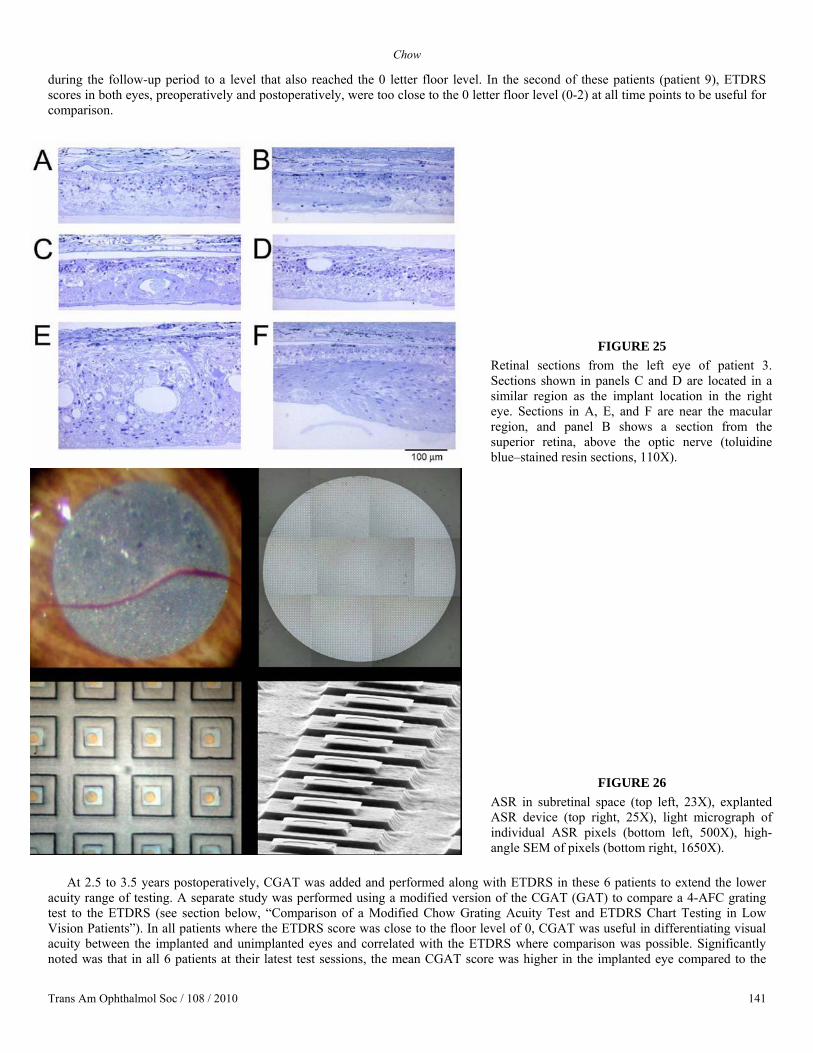
Chow
during the follow-up period to a level that also reached the 0 letter floor level. In the second of these patients (patient 9), ETDRS scores in both eyes, preoperatively and postoperatively, were too close to the 0 letter floor level (0-2) at all time points to be useful for comparison.
FIGURE 25 Retinal sections from the left eye of patient 3. Sections shown in panels C and D are located in a similar region as the implant location in the right eye. Sections in A, E, and F are near the macular region, and panel B shows a section from the superior retina, above the optic nerve (toluidine blue–stained resin sections, 110X).
FIGURE 26 ASR in subretinal space (top left, 23X), explanted ASR device (top right, 25X), light micrograph of individual ASR pixels (bottom left, 500X), high-angle SEM of pixels (bottom right, 1650X).
At 2.5 to 3.5 years postoperatively, CGAT was added and performed along with ETDRS in these 6 patients to extend the lower
acuity range of testing. A separate study was performed using a modified version of the CGAT (GAT) to compare a 4-AFC grating test to the ETDRS (see section below, “Comparison of a Modified Chow Grating Acuity Test and ETDRS Chart Testing in Low Vision Patients”). In all patients where the ETDRS score was close to the floor level of 0, CGAT was useful in differentiating visual acuity between the implanted and unimplanted eyes and correlated with the ETDRS where comparison was possible. Significantly noted was that in all 6 patients at their latest test sessions, the mean CGAT score was higher in the implanted eye compared to the
Trans Am Ophthalmol Soc / 108 / 2010 141
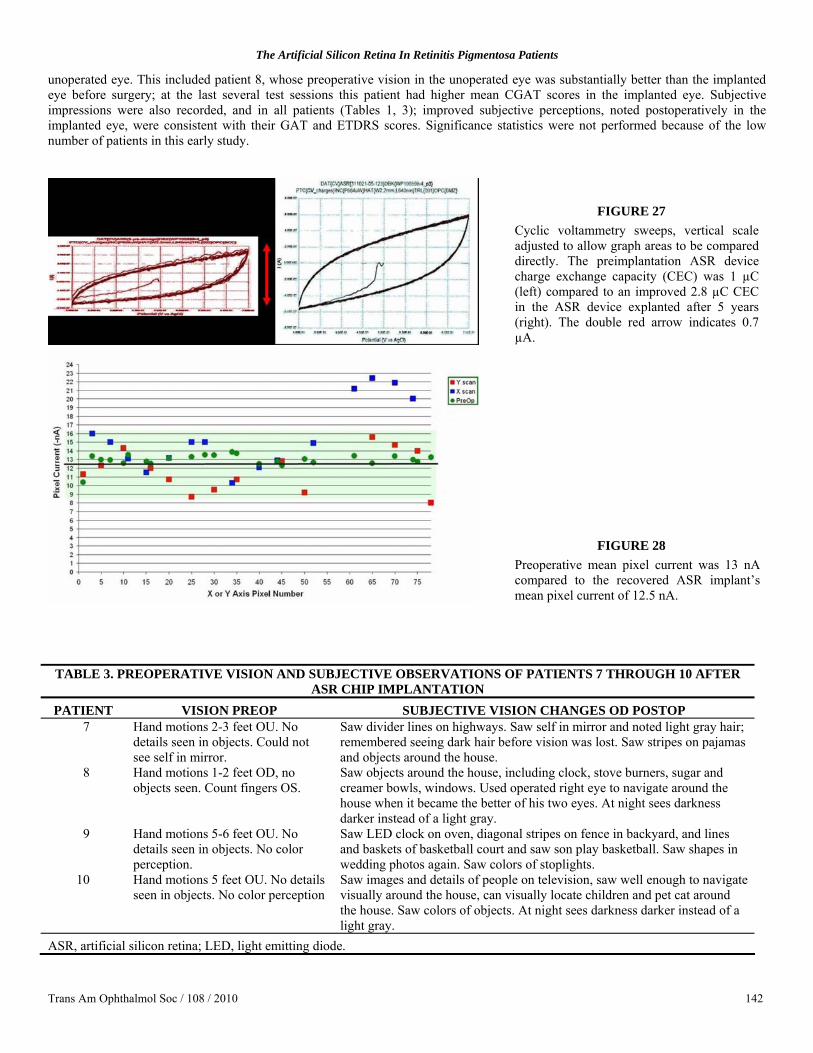
The Artificial Silicon Retina In Retinitis Pigmentosa Patients
unoperated eye. This included patient 8, whose preoperative vision in the unoperated eye was substantially better than the implanted eye before surgery; at the last several test sessions this patient had higher mean CGAT scores in the implanted eye. Subjective impressions were also recorded, and in all patients (Tables 1, 3); improved subjective perceptions, noted postoperatively in the implanted eye, were consistent with their GAT and ETDRS scores. Significance statistics were not performed because of the low number of patients in this early study.
FIGURE 27 Cyclic voltammetry sweeps, vertical scale adjusted to allow graph areas to be compared directly. The preimplantation ASR device charge exchange capacity (CEC) was 1 µC (left) compared to an improved 2.8 µC CEC in the ASR device explanted after 5 years (right). The double red arrow indicates 0.7 µA.
FIGURE 28 Preoperative mean pixel current was 13 nA compared to the recovered ASR implant’s mean pixel current of 12.5 nA.
TABLE 3. PREOPERATIVE VISION AND SUBJECTIVE OBSERVATIONS OF PATIENTS 7 THROUGH 10 AFTER ASR CHIP IMPLANTATION
PATIENT VISION PREOP SUBJECTIVE VISION CHANGES OD POSTOP 7 Hand motions 2-3 feet OU. No
details seen in objects. Could not see self in mirror.
Saw divider lines on highways. Saw self in mirror and noted light gray hair; remembered seeing dark hair before vision was lost. Saw stripes on pajamas and objects around the house.
8 Hand motions 1-2 feet OD, no objects seen. Count fingers OS.
Saw objects around the house, including clock, stove burners, sugar and creamer bowls, windows. Used operated right eye to navigate around the house when it became the better of his two eyes. At night sees darkness darker instead of a light gray.
9 Hand motions 5-6 feet OU. No details seen in objects. No color perception.
Saw LED clock on oven, diagonal stripes on fence in backyard, and lines and baskets of basketball court and saw son play basketball. Saw shapes in wedding photos again. Saw colors of stoplights.
10 Hand motions 5 feet OU. No details seen in objects. No color perception
Saw images and details of people on television, saw well enough to navigate visually around the house, can visually locate children and pet cat around the house. Saw colors of objects. At night sees darkness darker instead of a light gray.
ASR, artificial silicon retina; LED, light emitting diode.
Trans Am Ophthalmol Soc / 108 / 2010 142
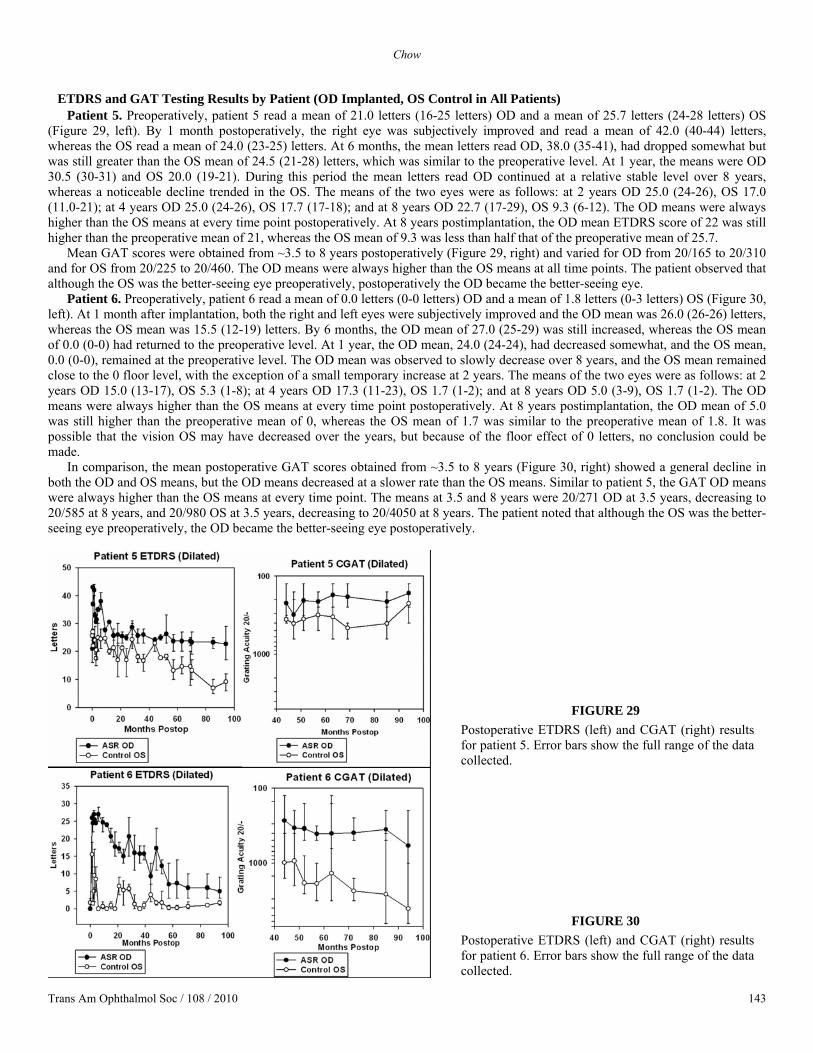
Chow
ETDRS and GAT Testing Results by Patient (OD Implanted, OS Control in All Patients)
Patient 5. Preoperatively, patient 5 read a mean of 21.0 letters (16-25 letters) OD and a mean of 25.7 letters (24-28 letters) OS (Figure 29, left). By 1 month postoperatively, the right eye was subjectively improved and read a mean of 42.0 (40-44) letters, whereas the OS read a mean of 24.0 (23-25) letters. At 6 months, the mean letters read OD, 38.0 (35-41), had dropped somewhat but was still greater than the OS mean of 24.5 (21-28) letters, which was similar to the preoperative level. At 1 year, the means were OD 30.5 (30-31) and OS 20.0 (19-21). During this period the mean letters read OD continued at a relative stable level over 8 years, whereas a noticeable decline trended in the OS. The means of the two eyes were as follows: at 2 years OD 25.0 (24-26), OS 17.0 (11.0-21); at 4 years OD 25.0 (24-26), OS 17.7 (17-18); and at 8 years OD 22.7 (17-29), OS 9.3 (6-12). The OD means were always higher than the OS means at every time point postoperatively. At 8 years postimplantation, the OD mean ETDRS score of 22 was still higher than the preoperative mean of 21, whereas the OS mean of 9.3 was less than half that of the preoperative mean of 25.7.
Mean GAT scores were obtained from ~3.5 to 8 years postoperatively (Figure 29, right) and varied for OD from 20/165 to 20/310 and for OS from 20/225 to 20/460. The OD means were always higher than the OS means at all time points. The patient observed that although the OS was the better-seeing eye preoperatively, postoperatively the OD became the better-seeing eye.
Patient 6. Preoperatively, patient 6 read a mean of 0.0 letters (0-0 letters) OD and a mean of 1.8 letters (0-3 letters) OS (Figure 30, left). At 1 month after implantation, both the right and left eyes were subjectively improved and the OD mean was 26.0 (26-26) letters, whereas the OS mean was 15.5 (12-19) letters. By 6 months, the OD mean of 27.0 (25-29) was still increased, whereas the OS mean of 0.0 (0-0) had returned to the preoperative level. At 1 year, the OD mean, 24.0 (24-24), had decreased somewhat, and the OS mean, 0.0 (0-0), remained at the preoperative level. The OD mean was observed to slowly decrease over 8 years, and the OS mean remained close to the 0 floor level, with the exception of a small temporary increase at 2 years. The means of the two eyes were as follows: at 2 years OD 15.0 (13-17), OS 5.3 (1-8); at 4 years OD 17.3 (11-23), OS 1.7 (1-2); and at 8 years OD 5.0 (3-9), OS 1.7 (1-2). The OD means were always higher than the OS means at every time point postoperatively. At 8 years postimplantation, the OD mean of 5.0 was still higher than the preoperative mean of 0, whereas the OS mean of 1.7 was similar to the preoperative mean of 1.8. It was possible that the vision OS may have decreased over the years, but because of the floor effect of 0 letters, no conclusion could be made.
In comparison, the mean postoperative GAT scores obtained from ~3.5 to 8 years (Figure 30, right) showed a general decline in both the OD and OS means, but the OD means decreased at a slower rate than the OS means. Similar to patient 5, the GAT OD means were always higher than the OS means at every time point. The means at 3.5 and 8 years were 20/271 OD at 3.5 years, decreasing to 20/585 at 8 years, and 20/980 OS at 3.5 years, decreasing to 20/4050 at 8 years. The patient noted that although the OS was the better-seeing eye preoperatively, the OD became the better-seeing eye postoperatively.
FIGURE 29 Postoperative ETDRS (left) and CGAT (right) results for patient 5. Error bars show the full range of the data collected.
FIGURE 30 Postoperative ETDRS (left) and CGAT (right) results for patient 6. Error bars show the full range of the data collected.
Trans Am Ophthalmol Soc / 108 / 2010 143
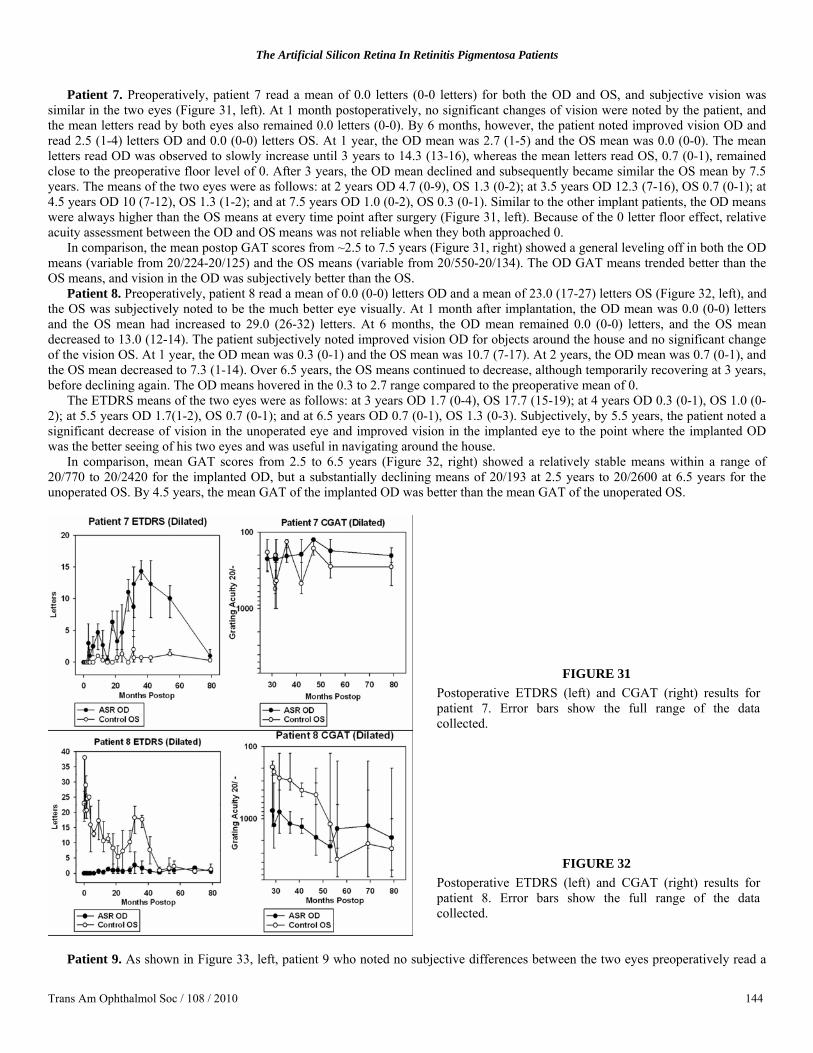
The Artificial Silicon Retina In Retinitis Pigmentosa Patients
Patient 7. Preoperatively, patient 7 read a mean of 0.0 letters (0-0 letters) for both the OD and OS, and subjective vision was
similar in the two eyes (Figure 31, left). At 1 month postoperatively, no significant changes of vision were noted by the patient, and the mean letters read by both eyes also remained 0.0 letters (0-0). By 6 months, however, the patient noted improved vision OD and read 2.5 (1-4) letters OD and 0.0 (0-0) letters OS. At 1 year, the OD mean was 2.7 (1-5) and the OS mean was 0.0 (0-0). The mean letters read OD was observed to slowly increase until 3 years to 14.3 (13-16), whereas the mean letters read OS, 0.7 (0-1), remained close to the preoperative floor level of 0. After 3 years, the OD mean declined and subsequently became similar the OS mean by 7.5 years. The means of the two eyes were as follows: at 2 years OD 4.7 (0-9), OS 1.3 (0-2); at 3.5 years OD 12.3 (7-16), OS 0.7 (0-1); at 4.5 years OD 10 (7-12), OS 1.3 (1-2); and at 7.5 years OD 1.0 (0-2), OS 0.3 (0-1). Similar to the other implant patients, the OD means were always higher than the OS means at every time point after surgery (Figure 31, left). Because of the 0 letter floor effect, relative acuity assessment between the OD and OS means was not reliable when they both approached 0.
In comparison, the mean postop GAT scores from ~2.5 to 7.5 years (Figure 31, right) showed a general leveling off in both the OD means (variable from 20/224-20/125) and the OS means (variable from 20/550-20/134). The OD GAT means trended better than the OS means, and vision in the OD was subjectively better than the OS.
Patient 8. Preoperatively, patient 8 read a mean of 0.0 (0-0) letters OD and a mean of 23.0 (17-27) letters OS (Figure 32, left), and the OS was subjectively noted to be the much better eye visually. At 1 month after implantation, the OD mean was 0.0 (0-0) letters and the OS mean had increased to 29.0 (26-32) letters. At 6 months, the OD mean remained 0.0 (0-0) letters, and the OS mean decreased to 13.0 (12-14). The patient subjectively noted improved vision OD for objects around the house and no significant change of the vision OS. At 1 year, the OD mean was 0.3 (0-1) and the OS mean was 10.7 (7-17). At 2 years, the OD mean was 0.7 (0-1), and the OS mean decreased to 7.3 (1-14). Over 6.5 years, the OS means continued to decrease, although temporarily recovering at 3 years, before declining again. The OD means hovered in the 0.3 to 2.7 range compared to the preoperative mean of 0.
The ETDRS means of the two eyes were as follows: at 3 years OD 1.7 (0-4), OS 17.7 (15-19); at 4 years OD 0.3 (0-1), OS 1.0 (0-2); at 5.5 years OD 1.7(1-2), OS 0.7 (0-1); and at 6.5 years OD 0.7 (0-1), OS 1.3 (0-3). Subjectively, by 5.5 years, the patient noted a significant decrease of vision in the unoperated eye and improved vision in the implanted eye to the point where the implanted OD was the better seeing of his two eyes and was useful in navigating around the house.
In comparison, mean GAT scores from 2.5 to 6.5 years (Figure 32, right) showed a relatively stable means within a range of 20/770 to 20/2420 for the implanted OD, but a substantially declining means of 20/193 at 2.5 years to 20/2600 at 6.5 years for the unoperated OS. By 4.5 years, the mean GAT of the implanted OD was better than the mean GAT of the unoperated OS.
FIGURE 31 Postoperative ETDRS (left) and CGAT (right) results for patient 7. Error bars show the full range of the data collected.
FIGURE 32 Postoperative ETDRS (left) and CGAT (right) results for patient 8. Error bars show the full range of the data collected.
Patient 9. As shown in Figure 33, left, patient 9 who noted no subjective differences between the two eyes preoperatively read a
Trans Am Ophthalmol Soc / 108 / 2010 144
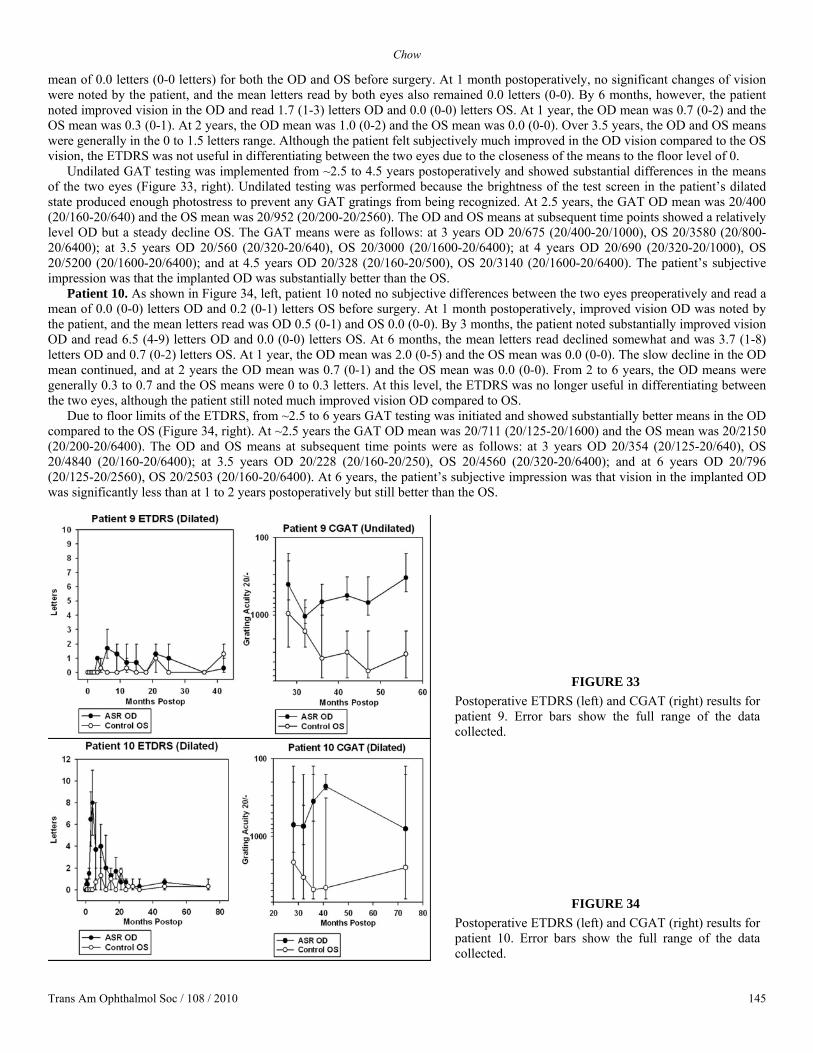
Chow
mean of 0.0 letters (0-0 letters) for both the OD and OS before surgery. At 1 month postoperatively, no significant changes of vision were noted by the patient, and the mean letters read by both eyes also remained 0.0 letters (0-0). By 6 months, however, the patient noted improved vision in the OD and read 1.7 (1-3) letters OD and 0.0 (0-0) letters OS. At 1 year, the OD mean was 0.7 (0-2) and the OS mean was 0.3 (0-1). At 2 years, the OD mean was 1.0 (0-2) and the OS mean was 0.0 (0-0). Over 3.5 years, the OD and OS means were generally in the 0 to 1.5 letters range. Although the patient felt subjectively much improved in the OD vision compared to the OS vision, the ETDRS was not useful in differentiating between the two eyes due to the closeness of the means to the floor level of 0.
Undilated GAT testing was implemented from ~2.5 to 4.5 years postoperatively and showed substantial differences in the means of the two eyes (Figure 33, right). Undilated testing was performed because the brightness of the test screen in the patient’s dilated state produced enough photostress to prevent any GAT gratings from being recognized. At 2.5 years, the GAT OD mean was 20/400 (20/160-20/640) and the OS mean was 20/952 (20/200-20/2560). The OD and OS means at subsequent time points showed a relatively level OD but a steady decline OS. The GAT means were as follows: at 3 years OD 20/675 (20/400-20/1000), OS 20/3580 (20/800-20/6400); at 3.5 years OD 20/560 (20/320-20/640), OS 20/3000 (20/1600-20/6400); at 4 years OD 20/690 (20/320-20/1000), OS 20/5200 (20/1600-20/6400); and at 4.5 years OD 20/328 (20/160-20/500), OS 20/3140 (20/1600-20/6400). The patient’s subjective impression was that the implanted OD was substantially better than the OS.
Patient 10. As shown in Figure 34, left, patient 10 noted no subjective differences between the two eyes preoperatively and read a mean of 0.0 (0-0) letters OD and 0.2 (0-1) letters OS before surgery. At 1 month postoperatively, improved vision OD was noted by the patient, and the mean letters read was OD 0.5 (0-1) and OS 0.0 (0-0). By 3 months, the patient noted substantially improved vision OD and read 6.5 (4-9) letters OD and 0.0 (0-0) letters OS. At 6 months, the mean letters read declined somewhat and was 3.7 (1-8) letters OD and 0.7 (0-2) letters OS. At 1 year, the OD mean was 2.0 (0-5) and the OS mean was 0.0 (0-0). The slow decline in the OD mean continued, and at 2 years the OD mean was 0.7 (0-1) and the OS mean was 0.0 (0-0). From 2 to 6 years, the OD means were generally 0.3 to 0.7 and the OS means were 0 to 0.3 letters. At this level, the ETDRS was no longer useful in differentiating between the two eyes, although the patient still noted much improved vision OD compared to OS.
Due to floor limits of the ETDRS, from ~2.5 to 6 years GAT testing was initiated and showed substantially better means in the OD compared to the OS (Figure 34, right). At ~2.5 years the GAT OD mean was 20/711 (20/125-20/1600) and the OS mean was 20/2150 (20/200-20/6400). The OD and OS means at subsequent time points were as follows: at 3 years OD 20/354 (20/125-20/640), OS 20/4840 (20/160-20/6400); at 3.5 years OD 20/228 (20/160-20/250), OS 20/4560 (20/320-20/6400); and at 6 years OD 20/796 (20/125-20/2560), OS 20/2503 (20/160-20/6400). At 6 years, the patient’s subjective impression was that vision in the implanted OD was significantly less than at 1 to 2 years postoperatively but still better than the OS.
FIGURE 33 Postoperative ETDRS (left) and CGAT (right) results for patient 9. Error bars show the full range of the data collected.
FIGURE 34 Postoperative ETDRS (left) and CGAT (right) results for patient 10. Error bars show the full range of the data collected.
Trans Am Ophthalmol Soc / 108 / 2010 145
The Artificial Silicon Retina In Retinitis Pigmentosa Patients
COMPARISON OF A MODIFIED CHOW GRATING ACUITY TEST AND ETDRS CHART TESTING IN LOW VISION PATIENTS
Summary of the Modified CGAT and ETDRS Charts Correlation Results The modified CGAT or GAT and ETDRS charts measured acutity up to a 2.2 logMAR range were linearly well correlated (r=0.79) for AMD, RP, and OR patient groups, with a mutual regression slope of 1.00. For RP patients specifically, the GAT and ETDRS correlation was excellent (r=0.92). The mean between-visit CI.95s in log units for all patients were 0.14 (ETDRS) and 0.16 (GAT). For RP patients specifically, the between-visit and within-visit CI.95s for GAT were 0.15 and 0.10 log unit, respectively.
Correlation of GAT and ETDRS Chart Acuity Testing The mean visual acuities and their ranges for each patient group for ETDRS charts and GAT are shown in Table 4. On average, the OR and AMD eyes performed 0.4 to 0.5 logMAR better with GAT than with ETDRS, whereas the RP eyes performed within 0.1 logMAR for the two acuity tests. For all eyes, 56% of eyes scored at least 0.3 logMAR better acuity with GAT than with ETDRS, whereas none scored an ETDRS acuity that was 0.3 logMAR better than with GAT. The range of the ETDRS measures was affected by floor effects in all three subject groups, but no floor or ceiling effects were noted with the GAT. The ranges of acuity measured by the ETDRS charts and GAT were comparable across the two tests for the RP group, whereas the ranges obtained by the GAT were slightly narrower for the AMD group and slightly wider for the OR group when compared to the ETDRS acuities.
TABLE 4. COMPARISON OF MEAN ETDRS AND GAT VISUAL ACUITIES FOR AMD, RP, AND OR GROUPS ETDRS Mean VA (LogMAR) Mean VA (Snellen) VA range (logMAR) AMD 1.40 20/500 1.04 – 1.90 RP 1.16 ~20/290 0.32 – 2.00 OR 1.37 ~20/470 0.98 – 2.00 GAT AMD 0.89 ~20/155 0.60 – 1.13 RP 1.10 20/250 0.40 – 2.20 OR 0.98 ~20/190 0.40 – 1.63 AMD, age-related macular degeneration; ETDRS, Early Treatment Diabetic Retinopathy Study; GAT, grating acuity test; OR, other retinal; RP, retinitis pigmentosa; VA, visual acuity.
Figure 35 shows the relationship for all groups between the mean GAT and ETDRS chart acuities obtained at each visit. The mutual regression slope of 1 for all eyes indicates that ETDRS and GAT scaled very similarly. There was a slight offset of the regression line, since all AMD, most OR, and some RP eyes tended to have a better acuity level when measured with the GAT. The results of the GAT and ETDRS visual acuity tests were also well correlated linearly (r=0.79) across all eyes. Some differences existed by subject group: the OR eyes tended to achieve a better acuity level with the GAT than with ETDRS charts when compared to RP eyes, which tended to score similarly on both tests (m=0.92). The AMD eyes with visual acuity worse than 1.5 logMAR tended to show much better acuity with the GAT. The regression for the AMD eyes (m=1.78) was statistically significantly different from unity (P=.005), but the regressions for the eyes with RP (m=0.92) (P=.16) and OR (m=1.12) (P=.23) were not significantly different from 1. The best correlation between the two acuity tests was found for the RP and OR eyes (r=0.92 and 0.83, respectively). The correlation was good, but somewhat lower, for the AMD eyes (r=0.66).
At the vision level tested, the between-visit CI.95 did not depend on the logMAR of the visual acuity results obtained with the ETDRS or GAT: As show in Figure 36, the slope of the regression lines in the Bland-Altman scatter plots of the between-visit CI.95 as a function of mean visual acuity, although trending higher, was not statistically significantly different from zero for ETDRS (m=0.04) (P=.27) and GAT (m=0.03) (P=.53).
A 10-ALTERNATIVE FORCED CHOICE COLOR VISION TEST FOR PATIENTS WITH SEVERE VISION LOSS PV-16 Compared to CHS/CLS CCT
The mean color vision test scores comparing PV-16 to the CHS/CLS CCT for all study eyes are shown in a scatter plot in Figure 37. Although a wide distribution of color test scores was present, a correlation of 0.77 was observed, establishing a clear relationship between PV-16 and the CHS/CLS. Generally, patients who scored well or poorly on the PV-16 also scored similarly on the CHS/CLS. Note, however, that there is a cluster of midrange scores in the PV-16 test for which a wider range of CHS/CLS scores is found.
The mean PV-16 score for all patients was 315, with a CI.95 of 87. When subdivided by disease condition, the mean PV-16 score was 319 for OR, 289 for AMD, and 329 for RP. The CI.95s by disease condition were 73 for AMD, 97 for OR, and 88 for RP, with a considerable range of CI.95s between patients. The scatter plot in Figure 38 shows the relationship of the CI.95 vs the mean PV-16 results, to evaluate whether reduced color vision was associated with increased test-retest variability. When all patients are included,
Trans Am Ophthalmol Soc / 108 / 2010 146

Chow
the regression line is statistically significantly different from zero (P<.001), suggesting that patients with very poor color vision are less reliable during the PV-16 test. However, when only patients that could actually see the colors in the test (ie, those with a score less than 250) are included in the plot, there is no difference in reliability across subjects and the regression line slope is not significantly different from zero.
FIGURE 35 GAT compared to ETDRS visual acuities for all patients.
FIGURE 36 Between visit CI.95s and mean ETDRS and GAT visual acuities.
The mean CHS/CLS score for all patients was 21 with a mean CI.95 of 5.8. When grouped by disease condition, the mean
Trans Am Ophthalmol Soc / 108 / 2010 147

The Artificial Silicon Retina In Retinitis Pigmentosa Patients
CHS/CLS score was 24 for OR, 30 for AMD, and 13 for RP. The CI.95s by disease condition were 3.9 for AMD, 8.7 for OR, and 4.8 for RP. All but 5 patients’ eyes obtained a CI.95 less than 7. Compared to the findings with the PV-16 test, a scatter plot in Figure 39 of the relationship of CI.95 vs the mean CHS/CLS score for all subjects did not indicate that a reduced color test score was associated with increased test-retest variability. The regression line slope was not statistically significantly different from zero.
FIGURE 37 Scatter plot showing correlation between the CHS/CLS and PV-16 color vision tests for eyes with AMD, RP and OR. The line is the least squares mutual regression of the two measures.
FIGURE 38 Scatter plot showing the repeatability and mean PV-16 score for every study eye.
FIGURE 39 Scatter plot showing the repeatability and mean CHS/CLS score for every study eye.
Trans Am Ophthalmol Soc / 108 / 2010 148

Chow
DISCUSSION
BIOCOMPATIBILITY AND DURABILITY OF THE ASR IMPLANT IN THE RP SUBRETINAL ENVIRONMENT Histologic Examination of Retina Recovered From the ASR-Implanted and Unimplanted Eyes
In vivo, the retina over the implant in the patient was clear where the device was recovered, showing no hemorrhages, inflammation, or edema, and the macroscopic appearance of both retinas was similar. Histologically, both retinas showed the late stages of RP with massive reorganization and extreme remodeling. The retinas could be described as undergoing phase 3 remodeling as described by Marc and coworkers.80 After the loss of rod photoreceptors, and particularly cone photoreceptors, cell death and deafferentation of the neural retina occurs. The Müller cells form a seal on either side of the retina, and the inner plexiform layer begins to remodel as cells form new neurites (synapses) from all cell types. There is migration of the inner nuclear layer cells and formation of new synaptic microneuromas. Neural death of all cell layers becomes evident in the late stages of degeneration.80 In this patient, in areas over and close to the implant, the retina still contained some inner nuclear layer cells and inner plexiform structure. The appearance was not more or less organized when compared to other parts of the same retina but was more organized when compared to the retina of the opposite unimplanted eye, which showed less inner nuclear layer and less inner plexiform layer structure. This was an interesting finding of slightly better preserved retinal structure in the implanted eye compared to the unoperated eye but represents the finding of only one patient. Comparison between other similar retinal regions between the eyes showed a thicker fibrous glial cell layer on the inner side of the retina over and around the implant. In this patient, other than in the implant area, both eyes demonstrated the substantial remodeling. There were no changes unique to the implant eye that suggested a toxic effect from the ASR.
Examination of the Physical and Electrical Properties of the Explanted ASR Device Although some trenching of the pixels and undercutting of the pixel electrodes had occurred by 5 years after implantation, the ASR still showed substantial electrical performance when assessed by dry whisker probing. The mean pixel current of 12.5 nA in the explanted ASR device compared well to the preimplantation mean pixel current of 13 nA. The charge exchange capacity for the explanted device was even greater at 2.8 µC compared to 1 µC for the unimplanted ASR, demonstrating continued robust electrical function even after 5 years. At the observed silicon loss rate of 0.4 to 0.5 µm/5 years, an additional 15 years of functional electrical life could remain for the device if the silicon loss rate were to remain constant (for a total ASR functional life of ~20 years). In a patient with a long-term implant at the end of its functional life, it is anticipated that a new implant could be additionally placed. The old 2.0-mm implant would not be removed, as it occupies only a small subretinal area and does not appear to have long-term toxic effects. The latter is not surprising because the two main components of the ASR are silicon, which does not form any plant or animal compounds,81 and iridium oxide, which is a common biocompatible electrode material selected for use in implantable medical devices.82
This study showed no evidence of panretinal toxicity or signs of local rejection in response to the ASR device after 5 years of implantation. The tissue over and surrounding the device did not appear grossly different from retina in the opposite, unimplanted eye. However, an increased glial seal appeared to be present in the implantation area. It is not clear from this analysis whether more subtle changes (eg, deafferentation or new synaptic formations) have occurred. The lack of significant toxic side effects from the ASR and its good mechanical and electrical durability are significant positive properties for an implanted device designed for long-term use.
LONG-TERM ASSESSMENT OF VISUAL FUNCTION IN ASR-IMPLANTED RP PATIENTS ETDRS and CGAT Results
Although the present study sample of 6 patients is small, the consistently better long-term ETDRS and CGAT visual acuity results in the implanted eye compared to the unoperated eye in every patient suggest a positive neurotrophic benefit resulting from ASR implantation. This benefit was not derived from a phosphene effect as would be expected from a pure retinal prosthesis, but rather a neurotrophic effect consisting of a return of complex visual functions such as visual acuity (which was tested) and possibly (not tested in depth) color vision, contrast sensitivity, and sometimes enlarged visual fields. This positive benefit was supported by patient subjective impressions of better vision consisting of the return of other forms of visual function that correlated with the better mean ETDRS and CGAT scores. A most interesting visual function return in 2 patients, associated with improved contrast perception, was the improved perception that darkness at night was darker instead of being a preoperative light gray. This was a nonintuitive observation by these 2 patients that became understandable when one realized that light perception and darkness perception are both active phenomena. From clinical observation, many end-stage low vision patients remark that as vision is becoming lost, their visual environment becomes a light gray regardless of whether it is daytime or night.
The patient ETDRS scores in the implanted eye were always higher than preoperatively and also relative to the opposite eye for ~ 2 to 8 years in all patients where the ETDRS was substantially above the floor ETDRS level of 0 letters. The overall trend of both eyes, however, was of decreasing acuity (in the implanted eye, it was decreasing acuity sometimes from a large initial increase). When the lower limit for ETDRS testing was reached, CGAT testing continued to demonstrate the trend of better visual acuity in the implanted eye compared to the opposite eye in 5 of 6 patients. In the sixth patient, the substantially worse preoperative visual acuity of the implanted eye eventually became better than the unimplanted eye at ~4.5 years after surgery.
The decrease in acuity in the implanted eye from a sometimes large initial improvement may be related to a number of factors. It is known from animal studies that surgical incisions into the sclera and retina can up-regulate the expression of growth factors but this is a temporary effect, lasting only months. Perhaps the large initial improvement of ETDRS acuity in some of the patients was related to
Trans Am Ophthalmol Soc / 108 / 2010 149

The Artificial Silicon Retina In Retinitis Pigmentosa Patients
both the surgical procedure and electrical stimulation from the implant. This is consistent with our previously reported studies showing some short-term neuroprotective benefit from just sham surgery as well as from minimally active implants, that was less than from active ASR devices.71,77 The continued presence of the disease process may also not be entirely neutralized by neuroprotective effects of the implant. Interestingly, however, in patients with ETDRS scores that were generally above 0 during the follow-up period (patients 5, 6, 7, and 10), all still had higher ETDRS scores in their implanted eyes at their most recent examinations (~6 to 8 years after surgery) compared to preoperatively. In contrast, 2 patients (numbers 5 and 8) with substantial mean ETDRS scores in the unimplanted eye at the beginning of the study experienced large drops in their ETDRS means at ~6 to 8 years postoperatively.
The RP patients in this study generally had different forms of RP with the exception of patients 5 and 6, who were brothers with probable autosomal dominant RP based on RP present in the mother. Nevertheless, the neuroprotective effect of ASR implantation was generally similar in the patients, suggesting a common pathway mechanism of action. From our RCS rat studies, electrical stimulation induction of growth factor expression could be a possible mechanism for such neuroprotection.71,77,83 If so, a wider range of retinal degenerations, including patients with other forms of RP and perhaps conditions like dry AMD, may be amenable to neuroprotective effects of subretinal ASR stimulation. Larger, prospective studies powered for statistical analysis of possible ASR-provided neuroprotection in these groups should be considered.
The use of CGAT in addition to ETDRS was useful in extending the range of visual acuity testing by logMAR 0.6.
COMPARISON OF A MODIFIED CHOW GRATING ACUITY TEST AND ETDRS CHART TESTING IN LOW VISION PATIENTS
Correlation of a Modified CGAT and ETDRS Testing A computer-controlled modified CGAT or GAT that measured through a 2.2 logMAR range and was presented on a LCD screen to moderately low vision patients was found to be well correlated to the optotype-based standard ETDRS acuity test, and the two tests scaled very similarly. The reliability of the GAT between sessions was also similar to that of the ETDRS test across patients.
The good correlation between GAT and ETDRS visual acuities found in this study was similar to another study in which grating acuity, tested using Teller acuity cards with elderly nursing home residents, was well correlated with optotype acuity.84 The advantage of the computerized GAT, however, is that it is an unbiased, automated system that does not require a tester to determine seeing vs nonseeing responses or to assess preferential looking. In addition, whereas Teller acuity cards test resolution only in the vertical direction, the GAT assesses four grating orientations that provide less bias for just one specific orientation.
The results of this study are also consistent with another report, which found that Landolt-C optotype acuity was generally poorer than grating acuity as tested with board panels among patients with retinal disease.85 This previous study found that patients with greater levels of acuity loss had a larger disparity between optotype and grating acuities. Although this finding could not be confirmed across the patient groups in visual acuity range of this study, the trend among the AMD patients suggested a similar finding. A comparison between near letter acuity and Teller grating acuity among AMD patients revealed that all patients tested with visual acuity of <20/100 had better acuity with gratings than with letters,86 as in this study.
There may be several explanations for the overall better acuity with the grating tests when compared to optotype recognition tests. This effect may be a result of the larger simultaneous retinal area that is presented with the test pattern during the grating tests, which would make the test easier for those with central or multiple or patchy scotomas. A patient with a very small remaining central area of vision would not have to search as much for a grating that is the same in all locations and would not be confused by adjacent letters that might be fixated upon accidentally. The lower number of alternatives (4 grating orientations vs the 10 possible Sloan letters used in ETDRS) also improves the chance of the patient guessing correctly. In addition, letters are more complex to identify because they involve various curves and line orientations that may be similar to other letters. If only some of the curves and orientations are seen by a patient, confusion between similar letters may result. Finally, several patients reported using the edge of the grating pattern where the border meets the gray surround to identify the orientation, because it was less difficult than identifying the grating in the center of the pattern. In future studies, a filter at the edge of the aperture to blend the pattern into the background may mitigate this cue.
The valid use of the CGAT/GAT along with ETDRS to evaluate and extend the low range of visual acuity testing in the long-term ASR-implanted patients, as well as other low vision patients, is supported by this study. Along with other tests, CGAT/GAT may be useful in other clinical studies that require an extended range of low vision testing.
Some ASR-implanted patients also noted an improvement of color vision after surgery. However, similar to very low vision evaluation with standard tests, this effect was difficult to assess with available color tests, such as the pseudoisochromatic plates and the D-15, because of a floor effect. Even the most sensitive color vision test available (PV-16) was found to be not sensitive enough to differentiate color vision differences noted by the very low vision ASR-implanted patients.
A 10-ALTERNATIVE FORCED CHOICE COLOR VISION TEST FOR PATIENTS WITH SEVERE VISION LOSS Comparison of the CHS/CLS CCT to the PV-16
In Figure 37, as would be expected, the eyes with the best CHS/CLS scores also performed the best in PV-16 testing. The eyes with only a few errors for the CHS/CLS, with mean scores between 34.75 and 37.75, had a wide range of scores on the PV-16, between about 200 and 350. This indicates that the PV-16 may be more sensitive for differentiating among those with mild color vision deficits. Eyes with moderate color vision loss and mean CHS/CLS scores between 11 and 33 tended to have mean PV-16 scores of around 300, and when the CHS/CLS score dropped below 10, almost all of those eyes had PV-16 scores of around 400. This last finding suggests that although some patients with very poor color vision may still have minimal color perception abilities as identified
Trans Am Ophthalmol Soc / 108 / 2010 150
Chow
by the CHS/CLS, in these patients the PV-16 had reached its testing floor limit and was unable to differentiate further color vision differences. Supporting this conclusion, in a previous study, the Farnsworth D-15 (smaller version of the PV-16) scores of patients with moderate to severe inherited color vision deficits were compared to their ability to name colors.87 The study determined that a large number of these patients were able to correctly name colors, despite poor D-15 scores, concluding that the test was an imperfect predictor of color naming deficits. The results suggest that for eyes with a mean PV-16 score of greater than 250, the CHS/CLS CCT was better at determining the level of color vision and was useful for expanding the lower range of color testing. The CHS/CLS CCT may therefore be a good adjunct to the PV-16 for long-term monitoring of color perception abilities in patients with very poor color vision in clinical trials where color vision may change as a result of the study.
One may expect that scores of the CLS and the PV-16 tests would be highly correlated, since the saturation levels of the colors used are closer to each other than to those in the CHS. Interestingly, the correlation between the CLS and PV-16 was 0.66, which was lower than the 0.77 correlation obtained when the scores for the CHS and CLS were combined. A scatter plot of the CLS vs the PV-16 looks very similar to the distribution of the points in Figure 37; however, a larger proportion, about twice as many patients, tended to have poorer scores in the bottom 25% of the range. Therefore, in this population of poor vision patients, it is preferable to administer and score the CHS and CLS together, as this broadens the score distribution. The scatter plot in Figure 38 indicates that patients with worse PV-16 scores and more difficulty with the test were more variable in their responses. The RP and OR patients with the poorest color vision often noted that they could not see any of the colors in the PV-16 test. The patients were nevertheless instructed to complete the test using any visual cues. It is possible that these patients used brightness and luminance cues to order the discs, in addition to guess work, and therefore it is not surprising that their results would be more variable than those with an ability to detect the colors. On account of the large range of CI.95s obtained in these patients, for future clinical trials, several baseline measurements should be obtained with the PV-16 to determine each individual’s CI.95 for a more meaningful comparison to posttreatment results. The CHS/CLS results in Figure 39 did not indicate a trend toward an increased CI.95 with worse color vision, most likely since the scoring for this test takes into account only the discs that were correctly seen and/or named.
This study presents a new color vision test, the CHS/CLS CCT, which was developed to evaluate patients implanted with ASR devices who reported improvements in color vision that could not be verified by standardized color testing. The preliminary results presented here support the possibility that a reliable expansion of the lower range of color vision testing is possible when compared to the standard low vision color test, the PV-16. The ability to determine low-range color vision changes in patients responding to therapies intended to produce cone photoreceptor rescue effects would be a useful adjunct to visual acuity testing. A larger, prospective study comparing PV-16 and the CHS/CLS CCT in low vision patients would be appropriate.
CONCLUSION
The conclusions of this thesis are as follows: (1) Neurotrophic rescue effects of visual function reported in the human pilot study of RP patients implanted with ASR devices were persistent during follow-up periods of up to ~8 years, and similar neurotrophic effects were demonstrated in additionally implanted RP patients. Although the greatest improvement of visual acuity had decreased over the follow-up period in many patients, the acuity at the most recent follow-up examinations was still improved over the preoperative acuity for all patients. The mechanism of the neurotrophic effect may involve the up-regulation of growth factor expression such as Fgf2 through electrical stimulation. (2) The visual acuity and color vision capacity of ASR-implanted patients and patients with other forms of vision loss may be more reliably measured over a lower range with a modified version of the CGAT (GAT) and the CHS/CLS CCT, and these tests may be useful in future clinical studies evaluating treatments for patients with severe vision loss. (3) The ASR was tolerated in the eyes of RP patients during follow-up periods of up to ~8 years and, based on the analysis of an explanted device, could have a functional life of ~20 years. The evaluation of the subretinally implanted ASR device as a treatment for RP should be performed in a larger, prospective study, and pilot studies in other retinal degenerative conditions, such as dry AMD, should be considered.
ACKNOWLEDGMENTS Funding/Support: Funding and grant support were provided in part by Optobionics Corporation, the Atlanta VA Rehabilitation Research and Development Service, and the Foundation Fighting Blindness. Financial Disclosures: Alan Chow was an inventor in all the artificial silicon retina–related patents but owns none of them and receives no royalties from them. He is the owner of the “Optobionics” name and logo. The original Optobionics Corporation, which was a sponsor and provided funds for some of the research, ceased operations in May 2007. Alan Chow was the founder and a former employee of Optobionics Corporation. Conformity With Author Information: The study was approved by the Institutional Review Boards of Rush University Medical Center, Chicago, Illinois, Central DuPage Hospital, Winfield, Illinois, and Johns Hopkins University, Baltimore, Maryland, and followed the tenets of the Declaration of Helsinki. Other Acknowledgments: The author wishes to acknowledge Ava K. Bittner, OD, Johns Hopkins University, Wilmer Eye Institute–Lions Low Vision Center, Baltimore, Maryland, and Machelle T. Pardue, PhD, Atlanta VA Rehabilitation Research and Development Service and Department of Ophthalmology, Emory University, Atlanta, Georgia, for assistance in the study design; data collection, management, and analysis; and manuscript preparation and approval. The author also acknowledges Vincent Chow for fabrication and testing of the ASR implant; Gislin Dagnelie for contributions to the GAT and CHS/CLS CCT study; Ronald Schuchard for
Trans Am Ophthalmol Soc / 108 / 2010 151

The Artificial Silicon Retina In Retinitis Pigmentosa Patients
contributions to the CGAT testing; Peter Dumelle for contributions to the CGAT and GAT testing software; and Jacek Kotowski for contributions to the development of the GAT and CHS/CLS CCT
REFERENCES 1. Flannery JG, Farber DB, Bird AC, Bok D. Degenerative changes in a retina affected with autosomal dominant retinitis
pigmentosa. Invest Ophthalmol Vis Sci 1989;30:191-211. 2. Santos A, Humayun MS, de Juan EJ, et al. Preservation of the inner retina in retinitis pigmentosa. A morphometric analysis.
Arch Ophthalmol 1997;115:511-515. 3. Curcio CA, Medeiros NE, Millican CL. Photoreceptor loss in age-related macular degeneration. Invest Ophthalmol Vis Sci
1996;37:1236-1249. 4. Berson EL, Rosner B, Sandberg MA, et al. A randomized trial of vitamin A and vitamin E supplementation for retinitis. Arch
Ophthalmol 1993;111:761-772. 5. Acland GM, Aguirre GD, Ray J, et al. Gene therapy restores vision in a canine model of childhood blindness. Nat Genet
2001;28:92-95. 6. del Cerro M, Gash DM, Rao GN, et al. Retinal transplants into the anterior chamber of the rat eye. Neuroscience 1987;21:707-
723. 7. Armant RB, Seiler MJ. Transplanted sheets of human retina and retinal pigmented epithelium develop normally in nude rats. Exp
Eye Res 2002;75:115-125. 8. Humayun MS, Prince M, de Juan EJ, et al. Morphometric analysis of the extramacular retina from postmortem eyes with retinitis
pigmentosa. Invest Ophthalmol Vis Sci 1999;40:143-148. 9. Brindley GS. The site of electrical excitation of the human eye. J Physiol 1955;127:189-200.
10. Brindley GS. Beats produced by simultaneous stimulation of the human eye with intermittent light and intermittent or alternating electric current. J Physiol 1962;164:157-167.
11. Brindley GS. A new interaction of light and electricity in stimulating the human retina. J Physiol 1964;171:514-520. 12. Potts AM, Inoue J, Buffum D. The electrically evoked response (EER) of the visual system. Invest Ophthalmol Vis Sci
1968;7:269-278. 13. Carpenter RH. Electrical stimulation of the human eye in different adaptational states. J Physiol 1972;221:137-148. 14. Potts AM, Inoue J. The electrically evoked response (EER) of the visual system. II. Effect of adaptation and retinitis pigmentosa.
Invest Ophthalmol 1969;8:605-612. 15. Potts AM, Inoue J. The electrically evoked response of the visual system (EER). III. Further consideration to the origin of the
EER. Invest Ophthalmol 1970;9:814-819. 16. Dowling JE, Sidman RL. Inherited retinal dystrophy in the rat. J Cell Biol 1962;14:73-109. 17. Dawson WW, Radtke ND. The electrical stimulation of the retina by indwelling electrodes. Invest Ophthalmol Vis Sci
1977;16:249-252. 18. Humayun MS, de Juan E Jr, Dagnelie G, et al. Visual perception elicited by electrical stimulation of retina in blind humans. Arch
Ophthalmol 1996;114:40-46. 19. Knighton RW. An electrically evoked slow potential of the frog’s retina. I. Properties of the response. J Neurophysiol
1975;38:185-197. 20. Knighton RW. An electrically evoked slow potential of the frog’s retina. II. Identification with PII component of
electroretinogram. J Neurophysiol 1975;38:198-209. 21. Chow AY, inventor. Artificial retina device. US patent 5,016,633. May 21, 1991. 22. Chow AY, Chow VY. Subretinal electrical stimulation of the rabbit retina. Neurosci Lett 1997;225:13-16. 23. Peyman G, Chow AY, Liang C, et al. Subretinal semiconductor microphotodiode array. Ophthalmic Surg Lasers 1998;29:234-
241. 24. Chow AY, Chow VY, Packo KH, et al. The artificial silicon retina microchip for the treatment of vision loss from retinitis
pigmentosa. Arch Ophthalmol 2004;122:460-469. 25. Humayun MS, Weiland JD, Fujii GY, et al. Visual perception in a blind subject with a chronic microelectronic retinal prosthesis.
Vision Res 2003;43:2573-2581. 26. Caspi A, Dorn JD, McClure KH, et al. Feasibility study of a retinal prosthesis: spatial vision with a 16-electrode implant. Arch
Ophthalmol 2009;127:398-401. 27. Roessler G, Laube T, Brockmann C, et al. Implantation and explantation of a wireless epiretinal retina implant device:
observations during the EPIRET3 prospective clinical trial. Invest Ophthalmol Vis Sci 2009;50:3003-3008. 28. Zrenner E, Stett A, Weiss S, et al. Can subretinal microphotodiodes successfully replace degenerated photoreceptors? Vision Res
1999;39:2555-2567. 29. Chow AY, Peachey NS. The subretinal microphotodiode array retinal prosthesis [letter and comment]. Ophthalmic Res
1998;30:195-198. 30. Eckmiller R. Learning retina implants with epiretinal contacts. Ophthalmic Res 1997;29:281-289. 31. Rizzo JF, Wyatt J, Loewenstein J, et al. Perceptual efficacy of electrical stimulation of human retina with a microelectrode array
during short-term surgical trials. Invest Ophthalmol Vis Sci 2003;44:5362-5369.
Trans Am Ophthalmol Soc / 108 / 2010 152

Chow
32. Veraart C, Raftopoulos C, Mortimer JT, et al. Visual sensations produced by optic nerve stimulation using an implanted self-sizing spiral cuff electrode. Brain Res 1998;813:181-186.
33. Brelén ME, Duret F, Gérard B. Creating a meaningful visual perception in blind volunteers by optic nerve stimulation. J Neural Eng 2005;2:22-28.
34. Brindley GS, Lewin WS. The sensations produced by electrical stimulation of the visual cortex. J Physiol 1968;196:479-493. 35. Brindley G, Rushton D. Implanted stimulators of the visual cortex as visual prosthetic devices. Trans Am Acad Ophthalmol
Otolaryngol 1974;78:OP-741-OP-745. 36. Dobelle WH, Mladejovsky MG. Phosphenes produced by electrical stimulation of human occipital cortex, and their application
to the development of a prosthesis for the blind. J Physiol 1974;243:553-576. 37. Normann RA, Maynard EM, Rousche PJ, et al. A neural interface for a cortical vision prosthesis. Vision Res 1999;39:2577-2587. 38. Fernández E, Pelayo F, Romero S, et al. Development of a cortical visual neuroprosthesis for the blind: the relevance of
neuroplasticity. J Neural Eng 2005;2:1-12. 39. Chow AY, inventor. Independent photoelectric artificial retina device and method of using same. US patent 5,397,350. March
14, 1995. 40. Zrenner E, Miliczek KD, Gabel VP, et al. The development of subretinal microphotodiodes for replacement of degenerated
photoreceptors. Ophthalmic Res 1997;29:269-280. 41. Peachey NS, Chow AY. Subretinal implantation of semiconductor-based photodiodes: progress and challenges. J Rehabil Res
Dev 1999;36:371-376. 42. Chow AY, Pardue MT, Chow VY, et al. Implantation of silicon chip microphotodiode arrays into the cat subretinal space. IEEE
Trans Neural Syst Rehabil Eng 2001;9:86-95. 43. Pardue MT, Stubbs JR, Perlman JI, et al. Immunohistochemical studies of the retina following long-term implantation with
subretinal microphotodiode arrays. Exp Eye Res 2001;73:333-343. 44. Peachey NS, Chow AY, Pardue MT, et al. Response characteristics of subretinal microphotodiode-based implant mediated
cortical potentials. In: Hollyfield J, ed. Retinal Degenerative Diseases and Experimental Therapy. New York: Plenum Publishers; 1999:471-478.
45. Zrenner E, Stett A, Weiss S, et al. Can subretinal microphotodiodes successfully replace degenerated photoreceptors? Vision Res 1999;39:2555-2567.
46. Pardue MT, Ball SL, Hetling JR, et al. Visual evoked potentials to infrared stimulation in normal cats and rats. Doc Ophthalmol 2001;103:155-162.
47. Lagey CL, Roelofs JM, Janssen LW, et al. Electrical stimulation of bone growth with direct current. Clin Orthop 1986;204:303-312.
48. Kane WJ. Direct current electrical bone growth stimulation for spinal fusion. Spine 1988;13:363-365. 49. Politis MJ, Zanakis MF. Short term efficacy of applied electric fields in the repair of the damaged rodent spinal cord: behavioral
and morphological results. Neurosurgery 1988;23:582-588. 50. Leake PA, Hradek GT, Snyder RL. Chronic electrical stimulation by a cochlear implant promotes survival of spiral ganglion
neurons after neonatal deafness. J Comp Neurol 1999;412:543-562. 51. Leake PA, Hradek GT, Rebscher SJ, Snyder RL. Chronic intracochlear electrical stimulation induces selective survival of spiral
ganglion neurons in neonatally deafened cats. Hear Res 1991;54:251-271. 52. Al-Majed AA, Neumann CM, Brushart TM, Gordon T. Brief electrical stimulation promotes the speed and accuracy of motor
axonal regeneration. J Neurosci 2000;20:2602-2608. 53. Al-Majed AA, Brushart TM, Gordon T. Electrical stimulation accelerates and increases expression of BDNF and trkB mRNA in
regenerating rat femoral motoneurons. Eur J Neurosci 2000;12:4381-4390. 54. The Deep-Brain Stimulation for Parkinson’s Disease Study Group. Deep-brain stimulation of the subthalamic nucleus or the pars
interna of the globus pallidus in Parkinson’s disease. N Engl J Med 2001;345:956-963. 55. Carvalho GA, Nikkhah G. Subthalamic nucleus lesions are neuroprotective against terminal 6-OHDA-induced striatal lesions
and restore postural balancing reactions. Exp Neurol 2001;171:405-417. 56. Andrews RJ. Neuroprotection for the new millennium: matchmaking pharmacology and technology. Ann N Y Acad Sci
2001;939:114-125. 57. Goldberg JL, Espinose JS, Xu Y, Davidson N, Kovasx GT, Barres BA. Retinal ganglion cells do not extend axons by default:
promotion by neurotrophic signaling and electrical activity. Neuron 2002;33:689-702. 58. Watanabe M, Fukuda Y. Survival and axonal regeneration of retinal ganglion cells in adult cats. Prog Retin Eye Res
2002;21:529-553. 59. Morimoto T, Miyoshi T, Fujikado T, Tano Y, Fukuda Y. Electrical stimulation enhances the survival of axotomized retinal
ganglion cells in vivo. Neuroreport 2002;13:227-230. 60. Chaum E. Retinal neuroprotection by growth factors: a mechanistic perspective. J Cell Biochem 2003;88:57-75. 61. Wen R, Song Y, Cheng T, et al. Injury-induced upregulation of bFGF and CNTF mRNAs in the rat retina. J Neurosci
1995;15:7377-7385. 62. Ikeda K, Tanihara H, Tatsuno T, Noguchi H, Nakayama C. Brainderived neurotrophic factor shows a protective effect and
improves recovery of the ERG b-wave response in light damage. J Neurochem 2003;87:290-296.
Trans Am Ophthalmol Soc / 108 / 2010 153

The Artificial Silicon Retina In Retinitis Pigmentosa Patients
Trans Am Ophthalmol Soc / 108 / 2010 154
63. Faktorovich EG, Steinberg RH, Yasumura D, et al. Photoreceptor degeneration in inherited retinal dystrophy delayed by basic fibroblast growth factor. Nature 1990;347:83-86.
64. LaVail MM, Unoki K, Yasumura D, et al. Multiple growth factors, cytokines, and neurotrophins rescue photoreceptors from the damaging effects of constant light. Proc Natl Acad Sci U S A 1992;89:11249-11253.
65. Lau D, McGee LH, Zhou S, et al. Retinal degeneration is slowed in transgenic rats by AAV-mediated delivery of FGF-2. Invest Ophthalmol Vis Sci 2000;41:3622-3633.
66. Bok D, Yasumura D, Matthes MT, et al. Effects of adeno-associated virus-vectored ciliary neurotrophic factor on retinal structure and function in mice with a P216L rds/peripherin mutation. Exp Eye Res 2002;74:719-735.
67. Okoye G, Zimmer J, Sung J, et al. Increased expression of brainderived neurotrophic factor preserves retinal function and slows cell death from rhodopsin mutation or oxidative damage. J Neurosci 2003;23:4164-4172.
68. Faktorovich EG, Steinberg RH, Yasumura D, Matthes MT, LaVail MM. Basic fibroblast growth factor and local injury protect photoreceptors from light damage in the rat. J Neurosci 1992;12:3554-3567.
69. Humphrey MF, Parker C, Chu Y, Constable IJ. Transient preservation of photoreceptors on the flanks of argon laser lesions in the RCS rat. Curr Eye Res 1993;12:367-372.
70. Cao W, Li F, Steinberg RH, LaVail MM. Development of normal and injury-induced gene expression of aFGF, bFGF, CNTF, BDNF, GFAP, and IGF-I in the rat retina. Exp Eye Res 2001;72:591-604.
71. Pardue MT, Phillips MJ, Yin H, et al. Neuroprotective effect of subretinal implants in the RCS rat. Invest Ophthalmol Vis Sci 2005;46:674-682.
72. D’Cruz PM, Yasumura D, Weir J, et al. Mutation of the receptor tyrosine kinase gene Mertk in the retinal dystrophic RCS rat. Hum Mol Genet 2000;9:645-651.
73. Bok D, Hall MO. The role of the pigment epithelium in the etiology of inherited retinal dystrophy in the rat. J Cell Biol 1971;49:664-682.
74. Mullen RJ, LaVail MM. Inherited retinal dystrophy: primary defect in pigment epithelium determined with experimental rat chimeras. Science 1976;192:799-801.
75. LaVail MM, Battelle BA. Influence of eye pigmentation and light deprivation on inherited retinal dystrophy in the rat. Exp Eye Res 1975;21:167-192.
76. Chow AY, Pardue MT, Perlman JI, et al. Subretinal implantation of semiconductor-based photodiodes: durability of novel implant designs. J Rehabil Res Dev 2002;39:313-321.
77. Ciavatta VT, Kim M, Wong P, et al. Retinal expression of Fgf2 in RCS rats with subretinal microphotodiode array. Invest Ophthalmol Vis Sci 2009;50:4523-4530. Epub 2004 Mar 5.
78. Bowman KJ. A method for quantitative scoring of the Farnsworth Panel D-15. Acta Ophthalmol 1982;60:907-916. 79. Atchison DA, Bowman KJ, Vingrys AJ. Quantitative scoring methods for D15 panel tests in the diagnosis of congenital color
vision deficiencies. Optom Vis Sci 1991;68:41-48. 80. Marc RE, Jones BW, Watt CB, et al. Neural remodeling in retinal degeneration. Prog Retin Eye Res 2003;22:607-655. 81. Brady GS. Silicon. In: Brady GS, ed. Materials Handbook. 13th ed. New York: McGraw-Hill, Inc; 1991:739-741. 82. Rizzo JF, Wyatt J, Loewenstein J, et al. Methods and perceptual thresholds for short-term electrical stimulation of human retina
with microelectrode arrays. Invest Ophthalmol Vis Sci 2003;44:5355-5361. 83. Pardue MT, Phillips MJ, Hanzlicek B, et al. Neuroprotection of photoreceptors in the RCS rat after implantation of a subretinal
implant in the superior or inferior retina. Adv Exp Med Biol 2006;572:321-326. 84. Friedman DS, Munoz B, Massof RW, et al. Grating visual acuity using the preferential-looking method in elderly nursing home
residents. Invest Ophthalmol Vis Sci 2002;43:2572-2578. 85. Stiers P, Vanderkelen R, Vandenbussche E. Optotype and grating visual acuity in patients with ocular and cerebral visual
impairment. Invest Ophthalmol Vis Sci 2004;45:4333-4339. 86. Thayaparan K, Crossland MD, Rubin GS. Clinical assessment of two novel contrast sensitivity charts. Br J Ophthalmol
2007;91:749-752. 87. Cole BL, Orenstein JM. Does the Farnsworth D15 test predict the ability to name colours? Clin Exp Optom 2003;86:221-229.