Processing of Satellite Image Using Digital Image Processing
Upload
raphael-levyCategory
view
5.503download
6
White circle: Same particle as identified in Fig. 4 of “Response to “Stripy Nanoparticles Revisited””, Yu and Stellacci (Small 2012) and argued to provide evidence of stripe formation. Two separate scans of the same particle are shown. Only the scan on the right was included in Yu and Stellacci’s response.
I have selected the same sample area as used in Fig. 4 of Yu and Stellacci. These are 70 x 70 pixel ‘zooms’ which have been interpolated up to 256 x 256 pixels. A very similar type of interpolation has apparently been carried out for Fig. 4 of Yu and Stellacci. This acts in a similar manner to a low pass filter, building in spurious spatial correlations.
In any case, it is absolutely clear from the images above that the “stripes” seen in the STM data are nothing more than an artefact – in essence, filtered noise. What is perhaps more worrying is that the image on the right was selected to provide ‘evidence’ for the stripes while the image on the left, which shows no stripes, was selectively ignored in the Yu and Stellacci response to the “Stripy Nanoparticles Revisited” paper.

This is the uninterpolated (i.e. ~ 70 x 70 pixel) image from which the interpolated image on the right hand side of the previous slide was derived by Yu and Stellacci.
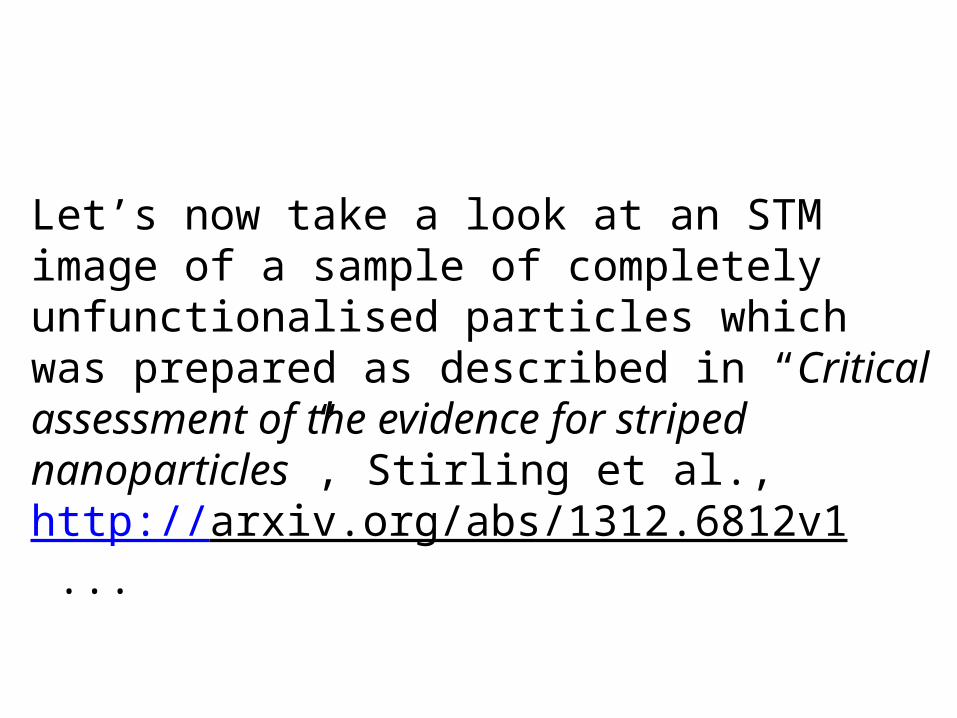
Let’s now take a look at an STM image of a sample of completely unfunctionalised particles which was prepared as described in “Critical assessment of the evidence for striped nanoparticles”, Stirling et al., http://arxiv.org/abs/1312.6812v1 ...

Large scale image.
Let’s zoom in on thatarea shown in the top right corner….

Here’s a contrast-saturatedbut uninterpolated zoom of that area ofentirely ligand-free nanoparticles .
Note pixellation of particles and the statistical “alignment” of pixels.
Compare with uninterpolated image from Yu and Stellacci(Small, 2012), shown on Slide #2
Let’s zoom in on that bottom left corner…
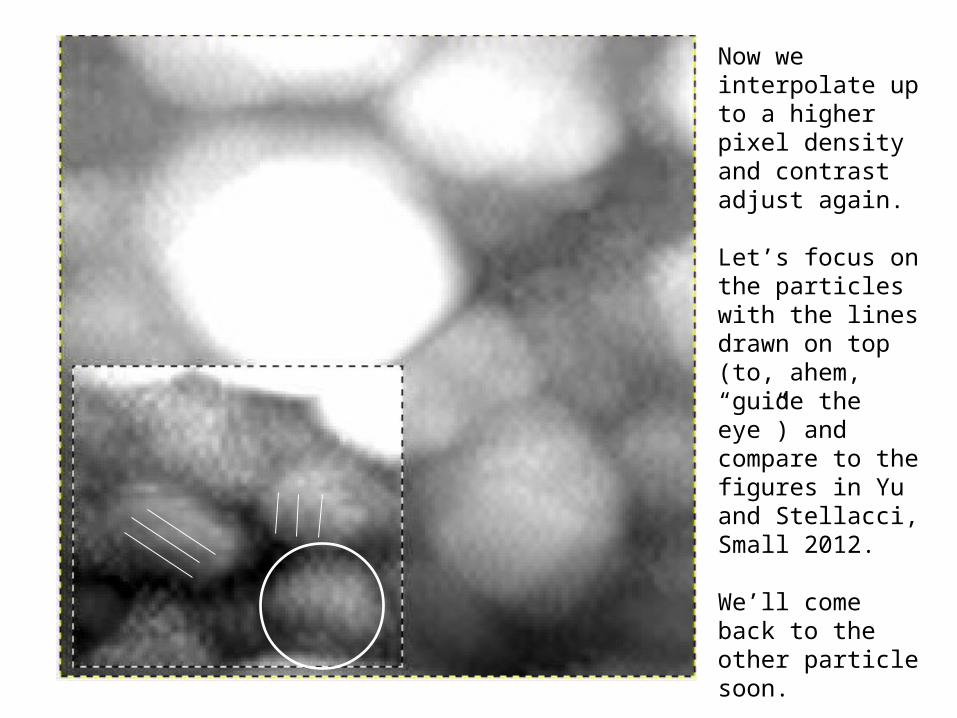
Now we interpolate up to a higher pixel density and contrast adjust again.
Let’s focus on the particles with the lines drawn on top (to, ahem, “guide the eye”) and compare to the figures in Yu and Stellacci, Small 2012.
We’ll come back to the other particle soon.

Direct comparison of highly interpolated images of unfunctionalised nanoparticles with images purportedly showing stripes from Yu and Stellacci, Small 2012.
The ‘stripes’ are nothing more than interpolated noise. As few as three pixels in the raw data have been interpreted as “stripes” by Yu and Stellacci.

Another comparison of our image of unfunctionalised particles with the ‘striped’ particles of Stellacci et al…
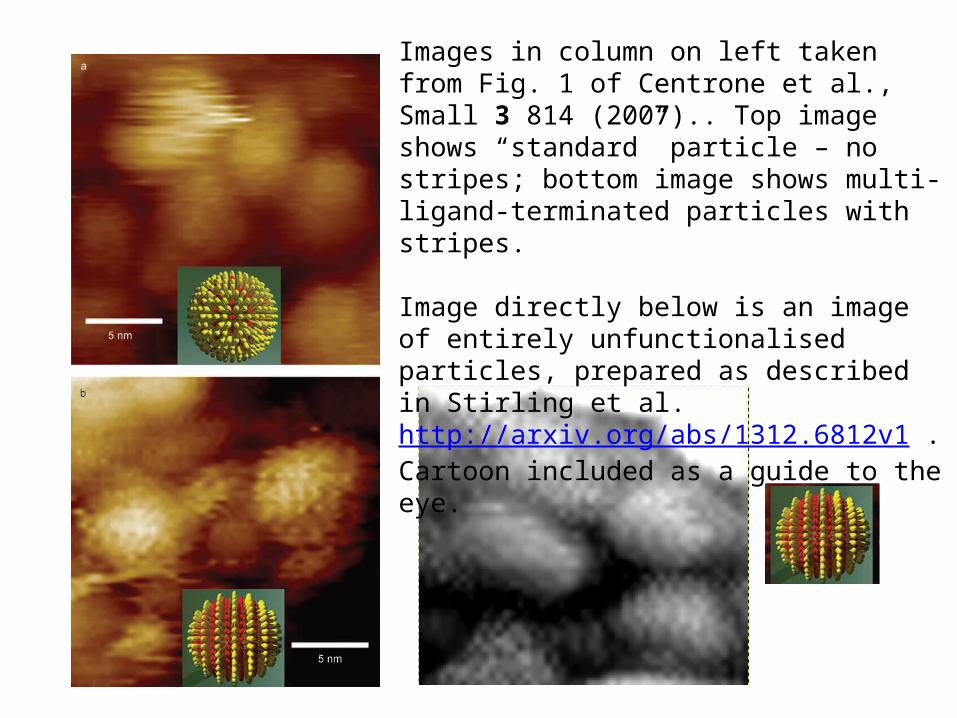
Images in column on left taken from Fig. 1 of Centrone et al., Small 3 814 (2007).. Top image shows “standard” particle – no stripes; bottom image shows multi-ligand-terminated particles with stripes.
Image directly below is an image of entirely unfunctionalised particles, prepared as described in Stirling et al. http://arxiv.org/abs/1312.6812v1 . Cartoon included as a guide to the eye.

…just one more comparison...

Image on the left above is a zoom of the unfunctionalised particle which is circled on Slide # 6.
Image on the right is a crop from Fig. 6(d) of Jackson et al., Nature Materials 3 330 (2004). The full image from Jackson et al. is shown to the right.