The Art of Economic Forecasting & the US ...
45
The Art of Economic Forecasting & the US Economic Forecasting & the US Economic Outlook Jeffrey C. Cleveland Senior Economist Payden & Rygel Investment Counsel Michael J. Budzik, CPA, CTP Directory of Treasury Directory of Treasury Zebra Technologies Corporation
Transcript of The Art of Economic Forecasting & the US ...
The Art of Economic Forecasting & the US EconomicForecasting & the US Economic
OutlookJeffrey C. Clevelandy
Senior EconomistPayden & Rygel Investment Counsel
Michael J. Budzik, CPA, CTPDirectory of TreasuryDirectory of Treasury
Zebra Technologies Corporation

The Art of Economic ForecastingThe Art of Economic Forecasting
The Problem: The Plight of the Fortune TellersI
II Types of Forecasting
Our Model: The NarrativeIII
The Output: GDP, Employment, Inflation, Interest Rates
IV
2

I The Problem: TheI The Problem: The Plight of the Fortune Tellers
3
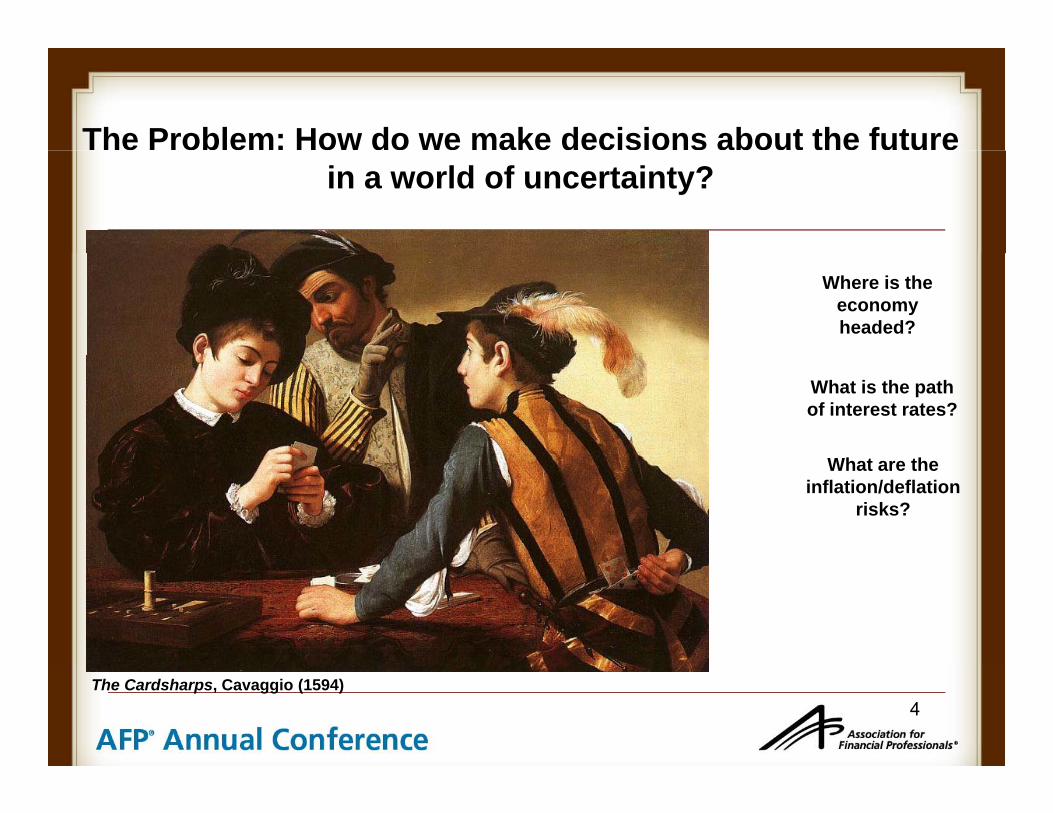
The Problem: How do we make decisions about the future in a world of uncertainty?
Where is the economy headed?
What is the path of interest rates?
Wh t thWhat are the inflation/deflation
risks?
4The Cardsharps, Cavaggio (1594)
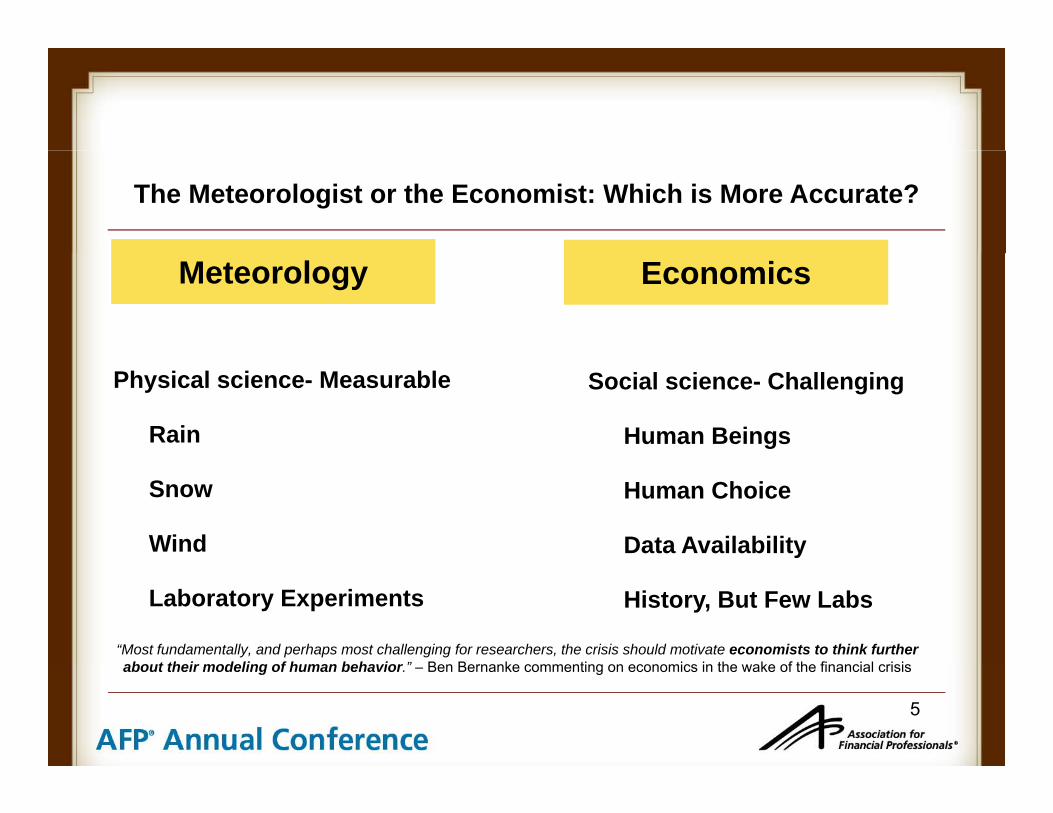
The Meteorologist or the Economist: Which is More Accurate?
Meteorology Economics
Physical science- Measurable
Rain
Social science- Challenging
Human Beings
Snow
Wind
Human Choice
Data Availability
Laboratory Experiments History, But Few Labs
“Most fundamentally, and perhaps most challenging for researchers, the crisis should motivate economists to think further b t th i d li f h b h i ” B B k ti i i th k f th fi i l i i
5
about their modeling of human behavior.” – Ben Bernanke commenting on economics in the wake of the financial crisis
II Types of ForecastsII Types of Forecasts
6

Types of ForecastsForecast Type Example
“Theory-free” forecasts
Leading Indicators
“Human behavior is simply too complex and nuanced to be fully represented
th ti ll t l tMathematical “models” of the economy
The Fed Model mathematically, at least with the maths known to modern man. Maths can help us to gain insight into
i b t itMarket-based models
The Yield Curve
“Th M t l M d l” C bi
economic processes, but it is not the only way to gain such insight, nor even the most productive.” -- DeLisleW ll G f th“The Mental Model” Combines
narrative + economic
indicators + market-based
Worrell, Governor of the Central Bank of Barbados
7indicators
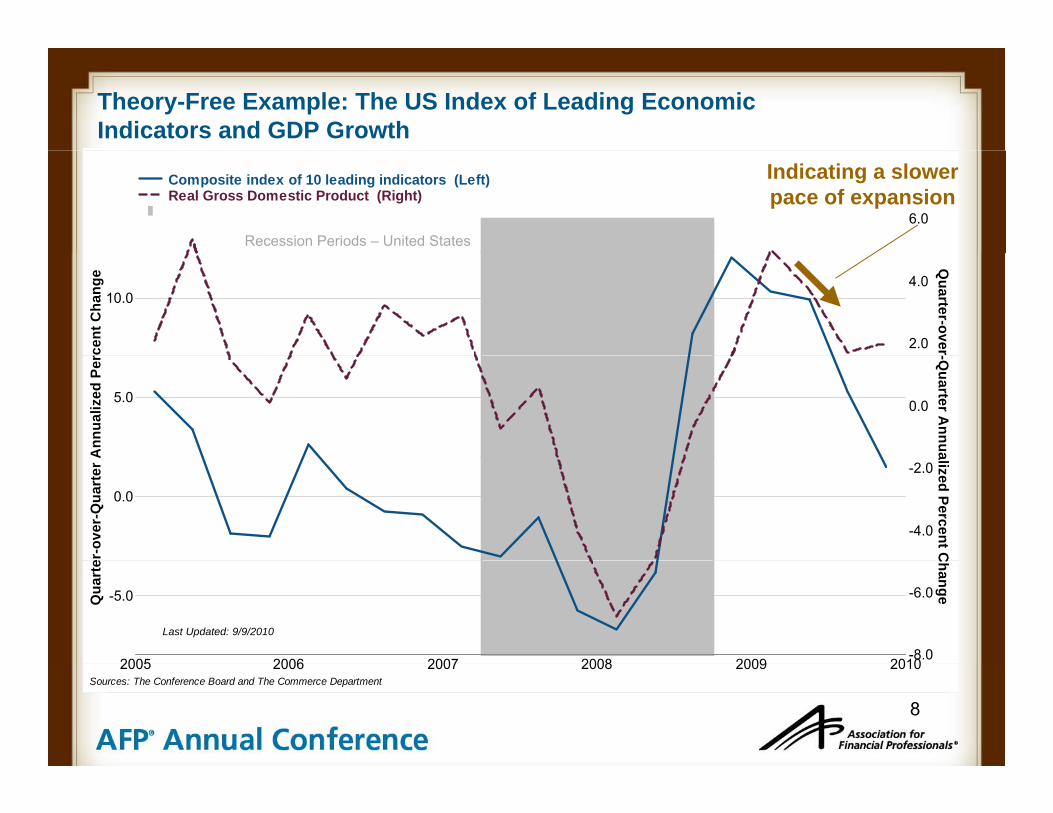
Theory-Free Example: The US Index of Leading Economic Indicators and GDP Growth
6.0
Composite index of 10 leading indicators (Left)Real Gross Domestic Product (Right)
Recession Periods – United States
Indicating a slowerpace of expansion
10.0
rcen
t Cha
nge
2.0
4.0
Quarter-over
5.0
Ann
ualiz
ed P
er
0.0
-Quarter A
nnua
0.0
er-o
ver-
Qua
rter
A
-4.0
-2.0
alized Percent C
2005 2006 2007 2008 2009 2010
-5.0Qua
rte
-8.0
-6.0
Change
Last Updated: 9/9/2010
8
2005 2006 2007 2008 2009 2010Sources: The Conference Board and The Commerce Department
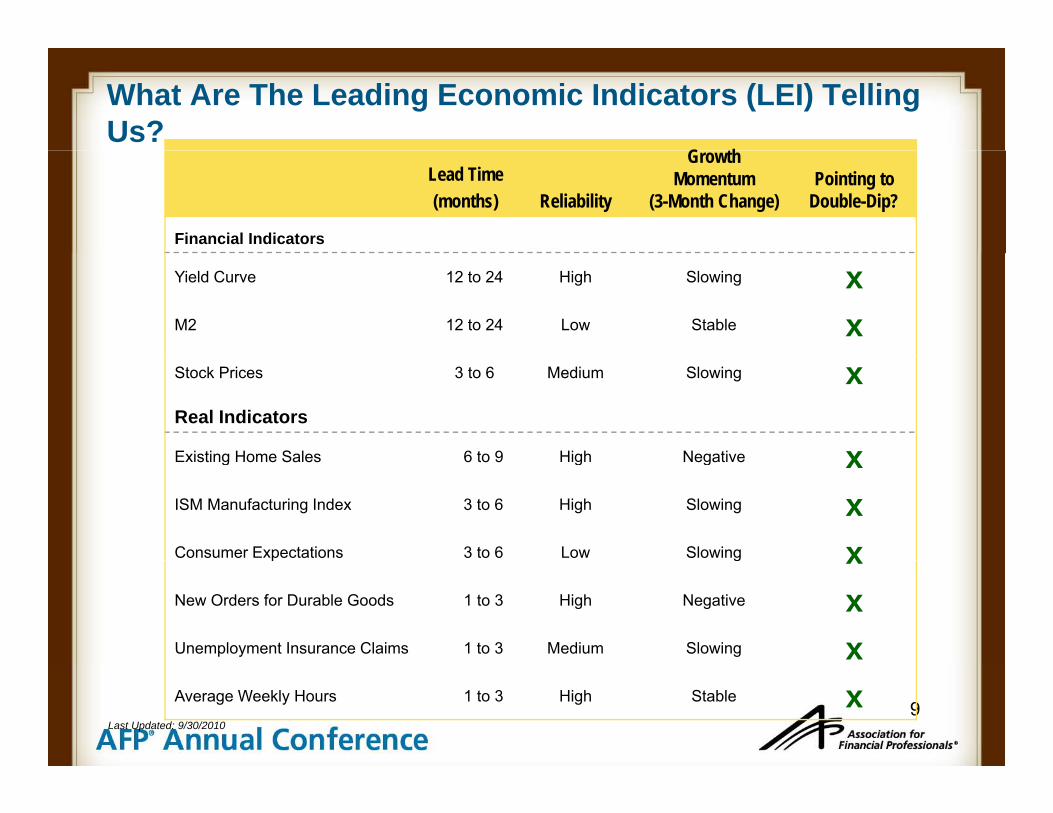
What Are The Leading Economic Indicators (LEI) Telling Us?
G th Lead Time(months) Reliability
Growth Momentum
(3-Month Change)Pointing to
Double-Dip?
Financial Indicators
Yield Curve 12 to 24 High Slowing xM2 12 to 24 Low Stable xStock Prices 3 to 6 Medium Slowing xReal Indicators
Existing Home Sales 6 to 9 High Negative xExisting Home Sales 6 to 9 High Negative xISM Manufacturing Index 3 to 6 High Slowing xConsumer Expectations 3 to 6 Low Slowing xp g xNew Orders for Durable Goods 1 to 3 High Negative xUnemployment Insurance Claims 1 to 3 Medium Slowing x
9Average Weekly Hours 1 to 3 High Stable x
Last Updated: 9/30/2010
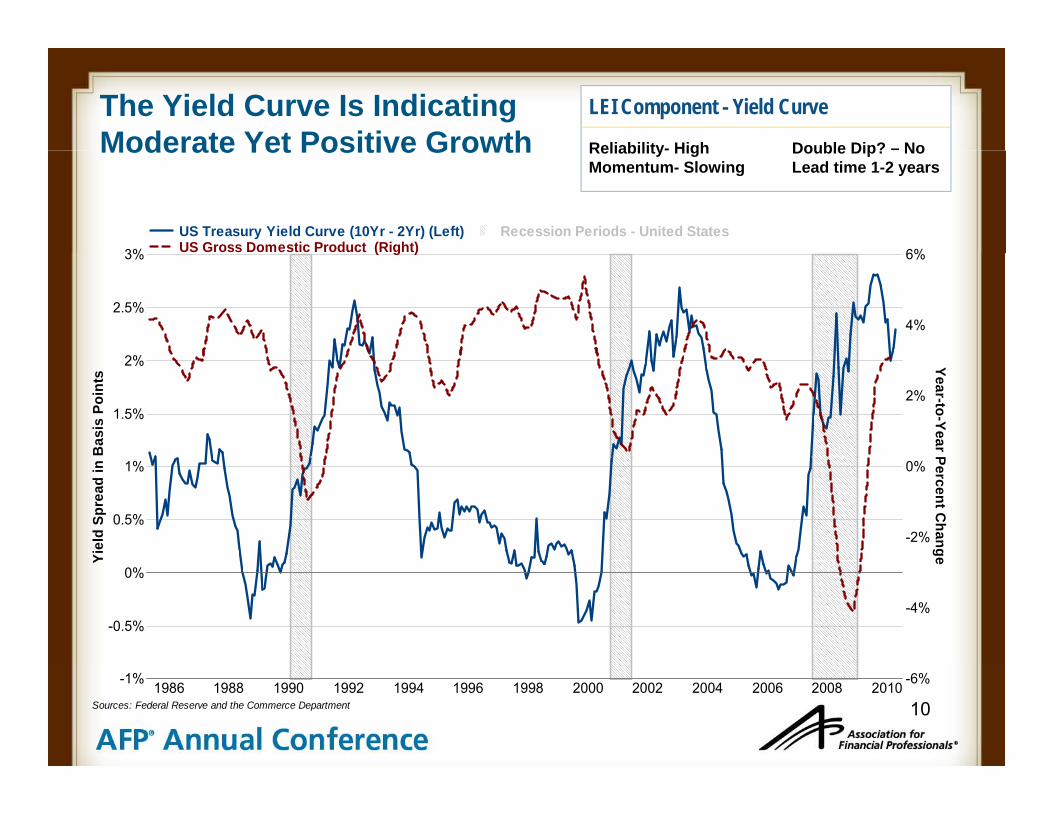
The Yield Curve Is Indicating Moderate Yet Positive Growth
LEI Component - Yield Curve
Reliability- High Double Dip? – NoModerate Yet Positive Growth
3% 6%US Treasury Yield Curve (10Yr - 2Yr) (Left)US Gross Domestic Product (Right)
Recession Periods - United States
Reliability- High Double Dip? NoMomentum- Slowing Lead time 1-2 years
2%
2.5%
3%
4%
6%( g )
1.5%
2%
Bas
is P
oint
s
2%
Year-to-Year P
0.5%
1%
Yiel
d Sp
read
in
-2%
0%
Percent Change
-0.5%
0%
Y
-4%
e
101986 1988 1990 1992 1994 1996 1998 2000 2002 2004 2006 2008 2010-1% -6%
Sources: Federal Reserve and the Commerce Department
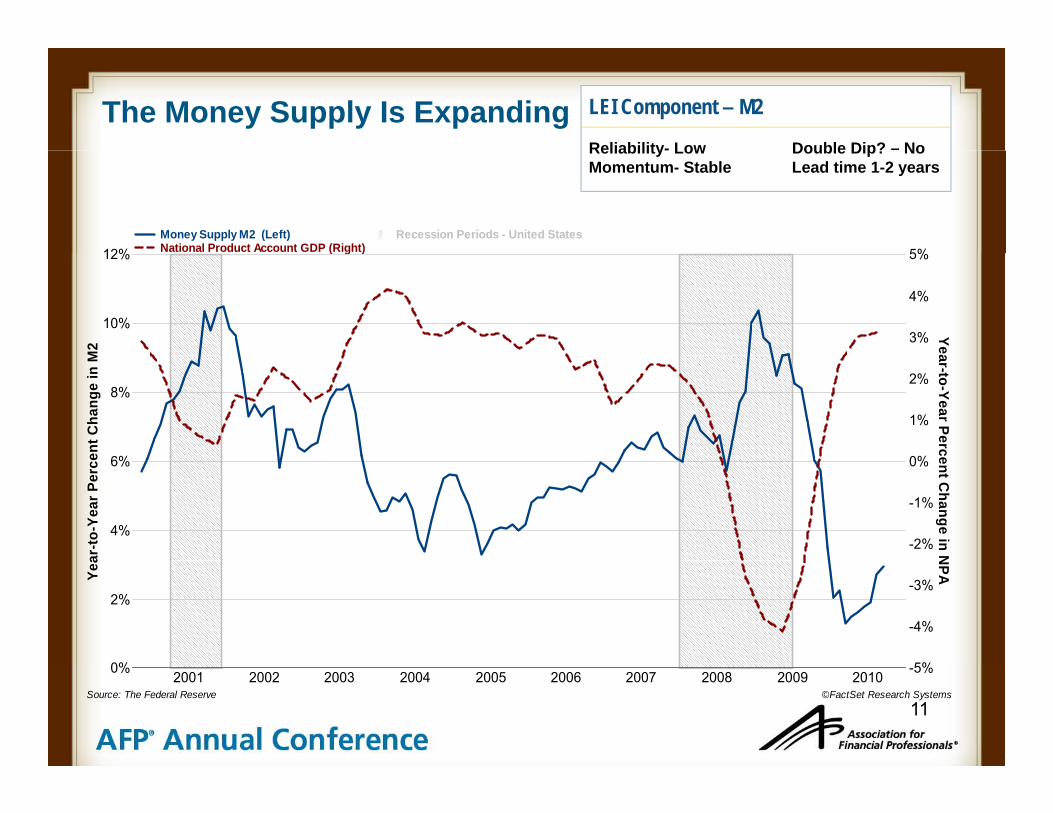
The Money Supply Is Expanding LEI Component – M2
Reliability- Low Double Dip? – No
12% 5%Money Supply M2 (Left)National Product Account GDP (Right)
Recession Periods - United States
Reliability- Low Double Dip? NoMomentum- Stable Lead time 1-2 years
10%
12%
M2 3%
4%
5%
Yea
( g )
6%
8%
ent C
hang
e in
M
0%
1%
2%
ar-to-Year Perce
4%
6%
ar-to
-Yea
r Per
ce
-2%
-1%
0% ent Change in N
0%
2%
Yea
5%
-4%
-3%
NPA
11
2001 2002 2003 2004 2005 2006 2007 2008 2009 20100% -5%
©FactSet Research SystemsSource: The Federal Reserve
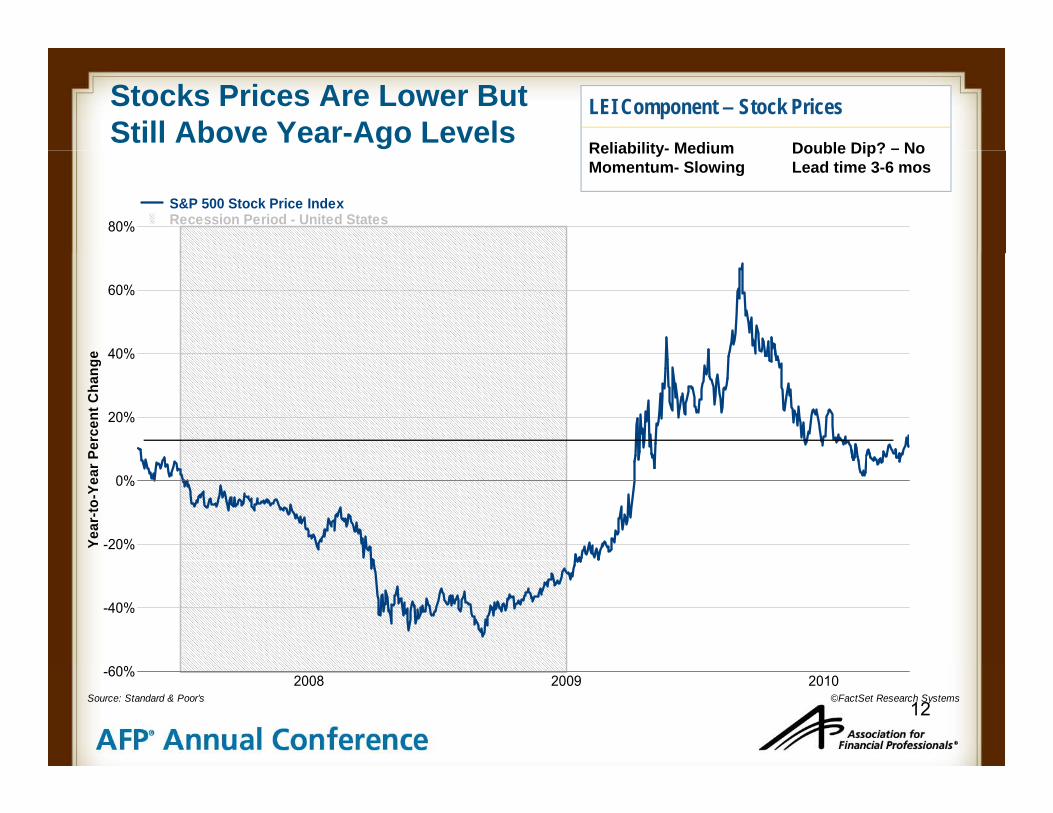
Stocks Prices Are Lower But Still Above Year-Ago Levels
LEI Component – Stock Prices
Reliability- Medium Double Dip? – No
80%S&P 500 Stock Price Index Recession Period - United States
Reliability- Medium Double Dip? NoMomentum- Slowing Lead time 3-6 mos
40%
60%
e
20%
40%
Perc
ent C
hang
e
-20%
0%
Year
-to-Y
ear P
-40%
122008 2009 2010-60%
©FactSet Research SystemsSource: Standard & Poor's

Post Tax-Credit, Home Sales Suffer
LEI Component – Home Sales
Reliability- High Double Dip? –
30% 5%US Existing-Home Sales (Left)US Real Gross Domestic Product (Right)
Recession Periods - United States
Reliability- High Double Dip? MaybeMomentum- Negative Lead time 6-9 mos
20%
30%
es
3%
4%
5%( g )
Impact of theFederal Home
buyer Tax Credit
10%
ge in
Hom
e Sa
le
1%
2%
Year-to-Year C
-10%
0%
r-to
-Yea
r Cha
ng
-2%
-1%
0%
Change in G
DP
-20%
Yea
-4%
-3%
132001 2002 2003 2004 2005 2006 2007 2008 2009 2010
-30% -5%
Sources: National Association of Realtors and Commerce Department
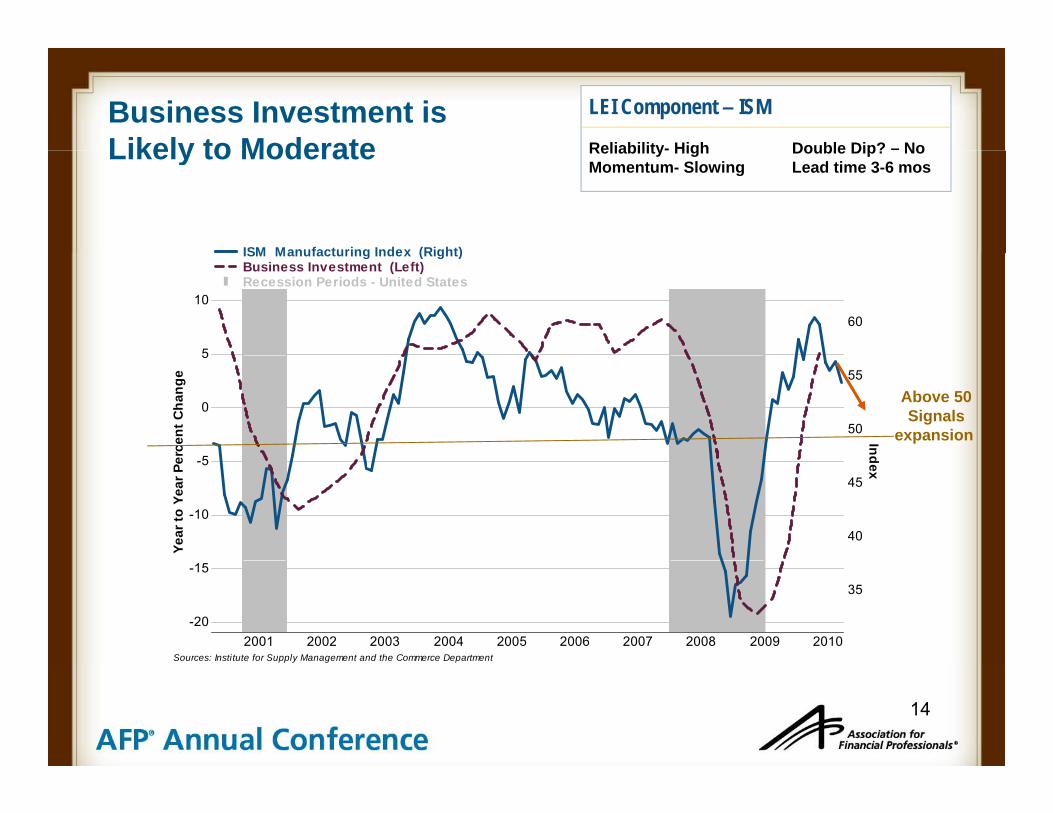
Business Investment is Likely to Moderate
LEI Component – ISM
Reliability- High Double Dip? – NoLikely to Moderate
ISM Manufacturing Index (Right)
Reliability- High Double Dip? NoMomentum- Slowing Lead time 3-6 mos
5
1060
ISM Manufacturing Index (Right)Business Investment (Left)Recession Periods - United States
5
0
5
erce
nt C
hang
e
50
55
Ind
Above 50Signals
expansion
-10
-5
Year
to Y
ear P
e
40
45
dex
2001 2002 2003 2004 2005 2006 2007 2008 2009 2010-20
-1535
Sources: Institute for Supply Management and the Commerce Department
14
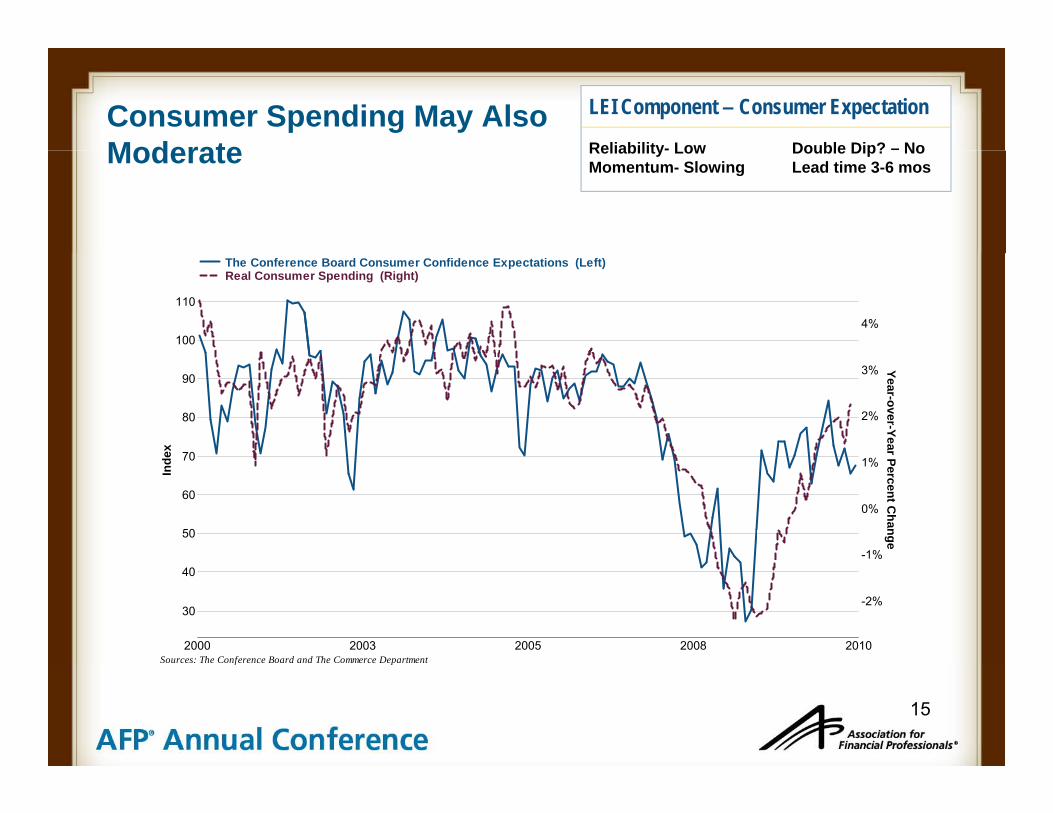
Consumer Spending May AlsoModerate
LEI Component – Consumer Expectation
Reliability- Low Double Dip? – NoModerate Reliability- Low Double Dip? NoMomentum- Slowing Lead time 3-6 mos
100
110
4%
The Conference Board Consumer Confidence Expectations (Left)Real Consumer Spending (Right)
70
80
90
ex
1%
2%
3% Year-over-Year
50
60
70
Ind
-1%
0%
1%
Percent Change
2000 2003 2005 2008 2010
30
40
-2%
Sources: The Conference Board and The Commerce Department
15
f p
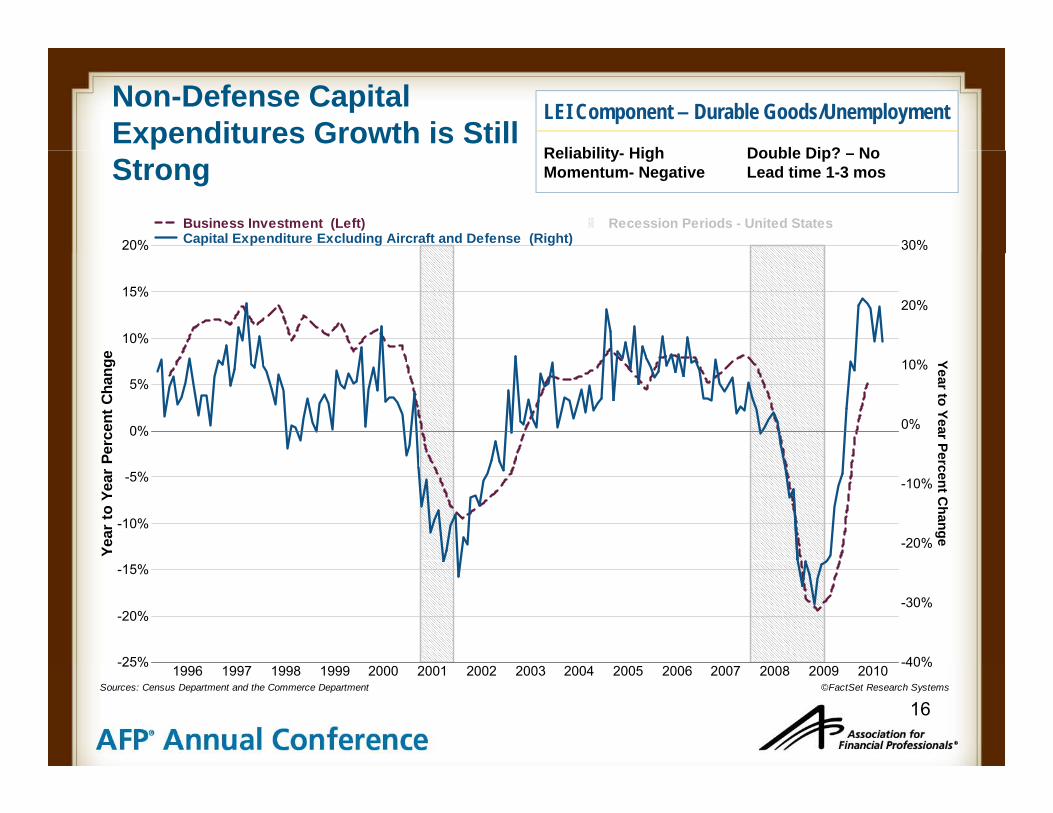
Non-Defense Capital Expenditures Growth is Still
LEI Component – Durable Goods/Unemployment
Reliability High Double Dip? No
20% 30%Business Investment (Left)Capital Expenditure Excluding Aircraft and Defense (Right)
Recession Periods - United States
StrongReliability- High Double Dip? – NoMomentum- Negative Lead time 1-3 mos
10%
15%
e
20%
0%
5%
Perc
ent C
hang
e
0%
10%
Year to Year Pe
-10%
-5%
Year
to Y
ear
P
-20%
-10%
ercent Change
-25%
-20%
-15%
-40%
-30%
16
1996 1997 1998 1999 2000 2001 2002 2003 2004 2005 2006 2007 2008 2009 2010-25% -40%
©FactSet Research SystemsSources: Census Department and the Commerce Department

Average Workweek and Jobless Claims Stabilizing
LEI Component
Reliability- High Double Dip? – No
39 650
Initial Claims for Unemployment Insurance (Right)Average Workweek (Left)
Recession Periods - United States
Claims Stabilizing Reliability- High Double Dip? NoMomentum- Stable Lead time 1-3 mos
39
39.5
Hou
rs)
550
600
650
W
g ( )
40
40 5ng W
orkw
eek
(H
450
500
550
Weekly U
nemp
40.5
41
e M
anuf
actu
rin
350
400
450
ployment C
laim
41.5
42
Ave
rage
250
300
350
ms
17
2000 2001 2002 2004 2005 2006 2007 2008 2009 201042 250

Example: Mathematical Models of the Economy
Th EAbstracting Further…
The Economy
Standard Regression Model:
Y = α + β1x1 + β2x2 + β3x3 + εβ1 1 β2 2 β3 3
ExampleIS (Investment-Savings) Equation of a National Economyof a National Economy
Y = C(Y-T(Y)) + I(i) + G + NX(Y)
18
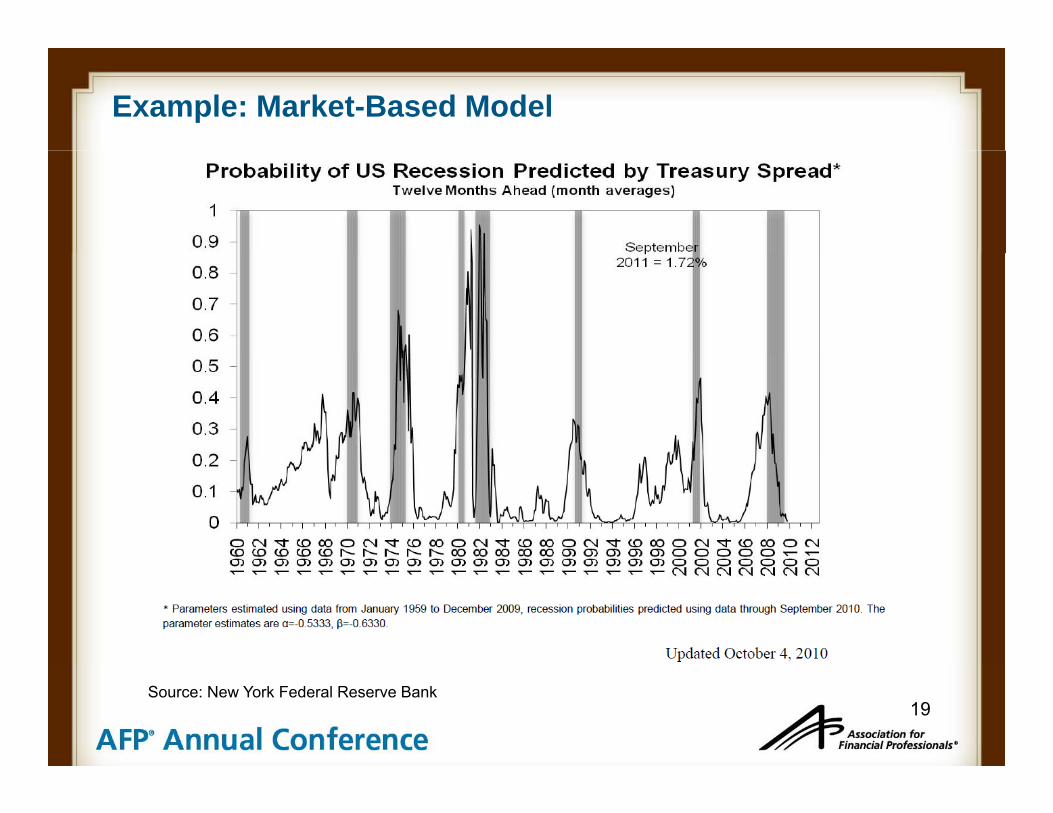
Example: Market-Based Model
19Source: New York Federal Reserve Bank
III Our Model: TheIII Our Model: The Narrative
20
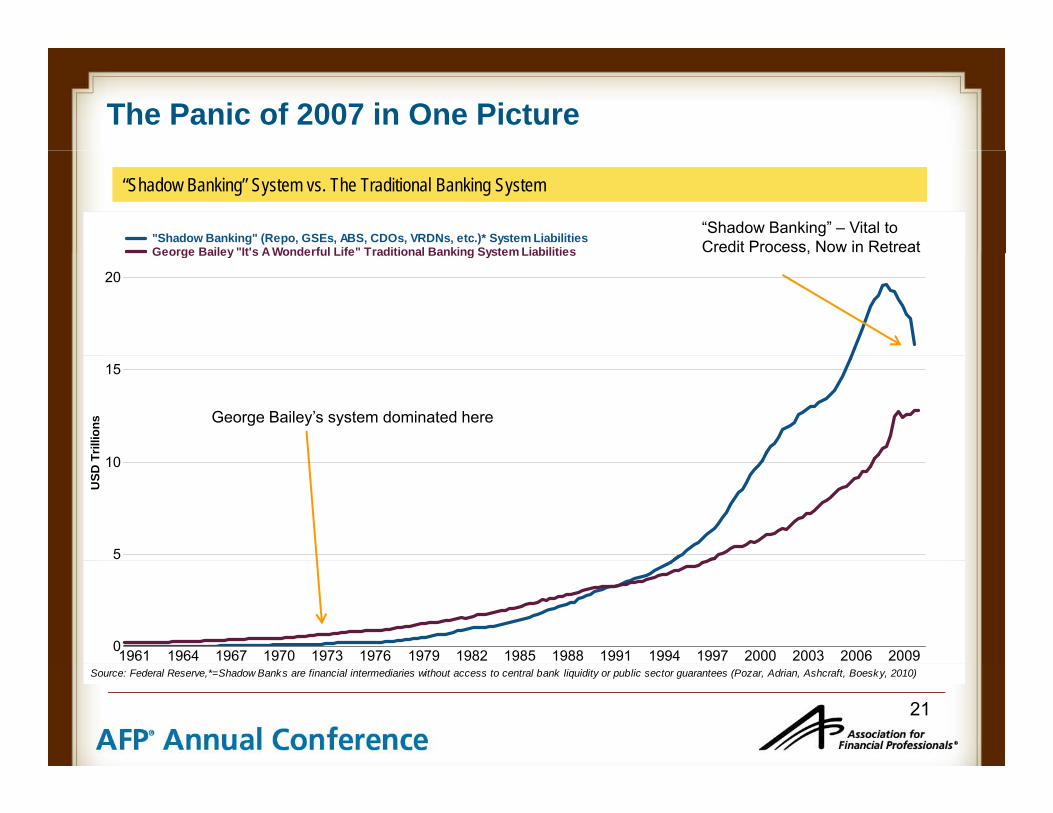
The Panic of 2007 in One Picture
"Shadow Banking" (Repo, GSEs, ABS, CDOs, VRDNs, etc.)* System LiabilitiesGeorge Bailey "It's A Wonderful Life" Traditional Banking System Liabilities
“Shadow Banking” System vs. The Traditional Banking System
“Shadow Banking” – Vital to Credit Process, Now in Retreat
20
George Bailey It s A Wonderful Life Traditional Banking System Liabilities ,
10
15
Trill
ions George Bailey’s system dominated here
5
10
USD
T
1961 1964 1967 1970 1973 1976 1979 1982 1985 1988 1991 1994 1997 2000 2003 2006 20090
21
Source: Federal Reserve,*=Shadow Banks are financial intermediaries without access to central bank liquidity or public sector guarantees (Pozar, Adrian, Ashcraft, Boesky, 2010)
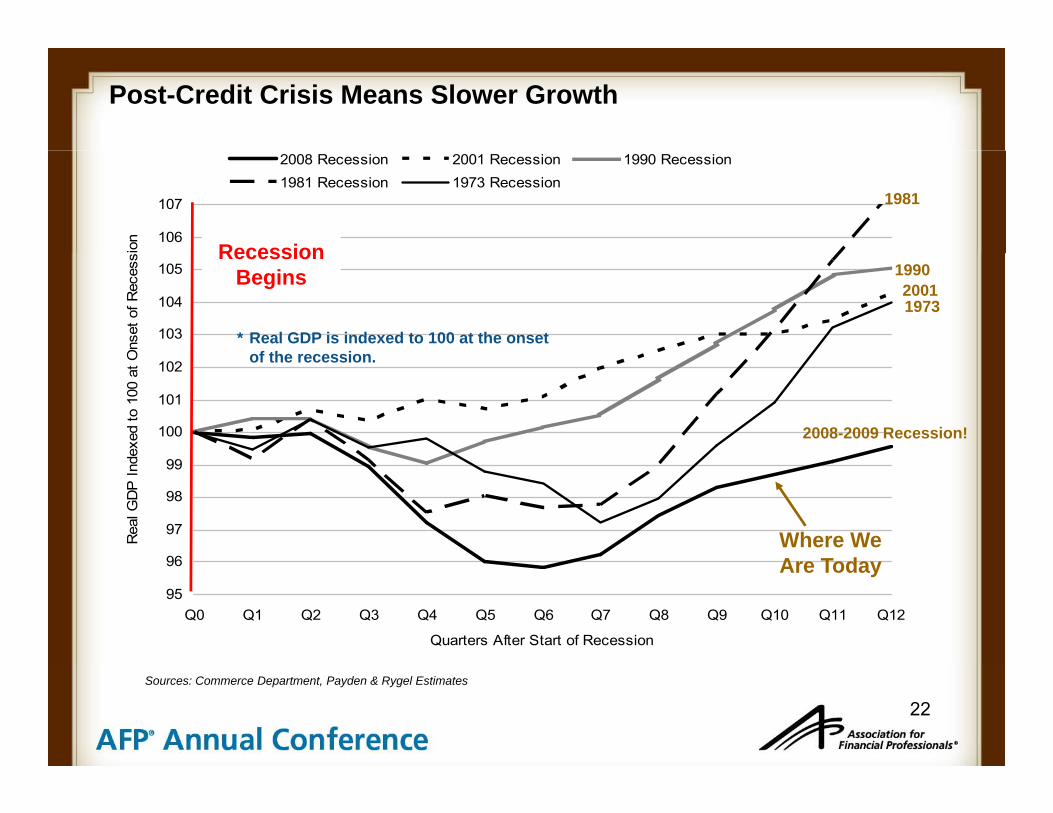
Post-Credit Crisis Means Slower Growth
106
107
ion
2008 Recession 2001 Recession 1990 Recession1981 Recession 1973 Recession
Recession
1981
103
104
105
Ons
et o
f Rec
ess Recession
Begins
* Real GDP is indexed to 100 at the onset of the recession
1973
19902001
100
101
102
dexe
d to
100
at O
2008-2009 Recession!
of the recession.
96
97
98
99
Rea
l GD
P In
d
Where We A T d
95
96
Q0 Q1 Q2 Q3 Q4 Q5 Q6 Q7 Q8 Q9 Q10 Q11 Q12
Quarters After Start of Recession
Are Today
22Sources: Commerce Department, Payden & Rygel Estimates
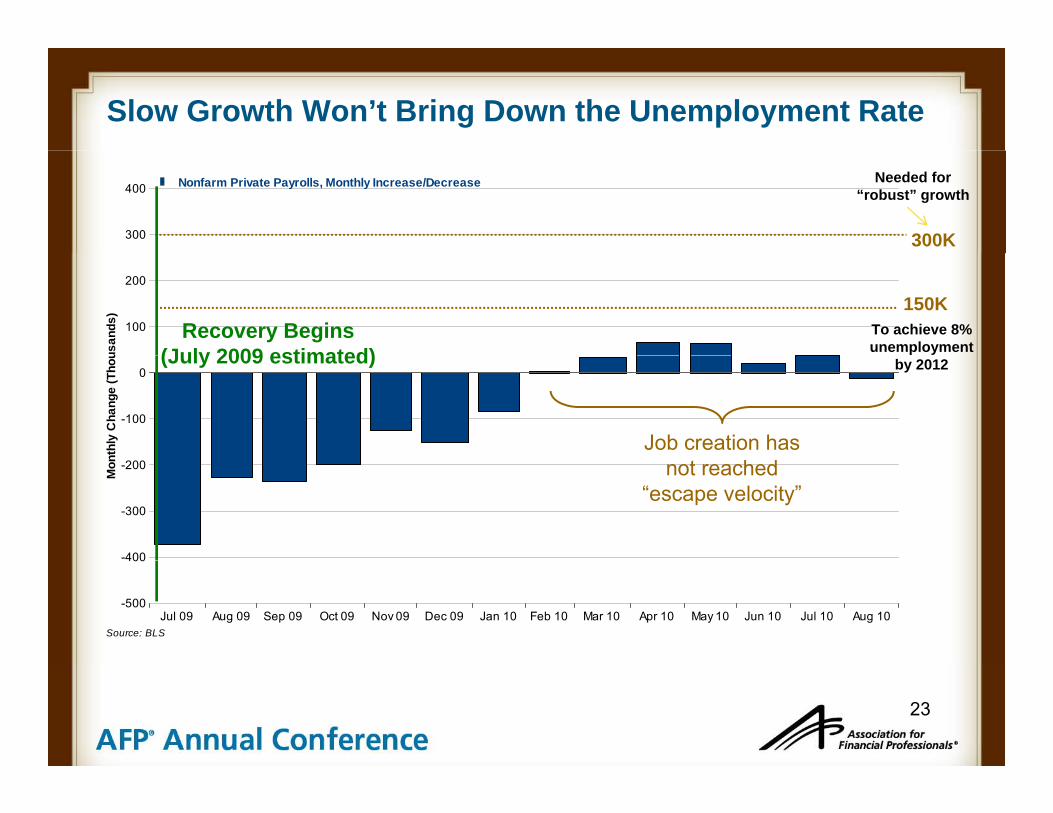
Slow Growth Won’t Bring Down the Unemployment Rate
300
400 Nonfarm Private Payrolls, Monthly Increase/Decrease
300K
Needed for “robust” growth
100
200
usan
ds) 150K
Recovery Begins (July 2009 estimated)
To achieve 8% unemployment
-100
0
nthl
y C
hang
e (T
hou (July 2009 estimated)
Job creation has
by 2012
-400
-300
-200
Mon not reached
“escape velocity”
Jul 09 Aug 09 Sep 09 Oct 09 Nov 09 Dec 09 Jan 10 Feb 10 Mar 10 Apr 10 May 10 Jun 10 Jul 10 Aug 10-500
400
Source: BLS
23
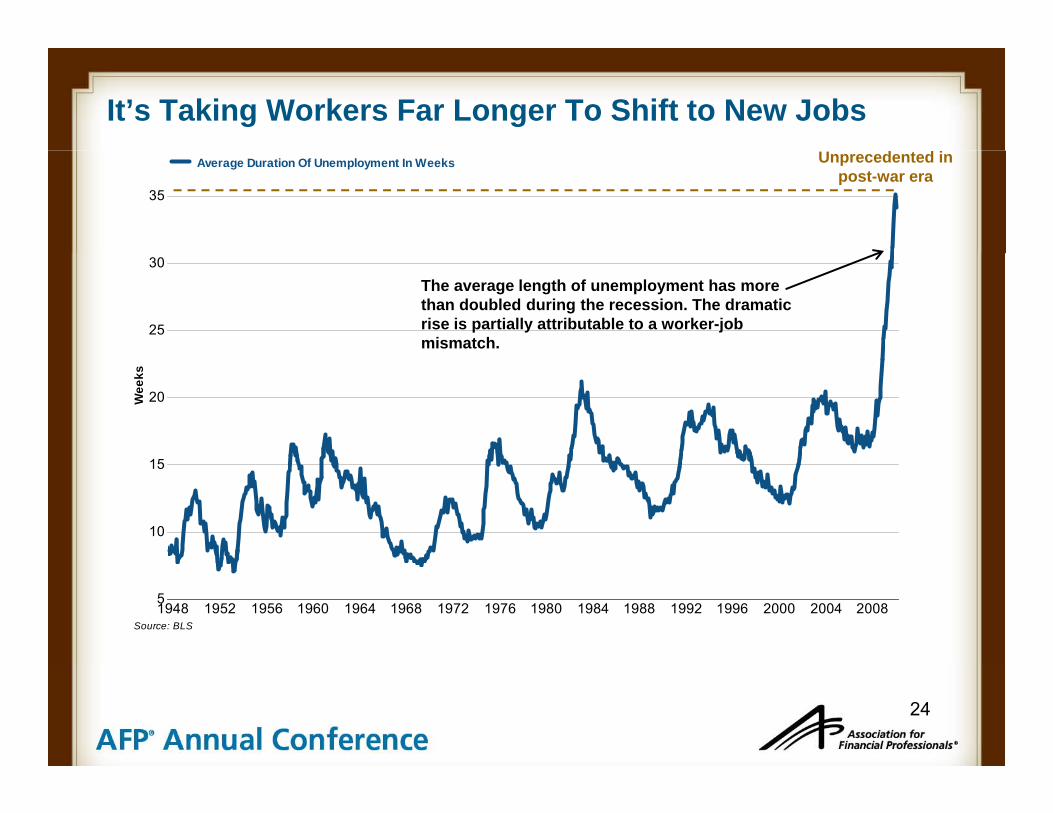
It’s Taking Workers Far Longer To Shift to New Jobs
35
Average Duration Of Unemployment In Weeks Unprecedented in post-war era
25
30
The average length of unemployment has more than doubled during the recession. The dramatic rise is partially attributable to a worker-job mismatch.
20Wee
ks
10
15
1948 1952 1956 1960 1964 1968 1972 1976 1980 1984 1988 1992 1996 2000 2004 20085
Source: BLS
24
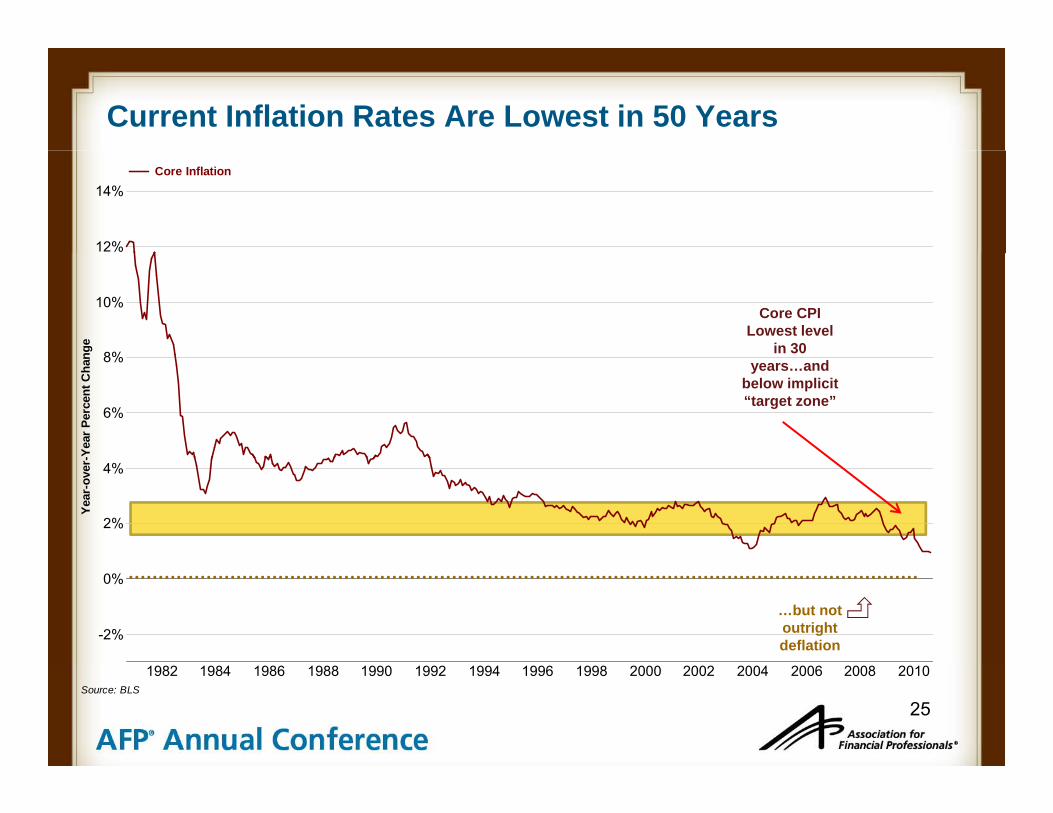
Current Inflation Rates Are Lowest in 50 Years
12%
14%Core Inflation
8%
10%
nge
Core CPI Lowest level
in 30
6%
8%
-Yea
r Per
cent
Cha
n
years…and below implicit “target zone”
2%
4%
Year
-ove
r-
-2%
0%
…but not outright deflation
25
1982 1984 1986 1988 1990 1992 1994 1996 1998 2000 2002 2004 2006 2008 2010Source: BLS
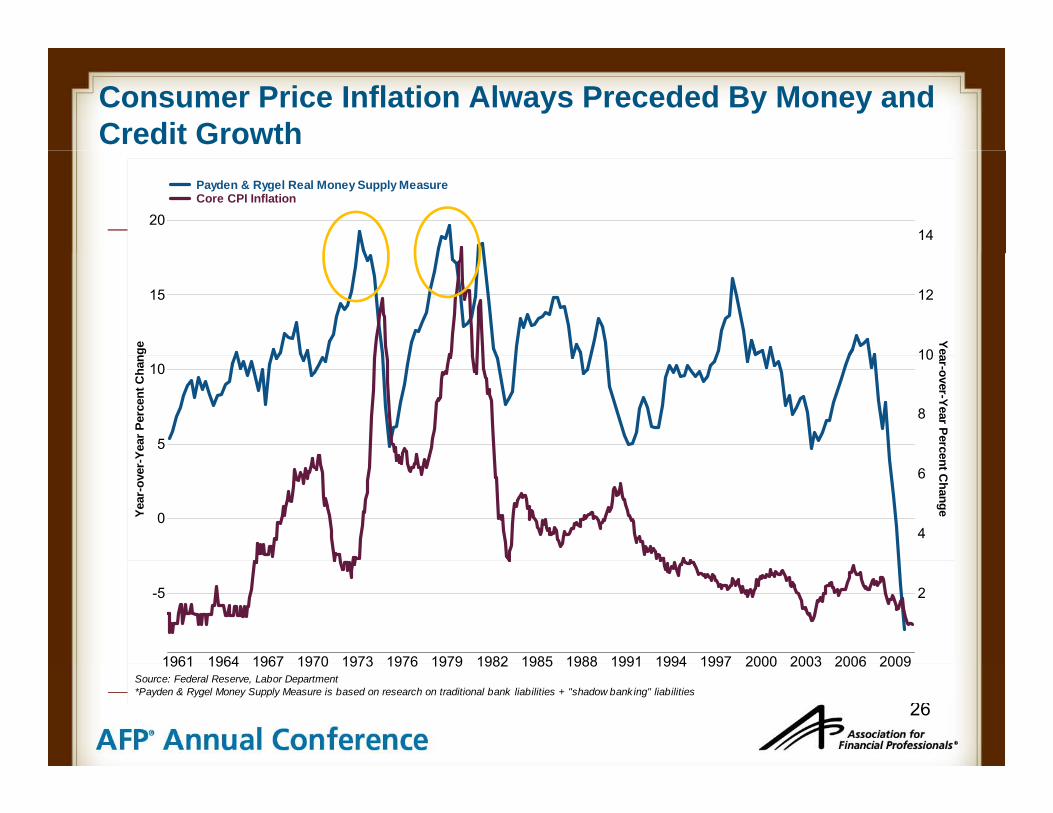
Consumer Price Inflation Always Preceded By Money and Credit Growth
2014
Payden & Rygel Real Money Supply MeasureCore CPI Inflation
15
nge
10
12
Yea
5
10
Year
Per
cent
Cha
n
8
10 ar-over-Year Perce
0Year
-ove
r-Y
4
6
ent Change
1961 1964 1967 1970 1973 1976 1979 1982 1985 1988 1991 1994 1997 2000 2003 2006 2009
-5 2
26
1961 1964 1967 1970 1973 1976 1979 1982 1985 1988 1991 1994 1997 2000 2003 2006 2009Source: Federal Reserve, Labor Department*Payden & Rygel Money Supply Measure is based on research on traditional bank liabilities + "shadow bank ing" liabilities
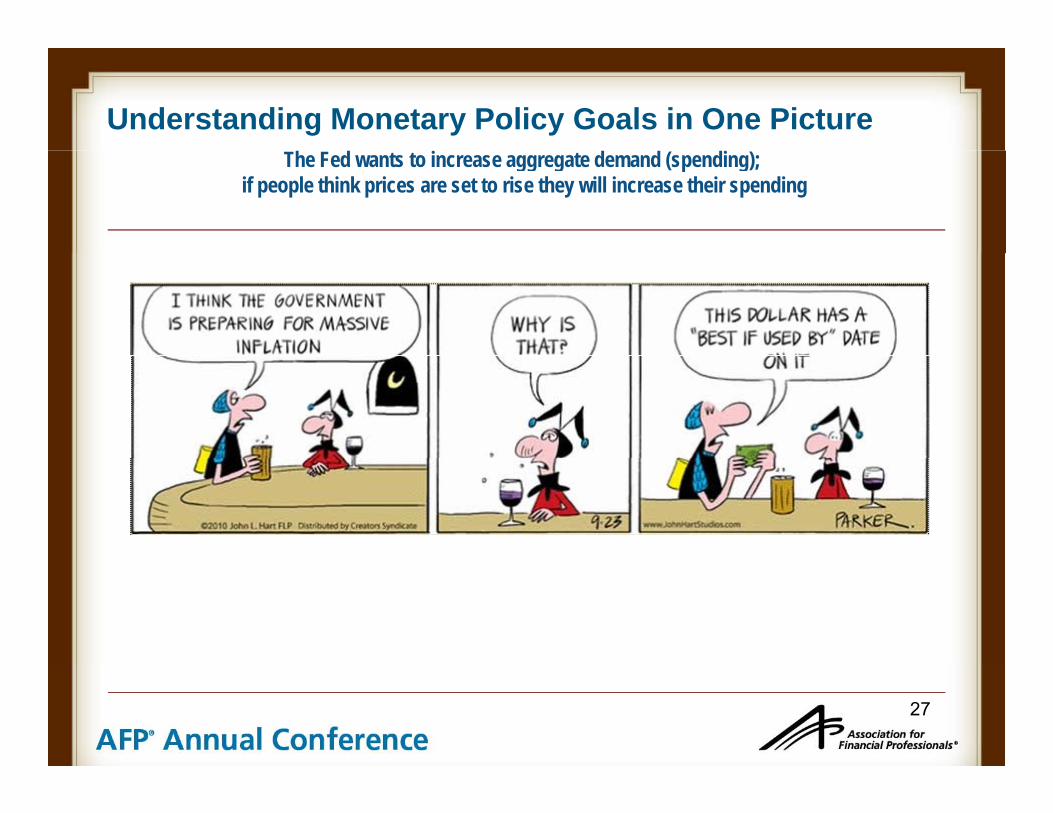
Understanding Monetary Policy Goals in One PictureThe Fed wants to increase aggregate demand (spending);
if people think prices are set to rise they will increase their spending
27

Monetary Policy Scorecard Makes “Quantitative Easing 2” Likely
The Federal Reserve's mandate is "to promote effectively the goals of maximum employment, stable prices, and moderate long-term interest rates" (1977 Federal Reserve Act). Today this is referred to as the "dual mandate" since long-term interest rates can only remain moderate in a stable macroeconomic environment. In the wake of unprecedented monetary policy actions, how has the Fed fared?
Macroeconomic Category IndicatorPolicy Goal
Current Reading
Year Ago
ReadingMeeting Goal?
Employment Unemployment Rate 5‐7% 9.6% 9.7%No
Core CPI NoInflation
Core CPI (year‐over‐year) 1.5% ‐ 2% 0.95% 1.6%
No
Payroll GrowthNon‐Farm Payrolls (monthly change)
150,000‐300 000 -39 000 -197 000
NoPayroll Growth (monthly change) 300,000 39,000 197,000
28

More Likely Before
Further Ammunition: What Options Are Available?
I Long-Term Treasury Purchases (“Quantitative Easing” or “QE2”)II
More Likely Before Year-End
( Q g Q )
Communication StrategyII
III
Reduce Interest Paid on Reserves
Raise Inflation Target
IVLess Likely
Raise Inflation Target
Source: Ben Bernanke, “The Economic Outlook and Monetary Policy,” Jackson Hole, Wyoming, August 27, 2010.
29
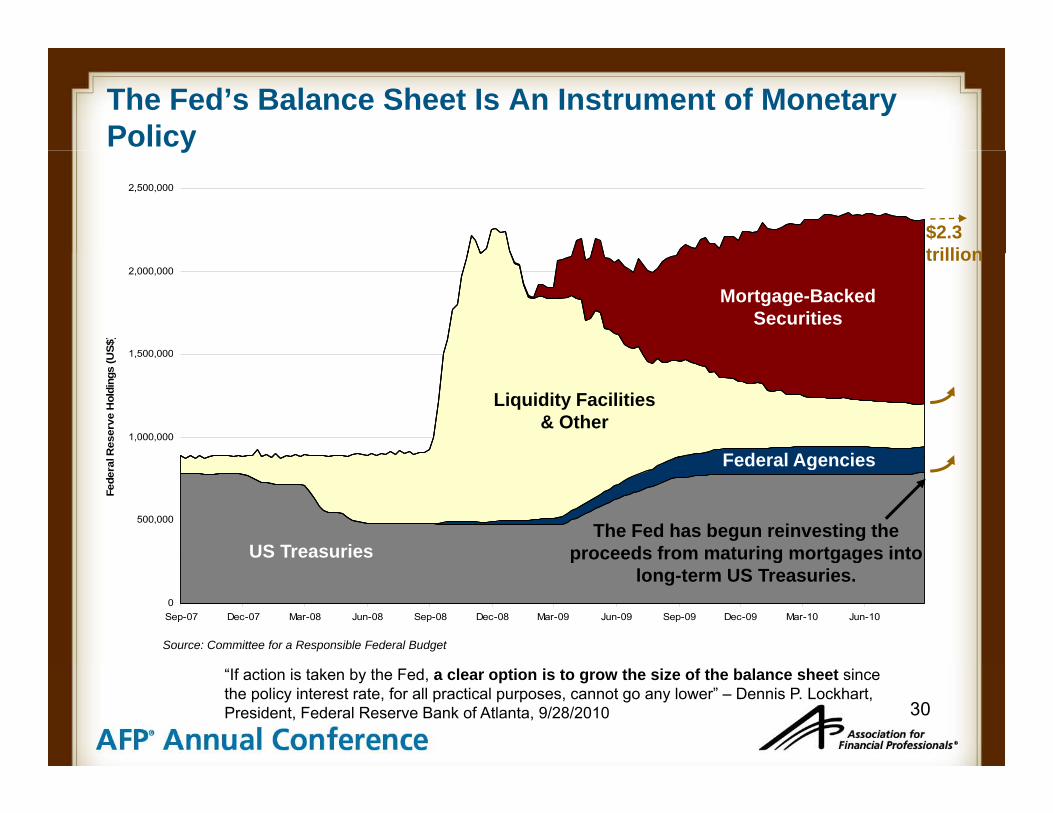
The Fed’s Balance Sheet Is An Instrument of Monetary Policyy
2,500,000
$2.3 trillion
1 500 000
2,000,000
US$
)
trillion
Mortgage-Backed Securities
1,000,000
1,500,000
Res
erve
Hol
ding
s (U
Liquidity Facilities & Other
Federal Agencies
500,000
Fede
ral
The Fed has begun reinvesting the proceeds from maturing mortgages into US Treasuries
Federal Agencies
0Sep-07 Dec-07 Mar-08 Jun-08 Sep-08 Dec-08 Mar-09 Jun-09 Sep-09 Dec-09 Mar-10 Jun-10
p g g glong-term US Treasuries.
Source: Committee for a Responsible Federal Budget
30
“If action is taken by the Fed, a clear option is to grow the size of the balance sheet since the policy interest rate, for all practical purposes, cannot go any lower” – Dennis P. Lockhart, President, Federal Reserve Bank of Atlanta, 9/28/2010
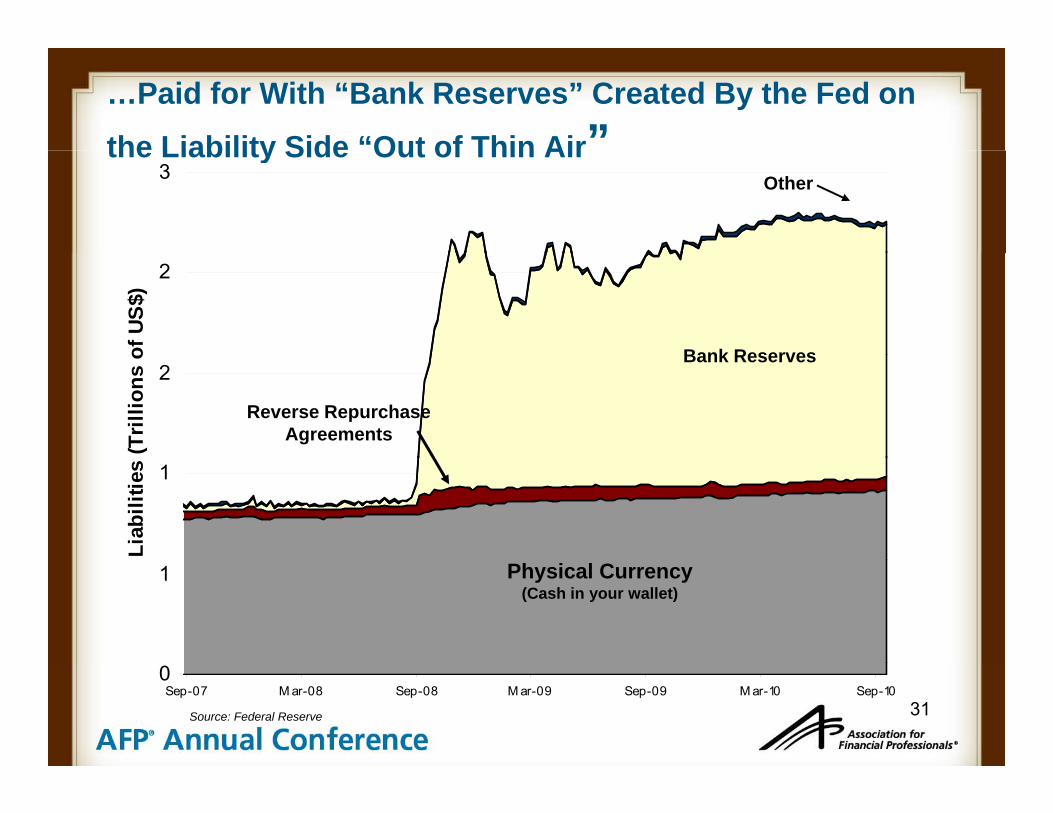
…Paid for With “Bank Reserves” Created By the Fed on
the Liability Side “Out of Thin Air”3
the Liability Side Out of Thin AirOther
2
of U
S$)
Bank Reserves2
(Tril
lions
o
Reverse Repurchase Agreements
Bank Reserves
1
Liab
ilitie
s
1 Physical Currency(Cash in your wallet)
31
0Sep-07 M ar-08 Sep-08 M ar-09 Sep-09 M ar-10 Sep-10
Source: Federal Reserve
Would Further “QE” Have an Impact?Would Further “QE” Have an Impact?
On Capital Markets? Yes
On the Real Economy? YesEconomy?
Probably Not
32

The Limits of QE: Banks Accumulate Excess Reserves, Not New LoansNot New Loans
1 7Commercial & Industrial Bank Loans (Right)"Printed Money" = Excess Reserves Held at Federal Reserve (Left)
In textbooks, reserves work through the “money multiplier” to increase aggregate lending and demand.
1
1.2
1.6
1.65
1.7
0.6
0.8
D T
rillio
ns
1.45
1.5
1.55
USD
Trilli
The banks are hoarding money…
0.4
0.6
USD
1.3
1.35
1.4
ions…and not making new loans.
2009 20100
0.2
1.2
1.25
Source: Federal Reserve
33
Source: Federal Reserve

Commercial Banks Appear to Be Hoarding Cashpp g
1,400 1,400,000
Assets Of Commercial Banks, Cash Assets, Bil. (Left)Excess Reserves Of Depository Institutions (Right)
1,200
1,000,000
1,200,000
800
1,000
D B
illion
s 800,000
US
D M
illi
600
US
D
400,000
600,000
ions
200
400
0
200,000
34
1/08 4/08 7/08 10/08 1/09 4/09 7/09 10/09 1/10 4/10 7/10 10/10200 0

Non-Financial Corporations Also Appear to Be Hoarding Cash
1.8
2 Nonfarm nonfinancial corporate business - Total Liquid Assets
1.4
1.6
1
1.2
US
D T
rillio
ns
0 4
0.6
0.8
0
0.2
0.4
35
'46 '48 '50 '52 '54 '56 '58 '60 '62 '64 '66 '68 '70 '72 '74 '76 '78 '80 '82 '84 '86 '88 '90 '92 '94 '96 '98 '00 '02 '04 '06 '080
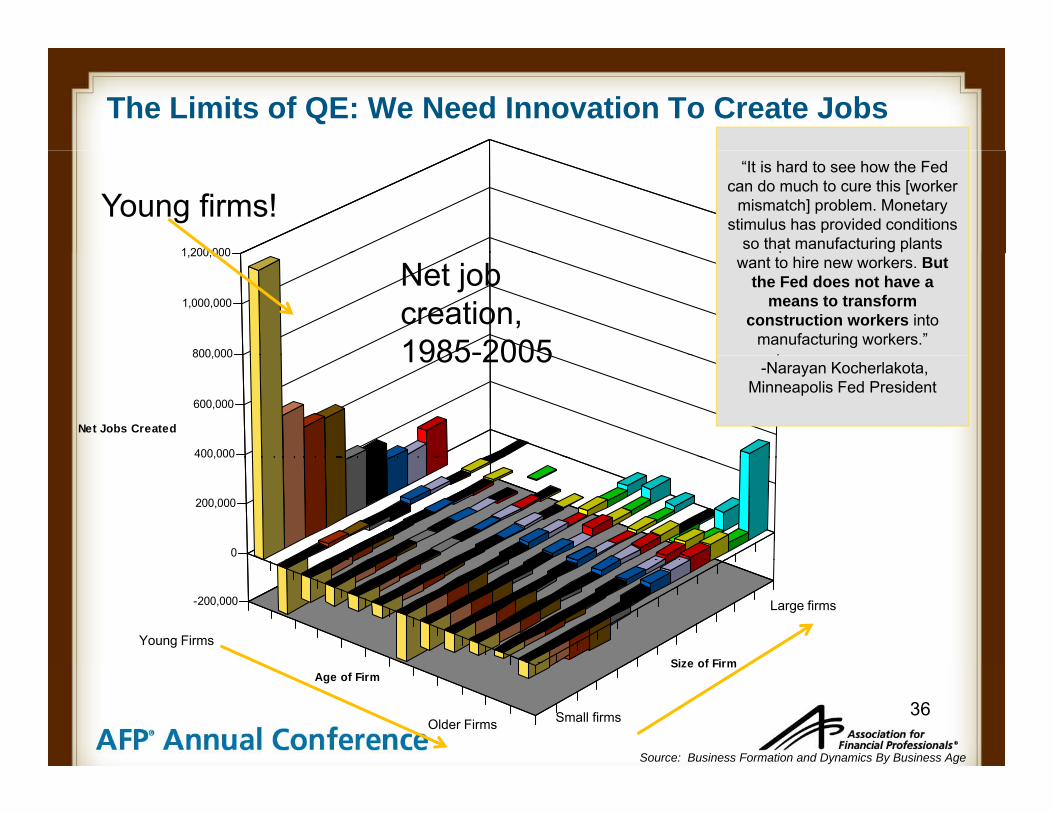
The Limits of QE: We Need Innovation To Create Jobs
1 200 000
“It is hard to see how the Fed can do much to cure this [worker
mismatch] problem. Monetary stimulus has provided conditions
so that manufacturing plants
Young firms!
800 000
1,000,000
1,200,000want to hire new workers. But
the Fed does not have a means to transform
construction workers into manufacturing workers.”
Net job creation, 1985-2005
400,000
600,000
800,000
Net Jobs Created
-Narayan Kocherlakota, Minneapolis Fed President
1985 2005
0
200,000
,
-200,000
Size of Firm
Young Firms
Large firms
36
Age of FirmSize of Firm
Source: Business Formation and Dynamics By Business Age
Older Firms Small firms
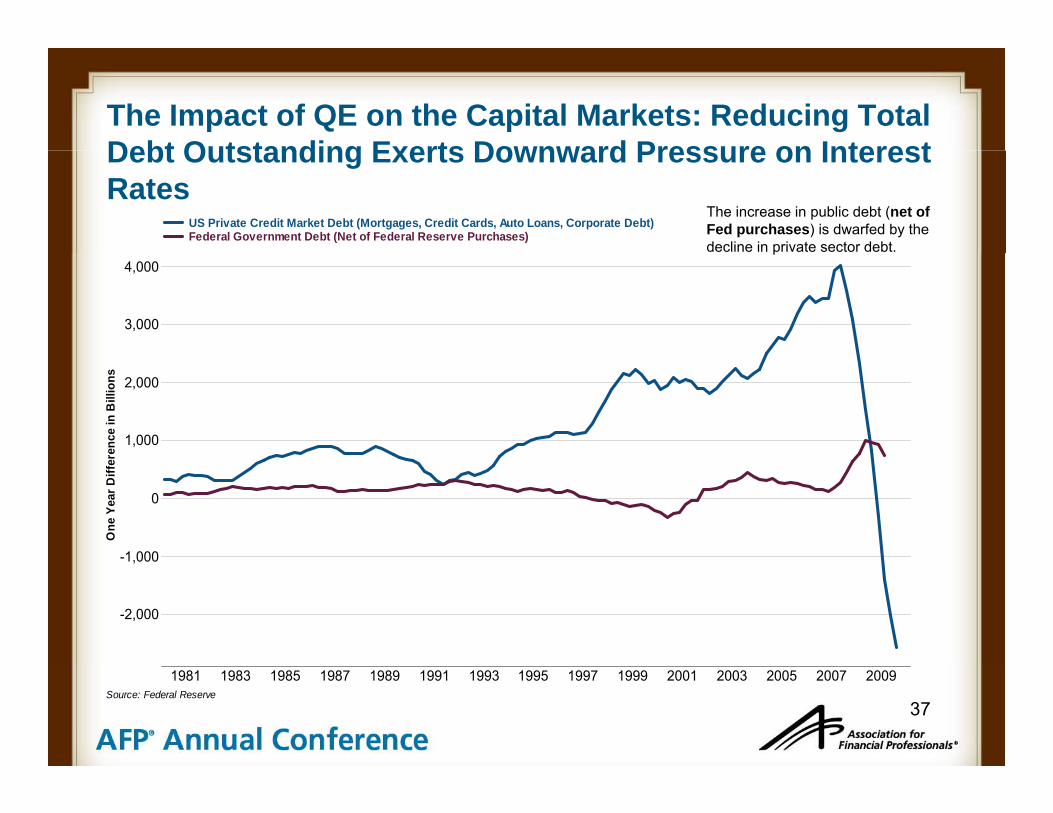
The Impact of QE on the Capital Markets: Reducing Total Debt Outstanding Exerts Downward Pressure on InterestDebt Outstanding Exerts Downward Pressure on Interest Rates
US Private Credit Market Debt (Mortgages, Credit Cards, Auto Loans, Corporate Debt)Federal Government Debt (Net of Federal Reserve Purchases)
The increase in public debt (net of Fed purchases) is dwarfed by the decline in private sector debt.
3,000
4,000p
1,000
2,000
renc
e in
Bill
ions
-1,000
0
One
Yea
r Diff
er
-2,000
1,000
37
1981 1983 1985 1987 1989 1991 1993 1995 1997 1999 2001 2003 2005 2007 2009Source: Federal Reserve

Meanwhile, Investor Demand for Bonds Has Surged
208200220
Year-to-Date Flows By Fund Type, USD Billions
100120140160180
s
“Thus, our purchases of Treasury, agency debt, and agency MBS likely both reduced the yields on those securities and also pushed investors into holding other assets with similar characteristics, such as credit risk and duration. For example, some investors who sold MBS to the Fed may have replaced them in their portfolios with longer-term, high-quality corporate bonds, depressing the yields on those assets as well ” Ben Bernanke August 27 2010
30 2814
200
20406080
USD
Bill
ions
In
yields on those assets as well. - Ben Bernanke, August 27, 2010
-59-80-60-40-20
Taxable Bond Municipal Bond Foreign Equity Hybrid Domestic Equity
Out
S ICIThe Portfolio Balance Effect
38
Source: ICI
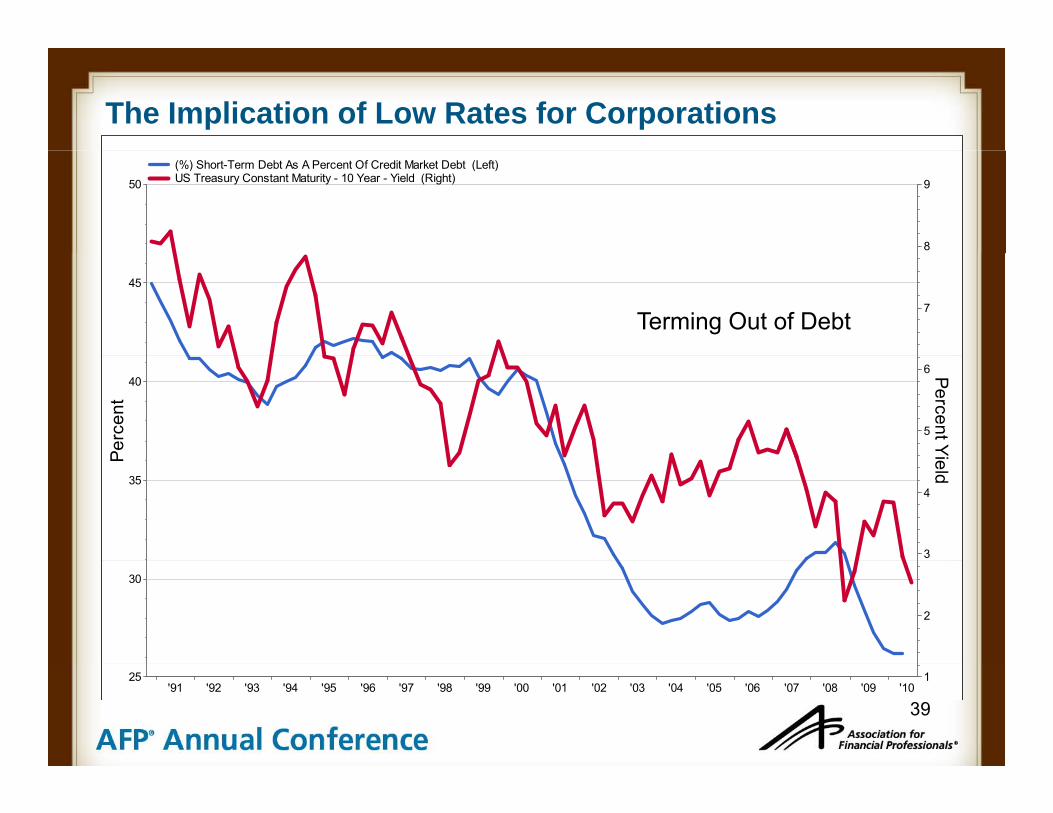
The Implication of Low Rates for Corporations
50
8
9
(%) Short-Term Debt As A Percent Of Credit Market Debt (Left)US Treasury Constant Maturity - 10 Year - Yield (Right)
45
7Terming Out of Debt
40
Perc
ent
5
6 Percent Yi
35
P
3
4
ield
30
2
39'91 '92 '93 '94 '95 '96 '97 '98 '99 '00 '01 '02 '03 '04 '05 '06 '07 '08 '09 '10
25 1

The Contributions to Growth By Major Sector
3.5%Q3 2010 Real GDP Growth = 2.0%
1.5%
2.5%
on to
Rea
l GD
P
Sustainable Drivers of Growth
Temporary Drivers of Growth
0.9%1.4%
1.8%
0.7%0.5%
Poi
nt C
ontri
butio
-0.8%
-2.0%
1 5%
-0.5%
Per
cent
age
P
-2.5%
-1.5%
Consumer Private Inventories Business Government Housing Net Exports
40
Spending Investment Spendingg
Investmentp
Source: The Commerce Department
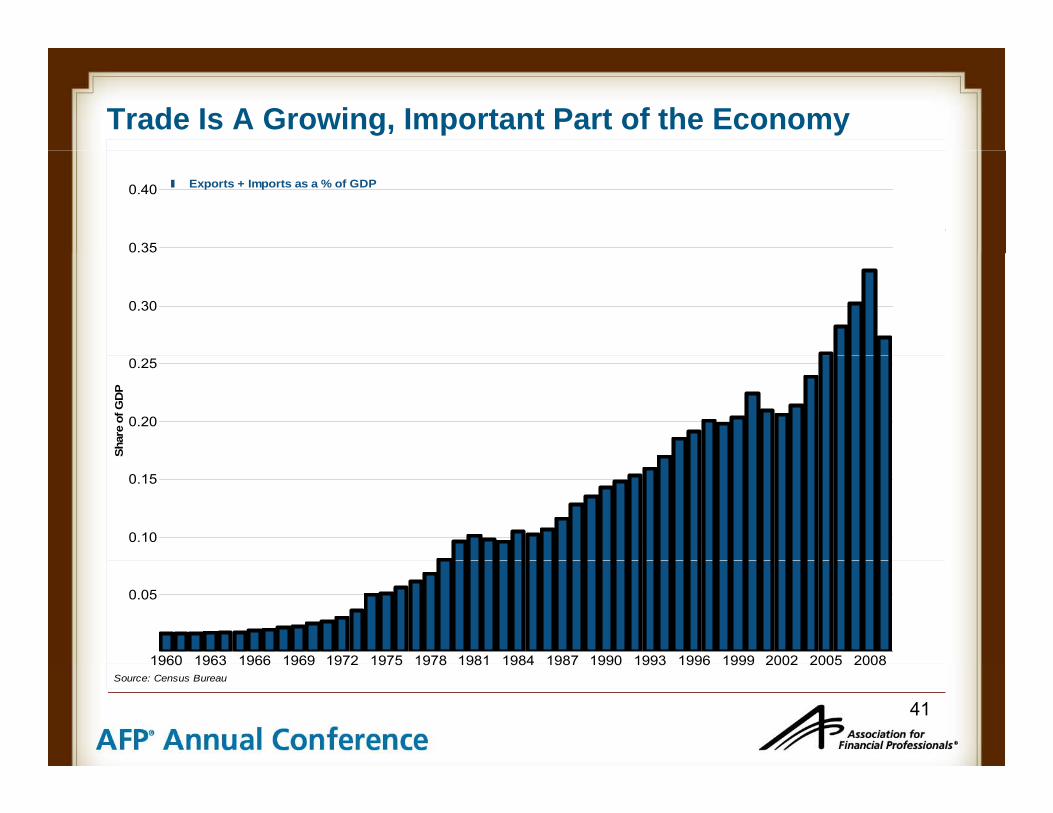
Trade Is A Growing, Important Part of the Economy
0.35
0.40 Exports + Imports as a % of GDP
0.30
0.20
0.25
Shar
e of
GD
P
0.10
0.15
1960 1963 1966 1969 1972 1975 1978 1981 1984 1987 1990 1993 1996 1999 2002 2005 2008
0.05
41
1960 1963 1966 1969 1972 1975 1978 1981 1984 1987 1990 1993 1996 1999 2002 2005 2008Source: Census Bureau
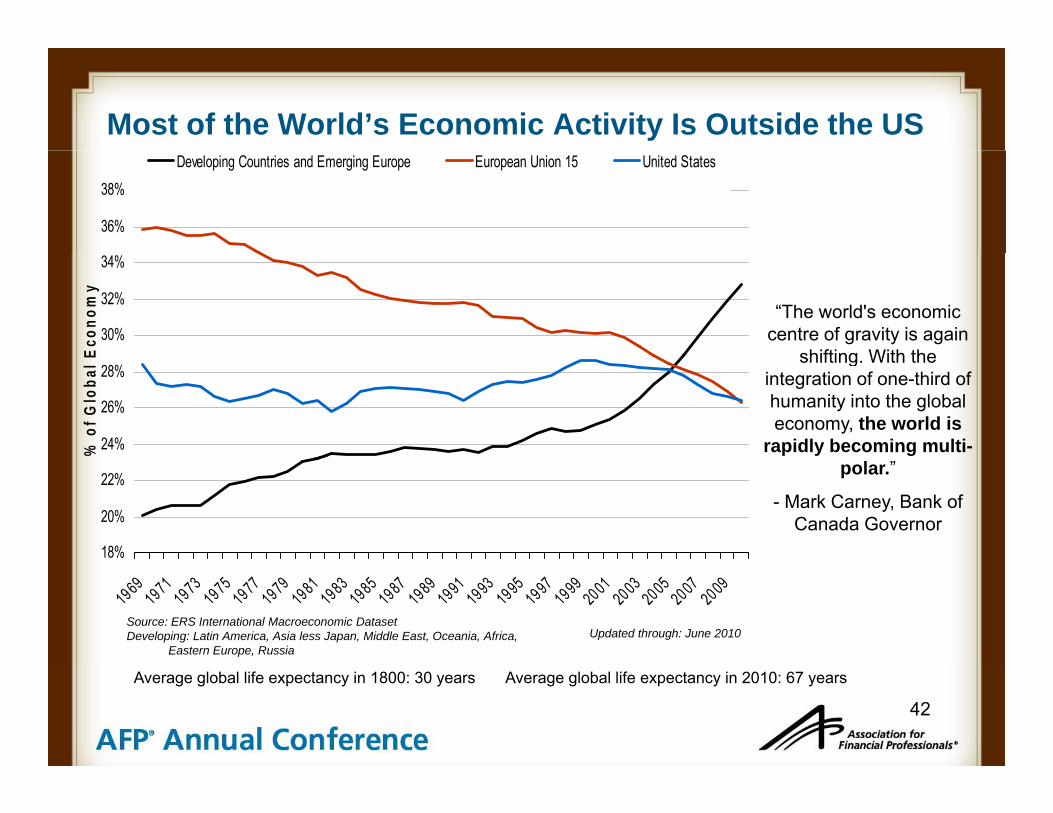
Most of the World’s Economic Activity Is Outside the US
36%
38%Developing Countries and Emerging Europe European Union 15 United States
30%
32%
34%
Econ
omy
“The world's economic centre of gravity is again
shifting With the
24%
26%
28%
% o
f Glo
bal E shifting. With the
integration of one-third of humanity into the global economy, the world is
rapidly becoming multi-
18%
20%
22% polar.”
- Mark Carney, Bank of Canada Governor
Source: ERS International Macroeconomic DatasetDeveloping: Latin America, Asia less Japan, Middle East, Oceania, Africa,
Eastern Europe, Russia
196919711973197519771979198119831985198719891991199319951997199920012003200520072009
Updated through: June 2010
42
Average global life expectancy in 1800: 30 years Average global life expectancy in 2010: 67 years

IV The Output: GDP,V The Output: GDP,
Employment, Inflation, Interest RatesRates
43

The Output: GDP, Employment, Inflation, Interest Rates“I can calculate the motions of heavenly bodies, but not the madness of people.” – Sir Isaac Newton
Actual Forecast
2010 2011Q1 Q2 Q3 Q4 Q1 Q2Q1 Q2 Q3 Q4 Q1 Q2
Real GDP(quarter-to-quarter annualized percent change)
3.7 1.6 1.5 2.0 2.5 2.7
Unemployment Rate(percent)
9.7 9.7 9.6 9.5 9.5 9.5
Headline CPI Inflation(year-over-year percent change)
2.4 1.8 1.8 1.8 1.6 1.4
Core CPI Inflation(year-over-year percent change)
1.3 1.0 0.9 0.8 1.0 1.2
Federal Funds Rate(percent)
<0.25 <0.25 <0.25 <0.25 <0.25 <0.25
2-Year Treasury(percent)
1.05 0.60 0.42 0.30 0.25 0.25
10-Year Treasury 3.71 3.49 2.80 2.50 2.50 2.50
44
*Data represent quarterly averages
The Risks to the Forecast
“I can calculate the motions of heavenly bodies, but not the madness of people.” – Sir Isaac Newton
State & Local Government Fiscal/Debt
D fl iDeflation
Fiscal/Regulatory Uncertainty
Housing Market Supply Overhang
International Currency War
45