The Art and Science behind Dashboarding by Taha Azizi
23
The Art and Science Behind Dashboarding Taha Azizi Western Financial Group MBA MSc. B.Eng
-
Upload
taha-azizi -
Category
Data & Analytics
-
view
149 -
download
2
Transcript of The Art and Science behind Dashboarding by Taha Azizi
The Art and Science Behind
Dashboarding
Taha Azizi
Western Financial Group
MBA MSc. B.Eng

Dashboard as Analytics Story
• One Page Summary of the Story of Your
Analytics
• Combination of Arts and Science
5 Principles

Art Principle 1 – Communication
• Customer is God
• Two Sided
• Tools Determination

Science Principle 1 – Metrics
Definition
• Definition of KPIs and Scores
• Thinking about Customers
• Linkage to Strategy and Plans

Art Principle 2 –
Layout – Keep It Simple
• Recommended:
White Background
Non-Busy
The Less Ink The Better

Art Principle 2 – Layout (Cont.)
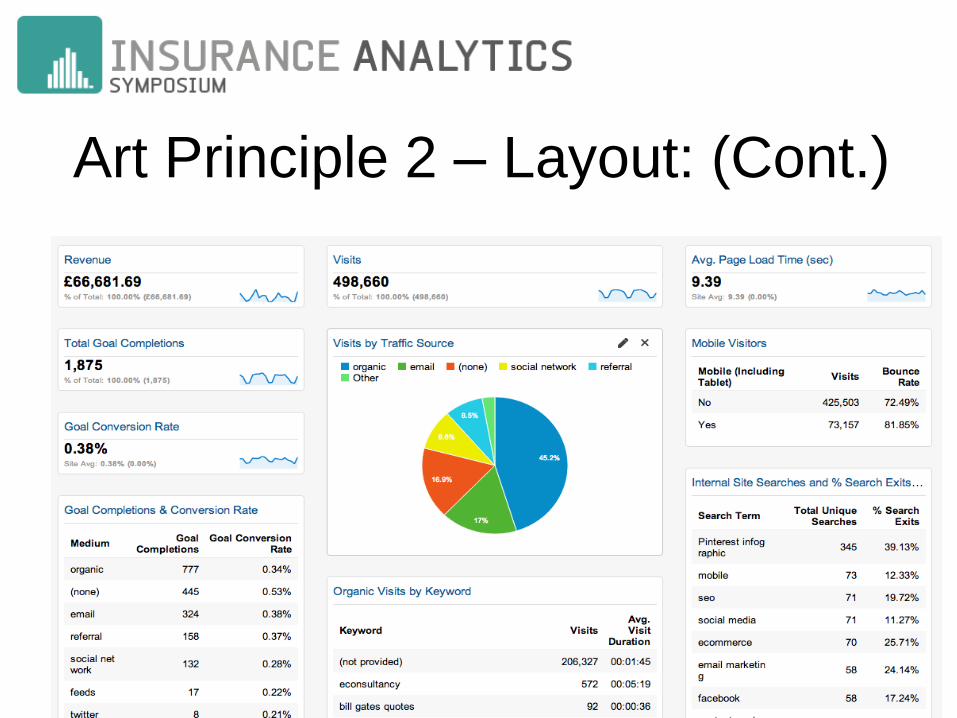
Art Principle 2 – Layout: (Cont.)
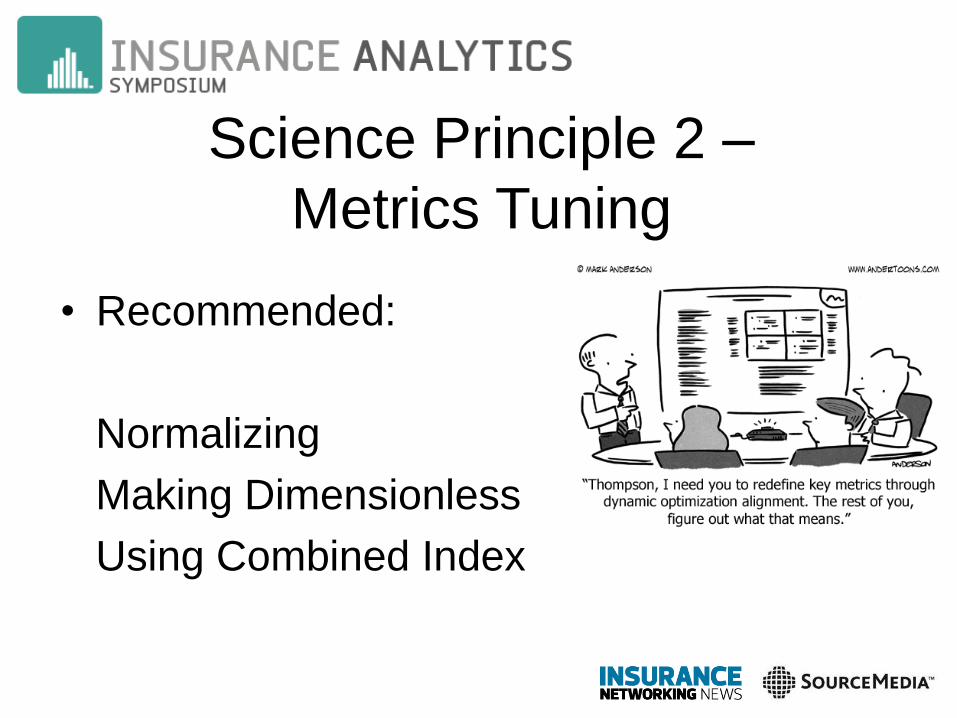
Science Principle 2 –
Metrics Tuning
• Recommended:
Normalizing
Making Dimensionless
Using Combined Index
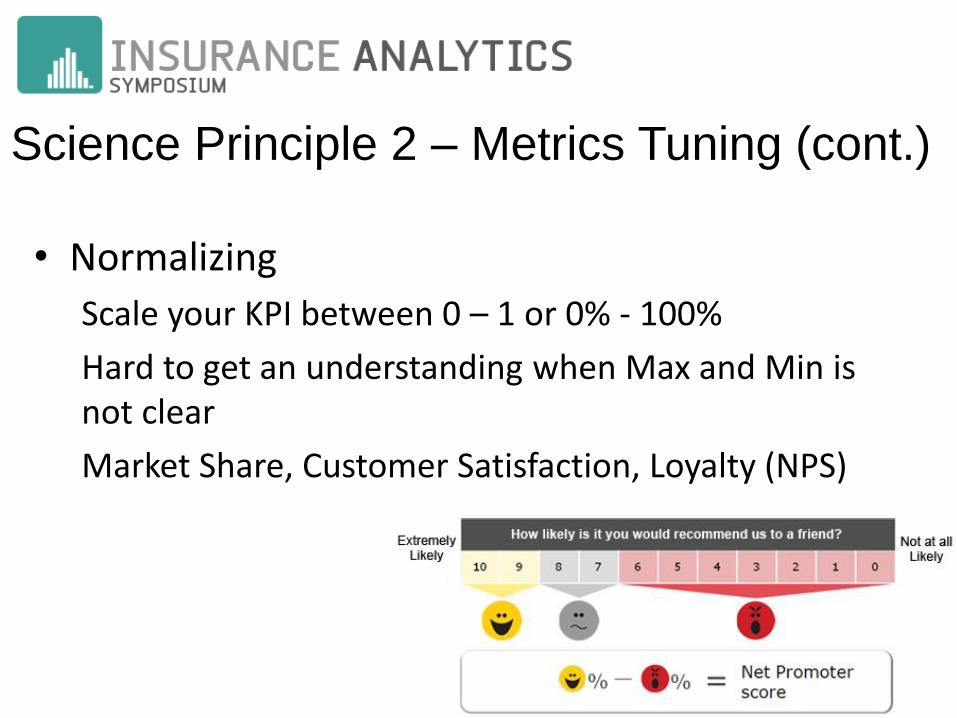
Science Principle 2 – Metrics Tuning (cont.)
• Normalizing
Scale your KPI between 0 – 1 or 0% - 100%
Hard to get an understanding when Max and Min is not clear
Market Share, Customer Satisfaction, Loyalty (NPS)

Science Principle 2 – Metrics Tuning (cont.)
• Making Dimensionless
Absolute Revenue $ versus Growth %
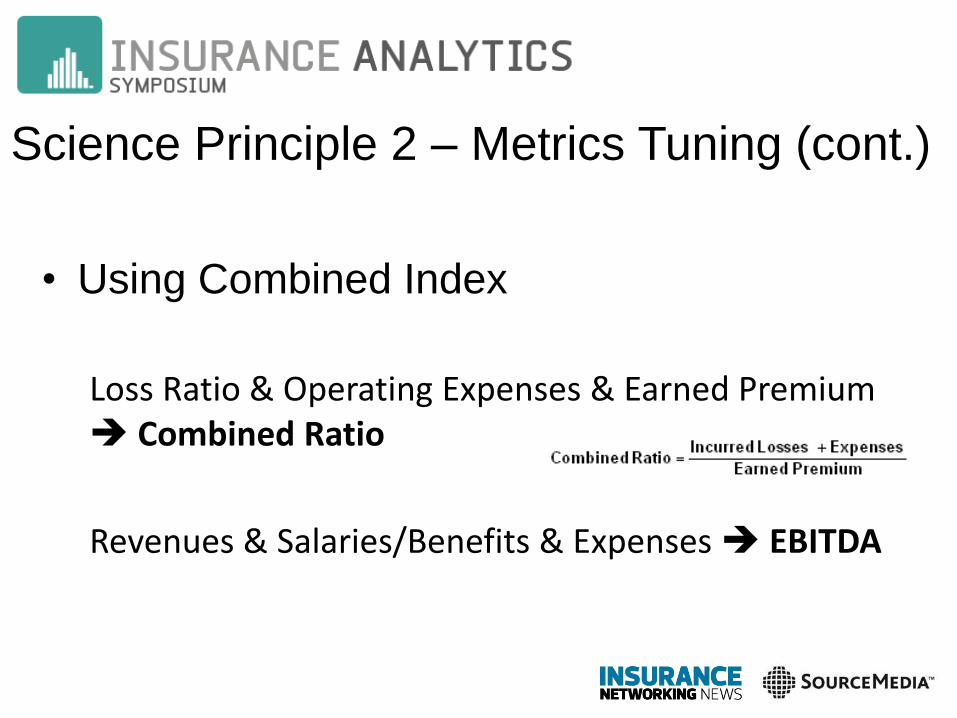
Science Principle 2 – Metrics Tuning (cont.)
• Using Combined Index
Loss Ratio & Operating Expenses & Earned Premium Combined Ratio
Revenues & Salaries/Benefits & Expenses EBITDA

Art Principle 3 –
Visualization
• Tables
• Graphs & Charts
• Maps

Art Principle 3 – Visualization
a. Tables
• Recommended:
Less Data
More Symbols
and Colors

Art Principle 3 – Visualization
b. Charts & Graphs
• Recommended:
2-Dimensional
Pie
Bar
• Not Recommended:
Gauge
Radar
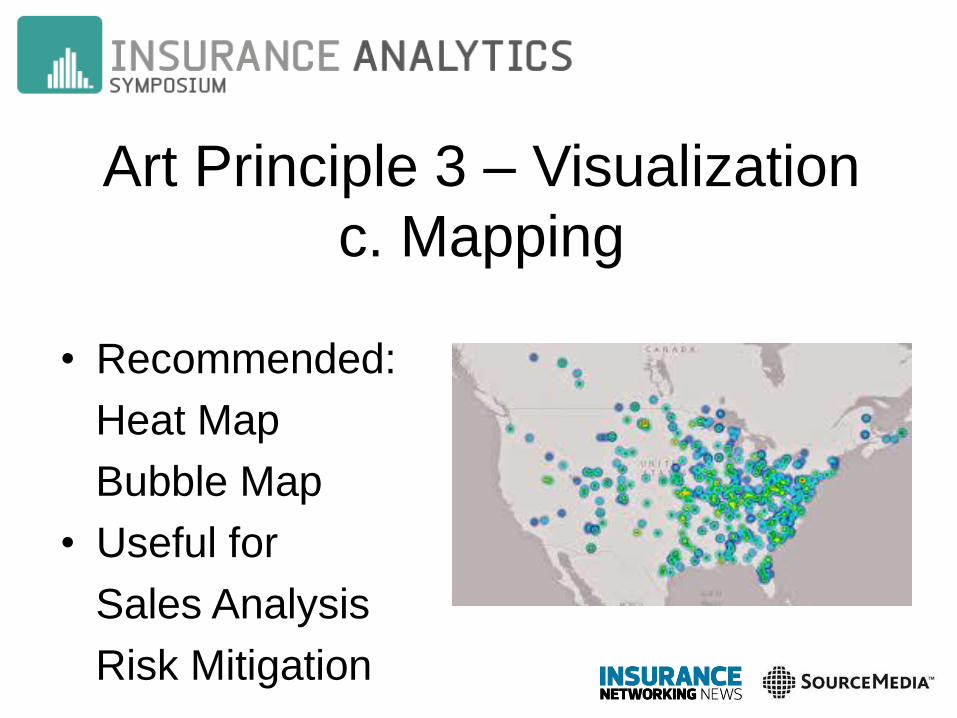
Art Principle 3 – Visualization
c. Mapping
• Recommended:
Heat Map
Bubble Map
• Useful for
Sales Analysis
Risk Mitigation

Science Principle 3 –
External Information
• Competition – Benchmarking
• Economics – Inflation
• Demographics – Product

Art Principle 4 –
Differentiation
• Highlight Differences
• 80-20 Rule
• Avoid Artificial
Differentiation
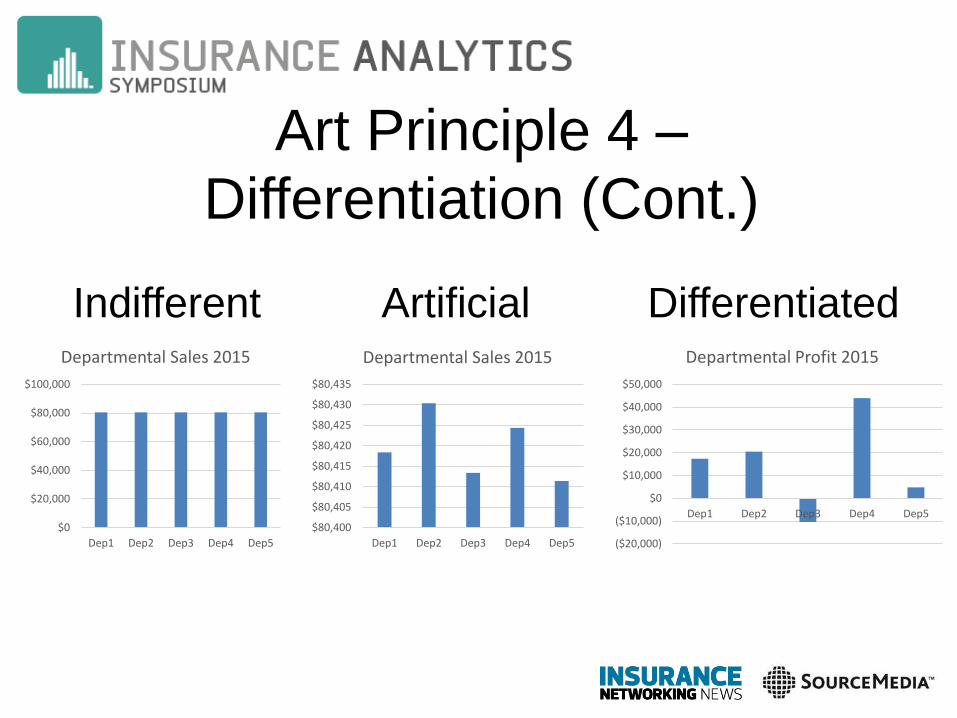
Art Principle 4 – Differentiation (Cont.)
$80,400
$80,405
$80,410
$80,415
$80,420
$80,425
$80,430
$80,435
Dep1 Dep2 Dep3 Dep4 Dep5
Departmental Sales 2015
$0
$20,000
$40,000
$60,000
$80,000
$100,000
Dep1 Dep2 Dep3 Dep4 Dep5
Departmental Sales 2015
($20,000)
($10,000)
$0
$10,000
$20,000
$30,000
$40,000
$50,000
Dep1 Dep2 Dep3 Dep4 Dep5
Departmental Profit 2015
Indifferent Artificial Differentiated
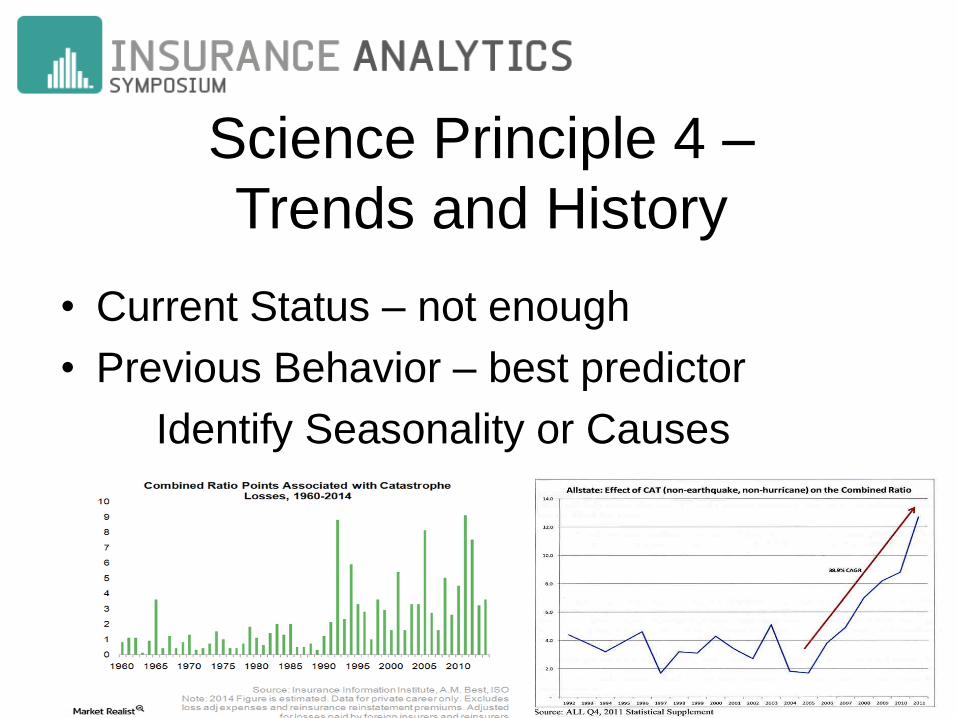
Science Principle 4 –
Trends and History
• Current Status – not enough
• Previous Behavior – best predictor
Identify Seasonality or Causes

Science Principle 5 –
Lead Vs Lag
• Using Lead Indicators
Sales Pipeline / Claims
• Suggestions and Recommendations to
Action Plan
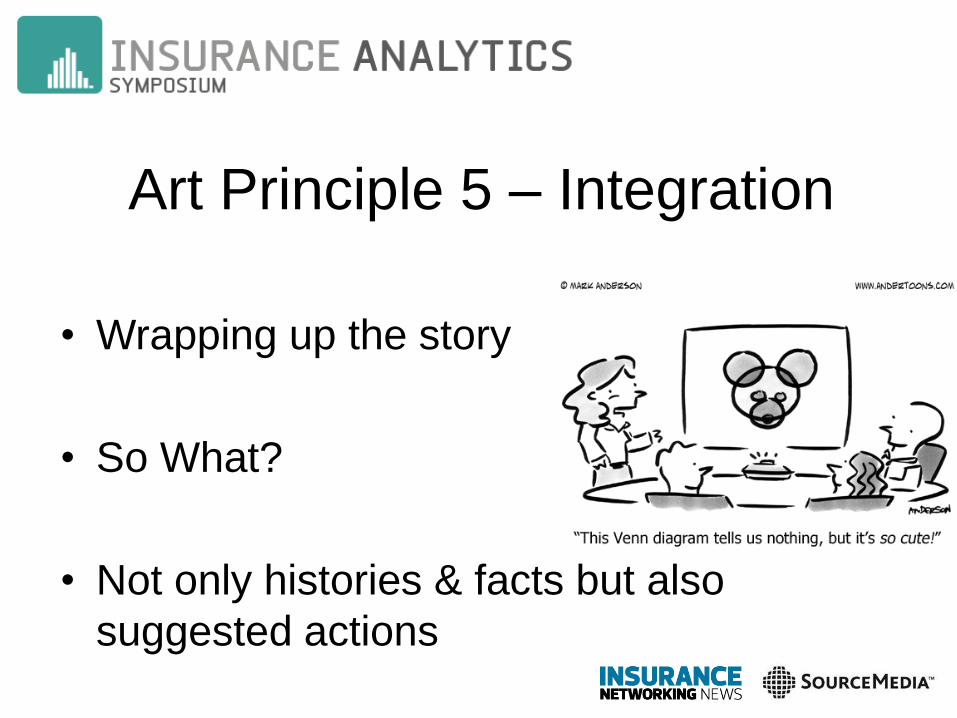
Art Principle 5 – Integration
• Wrapping up the story
• So What?
• Not only histories & facts but also
suggested actions
Summary of Dashboarding Principles
• Pr.1 – Choosing right metrics for right users
• Pr.2 – Designing simple layout for tuned KPIs
• Pr.3 – Visualizing internal & external data
• Pr.4 – Differentiating trends & history
• Pr.5 – Wrapping up the story & recommendation
Questions and Answers