THE APS VISION THE APS MISSIONs2.q4cdn.com/279778296/files/doc_financials/annual/2015/...THE APS...
56
PINNACLE WEST CAPITAL CORPORATION CORPORATE RESPONSIBILITY REPORT 2015
Transcript of THE APS VISION THE APS MISSIONs2.q4cdn.com/279778296/files/doc_financials/annual/2015/...THE APS...

PINNACLE WEST CAPITAL CORPORATION CORPORATE RESPONSIBILITY REPORT
2015

THIS CORPORATE RESPONSIBILITY REPORT FEATURES ART BY ED MELL
Mell brings an architectural eye to the desert, emphasizing graphic elements and stripping away details that do not serve his vision. From landscapes to storms, longhorn cattle to desert flowers, he presents the natural power and beauty of Arizona in bold colors and lines, energizing the vistas with his singular style. Featured Work: Lines of Clouds (Cover & Page 30), Morning Sun (Page 14), Desert Kings (Page 22), High Desert Peaks (Page 34), Evening Edges (Page 40).

THE APS VISION Creating a sustainable energy future for Arizona.
THE APS MISSION We safely and efficiently deliver reliable energy to meet the changing needs of our customers.
PINNACLE WEST CAPITAL CORPORATION IS AN ENERGY-HOLDING COMPANY BASED IN
PHOENIX, ARIZONA, WITH A FOCUS ON THE BUSINESS OF ITS PRIMARY SUBSIDIARY, ARIZONA PUBLIC SERVICE COMPANY (APS).
APS is Arizona’s largest electric company, providing retail and wholesale electric service for 130 years to customers across most of the state.
Our company has published a Corporate Responsibility Report each year since 1994 to share our sustainability performance and vision with our stakeholders and the public.


CONTENTS2
LETTER FROM THE CEO AND CSO
6ABOUT APS
14ENERGY INNOVATION
22SAFETY AND SECURITY
30WATER RESOURCES
34CARBON MANAGEMENT
40PEOPLE
48APPENDIX

LETTER FROM
THE CEO & CSO
Arizona Public Service has the responsibility and challenge of powering our unique desert state. Creating a sustainable energy future demands a commitment to forward-thinking practices that will allow APS and Arizona to thrive for years to come.
Sustainability is a priority for our company, our customers and our shareholders. It informs the work we do every day to deliver on our vision. As you dig into this year’s report, you’ll find it is structured around five areas that drive our sustainability efforts.
ENERGY INNOVATION. Our industry is in a period of change, driven by technological advances and evolving customer expectations. Pursuing innovative technologies today speeds our transition to the utility of tomorrow. In our Solar Innovation Study, for example, we integrate rooftop solar, battery storage and energy management systems in customer homes to study their impact on energy use and on our system. We are also modernizing the energy grid for greater automation, analytics and control. This will help us provide customers with improved reliability, enhanced outage information and an increased ability to integrate new home-energy tools.
SAFETY AND SECURITY. Our work begins and ends with safety. We take pride in the company’s strong safety culture and the fact that we have reduced serious injuries by 73 percent over the past 10 years. Physical and cybersecurity also have become priorities for us. Breaches at other companies, including some in the utility sector, underscore the importance of ever-increasing vigilance. Our physical and cybersecurity efforts include both defense in depth and employee awareness campaigns to keep data and operations secure. In addition, infrastructure security enhancements better safeguard the assets critical to our mission.
WATER RESOURCES. It’s a challenge to be among the fastest growing states and located in a desert. To meet this challenge, we continue to seek out new ways to use less water and to use the water we consume more efficiently. Looking ahead, we are committed to reduce water intensity—the number of gallons it takes to produce one megawatt-hour (MWh) of electricity—by 20 percent over the next 10 years.

ANN C. BECKER VICE PRESIDENT,
ENVIRONMENTAL, AND CHIEF SUSTAINABILITY OFFICER, APS
CARBON MANAGEMENT. An efficient, diverse portfolio is critical to delivering sustainable power for Arizona, even more so in the face of federal environmental regulations and changing economic conditions. In 2015, 47 percent of our energy came from carbon-free resources, including a record-breaking 32.5 million MWh from the Palo Verde Nuclear Generating Station. We expect to reduce the share of coal in our energy mix from the current level of 25 percent to about 14 percent by 2031.
PEOPLE. Our employees execute our vision of a sustainable energy future, and they are at the center of a multi-year plan to strengthen engagement across our company. Customers put us in the top quartile for customer satisfaction and give us a particularly high score for power quality and reliability. We also remain deeply invested in the communities we serve. APS donated more than $10 million in 2015 to support worthwhile causes in the state. Our employees volunteered 127,000 hours with local nonprofits. The APS Foundation invested $2.5 million to strengthen STEM (science, technology, engineering and math) education—building a dynamic workforce for the future.
Whether we are reducing groundwater use, modernizing the Ocotillo Power Plant or funding a science teacher’s robotics program, we are focused on the future of Arizona.
For APS, sustainability is about creating a better Arizona—a better place to live, to work, to learn, to do business—for years to come.
Donald E. Brandt Ann C. Becker
DONALD E. BRANDT CHAIRMAN, PRESIDENT AND CHIEF EXECUTIVE OFFICER, PINNACLE WEST AND APS


PNW CRR 5
FORWARD-LOOKING STATEMENTSThis report contains forward-looking statements based on current expectations. These forward-looking statements are often identified by words such as “estimate,” “predict,” “may,” “believe,” “plan,” “expect,” “require,” “intend,” “assume” and similar words. Because actual results may differ materially from expectations, we caution you not to place undue reliance on these statements. A number of factors could cause future results to differ materially from historical results, or from outcomes currently expected or sought by us. A discussion of some of these risks and uncertainties is contained in our annual report on Form 10-K and is available on our website at pinnaclewest.com, which you should review carefully before placing any reliance on our forward-looking statements, financial statements or disclosures. We assume no obligation to update any forward-looking statements, even if our internal estimates change, except as may be required by applicable law.
REPORT METHODOLOGYThis report was prepared using guidance from the Global Reporting Initiatives (GRI) guidelines for G4 and Electric Utilities Sector Supplement and focuses on APS, our primary subsidiary. Information in this report is reviewed and verified internally.
ABOUT THIS REPORTLast year, we engaged various stakeholders to solicit feedback on our annual Corporate Responsibility Report. The central theme from our stakeholders was the desire for a more concise report that focuses on our highest sustainability priorities. We agree with our stakeholders: as we continue to expand our sustainability actions and embed them within our business areas, we believe it’s important to bring into sharp focus and provide a high level of transparency around our most important sustainability priorities. As a result, the focus and content of this year’s Corporate Responsibility Report is different. Specifically, we are highlighting the following five sustainability focus areas:
• Energy Innovation• Safety and Security• Water Resources• Carbon Management• People
We continue to move the needle on our other sustainability initiatives as well, and they remain important to our success. However, we are no longer including them in this report and have placed that information on our website in order to allow this report to drill down on our highest sustainability priorities. You can find this report, and more information on our sustainability programs, at pinnaclewest.com (select “Corporate Responsibility”).

PNW CRR 6
ABOUT APS
Pinnacle West Capital Corporation is an energy holding company with a focus on the business of its primary subsidiary, Arizona Public Service Company (APS). APS is Arizona’s largest and longest serving electric company. APS has been powering Arizona’s economic growth since our company’s founding in 1886. Today, new technologies and evolving customer expectations are leading to rapid changes in our company and our industry. We are investing
in innovative technologies to build an energy infrastructure that will be smarter and stronger. We are making the next generation of power cleaner and more efficient through a balanced energy mix, investments in renewable energy and upgrades to power plants. Through these efforts, we intend to succeed as a next generation energy company, while preserving the reliability and services our customers have come to expect from us.

PNW CRR 7
34,646 SQUARE MILES IN SERVICE TERRITORY
$3.5 BILLION
IN ANNUAL REVENUES
20% OF WORKFORCE COMPRISED
OF VETERANS
35,267MILES OF TRANSMISSION AND DISTRIBUTION WIRES
TOP TEN FOR CUSTOMER
SATISFACTION AMONG LARGE INVESTOR-OWNED UTILITIES

GILABEND
GLOBE
NOGALES
TUCSON
DOUGLAS
WINSLOW
FLAGSTAFF
BAGDAD
KINGMAN
YUMA
PRESCOTT
PHOENIX
YUCCA
California
LAS VEGAS
Nevada Utah Colorado
FARMINGTON
New Mexico
APS Retail Electric Service Territory
Major APS Power Plants
Principal APS Transmission Lines
Transmission Lines Operated for Others
APS Solar Power Plants
NAVAJO
FOURCORNERS
CHOLLA
SUNDANCEWESTPHOENIX
PALO VERDE
REDHAWK
OCOTILLO
SAGUARO
Customer O�ce
GRAND CANYON
SELIGMAN
PAYSON
SHOW LOW
HOLBROOK
PARKER
PNW CRR 8
APS SERVICE TERRITORY MAP
SUSTAINABILITY GOVERNANCEAt APS, sustainability means that we work to meet our business objectives each day by implementing business practices that support a vibrant economy, a healthy environment and strong communities for future generations. Sustainability is important because it drives business value, mitigates risk and enhances brand reputation. Sustainability is ingrained in our culture of excellence and commitment to continuous improvement in all our operations.
With regards to sustainability, our Vice President, Environmental, and Chief Sustainability Officer oversees the company’s strategic efforts to integrate sustainable practices into our core business operations.
BOARD OF DIRECTORSAs of Jan. 31, 2016, the Board of Directors consisted of 10 directors, nine of whom are independent, and included one woman and one minority. The Pinnacle West Chairman, President and CEO is the only board member who is not independent. The Board of Directors has five standing committees: Audit, Corporate Governance, Finance, Human Resources, and Nuclear and Operating. The Board and its committees address as part of their regular responsibilities five sustainability focus areas of energy innovation, safety and security, water resources, carbon management and people.
11 OF 15 ARIZONA COUNTIES SERVED
1.2 MILLION
CUSTOMERS

FINANCIAL PERFORMANCEStrong operational performance, improving economic conditions and an increase in retail customer sales helped us achieve solid financial results in 2015. Pinnacle West recorded net income attributable to common shareholders of $437 million, or $3.92 per diluted share, for 2015. This result compares with net income of $398 million, or $3.58 per share, in 2014. In addition, our Board of Directors increased the annual dividend in 2015 by five percent. This was the fourth year in a row the dividend was increased and will result in an indicated annual dividend of $2.50 per share.
PNW CRR 9
$15BILLION
IN CONSOLIDATED ASSETS

STAKEHOLDER ENGAGEMENTAs our business becomes more complex, our regulatory environment continues to evolve, and our customers continue to desire more choices and enhanced services, it is increasingly important to engage in dialogue and to collaborate with and solicit feedback from our stakeholders—both internal and external. Our stakeholder engagement processes are broader, more inclusive and more continuous than ever before, occurring in a number of venues and with a diverse group of stakeholders. Stakeholder engagement helps to mitigate business risk, drive innovation and enhance our relationship with the communities we serve.
Key components of our stakeholder engagement program include:
• Engagement between company executives and key account customers through our key accounts program;
• Engagement with environmental non-governmental organizations on environmental initiatives;
• Engagement with federal, state and local regulatory authorities on issues of concern to the company, our customers and our communities;
• Engagement with policy makers at all levels of government through on-going dialogues to ensure these decision-makers understand the changing dynamics of our industry and our evolving business objectives;
• Engagement with employees through our employee engagement surveys and action plans, town hall meetings, and round tables;
PNW CRR 10
• Engagement with potential employees through our internship programs and our partnerships with local and regional universities, and colleges and community colleges;
• Engagement with our customers through our call center, business offices, website, community events, marketing and advertising efforts, alert notifications and extensive market research efforts;
• Engagement with our communities in many different manners, including: our significant support of the United Way; our participation and leadership in chamber of commerce activities; the service of our employees on 300 nonprofit boards of directors; and the volunteer hours we encourage our employees to give (employees volunteered 127,000 hours in 2015);
• Engagement with the Greater Phoenix Economic Council, Arizona Commerce Authority and other Arizona economic offices through which we support the economic vitality of Arizona;
7,031MW PEAK DEMAND
IN 2015
6,200MW GENERATION CAPACITY

PNW CRR 11
• Engagement with trade associations, including the Edison Electric Institute (EEI), the Electric Power Research Institute (EPRI), the Utility Air Regulatory Group and numerous others, through which we establish solid and productive networks and keep in front of the latest developments in the industry;
• Engagement with our community business partners, made up of chambers of commerce and diverse business advocacy organizations, through the bi-annual Community Leader Forum;
• Engagement with our labor union members through: joint management and labor committees in each business unit; a strong, longstanding partnership on safety; a respectful and collaborative relationship with International Brotherhood of Electrical Workers (IBEW) leadership; and applying principles of positive labor relations;
• Engagement with our investors on financial performance, strategic priorities, proxy-related topics and sustainability; and
• Engagement with the media through consistent outreach, response and communication.
OUTAGES PER CUSTOMER
INDUSTRY
1.025
0.82
APS

PNW CRR 12
ETHICSAPS is committed to operating with the highest degree of integrity and protecting and enhancing our company’s reputation. We expect our employees to act with integrity in everything they do. Our Code of Ethics and Business Practices (the Code) guides all our decisions, and its fundamental tenet is “do the right thing.” The Code and our Political Participation Policy describe how employees interact with public officials. The Public Policy department takes the lead on interactions with state and federal officials. We maintain strict adherence to the laws governing campaign contributions and political action committees (PAC). A formal PAC is available to employees who elect to contribute.
The Code also covers subjects such as the employee workplace, business integrity, operational excellence, financial records and controls, disclosures of potential conflicts of interest, records privacy and security, and legal and regulatory compliance. It sets ethical expectations for contractors and third-party agents when working with or on behalf of our company. Employees, contractors and others who work with our company are strongly encouraged to report any concerns related to the Code or any other issue regarding potential illegal or unethical conduct. They may go to the Ethics Office or use the company’s helpline if they have ethics concerns. A third party staffs and operates the helpline and helpline website 24 hours a day, seven days a week, and provides a safe haven for anyone to ask questions or report concerns anonymously.
The company also has adopted a Code of Ethics for Financial Executives, which promotes honest and ethical conduct and compliance with applicable laws, rules and regulations, particularly as related to the maintenance of financial records, the preparation of financial statements and proper public disclosure.
APS’s reputation for doing the right thing enables us to build long-term, trusting relationships. Customers, partners and stakeholders trust the quality of our products and services. Our strong and stable ethical culture helps us attract and retain talented employees.
MORE THAN
$10MILLION
GIVEN BACK TO THE COMMUNITY
A-OR EQUIVALENT
PNW CREDIT RATINGS

PNW CRR 13
6,400 EMPLOYEES

PNW CRR 14
In the midst of emerging technologies and evolving customer behaviors that are changing the future of energy, APS is building a smarter energy infrastructure to ensure success as a next generation energy company. The industry in general is investing in an increasingly digital and distributed grid network that is a platform for new technologies, providing increasingly customized services to meet customer needs and expectations, and forming relationships with technology companies to enhance products and services to customers.
At APS, we are at the forefront of utilities studying and deploying advanced infrastructure to enable reliable and cost-efficient integration of emerging technologies, both into the grid and with customers. As we integrate these new technologies and approaches with our current solutions, we enhance reliability, increase productivity and better serve our customers.
ENERGY INNOVATION

Our energy innovation work has three primary focus areas:
• Advanced grid technologies, the focus of which is automated metering infrastructure, control of the grid and advanced grid data analytics and visualization;
• Technology assessment, the focus of which is rooftop solar research and development, solar innovation study, energy storage and microgrids; and
• Business performance innovation, or new ways of doing business, such as joining the Energy Imbalance Market and interacting with customers through a new technology platform called Project Cinergy.
1.7MILLION
FIELD ORDERS AVOIDEDFROM AMI TECHNOLOGY
PNW CRR 15
$20MILLION
COST SAVINGSFROM AMI TECHNOLOGY
10
25MW MICROGRID
AT MARINE CORPS AIR STATION YUMA (THE FIRST MILITARY BASE
WITH 100 PERCENT BACKUP POWER)
SOLAR PARTNER PROGRAM
1,500CUSTOMERS
MW APS-OWNED ROOFTOP SOLAR

PNW CRR 16
AUTOMATED METERING INFRASTRUCTURE
The strategic deployment of advanced two-way communicating (“advanced grid”) devices enables us to have greater visibility to, and automation of, the power grid to more efficiently manage this dynamic system. This technology also provides more timely information to customers to help them manage their individual energy needs.
APS has reached full deployment of its Advanced Metering Infrastructure (AMI), with 1.25 million meters installed, including over 41,000 meters on solar residential systems. Because of this advanced diagnostic technology, more than 1.7 million field orders have been avoided, resulting in nearly $20 million in cost savings. These savings are achieved through multiple means: reduced system costs through remote meter reads and service connections; minimized system outage durations; and improved customer access, awareness and proactive management of their energy use.
CONTROL OF THE GRID
APS is investing in state-of-the-art technology through an initiative called Project Illuminate, which will modernize the systems our employees use
to operate the electric grid from our control centers. The current platform was designed for the traditional grid, a one-way power flow starting with a large power plant and gradually making its way through a series of electrical components until the power reaches our customers. This platform has allowed APS to maintain top quartile reliability and customer service, but we must build a smarter energy infrastructure to respond to all the new technology developed over recent years. Project Illuminate is designed for the future, paving the way for APS to integrate more renewable resources, while ensuring the reliable service our customers deserve and expect. This new technology allows us to respond faster to restore the grid when storms damage our system by enabling APS employees to quickly see the precise location of the storm damage without ever leaving our control center. Finally, Project Illuminate also will utilize mobile technology to connect our field personnel with our control centers, putting more information at the fingertips of our employees, which in turn will improve our ability to more effectively serve our communities across our vast almost 35,000 square mile service territory.
ADVANCED GRID DATA ANALYTICS AND VISUALIZATIONAdvanced Grid Data Analytics and Visualization are a series of software applications designed to leverage APS’s investments in various data sources to transform raw data into business intelligence. This is critical because it allows us to make expedient and effective use of field data to make smarter, faster business decisions. Leveraging real-time information will allow us to proactively address equipment failures before they happen, operate the grid more efficiently and provide better customer service. Already, we have integrated advanced meter data with other systems such as the Geographic Information System (GIS) and the Customer Information System (CIS).
1.25MILLIONADVANCED METERS
INSTALLED IN OUR SERVICE TERRITORY

PNW CRR 17
In 2015, APS’s Technology Innovation and Integration department launched two applications that aggregated and correlated data from multiple systems:
• Solar Forecasting and Visualization provides a system-wide geographic view of how distributed energy resources, such as rooftop solar, contribute to overall APS net energy production on an hourly basis.
• Voltage Exceptions show the number of instances an advanced meter records when the energy delivered is outside of a specified voltage range. Distribution planners and engineers use the application to visualize areas where voltage alarms occur and proactively address them before they affect electricity service to customers.
New capabilities will continue to be added to the two applications, and these will serve as part of a foundation to afford greater access to information and easy-to-use analytics at APS.
ROOFTOP SOLAR RESEARCH AND DEVELOPMENT In 2015, APS launched the Solar Partner Program, the nation’s first utility-owned rooftop solar research and development program, in which we have direct control of advanced inverters through a central control system. The program allows APS to partner with customers and local solar installers to bring more solar energy to communities across the state, all while contributing to the local economy by keeping jobs and money in Arizona. Up to 10 MW of power will be generated through the APS-owned and maintained rooftop solar systems, which will be made available to approximately 1,500 eligible customers.

PNW CRR 18
$3.6BILLIONIN INFRASTRUCTURE
INVESTMENTSOVER THE NEXT THREE YEARS
As of April 2016, we have already installed 1,153 of these systems on eligible customers’ homes. The systems installed as part of this program allow APS to conduct ground-breaking research on how to use advanced inverters to integrate solar and other technologies onto its existing grid. APS is working in conjunction with EPRI and will share the information gained from the study across the industry, as well as with academia and consumer advocacy groups.
A unique aspect of the program is that it makes rooftop solar available to customers who may not otherwise be able to obtain it. Working with nonprofit partners and community action organizers, APS offers the installation of systems at the homes of limited-income customers whenever possible. Participants receive an annual $360 savings on their electric bills through the life of the 20-year program. The program also aims to test solar systems that face west to southwest to capture sunlight late in the afternoon when peak demand occurs.
SOLAR INNOVATION STUDYOur Solar Innovation Study is a state-of-the-art initiative that will examine the integration of distributed energy resources (DER), such as rooftop
solar, battery storage, home energy management systems, smart thermostats and multi-stage, variable speed HVAC systems, with demand-based rates. The study will test ways customers can employ DER technologies to manage their energy use while using price signals that encourage customers to shift their energy use to align with system requirements. Data from the study will be used to expand industry-wide knowledge and enable the efficient use of DERs that are either available or are emerging in today’s advanced energy market. APS will choose 75 single-family homes in the Phoenix metro area to participate in the study.

PNW CRR 19
The Solar Innovation Study is a step forward in our move toward a future that includes modernized rate structures and realistic pricing signals that drive market innovation and technological development. This initiative will give our customers more control over their energy use, while allowing us more flexibility to integrate new energy solutions into the grid.
ENERGY STORAGEBattery storage is a growing technology that has the potential to increase the value of intermittent generation resources as well as increase grid reliability and stability. Besides simply storing and dispatching power, batteries have the ability to provide other ancillary services such as voltage regulation. Energy storage makes renewable resources more useful for APS by better aligning the availability of power with APS’s peak energy demand. The APS system peak demand is in the evening when many customers get home from work and turn on lights, televisions and air conditioners. However, by that time, solar systems have largely stopped producing for the day. With storage, solar energy can be harvested during the day and dispatched in the evening when it provides the greatest benefit to our customers and the grid.
APS is invested in developing a long-term energy storage strategy that includes the following:
• Evaluating emerging technologies and applications to determine the potential cost-benefit of using these technologies at various locations on the APS grid;
• Evaluating system impacts from customer adoption of stand-alone batteries and combinations of batteries with other technologies as part of the Solar Innovation Study;
• Developing funding approaches and proposing regulatory structures that allow the development of energy storage projects within the regulated utility model;
• Developing processes and procedures for incorporating energy storage into APS’s day-to-day operations and maintenance; and
• Procurement, construction and maintenance of a new storage portfolio.
As part of the Solar Partner Program, APS is constructing two battery systems, at two MWh each, in order to advance its knowledge in the above mentioned areas. In addition, the Solar Innovation Study is investigating residential-scale batteries. APS is conducting an all-source request for proposal in 2016, meaning storage providers can bid energy storage solutions in the form of purchase power agreements to meet APS’s resource needs in the future. Lastly, APS’s Technology Innovation and Integration, Distribution Planning and Engineering, and Resource Management departments continue to look for opportunities to use storage on the grid.
MICROGRIDS
A microgrid is a small-scale power grid that can operate independently or in conjunction with APS’s distribution grid. In November 2015, APS announced a partnership with the Department of the Navy to develop a low-emission microgrid network that can generate 25 MW of electricity at the Marine Corps Air Station (MCAS) Yuma, located in Yuma, Arizona. The system will provide 100 percent of the backup power needed for the MCAS Yuma in the event of a grid disruption, thus enhancing the reliability and security of the base.
The base will benefit from backup power generation, while APS will obtain flexible peak power generation as well as system frequency response and other

PNW CRR 20
ancillary services for its customers. In addition, APS announced a partnership with Aligned Data Centers in March 2016 for the development of what will be a 63 MW microgrid project at Aligned’s Phoenix data center. As with the MCAS Yuma microgrid, this project will provide 100 percent backup power for the facility as well as peak generation and ancillary services for APS’s customers at large.
ENERGY IMBALANCE MARKET The Energy Imbalance Market is the only five-minute energy market in the western United States, providing participating utilities with more efficient and f lexible operations. The EIM was launched in 2014 by the California Independent System Operator (CAISO) and Portland-based PacifiCorp. In late 2014, APS began researching the EIM to determine if market participation would benefit APS’s customers. In May 2015, APS announced its decision to begin participating in the EIM starting in October 2016.
Participating in a system that will automatically balance supply and demand for electricity every five minutes will enable APS to dispatch less expensive electricity and optimize our ability to generate electricity in the most efficient and cost effective manner for our customers. According to a third-party assessment and APS’s analysis of costs, APS customers could save between $7 million to $18 million annually through APS’s participation. In addition to these savings, participation in the EIM is expected to improve integration of renewable resources.
PROJECT CINERGY Project Cinergy is a new customer information system that will transform the way APS conducts business and employees interact with customers. Between now and 2017, we will be transitioning our customer interface system to a customer care and billing (CC&B) platform, a leading browser-based
system used around the world by industry-leading utilities. The project is a significant investment and implementing CC&B will deliver multiple benefits to APS and our customers, including:
• Managing our business. This project will update and consolidate multiple systems that we use throughout APS today, many of which do not communicate with each other or to our current customer information system;
• Responding to customer expectations. CC&B will allow us to keep up with industry trends and bring enhanced and timely solutions that our customers expect; and
• Positioning us for the future. Our ability to be nimble and flexible allows us to provide competitive rates and other programs and services to our customers.
LOOKING AHEADAs we move forward in 2016, we will maintain and improve upon these projects in order to continue to provide our customers the excellent service they have come to know and expect from APS. Our major energy innovation initiatives in 2016 include:
• Developing 10 additional data analytic applications that target multiple business units;
• Beginning participation in the Energy Imbalance Market;
• Installing two battery storage systems to increase the value of intermittent generation resources as well as increase grid reliability and stability; and
• Investing an additional $3.6 billion in infrastructure enhancements over the next three years.

PNW CRR 21

PNW CRR 22
At APS, safety and security is everyone’s responsibility. Safety and security includes: employee safety, public safety, cybersecurity, data privacy, physical security, and the implementation of Critical Infrastructure Protection (CIP) version 5 requirements.
Employee safety is of paramount concern and a strong focus at APS. We want all employees to go home in the same condition as they came to work.
In the last five years, we have reduced the number of Occupational Safety and Health Administration (OSHA) recordable injuries by 37 percent. Our new challenge is improving on good to become the best. New areas of focus include grass-roots safety committees that give employees ownership of local safety performance and improved tracking of close calls (incidents that didn’t cause an injury but could have) to remedy potential hazards and prevent future injuries.
SAFETY AND SECURITY

PNW CRR 23
Educating the public about electrical safety is another important component of our safety work. We reach thousands of Arizonans each year with our public safety programs, including our electrical safety trailer presentations in which line workers show first-hand what contact with electricity can do to a hot dog “hand” or grapefruit “head.”
In addition, our Benjamin FranKlown program brings age-appropriate messages about electrical safety to more than 15,000 students across Arizona each year.
In a world of evolving security threats, keeping our data and operations secure is an increasingly critical area of focus. We have established strong data privacy controls across the organization and use a variety of protective methods to safeguard vital systems. Employees are an important line of defense, and all have completed cybersecurity awareness training. Strong physical security around our facilities and assets, from power plants to transmission towers to substations and beyond, is also critical to our mission of delivering reliable power to our customers.
73%
REDUCTIONIN OSHA-RECORDABLE
INJURIES TO EMPLOYEES SINCE 2005
15,000+STUDENTS
PARTICIPATED IN
BENJAMIN FRANKLOWN ELECTRIC SAFETY
PROGRAM
2.1MILLION
UNIQUE PERSONAL DATA RECORDS
PROTECTED
1,346DISTRIBUTION CIRCUITS
MONITORED BY TROUBLEMEN ON SAFETY LINE PATROL

PNW CRR 24
EMPLOYEE SAFETYAPS’s industrial safety performance is in the top 10 percent within the electric utility industry. The number of APS employees seriously injured on the job has declined by 73 percent over the last 10 years. We ended 2015 with 43 OSHA recordable injuries, the second lowest number of serious injuries on company record, and a slight improvement over our 2014 injury numbers.
In addition to having fewer injuries, our employees are generally experiencing less serious injuries, as measured by how many days they miss work due to injury. OSHA’s Severe Injury Rate (SIR) compares how many days are lost to the number of hours worked. The fewer days missed from work, the lower the rate. The SIR in 2015 was less than a third of what it was just five years ago, demonstrating another way we are improving our safety performance.
2008 2009 2010 2011 2012 2013 2014 2015
10897
6858
4736
44 43
OSHA-RECORDABLE INJURIES
Forty-three of our employees sustained OSHA-recordable injuries in 2015. This is 37 percent fewer people than in 2010. Our new challenge is improving on good to become the best—driving to zero.
2008 2009 2010 2011 2012 2013 2014 2015
16.4
9.11
5.16
9.46
5.43 4.96
2.16 2.91
SEVERE INJURY RATE
APS employees are generally experiencing less severe injuries. Our actions to improve our safety programs and safety messaging is correlating to a favorable decrease in the Severe Injury Rate.

PNW CRR 25
While we have significantly improved our safety performance in the last decade, our ultimate goal remains zero injuries. To get there, we are looking for new ways to empower employees to take ownership of our safety culture. We now have more than 40 employee-driven safety committees that leverage our employees’ safety knowledge, enthusiasm and creativity. These committees provide grassroots opportunities for frontline employees to influence their local safety culture and performance.
To foster a safety-conscious culture in our newest employees, the Corporate Safety and Corporate Training departments have developed a safety orientation class for new hires. This three-hour class is one of many steps we are taking to continue to enhance our solid safety foundation. Class participants learn the basic principles behind employee safety, human performance, event reporting requirements and the safety resources available to support them. We will present the training to employees within the first 90 days of their employment.
In 2015 we continued our drive to improve reporting and tracking of injuries and other safety events. With better tracking, we can improve our understanding of the circumstances and behaviors that led to these events and how to prevent them in the future. In addition, we now track “close calls” and “good catches,” situations that could have but did not lead to injuries. Tracking these potential events and pairing the results with data derived from our behavioral observation program provides important leading indicators to reduce and eliminate events in the future.
Our human performance program also is driving better safety performance. Human performance is the science that helps us understand the nature of errors, both human and systemic. This science provides us insight into what influences human behavior and leads to positive performance results so that we can achieve operational excellence and protect our employees, customers, assets and environment from significant events. Our human performance team works with APS leadership

PNW CRR 26
across the company to focus efforts on integrating human performance principles into company practices, including the proactive identification and correction of error-likely situations.
Leaders within Transmission and Distribution recently completed a hands-on, practical human performance refresher course that helped them apply leader-specific tools to predict and prevent error-likely situations and defined relevant applications of human performance within their various teams. Additionally, Fossil Generation employees participated in refresher training sessions that reinforced information about common error traps and how to prevent them.
Corrective action programs are common in the nuclear industry but less common in the non-nuclear electric utility world. APS is one of the few electric utilities in the nation to have a robust and effective corrective action program for its nuclear operations, non-nuclear operations and corporate side of the company. Our corrective action program is at the heart of our culture of continuous improvement and allows us not merely to patch problems but instead to identify the root causes and implement corrective actions, thereby preventing those problems from recurring. The corrective action program focuses on events related to people, processes, procedures and equipment to ensure timely identification and resolution of issues. Integrating the corrective action program into the daily workflow of our employees results in an APS that is safer and more efficient, and that perpetuates sustainable continuous improvement.
PUBLIC SAFETY
Ensuring the safety of the public is a priority for APS. We focus our public safety efforts in three areas: educating our customers and the general
public about electrical safety; ensuring the safety of contractors working on and around our facilities; and maintaining our assets in a safe condition that does not pose a threat to the public.
Through outreach to the news media and public, we raise awareness on topics such as safety around downed electrical wires, maintaining safe working distances around overhead lines and responding appropriately if unsafe electrical equipment conditions are found. We also provide electrical safety programs that are audience-tailored and focus on increasing safety awareness about electricity and electrical equipment. In 2015, we reached over 7,000 first responders, contractors and municipal, state and county workers with our electrical safety trainings. Our line workers also visually and viscerally demonstrate the power and danger of electricity using our electrical safety trailer. We used this trailer to conduct 78 electrical safety demonstrations statewide to over 3,300 participants in 2015.
Contractors working near APS facilities are a safety risk to themselves and their employees, as well as a reliability risk for our facilities. In 2015, contractors had eight contact incidents with overhead lines. That’s eight too many, but it continues a positive downward trend over the past six years. Our public safety team responds in real time to contacts with overhead, buried lines and equipment damage. Our public safety team also provides educational presentations to contractors to help ensure safe work practices. APS continues to partner with AZ 811 (an excavation notification service in Arizona) and participated in 20 damage prevention seminars throughout the state in 2015.
Our distribution system troublemen conduct annual safety line patrols for all of our overhead distribution circuits statewide. In addition, our

PNW CRR 27
transmission system linemen conduct annual safety line patrols on all 605 transmission sections. In support of this work, public safety consultants perform annual line patrol and substation security audits throughout the service territory and numerous field inspections, consultations and risk assessment activities. We also work closely with hauling companies and the Arizona Department of Transportation to ensure safe travel and clearance of oversized loads where our infrastructure crosses state highways. In 2015, we surveyed nearly 300 electric line road crossings in Arizona to lower costs, reduce risks to the public and ensure system reliability. This survey provided important height and clearance information that has significantly reduced load conflicts and the amount of worker support needed for oversize load transport.
CYBERSECURITYSafeguarding the technology we rely upon to deliver power to our customers is becoming an ever more challenging feat, as cyber criminals, hacktivists and hostile nation states become increasingly adept with invasive technologies. Cybersecurity attacks are becoming more frequent and more sophisticated across numerous industries. We take very seriously our obligation to prepare our people, our programs and our technologies for the inevitable increase in
attacks. With strong support from executive management, we are prepared for the challenge.
Our cybersecurity program begins with user security awareness. All employees are required to take cybersecurity training, and the Information Systems Security team holds quarterly town halls, security forums and other meetings to raise awareness about developing threats and risks to the company. We also perform quarterly awareness testing to assess our employees’ susceptibility to attacks, such as phishing. By raising employees’ awareness about security threats and their role in protecting the company, we are building a stronger cybersecurity culture.
APS also conducts quarterly tabletop exercises to simulate emergent threats and scenarios that may arise due to cybersecurity attacks. The tabletop exercises ensure that incident response and business restoration procedures are up to date and effective in the event of an attack. We actively monitor for emerging cybersecurity threats 24 hours a day, seven days a week. Our cybersecurity Security Operations Center ensures APS has the capabilities to protect, detect, alert, contain and mitigate attacks in real-time. To enhance our capabilities and provide improved threat intelligence, we have active
100%OF EMPLOYEES COMPLETED CYBERSECURITY TRAINING

PNW CRR 28
relationships with federal and state agencies, fellow utilities and private sector information-sharing organizations to collaborate and share best practices and information regarding new attacks facing our industry.
DATA PRIVACYWe are committed to keeping customers’ sensitive information safe and secure. Using Generally Accepted Privacy Principles (GAPP), we have strengthened internal controls to ensure safe handling of customer information the entire time APS holds customer data. Notice is provided to our customers and employees regarding the business purpose for utilizing their sensitive information. Access to information is tracked, managed and approved by data owners. Third-party vendor relationships are thoroughly reviewed from a security and data privacy perspective, ensuring our vendors have proper security controls in place to safeguard customers’ personally identifiable information. All employees who use sensitive information are required to participate in annual training around the use, retention and disclosure of customer and other sensitive information.
Working with our data privacy and supply chain teams, we ensure the company is protected by requiring that cybersecurity is accounted for in contracts with new and existing partners. With use of cloud-based solutions becoming more common, we require each of our vendors to have good security practices and controls, and we work with these partners to ensure our customers are protected from potential third-party data loss. APS has relationships with many different vendors, and we require their security and data privacy standards to follow industry best practices as well as applicable regulations. By evaluating a vendor’s internal controls and monitoring reputation and financial standing, we further protect sensitive information and the power grid.
PHYSICAL SECURITY
APS is dedicated to protecting company assets and providing a safe and secure work environment for company employees and guests. We ensure this by identifying and mitigating current and anticipated physical security threats to the company, intelligence monitoring, detection, deterrence, and effectively responding to incidents and reports.
In 2015, APS developed a new Physical Security Index metric designed to measure the company’s overall physical security health, including security awareness, defensive posture and resiliency, with a goal to improve 3 percent year over year.
Threats of sabotage to our country’s energy generation sites and electric transmission and delivery systems are real and on the rise. Substations are often remote and unmanned. In 2015, we completed installation of enhanced security systems at three critical substations and began construction of enhancements on a fourth site as part of a larger substation hardening project. In 2015 alone, we made capital investments of $7.5 million on new substation site security systems, including:
• Perimeter fence enhancements;
• Vehicle barrier systems at critical sites;
• Intrusion detection systems;
• Cameras for assessing alarms and monitoring activity; and
• Access controls that limit entry to approved personnel and that alarm when breached.
Between now and the end of 2019, we plan to invest an additional $27.3 million in substation security, securing 15 additional substations as part of this hardening project.

PNW CRR 29
Securing the facilities where our employees work is important. In 2015, we spent $565,000 upgrading security systems and installing new systems to help keep employees safe. Workplace security improvements projected at $1.6 million will continue into 2016. These include new security measures at our corporate headquarters and improved perimeter protection at several business locations.
CIP VERSION 5 IMPLEMENTATION The North American Electric Reliability Corporation (NERC) Critical Infrastructure Protection (CIP) standards are regulations intended to help secure North America’s electric grid from cyber and physical attacks that could disrupt generation or transmission. We have been subject to CIP standards since 2008. Over time those standards have evolved to include 11 standards and 250 individual requirements. Ten of the standards focus on protecting the critical cyber systems in larger substations, power plants and control centers. The remaining standard focuses on physical security protections for certain large substations critical to grid reliability.
Today, we are implementing the latest version of the 10 cyber-related regulations. This multi-year implementation (2012-2018) greatly expands the scope from a couple hundred centrally located cyber assets to a few thousand spread across the APS service territory. In 2015, we spent over $16 million implementing these new regulations, including physical and electronic security and monitoring, incident response and training. About $7 million was spent to modernize large substations and power plants to enhance security and monitoring at some of our most critical facilities.
In addition to the cyber-related regulations, new CIP regulations mandating physical security protections at certain large transmission substations and their
associated primary control centers became effective in October 2015. Applicability of the regulations is tied to grid reliability, which is determined by engineering flow studies.
LOOKING AHEADAs we look to the future, we strive to continually enhance our physical and cybersecurity programs to adapt to emerging threats and implement employee safety initiatives that will continue to drive our safety performance. Our 2016 focus areas include:
• Fostering a grassroots culture of safety accountability by frontline employees;
• Reinforcing and strengthening our safety management system;
• Increasing the outreach and number of presentations provided through our electrical safety trailer program;
• Raising cybersecurity awareness and educating our internal users about social engineering and phishing attacks;
• Enhancing our mandatory training programs to include additional safeguards for handling sensitive information as well as recognizing emerging attacks against our industry;
• Enhancing our emergency response procedures; and
• Continuing to implement CIP regulations, expanding the footprint to nearly 60 locations.
Water plays a vital role in our business. As a major electric utility in the desert southwest, the acquisition and utilization of water is even more important for APS than for most utilities. Of the types of water used in Arizona, the highest percentage (43 percent) is groundwater, which is considered a non-renewable water resource. Conservation of this non-renewable resource is a focus area for APS, and we have a new company-wide goal of reducing groundwater use.
We are committed to ensuring we use our water resources as efficiently as possible. One of the most efficient uses of water in the desert is the reuse of water. APS, and the Palo Verde Nuclear Generating Station in particular, has provided national and international leadership on the use of reclaimed water for power generation. A full
68 percent of the water we used in our generating facilities in 2015 was reclaimed water.
Our water use and efficiency objectives are driven by our Water Resource Management Strategic Plan, which provides APS timely and reliable information to manage our water resources portfolio efficiently and effectively. The plan also helps ensure that we have long-term water supplies and water contingency plans for each of our facilities, even in times of extended drought. Each APS power plant has a unique water strategy, developed to promote efficient and sustainable use of water. In addition, other efforts, such as retiring or upgrading water-intensive power plants and increasingly using renewable energy and implementing energy efficiency, add to our overall water conservation.
WATER RESOURCES

PNW CRR 31
8%OUR GOAL FOR
GROUNDWATER USE REDUCTION
IN 2016 COMPARED TO 2014
20%
OUR GOAL FOR INCREASED WATER EFFICIENCY
OVER THE NEXT DECADE
20BILLION
GALLONS OF MUNICIPAL EFFLUENT USED ANNUALLY BY PALO VERDE GALLONS OF WATER USED
2014
35,96436,502
2015
WATER INTENSITY (GALLONS PER MWH GENERATED)
2014
653683
2015
SURFACE WATER
15%16,512 AF
RECLAIMED WATER
68%75,384 acre feet (AF)
GROUNDWATER
17%18,473 AF
APS 2015 FLEET WATER USE BY SOURCE TYPE

PNW CRR 32
ENSURING ADEQUATE WATER RESOURCESArizona is one of the five fastest growing states in the nation. In order to meet a growing energy demand, compounded by the likelihood of continued pressure on water supplies in the arid southwest, we must responsibly and appropriately secure water contracts and water rights to meet the needs of future power generation.
We strive to improve our water use efficiency by evaluating advances in technologies such as alternative cooling and water treatment that will reduce consumptive use of water. We participate in the EPRI Water Research Center’s membrane treatment and cooling tower technology research. As a result of our research, we will be implementing state-of-the-art hybrid cooling technology on the new units being constructed as part of our Ocotillo Power Plant modernization project. This hybrid cooling technology will allow these units to use 80 percent less water per MWh.
WATER USAGE AND INTENSITY Because our goal is to maximize use of renewable water resources and minimize use of non-renewable resources, it is important for us consistently to monitor our water use, both in terms of the amount of water used and the water intensity. In 2015, we saw both our water usage and water intensity decrease.
Over the next 10 years, we plan to reduce our water intensity company-wide by 20 percent. As power plants get older and are eventually retired, we plan to replace these more water intensive units with newer, more water-efficient technology, such as the hybrid cooling systems that we will use at Ocotillo.
These type of upgrades, as well as conducting water efficiency audits of power plants, implementing leak reduction programs, and ensuring equipment is functioning as designed, will help us achieve our new Tier 1 metric for conserving non-renewable water resources. Our 2016 target is to reduce our use of groundwater by 8 percent compared to 2014 usage.
PALO VERDE AND ZERO DISCHARGEThe Palo Verde Nuclear Generating Station is the only nuclear plant in the world that is not located next to a large body of water. Instead, it uses treated effluent, or wastewater, for plant cooling. Wastewater is transported to Palo Verde through 36 miles of underground pipe from the 91st Avenue and Tolleson Wastewater Treatment Facilities. Unlike other nuclear plants, Palo Verde maintains “zero discharge,” meaning no water is discharged to rivers, streams or oceans. Instead, we recycle more than 20 billion gallons of municipal effluent each year to meet the plant’s cooling needs, thereby significantly reducing the need for surface water or groundwater.
At Palo Verde, the effluent undergoes further treatment at the plant’s water reclamation facility, one of the world’s largest advanced water treatment facilities. Treated water is stored in the plant’s 85-acre and 45-acre reservoirs for use in the cooling towers.
WELL HEALTHWater resources at power plants are a critical component of plant reliability and plant capacity factors. Because plant operations depend on water, we have implemented a well health program that
40000
39000
38000
37000
36000
35000
APS OPERATED WATER USAGE
690
680
670
660
650
640
630
620
610
G/M
Wh
MIL
LIO
N G
ALL
ON
S
WATER USEWATER INTENSITY
200837239
643
200937973
636
201038522
668
201138971
667
201239794
650
201337918
670
201436502
683
201535964
653

PNW CRR 33
will reduce unplanned well and pumping equipment failures, minimize the risk of power curtailments and reduce costly repairs.
We are also developing well-field operations plans for our power plants. These plans will result in more efficient use of higher quality groundwater, decreased water consumption and more strategic use of water resources.
Our Water Resource Management team has established an extensive data collection, reporting and dashboard system that is used to track water use and performance throughout the company. On a continual basis, we use this information to evaluate the performance of the company and to plan for future improvements that maximize our efficient use of water.
AQUIFER STORAGE AND RECOVERY Arizona has been storing excess water in the ground since the 1990s as a contingent supply, to supplement surface water supplies during times of shortage. The Arizona Water Banking Authority has stored 3.4 million acre-feet in Arizona’s aquifers since 1996. APS recognizes the benefits of aquifer storage and recovery (ASR) and has investigated multiple sites at strategic locations that could serve as future assets to support generation facilities. Potential sources of water for use at an ASR include brackish groundwater, reclaimed water and remediation water. APS will continue to investigate alternatives like these that provide reliable water in support of our generation resources.
KYL WATER INSTITUTEIn 2014, the Kyl Center for Water Policy was formed as a research, analysis and collaboration entity at the Morrison Institute for Public Policy at Arizona State University, to promote sound water policy and stewardship in Arizona. APS has committed support
to the Kyl Center and executive APS Leadership serves on the Center’s Board of Advisors. Through participation in the Kyl Center, we are actively engaging in discussion of the water economy, water-energy nexus, water rights, drought, water costs, and policy solutions that are important to our customers, our company and our state.
COLLABORATIONAPS actively engages and collaborates with federal and state agencies and governments, local community members and Native American tribes regarding water issues. APS works with entities such as Sandia National Laboratories, EPRI, the U.S. Department of Energy and Idaho National Laboratory, among others. APS is currently participating in a critical watersheds project with four national laboratories and the U.S. Bureau of Reclamation to evaluate possible impacts of climate change on water supply demands and energy operations in the Colorado River Basin.
LOOKING AHEADAPS continues to strive for sustainable and cost-effective water supplies for energy production. Our 2016 initiatives include:
• Achieving our new Tier 1 metric to reduce consumption of non-renewable water resources by 8 percent over 2014 levels; and
• Reducing water intensity company-wide by 20 percent over 10 years by:
o Replacing older, less efficient units at power plants with units that use newer, more water efficient technology;
o Further developing renewable energy that requires little or no water; and
o Continuing to promote energy efficiency programs that reduce the energy needed by our customers.

PNW CRR 34
Delivering safe, reliable, affordable energy to our customers requires a balanced energy mix, something APS has achieved with a combination of traditional and renewable sources of energy. As we continue to provide our customers with increasingly cleaner energy, that mix remains balanced. But it is changing.
By closing coal units, modernizing natural gas plants, deploying renewable energy and energy efficiency, and operating Palo Verde Nuclear Generating Station, the country’s largest source of carbon-free energy, we are reducing our carbon footprint. APS is proud to be a leader in Arizona with an energy transition that will fulfill our mission to create a sustainable energy
future for the state. In 2015, 47 percent of our energy came from carbon-free resources, and we expect renewable energy and energy efficiency to meet over 50 percent of our energy growth through 2031.
Our efforts to reduce our carbon footprint are not limited to energy generation. We also have increased the efficiency of our facilities and transportation fleet, lowering our own energy usage and reducing vehicle emissions. Through these combined efforts, we avoided 3.8 million metric tons of carbon dioxide emissions that otherwise would have been emitted in 2015. This is equivalent to removing over 800,000 automobiles from the road.
CARBON MANAGEMENT

PNW CRR 35
GENERATION PORTFOLIO BY RESOURCE
2016
26% GAS
26% NUCLEAR
25% COAL
12% ENERGY EFFICIENCY
11% RENEWABLES
GENERATION PORTFOLIO BY RESOURCE
2031
36% GAS
18% NUCLEAR
18% RENEWABLES
14% COAL
14% ENERGY EFFICIENCY
820MW OF COAL GENERATION
RETIRED OVER THE LAST THREE YEARS
548GIGAWATT-HOURS
OF SAVINGSFROM 2015 ENERGY EFFICIENCY PROGRAMS
47%OF OUR 2015 ELECTRICITY CAME FROM
CARBON-FREE RESOURCES
8%REDUCTION IN 2015 APS VEHICLE FLEET
CARBON EMISSIONS
ENERGY USAGE IN APS FACILITIES (MWH)
2014
28,811 29,317
2015
2015 CARBON AVOIDANCE (MILLION METRIC TONS)
GOAL
2.5
3.8
ACTUAL

PNW CRR 36
COAL REDUCTIONIn 2015, we permanently retired one coal-fired unit at our Cholla Power Plant located in Arizona. Additionally, we are developing plans to stop burning coal in our other Cholla units by mid-2025. The retirement of the Cholla coal-fired unit in 2015 followed the closure of three coal-fired units at our Four Corners Power Plant, located on the Navajo Nation, in 2013. Our proactive coal reduction strategy is expected to reduce the share of coal-fired energy in our generation mix from the current level of 25 percent to about 14 percent by 2031.
With the closure of these four units, we have retired a cumulative 820 MW of coal-fired generation since 2013, which resulted in a regional reduction of carbon emissions of approximately 29 percent. The closure of the one unit at Cholla and the three units at Four Corners also resulted in collateral emission reductions: nitrogen oxide emissions were reduced by 36 percent, particulate emissions by 43 percent, sulfur dioxide emissions by 29 percent, and mercury emissions by 63 percent.
Overall, in 2015 carbon emissions from our fossil generation fleet totaled 13.6 million metric tons. This is 1.7 million metric tons fewer than 2014, representing an 11 percent decrease in carbon emissions. We also saw an equivalent reduction in the carbon intensity of our fossil generation fleet, which dropped to 1,091 pounds per MWh in 2015 from 1,219 pounds per MWh in 2014.
LARGEST SOURCE OF CLEAN ENERGY APS is the operator of the Palo Verde Nuclear Generating Station and owns or leases 29.1 percent of the facility. Palo Verde is our largest single source of carbon-free energy generation. In 2015, Palo Verde achieved its 24th consecutive year as the nation’s largest power producer and, for the 10th time, exceeded its own record for power generation, producing 32.5 million MWh and beating its
previous best of 32.3 million MWh. Palo Verde is the only generating facility in the nation to produce more than 30 million MWh in a year, a feat the plant has achieved each of the past seven years and a total of 11 times.
Since it began operation in 1986, Palo Verde has produced more than 750 million MWh, providing environmentally friendly energy to more than 4 million people. About half the plant’s output serves Arizona customers, with the remaining power spread among California, New Mexico and west Texas.
CONTINUED EXPANSION OF SOLAR ENERGYAPS completed two new solar plants in 2015 under our AZ Sun program. The Desert Star Solar Plant is located at the City of Phoenix SR-85 Landfill and the other is located at the Luke Air Force Base in Litchfield Park, Arizona. These solar facilities have a maximum generation capacity of 10 MW each.
These two solar projects conclude our AZ Sun program, which now generates 170 MW from nine solar installations across Arizona and brings our
24 CONSECUTIVE YEARS
PALO VERDE HAS BEEN NATION’S
LARGEST CARBON-FREE ENERGY PRODUCER

PNW CRR 37
overall solar portfolio to more than 950 MW. The AZ Sun program has advanced Arizona’s solar leadership, evidenced by the state’s number two spot in the nation for overall solar growth as measured by the Solar Electric Power Association.
The Desert Star Solar Plant represents the growing trend of collaboration between government and private industry to efficiently develop renewable energy choices. The City of Phoenix is leasing the land to APS, and this solar project will help APS achieve a goal of meeting 15 percent of energy generation with renewable energy by 2025. Desert Star consists of more than 50,000 photovoltaic panels mounted on single axis tracker steel frames spread across 188 acres of land. The eight-month construction project employed nearly 250 workers during its term, with 140 crew and support staff at its peak. By providing on-site training in grid-scale solar construction for workers in pile driving, tracker assembly and panel installation, the Desert Star Solar Plant was instrumental in establishing the foundation for a new skilled labor force in solar construction.
The second facility, at Luke Air Force Base, became fully operational in the summer of 2015. The plant was built on 106 acres of land leased from Luke. More than 200 local jobs were created during construction of this project.
ENERGY EFFICIENCY PROGRAMS
APS has a long history of developing and delivering successful energy efficiency programs. APS has earned the U.S. Environmental Protection Agency’s (EPA) prestigious ENERGY STAR® Partner of the Year award for 10 straight years. Additionally, 2016 marked the seventh year in a row that EPA awarded APS with its highest honor—the ENERGY STAR® Sustained Excellence Award—for continued leadership in protecting the environment through
energy efficiency. The company also has been recognized for exemplary energy efficiency programs and achievements in energy savings by the American Council for an Energy Efficient Economy and Ceres. In 2015, APS focused on targeted marketing of programs based on data analytics, adding light emitting diode (LED) lighting options and expanding programs like behavioral conservation and residential new construction, which doubled the number of subdivisions participating in energy efficiency programs from the previous year.
In 2015, we continued to meet the energy efficiency standard (EES) goal required by the Arizona Corporation Commission (ACC). In 2010, the ACC established one of the most aggressive energy efficiency standards in the nation. The policy requires APS to achieve a savings equivalent to 22 percent of retail sales by 2020. APS achieved 548 gigawatt-hours of savings in 2015, resulting in 9.54 percent cumulative savings since the EES began. This result slightly exceeded the EES cumulative goal of 9.50 percent through 2015. The cumulative energy savings from APS programs have resulted in avoided carbon emission of approximately 14.5 million metric tons since these programs commenced.
OCOTILLO POWER PLANT MODERNIZATION PROJECTAPS’s Ocotillo Power Plant modernization project continued to move forward in 2015. This project, located in Tempe, Arizona, will replace two existing 1960s-era natural gas-fired steam generating units with five new gas-fired turbines equipped with state-of-the-art pollution control technology. The new gas turbines will achieve full compliance with the EPA’s New Source Performance Standards for carbon emissions from new generating units, which were finalized in August of 2015. While the overall

PNW CRR 38
energy generation capacity at the site will more than double, the nitrogen oxide and carbon monoxide emissions rates will be cut in half. The new gas turbines are expected to be in commercial service by the summer of 2019. In addition to the modernized plant’s environmental benefits, the new units’ quick-start capabilities provide the flexible generation required to integrate more renewable energy into our generation resource mix.
CLEAN POWER PLANOn October 23, 2015, EPA issued the Clean Power Plan, a comprehensive regulatory program to reduce carbon dioxide emissions from existing power plants nationwide by 32 percent from 2005 levels, by 2030. Under the Clean Power Plan, states must develop plans to reduce emissions of carbon dioxide to meet state-specific performance standards.
APS has played and will continue to play an active role in advocating for the Clean Power Plan compliance strategies for the state of Arizona and the Navajo Nation. APS, in cooperation with the other Arizona utilities, participates in a technical working group that provides input to the Arizona Department of Environmental Quality in the development of the state Clean Power Plan compliance plan. Because APS owns and operates fossil-fuel fired units on the Navajo Nation, APS also is working to ensure that, to the extent further carbon reductions are required under the Clean Power Plan for the Navajo Nation, EPA policies are developed and implemented in a way that is sustainable for our business and the long-term prosperity of the Navajo Nation.
The Clean Power Plan creates new challenges in balancing the need to meet customer demand, future load growth, and reduction of carbon dioxide emissions from burning fossil fuels. Fortunately, APS has positioned itself well over the years and anticipated market movements towards renewable
energy, natural gas and energy efficiency. In all, APS has a balanced portfolio of generation assets, including nuclear, renewables (solar, wind and biomass), natural gas (producing less than one-half the carbon dioxide emissions as coal) and coal. Accordingly, APS is well positioned to provide reliable power throughout its service territory and will continue to work with stakeholders to determine Clean Power Plan compliance strategies and to assess their implications for our customers, the state of Arizona and the Navajo Nation.
ENERGY EFFICIENT FACILITIESWe continue to aggressively pursue energy efficiency within the facilities we own or operate. We are systematically replacing obsolete building systems and equipment with more energy efficient ones to reduce the amount of energy we consume. Specifically, we have incorporated energy efficient lighting strategies by standardizing our LED light fixtures and utilizing daylight harvesting technologies when viable. Our 2015 measured electricity usage was 28,811 MWh, compared to 2014 usage of 29,317 MWh, an improvement of approximately 2 percent in just one year.
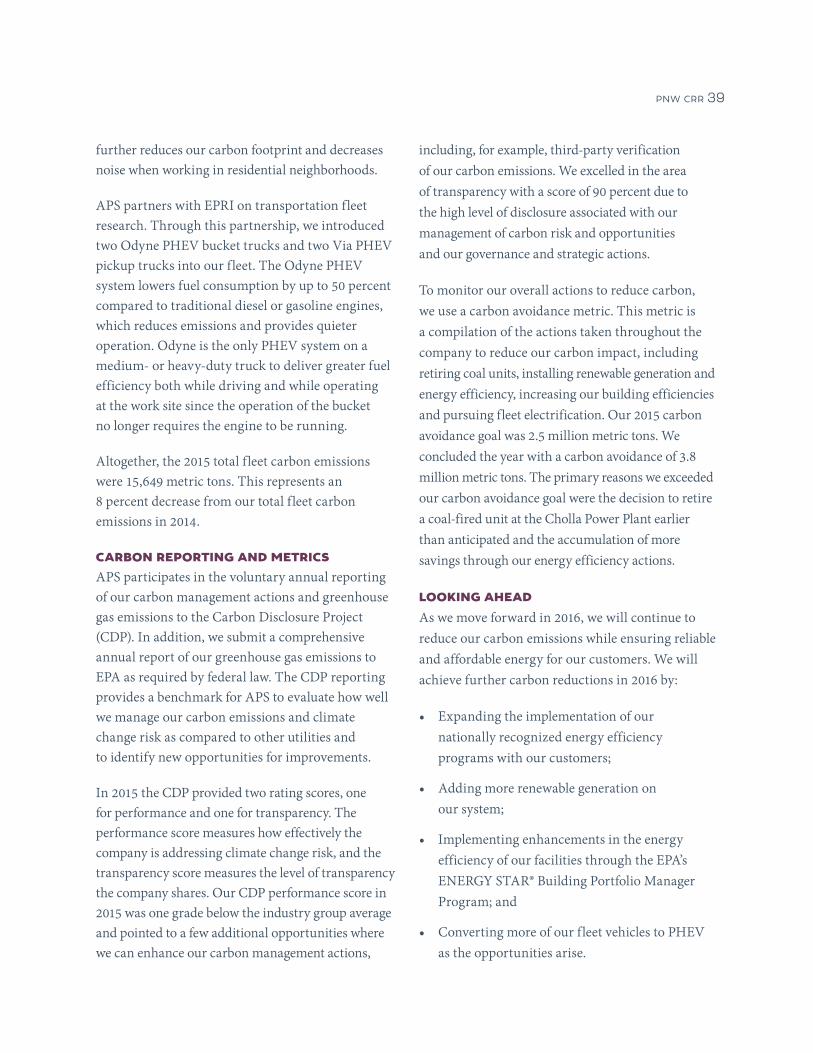
FLEET EFFICIENCYAPS continues to reduce carbon emissions from our transportation fleet by converting to more fuel efficient vehicles and by increasing the efficient use of our current fleet. In 2015 we replaced 10 sedans with plug-in hybrid electric vehicles (PHEVs), bringing the total of PHEVs within our fleet to 13. For each sedan we switch to hybrid electric, ranging in size from compact to large, we estimate saving more than 24 tons of carbon emissions over the next 10 years.
We also have incorporated electric power take-off (ePTO) technology as a standard in all troubleman bucket trucks. This technology allows the troubleman to operate the truck’s boom without engaging the engine, which reduces engine idling time. This
PNW CRR 39
further reduces our carbon footprint and decreases noise when working in residential neighborhoods.
APS partners with EPRI on transportation fleet research. Through this partnership, we introduced two Odyne PHEV bucket trucks and two Via PHEV pickup trucks into our fleet. The Odyne PHEV system lowers fuel consumption by up to 50 percent compared to traditional diesel or gasoline engines, which reduces emissions and provides quieter operation. Odyne is the only PHEV system on a medium- or heavy-duty truck to deliver greater fuel efficiency both while driving and while operating at the work site since the operation of the bucket no longer requires the engine to be running.
Altogether, the 2015 total fleet carbon emissions were 15,649 metric tons. This represents an 8 percent decrease from our total fleet carbon emissions in 2014.
CARBON REPORTING AND METRICSAPS participates in the voluntary annual reporting of our carbon management actions and greenhouse gas emissions to the Carbon Disclosure Project (CDP). In addition, we submit a comprehensive annual report of our greenhouse gas emissions to EPA as required by federal law. The CDP reporting provides a benchmark for APS to evaluate how well we manage our carbon emissions and climate change risk as compared to other utilities and to identify new opportunities for improvements.
In 2015 the CDP provided two rating scores, one for performance and one for transparency. The performance score measures how effectively the company is addressing climate change risk, and the transparency score measures the level of transparency the company shares. Our CDP performance score in 2015 was one grade below the industry group average and pointed to a few additional opportunities where we can enhance our carbon management actions,
including, for example, third-party verification of our carbon emissions. We excelled in the area of transparency with a score of 90 percent due to the high level of disclosure associated with our management of carbon risk and opportunities and our governance and strategic actions.
To monitor our overall actions to reduce carbon, we use a carbon avoidance metric. This metric is a compilation of the actions taken throughout the company to reduce our carbon impact, including retiring coal units, installing renewable generation and energy efficiency, increasing our building efficiencies and pursuing fleet electrification. Our 2015 carbon avoidance goal was 2.5 million metric tons. We concluded the year with a carbon avoidance of 3.8 million metric tons. The primary reasons we exceeded our carbon avoidance goal were the decision to retire a coal-fired unit at the Cholla Power Plant earlier than anticipated and the accumulation of more savings through our energy efficiency actions.
LOOKING AHEAD
As we move forward in 2016, we will continue to reduce our carbon emissions while ensuring reliable and affordable energy for our customers. We will achieve further carbon reductions in 2016 by:
• Expanding the implementation of our nationally recognized energy efficiency programs with our customers;
• Adding more renewable generation on our system;
• Implementing enhancements in the energy efficiency of our facilities through the EPA’s ENERGY STAR® Building Portfolio Manager Program; and
• Converting more of our fleet vehicles to PHEV as the opportunities arise.

PNW CRR 40
People—employees, customers, suppliers and community members—make the difference at APS. Employees are critical to our success now and in the future. We maintain a diverse and inclusive work environment because we know that the different backgrounds, perspectives and ideas of our 6,400 employees are essential to our success. In 2015, 32 percent of new hires were ethnically diverse and 21 percent were veterans. For the
second year in a row, we were named to GI Jobs Magazine’s list of America’s Top 100 Military-Friendly Employers in 2015. These new hires enter a workplace dedicated to developing the best in its employees. In fact, employee development has been designated as one of our four Corporate Strategic Initiatives in 2015, with a focus on “adopting sustainable programs to invest in our people today and in the future.”
PEOPLE

PNW CRR 41
Customers are at the core of what we do, and they continue to rank APS among the top utilities for customer satisfaction and reliability. The way customers use energy is changing—from smart thermostats, to plug-in electric vehicles, to rooftop solar—and the way they want to interact with their energy company also is evolving. We strive to provide new resources to help them manage their service, such as an email or text notification to let them know when they’ve hit a usage threshold and an outage map on aps.com that provides easy access to restoration updates.
In addition, our industry-leading Supplier Diversity and Development program reached $2 billion spent with diverse businesses from 1992 to 2015 and received the Edison Electric Institute’s Supplier Diversity Award for Innovation.
Building strong communities is important to APS and our employees. Our 2015 investment in the community, including grants, scholarships and in-kind donations from APS and the APS Foundation, totaled more than $10 million. APS employees volunteered 127,000 hours with nonprofits, resulting in an economic impact of $2.9 million.
127,000HOURS VOLUNTEERED BY APS EMPLOYEES
2011 2012 2013 2014 2015
$400
$300
$200
$100
0
5-YEAR DIVERSE SUPPLIER SPEND
In millions
$396MILLION
SPENT WITH DIVERSE SUPPLIERS IN 2015, AN
INCREASE OF MORE THAN $82 MILLION OVER 2014.
PNW CRR 42
INTEGRATED TALENT MANAGEMENTIn 2015, we continued to improve our approach to succession planning by identifying ready-now and ready-soon candidates for executive and key management positions. In addition, we began a workforce planning initiative that helps each business unit plan for and meet its human capital needs, now and in the future. A significant part of this effort is the development of talent pipelines that will sustain APS’s talent needs.
On March 4, 2016, APS and the Western Maricopa Education Center (West-MEC) hosted a groundbreaking celebration for the new West-MEC Southwest Campus, in partnership with the City of Buckeye, Estrella Mountain Community College and the Palo Verde Nuclear Generating Station. The campus will provide programs and career training for secondary education, post-secondary education and industry certifications. The facility eventually will serve 650 students in 12 to 14 different programs, including sustainable energy and industrial technology. APS and other industry partners will be involved in the curriculum development and will provide equipment for simulations and training.
EMPLOYEE ENGAGEMENT In 2015, we continued our employee engagement initiative to measure and improve the level of our employees’ engagement. The initiative began in 2014 when we conducted an engagement survey, to which 81 percent of our employees responded. The overall engagement score for company employees was 78 percent, which is on par with most employers and energy/utility companies across the country but behind the highest performing companies. Based on analysis of the results, action plans were developed and implemented at both the company and the business unit levels. As a result of this initiative, we created the APS Employee Engagement Council, a cross-functional group of
employees who are tasked with assessing company-wide employee engagement opportunities and taking action to improve engagement. The Council has selected two focus areas going forward: employee career growth and building a culture of positive recognition.
APS will conduct a second survey in late summer 2016 to measure our progress and determine next steps. Our goal is to increase our engagement score from 78 percent to 80 percent in 2016.
UNION CONNECTIONSMaintaining long-term strategic relationships with unions is important to APS’s success. In April 2015, members of the IBEW Local 387 ratified a new, three-year collective bargaining agreement with APS. The agreement will remain in place until April 1, 2018. APS expects to continue to have a positive, collaborative working relationship with IBEW 387 as we share a common goal: the safe and efficient delivery of reliable energy to meet the changing needs of our customers.
EMPLOYEE NETWORK GROUPS To encourage employees to connect with each other and promote career development, we enthusiastically endorse employee network groups. These self-organized, voluntary groups are formed around the basis of a common attribute, such as experience in the utility industry, gender, ethnicity and race. However, membership is open to all APS employees to support inclusivity. Our nine employee network groups contribute to the development of our workforce in many ways, including building business acumen through presentations by senior leaders, providing mentoring and networking opportunities for members, leadership development training initiatives and other educational and development events. The groups also foster cultural awareness and appreciation with events

PNW CRR 43
like the Native American Heritage Month celebration organized by the Native American Network Organization (NANO) and the Hispanic Heritage Festival sponsored by the Hispanic Organization for Leadership Advancement (HOLA). The groups also are very active as volunteers and business ambassadors to the community in a variety of charitable events,
such as the Veteran Engagement, Transition and Retention Network (VETRN) employees who participate in the Packages from Home program, the Women in Search of Excellence’s (WISE) involvement with and support of Fresh Start, and the Lesbian, Gay, Bisexual and Transgender Alliance’s involvement with the Phoenix Gay Chamber.
Hispanic Organization for Leadership Advancement (HOLA)Mission: Promote a culture of inclusiveness and community stewardship across APS, as well as develop high-performing Hispanic leaders in pursuit of operational excellence and continuous self-improvement.
Lesbian, Gay, Bisexual & Transgender (LGBT) AllianceMission: Build a community at APS to further support diversity and provide opportunities for members to achieve their professional and personal best through culture, communications, commerce and careers.
Native American Network OrganizationMission: Attract and develop Native American talent by providing professional development opportunities, assisting in recruiting and retention, and community development.
NextGenMission: To educate, unite and engage individuals in the utility industry through professional development, community outreach efforts and networking all in support of the APS Core (Strategic Framework).
Network for Urban EngagementMission: Create a collaborative and highly engaged network of African-American employees that promote the interests of NUE, its strategic initiatives, and the values of APS.
Veteran Engagement, Transition & Retention NetworkMission: Develop opportunities benefiting our honored Arizona veterans. We strive to promote their service to our country, leadership skills, and the achievements of veterans in the organization.
Women in Search of Excellence (WISE)Mission: Build a community at APS to further develop women as they achieve their personal and professional excellence.
Palo Verde Young GenerationMission: Unite young professionals for the purpose of strengthening its community by focusing on the success of nuclear technology.
Palo Verde Women in NuclearMission: Promote an environment in which all employees are able to succeed while working to encourage public awareness about nuclear energy.

PNW CRR 44
CUSTOMER VALUEWe remain committed to providing excellent service and reliability to our customers—from flexible payment options to better, faster outage information. We recognize that the way our customers use energy is changing, as are their expectations about how they want to do business with us. For example, today’s customers want more control over when and how they hear from us. In response, we launched a notification center on aps.com, allowing customers to get proactive text or email alerts when there is an outage in their area, when their electric bill is due or when their usage has reached a preset limit. We also are in the process of improving our interactive voice recognition software to offer a better user experience.
When it comes to customer satisfaction, our customers rank APS among the top utilities in the country. Customer satisfaction with APS improved for the third year in a row, maintaining a strong position in the top quartile of large, investor-owned utilities. APS’s scores improved
in all of the six key categories: power quality and reliability, price satisfaction, billing and payment, corporate citizenship, communications and customer service. APS ranked second among 54 large, investor-owned utilities in power quality and reliability and first in two attributes: quality electric power free from spikes, drops or surges; and customer awareness of charitable giving. Our overall results place APS eighth among 54 large, investor-owned utilities.
COMMUNITY INVESTMENTWe partner with nonprofit organizations and community groups across the state to build a stronger, healthier Arizona. We do this through financial support, board service and volunteer assistance.
In 2015, APS donated more than $10 million to worthwhile causes. This includes our corporate giving, which funds organizations that contribute to the vitality of Arizona, with an emphasis on civic and economic development, human services, environment, education and arts and culture.
2014 2015
APS TOTAL GIVING $9,930,396 $10,684,068
APS FOUNDATION TOTAL $2,583,840 $2,921,300
ARTS AND CULTURE $690,189 $1,051,982
CIVIC $1,193,428 $1,926,585
ECONOMIC DEVELOPMENT $853,073 $570,483
EDUCATION $3,547,485 $3,281,962
ENVIRONMENTAL $453,348 $337,463
HEALTH SERVICES $309,036 $375,243
HUMAN SERVICES $2,817,339 $3,086,766
MATCHING GIFTS $66,495 $53,576
TOTAL $9,930,396 $10,684,068

PNW CRR 45
It also includes the $2.9 million given by the APS Foundation in 2015 to nonprofit organizations with a STEM (science, technology, engineering and math) focus. A workforce proficient in STEM skills is critical to attracting and retaining high-quality businesses and industries in Arizona. As a result, the APS Foundation focuses its giving on helping educators increase content knowledge in STEM subjects and improve their ability to transfer this knowledge effectively to students. To deepen our strong relationships within the nonprofit community, we launched a Nonprofit Partner
Breakfast for the executive directors of Arizona’s top nonprofit organizations. The breakfasts feature topics relevant to nonprofit CEOs, such as diversity and inclusion and how to build a vibrant Board of Directors.
Volunteerism continues to be a focus for APS and its 6,400 employees. In 2015, APS employees volunteered 127,000 hours, a $2.9 million value to area nonprofits. For example, APS partnered with Experience Matters to pilot a skills-based volunteer program where APS employees were paired with
EACH YEAR WE CONTRIBUTE MORE THAN
$3.4 BILLION TO THE STATE’S ECONOMY
$1 BILLION ANNUAL PURCHASES OF GOODS AND SERVICES IN ARIZONA AND $395 MILLION FROM MINORITY AND WOMEN-OWNED BUSINESSES
APS IS ARIZONA’S LARGEST TAXPAYER AT MORE THAN
$500 MILLION DURING 2015
127,000 HOURS VOLUNTEERED BY APS EMPLOYEES IN 2015, A $2.9 MILLION VALUE
$2.9 MILLION AWARDED BY THE APS FOUNDATION TO NONPROFITS TO PREPARE STUDENTS FOR CAREERS IN THE STEM FIELDS
MORE THAN
$10 MILLIONGIVEN BACK TO THE COMMUNITY IN 2015
APS EMPLOYEES SIT ON BOARDS OF
300 ARIZONA NONPROFIT ORGANIZATIONS
88,000 LIMITED INCOME CUSTOMERS ENROLLED IN OUR ENERGY SUPPORT PROGRAM, WHICH PROVIDES UP TO 65% OF THE COST OF ELECTRICITY, A VALUE OF CLOSE TO $3 MILLION PER YEAR
APS CUSTOMERS AND EMPLOYEES CONTRIBUTED MORE THAN $55,000 TO SHARE—SERVICE TO HELP ARIZONANS WITH
RELIEF ON ENERGY

PNW CRR 46
select nonprofits to work on in-depth projects. We also are a proud supporter of veterans and issues that matter to veterans. We work with educational institutions and nonprofit organizations like Glendale Community College and Goodwill of Arizona to assist veterans as they transition from military service to the workforce.
APS employees also support their communities by contributing a portion of their paychecks to the company’s annual Community Services Fund, benefitting United Way and other local nonprofit agencies. Employees pledged more than $4 million in 2015, including matching funds from APS of 50 cents for every dollar donated by employees and retirees.
DIVERSE SUPPLIERS
2015 was a record-setting year for our Supplier Diversity and Development (SDD) Program. Our spend with diverse suppliers exceeded $396 million, an increase of more than $82 million over 2014. Also in 2015, the SDD program reached the $2 billion level in spend with diverse businesses since the program’s inception in 1992. Over the past 20 years, our SDD program has made many strides in supplier development, increasing overall spend with certified diverse firms and developing innovative ways to increase awareness of the value of supplier diversity. As a result of our hard work, the SDD program was honored as the first place recipient of the Supplier Diversity Award for Innovation by the EEI, an association that represents all U.S. investor-owned electric companies. APS also was recognized as the 2015 Corporate Partner of the Year by the American Indian Chamber of Commerce of Arizona.
We recognize that success begins with developing productive and beneficial relationships with our community partners. These community partners include the ethnic chambers of commerce, third-
party certification agencies and the organizations that represent and advocate for diverse businesses. These organizations serve primarily to identify the potential pool of vendors that want to engage with APS and to provide important feedback to the SDD program by suggesting improvements to current processes.
APS prides itself on innovation in supplier diversity. Through our Diverse Supplier Training Program (DSTP), first established in 1997, we have helped suppliers overcome business hurdles and increase the probability of long-term success. The nine-month course provides diverse business owners with the knowledge and skills to be successful working with the utility industry. APS is one of few utilities with a training program taught by internal employees and subject matter experts, along with external small business specialists. Each class includes around 12 businesses. Every year we improve the program, ensuring that content is relevant and useful for class participants. The businesses that graduate from this program are more prepared to do business with APS and other public utilities, and many have been successful in getting business within other industries as well. APS has spent in excess of $19 million with DSTP graduates in total.
Also of note is our engagement with the Electric Utility Industry Sustainable Supply Chain Alliance (EUISSCA), which allows us the opportunity to gain insight from like-minded utilities. In 2015, APS took a leadership role in developing a supplier scorecard based on responses to the annual EUISSCA supplier sustainability survey. This effort afforded EUISSCA the ability to turn survey responses into a tool that furthers discussions with strategic suppliers about making positive triple bottom line impacts.

PNW CRR 47
LOOKING AHEADPeople will always be an important part of our business. In 2016, we will maintain and improve our customer, employee and community engagement. Some of our major initiatives will be:
• Continuing our focus on diversity through the Executive Diversity Council, with an emphasis on workforce, workplace and community, as well as an increased focus on attracting diverse and veteran talent;
• Building leadership excellence through improved training opportunities and implementation of a new leadership development strategy to enhance our leadership pipeline;
• Conducting a follow-up employee engagement survey to measure progress;
• Launching a mobile app that will allow customers to manage their account, track usage, get information on outages and more;
• Increasing our supplier diversity spend by more than $95 million over the previous year; and
• Providing additional opportunities to the diverse business community. The SDD spend goal for 2016 exceeds the 2015 goal by $95.4 million, a 32 percent increase.

PNW CRR 48
APPENDIX140012001000
800600400200
0
C02 EMIS SION RATE (LB/MWh)
20089221281
20099221252
2010851
1223
20118861237
20128761166
20138541199
2014757
1219
2015760
1,189OPERATEDOWNED
32.5
21.5
10.5
0
N0X EMIS SION RATE (LB/MWh)
20081.8
2.38
20091.742.24
20101.6
2.16
20111.692.13
20121.571.87
20131.5621.94
20141.2311.822
20151.2711.826
OPERATEDOWNED
3025201510
50
C02 EMIS SIONS (MILLION ME T RIC TONS)
200824.216.3
200925
15.5
201023
15.1
201123.515.2
201223.914.6
201321.8
14.14
201419.715.3
201520.314.7
OPERATEDOWNED
70000600005000040000300002000010000
0
N0X EMIS SIONS ( TONS)
20085204233282
20095201330748
20104787929514
20114961528802
20124809225894
20134412325230
20143195422794
20153388423000
OPERATEDOWNED
1.41.2
10.80.60.40.2
0
SO2 EMIS SION RATE (LB/MWh)
20080.931.2
20090.680.75
20100.580.67
20110.630.71
20120.580.63
20130.5590.649
20140.3900.567
20150.4070.580
OPERATEDOWNED
0.160.140.12
0.10.080.060.040.02
0
PM10 EMIS SION RATE (LB/MWh)
20080.080.13
20090.060.11
20100.050.1
20110.070.13
20120.070.1
20130.0390.066
20140.0160.044
20150.0360.067
OPERATEDOWNED
40353025201510
50
SO2 EMIS SIONS (MILLION ME T RIC TONS)
200826.816.9
200920.410.3
201017.69.2
201118.69.6
201217.38.7
201315.88.4
201410.17.1
201510.97.3
OPERATEDOWNED
350030002500200015001000
5000
PM10 EMIS SIONS ( TONS)
200822601828
200919351511
201016141370
201121021727
201221211416
20131089859
2014425557
2015968846
OPERATEDOWNED

PNW CRR 49
0.030.025
0.020.015
0.010.005
0
MERCURY EMIS SION RATE (LB/MWh)
20080.0170.026
20090.0160.025
20100.0150.025
20110.0160.024
20120.0150.025
20130.0140.028
20140.0080.013
20150.0080.013
OPERATEDOWNED
0.120.1
0.080.060.040.02
0
LEAD EMIS SION RATE (LB/MWh)
20080.01
0.017
20090.0090.017
20100.0090.016
20110.0090.016
20120.0090.014
20130.0060.01
20140.0030.008
20150.0080.013
OPERATEDOWNED
0.60.50.40.30.20.1
0
MERCURY EMIS SIONS (MILLION ME T RIC TONS)
20080.480.36
20090.480.34
20100.460.34
20110.460.33
20120.460.34
20130.3950.36
20140.2030.167
20150.2100.164
OPERATEDOWNED
0.350.3
0.250.2
0.150.1
0.050
LEAD EMIS SIONS ( TONS)
20080.2830.241
20090.2880.227
20100.27
0.227
20110.27
0.221
20120.2650.199
20130.180.13
20140.0880.100
20150.2100.164
OPERATEDOWNED
0.180.160.140.12
0.10.080.060.040.02
0
CO EMIS SION RATE (LB/MWh)
20080.1170.149
20090.1190.15
20100.11
0.147
20110.1140.147
20120.1070.129
20130.1160.126
20140.0960.095
20150.0910.122
OPERATEDOWNED
0.0140.012
0.010.0080.0060.0040.002
0
VOC EMIS SION RATE (LB/MWh)
20080.0060.012
20090.0060.01
20100.0060.01
20110.0060.01
20120.0050.009
20130.0010.002
20140.0010.004
20150.0020.004
OPERATEDOWNED
4000350030002500200015001000
5000
CO EMIS SIONS (MILLION ME T RIC TONS)
200834042088
200935632053
201032892010
201133391988
201232151784
201332631642
201424901194
201524131533
OPERATEDOWNED
250
200
150
100
50
0
VOC EMIS SIONS ( TONS)
2008198169
2009183161
2010166134
2011166139
2012171147
2013151121
20143855
20154451
OPERATEDOWNED

PNW CRR 50
EMPLOYEES 2011 2012 2013 2014 2015OSHA Recordable Injuries 58 47 36 44 43
Volunteer Hours 157,000 133,137 130,000 147,000 127,000OPERATIONAL EXCELLENCE
SAIFI 0.80 0.78 0.78 0.79 0.82
Palo Verde Capacity Factor 90.7% 92.3% 91.1% 93.7% 94.3%
Total Renewable Energy(Megawatt-hours in Millions) 1.1 1.5 1.9 2.7 2.8
Energy Efficiency Savings (MWh) 397,201 551,639 538,841 495,410 552,424
ENVIRONMENTAL STEWARDSHIP
Reportable Environmental Incidents 29 26 8 5 4
Environmental Notices of Violation 3 3 2 3 0
CUSTOMERS AND COMMUNITIES
Residential Customer Satisfaction Survey (IOU) 669 662 669 673 692
Total Giving $ 7,802,539 $ 8,321,488 $ 9,606,186 $ 9,930,397 $ 10,684,068SHAREHOLDER VALUE
PNW Earned ROE 8.7% 9.8% 9.9% 9.3% 9.77%
Total Shareholder Return 22% 10.3% 8% 34.5% 2.0%
PERFORMANCE SUMMARY CHART

CORPORATE RESPONSIBILITY REPORT CONTACT Jeffrey Jennings P.O. Box 53999, MS 9303 Phoenix, AZ 85072-3999 (602) 250-3528 [email protected]