The Approved 2017 Budget...2016/10/04 · The Approved 2017 Budget The City of Fargo, North Dakota...
179
The Approved 2017 Budget The City of Fargo, North Dakota - September 26, 2016--
Transcript of The Approved 2017 Budget...2016/10/04 · The Approved 2017 Budget The City of Fargo, North Dakota...

The Approved 2017 Budget
The City of Fargo, North Dakota- September 26, 2016--

CITY OF FARGO, NORTH DAKOTA 2017 PRELIMINARY BUDGET
TABLE OF CONTENTS
Mayor's Budget Message ........................................................................................................................................ 1 Fargo Mayor and Commissioners ........................................................................................................................... 4 Listing of Principal Officials ..................................................................................................................................... 5 City of Fargo Organization Chart ............................................................................................................................ 6 City of Fargo Budget Development Process ........................................................................................................... 7 City of Fargo Budgeted Funds Structure ................................................................................................................. 8 Consolidated Budget Summary - All Budgeted Funds ............................................................................................ 9 Consolidated Budget Summary - Three Year Summary of All Budgeted Funds ................................................... 10 Major Revenue Sources - Review and Discussion ............................................................................................... 12 Fund Balance Reporting ....................................................................................................................................... 20 Schedule of Changes in Governmental Fund Balances ........................................................................................ 21
Summary Budget Data General Fund Fiscal Tends and Comments.......................................................................................................... 22 General Fund Budget Summary (NDCC 40-40 Format) ....................................................................................... 23 General Fund Revenue Pie Chart by Source ........................................................................................................ 24 General Fund Revenue Analysis by Source ........................................................................................................ .25 General Fund Resource Trends Last Five Years .................................................................................................. 26 General Fund Expenditure Pie Chart by Function ................................................................................................. 27 General Fund Expenditure Analysis by Cost Category ......................................................................................... 28 General Fund Expenditure History Last Five Years .............................................................................................. 29 General Fund Mid-Year Budget Adjustment Recommendations ........................................................................... 30 General Fund Budget Accuracy - Revenues for Last Ten Years .......................................................................... 31
Departmental Data and Budget History City Administrator .................................................................................................................................................. 32 Human Resources ................................................................................................................................................ 34 Information Services ............................................................................................................................................. 36 Public Information ................................................................................................................................................. 38 City Attorney ......................................................................................................................................................... 40 City Prosecution .................................................................................................................................................... 42 Baseball Stadium .................................................................................................................................................. 44 City Auditor ........................................................................................................................................................... 46 Municipal Court .................................................................................................................................................... 48 Incarceration ......................................................................................................................................................... 50 City Assessor ........................................................................................................................................................ 52 General Support .................................................................................................................................................... 54 Buildings & Grounds ............................................................................................................................................. 56 Planning and Development ................................................................................................................................... 58 Inspections ............................................................................................................................................................ 60 Transit (all Divisions) ............................................................................................................................................. 62 Engineering Department ....................................................................................................................................... 70 Traffic Engineering ................................................................................................................................................ 74 Street Department ................................................................................................................................................. 76 Central Garage ..................................................................................................................................................... 78 Fire Department .................................................................................................................................................... 80 Police Department ................................................................................................................................................ 83 Fargo Cass Public Health ..................................................................................................................................... 85 Fargo Public Library .............................................................................................................................................. 87 City Commission ................................................................................................................................................... 90 Fargo Civic Center ................................................................................................................................................ 92 Social Service Allocation ....................................................................................................................................... 94 Capital Outlay ....................................................................................................................................................... 96 Vehicle Replacement ............................................................................................................................................ 98 Unallocated ......................................................................................................................................................... 100 Transfers to Other Funds .................................................................................................................................... 101
Introductory Section
General Fund

TABLE OF CONTENTS, CONTINUED
Special Revenue Funds Fiscal Tends and Comments ....................................................................................... 103 Special Revenue Funds Summary ...................................................................................................................... 104 Special Revenue Mid-Year Budget Adjustment Recommendations ................................................................... 105 FM Convention and Visitors Bureau Operating Budget ...................................................................................... 106 FM Convention and Visitors Bureau Capital Budget ........................................................................................... 111 Debt Service Funds Fiscal Trends and Budget Comments ................................................................................ 112 Debt Service Funds Summary of Source and Uses of Funds ............................................................................. 113 Refunding Improvement Bonds ........................................................................................................................... 114 Sales Tax Revenue Bonds.................................................................................................................................. 115 Other Governmental Debt ................................................................................................................................... 116 Tax Increment Financing District Obligations ...................................................................................................... 117 Debt Service Funds Mid-Year Budget Adjustment Recommendations ............................................................... 118 Capital Project Funds Fiscal Trends and Budget Comments .............................................................................. 119
Summary Budget Data
Proprietary Funds Fiscal Trends and Budget Comments ................................................................................... 120 Proprietary Funds Revenue Analysis .................................................................................................................. 121 Proprietary Funds Expenditure Analysis by Fund ............................................................................................... 122 Proprietary Funds Expense Analysis by Cost Category ...................................................................................... 123 Municipal Airport Authority Budget ...................................................................................................................... 124
Departmental Data and Budget History Water Treatment ................................................................................................................................................. 125 Water Mains & Hydrants ..................................................................................................................................... 127 Water Meters ...................................................................................................................................................... 129 Utility Billing Services .......................................................................................................................................... 131 Water Operating .................................................................................................................................................. 133 Water Revenue Bond .......................................................................................................................................... 134 Wastewater Treatment ........................................................................................................................................ 136 Southeast Cass Sewer ....................................................................................................................................... 139 Storm Sewer ....................................................................................................................................................... 141 Vector Control ..................................................................................................................................................... 144 Street Lighting ..................................................................................................................................................... 146 Solid Waste ......................................................................................................................................................... 148 Forestry ............................................................................................................................................................... 150 Fargo Airport Authority ........................................................................................................................................ 152 FARGODOME .................................................................................................................................................... 154 Pension Trust Funds Fiscal Trends and Budget Comments ............................................................................... 158 Pension Trust Fund Revenues ............................................................................................................................ 159 Pension Trust Fund Expenditures ....................................................................................................................... 160 Statistical Section Fiscal Trends and Budget Comments .................................................................................... 161 Population Trends ............................................................................................................................................... 162 Demographic Data .............................................................................................................................................. 163 Building Permit History ........................................................................................................................................ 164 Property Tax Valuation Trends ........................................................................................................................... 165 Major Employers ................................................................................................................................................. 166 General Fund Balance History ............................................................................................................................ 167 Sales Tax Revenue Trends ................................................................................................................................. 168 State Intergovernmental Revenue History .......................................................................................................... 169
Special Revenue Funds
Debt Service and Capital Projects Funds
Proprietary Funds
Pension Trust Funds
Statistical Section

TABLE OF CONTENTS, CONTINUED Capital Outlay Requests/Funding Listing ............................................................................................................ 170 .................................................................................................................................................................. Personnel Requests/Funding Recommendations ............................................................................................... 174 Operating Requests ............................................................................................................................................ 175
Personnel Requests
Capital Outlay Requests
General Fund Operating Requests

THE OFFICE OF MAYOR TIMOTHY J. MAHONEY
Members of the Fargo community and Fargo City Commissioners, The City of Fargo’s 2017 Preliminary Budget is being presented for your review and consideration. I would like to express my appreciation to the Department Heads, Division Heads, Commissioners and the Budget Team for their excellent work in arriving at a budget plan that will work for Fargo.
INTRODUCTION A plethora of ideas, recommendations and conversations occurred during dozens of meetings to create the document before you today. With the help of the Commissioners, the Budget Team feels the 2017 Preliminary Budget addresses the needs of a city transitioning into one of the Midwest’s most vibrant urban areas. It goes without saying that we were impacted by the recent challenges surrounding the State of North Dakota’s budget. We were required to make many difficult choices and, in addition, will be utilizing a portion of our fund balances in 2017 for the overall budget. However, Fargo remains well positioned to continue providing its citizens with excellent services while being mindful of the tax burdens placed on all of us. This proposed budget continues the precedent set forth by former Mayors Furness and Walaker in producing fiscally conservative plans.
WEIGHING THE NEEDS OF A GROWING CITY With public safety at the forefront of the national narrative, the requirement to support the mission of our police officers and firefighters is vital. To address rising crime in the region, we understand the need to hire additional officers charged with keeping our community safe. With the remodel of the downtown fire station, we will have a functional, efficient and improved facility for our hub of operations. We now need to turn our next thoughts to expanding our police headquarters.
The health of our community is extremely important. The issue of opioid overdoses has devastated our community with the loss of many of our own citizens. Fargo Cass Public Health will be working extensively on the issue in 2017, with a sufficient workforce to aid in this mission. We are striving to be a heart safe community to address cardiac issues and, to that goal, I’d like to see every person learn how to perform cardiopulmonary resuscitation (CPR). Coupled with automated external defibrillators (AED), we should strive to be able to assist anyone experiencing a cardiac event within our community.
Street improvements and infrastructure needs continue to grow as our city expands. Innovations at the landfill will allow for the conversion of landfill gas into natural gas, offering us the ability to
1

become more self-sufficient. Investing in water and wastewater facilities brings the potential of becoming a regional supplier of these vital services; this is truly a win-win for all communities involved. With all the infrastructure upgrades occurring in the community, our Engineering and Planning Departments are working to meet the demands of the homebuilders, developers and citizens. Whether a project is large or small, we need to be responsive to all of the work taking place throughout the city. At the same time, we need to move full speed ahead on the in-town flood protection projects and the Fargo-Moorhead Diversion.
As our community continues to grow and expand, so too does the need for transportation. It is incredible to see the number of bikes and buses on our city’s roads as the usage of alternative transportation becomes widespread. It’s time to think about the transit system we want to offer our citizens, knowing that people need ample options to reach employment, education and residential areas. At the same time, we are looking into the need for additional parking structures to address an increased number of residents and businesses in the downtown core. Fargo is booming with many large projects occurring, most notably the completion of the Sanford Health complex in 2017.
With over 5,000 job openings in our community, we need to train a workforce capable of meeting the demands of area employers. Entering into the equation are the requirements of affordable housing, neighborhood infill and a robust growth plan. We need to find the right mix of incentives to continue our growth with opportunities capable of offering livable wages for our citizens. Also, we need to attract and retain an excellent workforce for the City of Fargo; the quality of the services we provide is directly attributable to the caliber and knowledge of our staff members.
PRIORITY AREAS IDENTIFIED FOR NEW FUNDING IN 2017
PUBLIC SAFETY
This budget includes five new police officers. A submitted COPS grant application brings the potential for an additional eight officers.
The purchase of vehicles and equipment for the new police officers.
The lease of warehouse space for the Police Department. PUBLIC HEALTH
Resources and staffing to respond to the opioid crisis. Additional assistance for the detox shelter. Provide a new transit route to the new Sanford Health complex in southwest Fargo.
PUBLIC UTILITIES
Offer a single sort recycling program. Begin the process of converting landfill gas to compressed natural gas. Growth in regional water and wastewater services.
EMPLOYEE COMPENSATION
Offer a 2 percent competitive wage adjustment for all City employees in mid-2017. OTHER PRIORITIES
Provide funding for the public arts. Contribute to the Greater Fargo-Moorhead Economic Development Corporation.
2

SUMMARIZING THE 2017 BUDGET The reduction in aid from the State of North Dakota required us to tighten our belts, and we
responded accordingly. We have formulated a preliminary budget that is balanced, while also
offering our citizens a level of property tax relief through a two-mill reduction in the total mill levy.
The City’s overall budget is proposed to modestly increase by 1.65%, while the General Fund budget
will see a similar increase of 1.69%. To continue providing excellent services to a growing community,
we are proposing the addition of 14 new full-time employees. Astonishingly, we were able to reduce
capital requests by 57.5%.
We have addressed the ongoing needs of our growing city, while placing an emphasis on public safety, public health, public utilities and employee compensation. I look forward to further discussion on this plan and the final completion of the process in late September. Again, thank you to everyone who played an active role in this process.
LET’S WORK TOGETHER IN OUR MISSION OF BEING ‘FAR MORE’ The next several years will bring abundant opportunities, trying challenges and unexpected surprises. However, we have a strong foundation to build upon and Fargo remains the envy of many in the region. To that point, I’d like to share a sampling of the recent accolades received by this community:
#1 City for Finding a Job – U.S. News and World Report
#1 Best Performing Small City – Milken Institute
#2 Best Small Places for Businesses & Careers – Forbes Magazine
#3 Most Secure Places to Live – Farmers’ Insurance
#3 Best Place to Raise a Family – Children’s Health Magazine
#5 Best Places to Live in America – Moving.com
#6 Overall in the Nation for City Services - WalletHub
#8 Most Walkable Neighborhoods in the Midwest (Mid-Size City) - Redfin
It is a tremendous honor to be a part of this community. Fargo truly offers Far More than people expect. Together, we can bring this city to even greater heights if we work together to advance the interests of our citizens. Sincerely yours, Dr. Timothy J. Mahoney Mayor of the City of Fargo
3

The Board of Fargo City Commissioners
TONY GEHRIGCommissioner
Elected: 2015
Term Expires: June 2018
Department Liaison: Enterprise/Utilities, Fire and Transit
Committee Liaison: Metropolitan Council of Governments, Metro Area Transit Coordinating Board, Liquor Control, Alternate to Diversion Authority and Utility Committee
Board Liaison: Airport Authority, Civil Service and Red River Basin Board
Elected: 2005, 2006, 2010, 2014, 2015
Term Expires: June 2018
Department Liaison: Police, Operations, City Commission, Finance and Human Resources
Committee Liaison: Greater F-M Economic Development Corporation, Position Evaluation, Vector Control, Ambulance Committee, Community Development, Tax Exempt Review, Lake Agassiz Water Authority, Diversion Authority and Cass County Planning
DR. TIM MAHONEYMayor
Elected: 2016
Term Expires: June 2020
Department Liaison: Planning and Transit
Committee Liaison: Metropolitan Council of Governments, Renaissance Zone, Diversion Authority and Metro Area Transit Coordinating Board
Board Liaison: Board of Appeals, Board of Adjustment and Housing Authority
TONY GRINDBERGCommissioner
Elected: 2016
Term Expires: June 2020
Department Liaison: Health and Information Services Committee Liaison: Metropolitan Council of Governments, Community Development, Alternate to Diversion Authority and Food Systems Advisory Committee
Board Liaison: Board of Health, Library, Historic Preservation, Human Relations, Native American Commissioner, Fargo Youth Initiative and Arts & Culture
JOHN STRANDCommissioner
Elected: 2008, 2014
Term Expires: June 2018
Department Liaison: Engineering Committee Liaison: Metropolitan Council of Governments, Greater F-M Economic Development Corporation, Liquor Control, Position Evaluation, Renaissance Zone, Tax Exempt Review, Fargodome Finance Committee, Diversion Authority, Alternate to the Lake Agassiz Water Authority, Finance Committee and Traffic Technical Advisory Committee
Board Liaison: Fargo Dome Authority, Special Assessment, Auditorium, Parking, Red River Basin Board & Downtown Community Partnership
DAVE PIEPKORNDeputy Mayor & Commissioner
4

PRINCIPAL OFFICIALS FOR THE CITY OF FARGO
ELECTED OFFICIALS
Dr. Tim Mahoney Mayor Term Expires in June of 2018 Dave Piepkorn Deputy Mayor Term Expires in June of 2018 Tony Gehrig Commissioner Term Expires in June of 2018 Tony Grindberg Commissioner Term Expires in June of 2020 John Strand Commissioner Term Expires in June of 2020 Steve Dawson Municipal Judge Term Expires in June of 2020
THE MAYOR’S CABINET
Bruce P. Grubb City Administrator Michael J. Redlinger Assistant City Administrator
Kember Anderson Executive Assistant to the Commission Mark Bittner Director of Engineering Julie Bommelman Transit Director Kent Costin Director of Finance Timothy Dirks Library Director Steve Dirksen Fire Chief Ben Dow Director of Operations (Public Works) James Gilmour Director of Planning and Development Ron Gronneberg Chief Information Officer Troy Hall Water Utility Director Jim Hausauer Waste Water Utility Director Terry Ludlum Solid Waste Utility Director Jill Minette Director of Human Resources Ruth Roman Director of Fargo Cass Public Health Gregg Schildberger Manager of Communications & Public Affairs Rob Sobolik General Manager of the FARGODOME David Todd Chief of Police April Walker City Engineer
OTHER CITY OFFICIALS
Shawn Dobberstein Airport Executive Director Jeremy Gorden Traffic Engineer Ben Hushka City Assessor Erik Johnson City Attorney Scott Liudahl City Forester Harold Pedersen Fleet Services Manager Mark Peterson Water Treatment Plant Superintendent Leon Schlafmann Emergency Services Coordinator Steve Sprague City Auditor Scott Stenvold Physical Plant Coordinator Bruce Taralson Interim Inspections Administrator Susan Thompson Clerk of Municipal Court Don Tucker Waste Water Treatment Plant Superintendent Mark Williams Public Works Services Manager
5
The City of Fargo’s Organizational Chart
–
The Board of Fargo City
Commissioners
City Attorney
City Administrator
Commission Office
Health (Board
Of Health)
Information Services
Civic Center (Auditorium Commission)
Engineering Public Works Planning Fire Police FARGODOME
(Fargodome Authority)
Auditors Central Garage Streets Forestry Assessors
Mains & Hydrants
Transit
Inspections Emergency Operations
Center (EOC)
Municipal Court
Buildings & Grounds
Solid Waste Wastewater Water
Enterprise
Transit Maintenance
Finance Human
Resources
Hector Airport (Municipal Airport
Authority)
Assistant City Administrator
City Administrator’s Departmental Portfolio Assistant City Administrator’s Departmental Portfolio
Communications & Public Affairs
Library (Library Board)
6

City of Fargo Budget Development Process
A budget timeline and related budget development tasks are summarized in the chart below:
Overview of Budget Process Jan Feb Mar. April May June July Aug Sept. Oct. Nov. Dec.Reporting Financial ResultsPrepare CAFR and Complete Audit ****************************************************Present Financial Results to City Commission ************GFOA Certificate of Excellence in Reporting Award ********Publish CAFR and Post to Municipal Disclosure Repository ****Ongoing Strategic PlanningAssessment of Community Needs *********************************************************************************************************Update of Utility Infrastructure Master Plan **************************Update of Capital Improvement Plans *************************************************************Timelines Developed for Long Term Financings ********Budget Development ActivitiesMonitor Revenues and Expenditures *********************************************************************************************************Assessment of Economic Conditions ********* *****************Board of Equalization Property Tax Valuations ********Finance Department Revenue Projections ******************************************Departmental Budget Instructions / Calendar Set ********Departmental Budget Proposals Developed *****************Budget Team Meetings with Department Heads ********Preparation of Mayor's Preliminary Budget ******************************************Mayor's Preliminary Budget Message Finalized ******Budget Adoption ProcessMayor's Preliminary Budget Filed with Commission **Commission Adoption of Preliminary Budget **Notice of Budget Hearings Published **Public Hearings on Tax Levies and Preliminary Budget **Approval of Final Budget (October 7th) **Certification of Tax Levies and Final Budget **
7

CITY OF FARGOBUDGETED FUNDS STRUCTURE
TRUST AGENCY FUNDS FUNDS
SPECIAL DEBT CAPITAL MAJOR NON‐MAJOR PENSIONGENERAL (1) REVENUE (17) SERVICE (5) PROJECTS (9) ENTERPRISE (6) ENTERPRISE (4) TRUST (2) (4)
General City Share Assessments Tax Increment General Infrastructure Water SE Cass Sewer City Employee Performance Deposits(Major Fund) Noxious Weed Improvement Bonds (Major Fund) (Major Fund) Vector Control Police Park District Special Assmts.
Convention Bureau (Major Fund) Building Fund Wastewater Street Lighting FM Diversion AuthorityRegional Training Center Sidewalks Grant Equipment Storm Sewer Forestry Red River Regional DispatchTransit Capital Escrow Sales Tax Bonds Disaster Recovery Solid Waste
Court Forfeits (Major Fund) Street Infrastructure FargoDomeSkyway Maintenance Other Revenue Debt Water Infrastructure Municipal AirportParking Authority Wastewater Infrastructure Parking Repairs Flood Sales TaxParking Surplus FM Diversion Sales Tax
Community DevelopmentHUD Home Program
Neighborhood StabilizationHUD Home Participating Jurisdiction
Downtown BIDNRI Loans
Baseball Stadium
General Fund:
Improvement Bond Fund:
‐ Agency Funds are not budgeted
Sales Tax Bonds Fund:
Water Fund:
GOVERNMENTAL FUNDS
PROPRIETARYFUNDS
This fund accounts for the activities (revenues, operating and capital expenses) of the City's water system. The City receives user fee revenues derived from sale of water and other related services to the general public.
Budgeted Funds Information: Major Fund Descriptions:
‐ All capital project and debt service funds are consolidated in the presentation of our Comprehensive Annual Financial Report (CAFR)
The General Fund accounts for all financial resources not allocated to other funds. Majority of revenues derived from State Intergovernmental revenues, property taxes, and charges for services.
This fund accounts for all refunding improvement bond funds required by bond covenants from individual Refunding Improvement Bond issues. It accounts for all special assessments levied for the payment of bonded indebtedness.
The Sales Tax Bond Fund accounts for all resources and related debt payments associated with sales tax revenue bonds. This fund is structured to comply with various bond covenants associated with individual sales tax backed debt issues. Sales tax resources are voter approved and have been authorized for a twenty year period.
‐ North Dakota Century Code (NDCC) 40‐40 requires budget approval for General, Special Revenue and Debt Service Funds‐ City of Fargo budgets for funds required in NDCC 40‐40 plus enterprise funds, and pension trust funds‐ Capital project funds are not budgeted as projects are authorized in capital improvement plans or as developed and approved individually
‐ Major funds are identified in the chart above and are categorized based upon being more than 10% of the consolidated budget total as further described on the next page
8

Fiduciary FundsGeneral Debt Special Water Non Major Pension ConsolidatedFund Service Revenue Utility Utilities Funds Totals
Property Taxes 23,668,000$ 4,022,000$ 517,000$ ‐$ 932,341$ ‐$ 29,139,341$ Sales Taxes ‐ 20,148,345 ‐ ‐ ‐ ‐ 20,148,345 Other Taxes ‐ ‐ 1,906,905 ‐ ‐ ‐ 1,906,905 Special Assessments ‐ 29,700,000 294,000 ‐ 8,000 ‐ 30,002,000 Franchise Fees 5,391,500 ‐ ‐ ‐ ‐ ‐ 5,391,500
Licenses & Permits 4,790,000 ‐ ‐ ‐ ‐ ‐ 4,790,000 Federal Intergovernmental 4,019,080 ‐ 1,567,000 ‐ 6,883,000 ‐ 12,469,080 State/Local Intergovernmental 17,621,990 ‐ 40,999 ‐ 140,000 ‐ 17,802,989 Charges for Services 17,637,863 ‐ 1,931,000 ‐ ‐ ‐ 19,568,863 Fines & Forfeits 2,536,500 ‐ 100,000 ‐ ‐ ‐ 2,636,500 Investment Income 3,129,000 300,000 ‐ ‐ 2,466,650 6,595,000 12,490,650 Miscellaneous 921,067 ‐ 760,551 15,000 1,543,100 ‐ 3,239,718 Transfers In 13,066,000 11,138,637 69,545 3,942,600 4,066,475 ‐ 32,283,257 Public Utility Fees ‐ ‐ ‐ 24,076,000 41,881,352 ‐ 65,957,352 Utility Byproduct Sales ‐ ‐ ‐ ‐ 1,185,000 ‐ 1,185,000 Employee/Employer Contributions ‐ ‐ ‐ ‐ ‐ 6,585,000 6,585,000
92,781,000 65,308,982 7,187,000 28,033,600 59,105,918 13,180,000 265,596,500
General Government 16,901,825 ‐ ‐ ‐ ‐ ‐ 16,901,825 Public Safety 36,998,992 ‐ 240,000 ‐ ‐ ‐ 37,238,992 Public Works 11,675,588 ‐ 352,000 ‐ ‐ ‐ 12,027,588 Public Health & Welfare 11,224,691 ‐ ‐ ‐ ‐ ‐ 11,224,691 Recreation & Culture 4,601,818 ‐ 2,942,000 ‐ 10,412,800 ‐ 17,956,618 Urban Development ‐ ‐ 1,725,000 ‐ ‐ ‐ 1,725,000 Public Transportation 8,326,384 ‐ 1,228,365 ‐ 18,560,992 ‐ 28,115,741 General Support 1,167,015 ‐ ‐ ‐ ‐ ‐ 1,167,015 Unallocated (519,803) ‐ ‐ ‐ ‐ ‐ (519,803) Public Utilities ‐ ‐ ‐ 12,876,732 24,001,725 ‐ 36,878,457 Capital Outlay 3,045,300 ‐ ‐ ‐ ‐ ‐ 3,045,300 Debt Service Normal Redemption ‐ 28,230,000 ‐ 3,856,000 719,500 ‐ 32,805,500 Debt Service Early Redemption ‐ 850,000 ‐ ‐ ‐ ‐ 850,000 Debt Service ‐ Interest & Fees ‐ 20,857,500 ‐ 135,100 182,850 ‐ 21,175,450 Plan Administration ‐ ‐ ‐ ‐ ‐ 307,000 307,000 Plan Benefits ‐ ‐ ‐ ‐ ‐ 6,485,000 6,485,000 Transfers Out 2,284,190 16,379,185 943,635 11,717,600 6,763,000 ‐ 38,087,610
95,706,000 66,316,685 7,431,000 28,585,432 60,640,867 6,792,000 265,471,984 (2,925,000) (1,007,703) (244,000) (551,832) (1,534,949) 6,388,000 124,516 36,317,979 87,716,055 2,709,679 209,116,910 503,672,383 93,977,359 933,510,365
Intra‐fund Transfer (1,200,000) ‐ ‐ ‐ ‐ ‐ (1,200,000) 32,192,979$ 86,708,352$ 2,465,679$ 208,565,078$ 502,137,434$ 100,365,359$ 932,434,881$
Notes: ‐ NDCC 40‐40 defines Municipal Budget laws‐ Non Major Utility Funds includes Wastewater, Storm Sewer, Solid Waste, Street Lighting, Forestry, Vector Control, SE Cass, Fargodome and Airport Authority. Budget approval required pursuant to City Home Rule Charter‐ All Debt Service fund balances are restricted for future debt payments in accordance with bond covenants
Governmental Funds Proprietary FundsCity of Fargo, North DakotaSummary of All Budgeted FundsFY 2017
Revenues & Transfers In
Total Revenues & Transfers InFinancial Uses:
Total Financial UsesSurplus (Deficit)
‐ Capital project funds are considered non budgeted funds pursuant to NDCC 40‐40‐ Proprietary Fund Equity = Total Net Assets‐ Depreciation of Net Assets is not a budgeted item
Fund/Equity Balance, Beginning
Fund/Equity Balance, Ending
9

City of Fargo, North DakotaThree Year Summary of All Funds(In Thousands of Dollars) 2015 2016 2017 2015 2016 2017 2015 2016 2017 2015 2016 2017
Actual Budget Budget Actual Budget Budget Actual Budget Budget Actual Budget BudgetRevenues & Transfers In
Property Taxes 20,395.1$ 21,936.0$ 23,668.0$ 3,293.9$ 3,318.0$ 4,022.0$ 2,818.7$ 468.0$ 517.0$ 26,507.7$ 25,722.0$ 28,207.0$ Sales Taxes ‐ ‐ ‐ 25,494.2 26,082.0 20,148.3 ‐ ‐ ‐ 25,494.2 26,082.0 20,148.3 Other Taxes ‐ ‐ ‐ ‐ ‐ ‐ ‐ 2,519.9 1,906.9 ‐ 2,519.9 1,906.9 Special Assessments ‐ ‐ ‐ 26,570.1 26,099.7 29,700.0 223.3 294.0 294.0 26,793.4 26,393.7 29,994.0 Franchise Fees 4,943.4 5,332.0 5,391.5 ‐ ‐ ‐ ‐ ‐ ‐ 4,943.4 5,332.0 5,391.5
Licenses & Permits 4,990.7 4,580.0 4,790.0 ‐ ‐ ‐ ‐ ‐ ‐ 4,990.7 4,580.0 4,790.0 Federal Intergovernmental 4,325.8 4,511.4 4,019.1 ‐ ‐ ‐ 1,558.8 1,748.0 1,567.0 5,884.6 6,259.4 5,586.1 State/Local Intergovernmental 21,285.9 18,421.6 17,622.0 ‐ ‐ ‐ 51.7 49.7 41.0 21,337.6 18,471.3 17,663.0 Charges for Services 20,609.0 21,707.6 17,637.9 ‐ ‐ ‐ 1,580.2 1,404.3 1,931.0 22,189.2 23,111.9 19,568.9 Fines & Forfeits 2,443.7 2,641.0 2,536.5 ‐ ‐ ‐ 16.7 100.0 100.0 2,460.4 2,741.0 2,636.5 Investment Income 2,117.2 2,457.0 3,129.0 454.2 150.0 300.0 1.8 8.1 ‐ 2,573.2 2,615.1 3,429.0 Miscellaneous 979.7 991.2 921.1 39.5 ‐ ‐ 569.8 264.9 760.6 1,589.0 1,256.1 1,681.6 Transfers In 10,505.3 11,696.0 13,066.0 853.7 9,682.4 11,138.6 181.9 99.8 69.5 11,540.8 21,478.2 24,274.2 Public Utility Fees ‐ ‐ ‐ ‐ ‐ ‐ ‐ ‐ ‐ ‐ ‐ ‐ Utility Byproduct Sales ‐ ‐ ‐ ‐ ‐ ‐ ‐ ‐ ‐ ‐ ‐ ‐ Loans/Bonds/Capital Leases Issued 164.5 ‐ ‐ 37,994.7 ‐ ‐ ‐ ‐ ‐ 38,159.2 ‐ ‐ Capital Contributions ‐ ‐ ‐ ‐ ‐ ‐ ‐ ‐ ‐ ‐ ‐ ‐
Total Revenues & Transfers In 92,760.3 94,273.7 92,781.0 94,700.4 65,332.0 65,309.0 7,002.9 6,956.7 7,187.0 194,463.6 166,562.4 165,277.0 Financial Uses:
General Government 15,087.6 16,306.0 16,901.8 ‐ ‐ ‐ ‐ ‐ ‐ 15,087.6 16,306.0 16,901.8 Public Safety 33,326.5 36,033.9 36,999.0 ‐ ‐ ‐ 119.2 190.5 240.0 33,445.6 36,224.4 37,239.0 Public Works 9,716.9 10,944.8 11,675.6 531.1 ‐ ‐ 231.3 302.0 352.0 10,479.2 11,246.8 12,027.6 Public Health & Welfare 10,412.8 10,345.3 11,224.7 ‐ ‐ ‐ 102.0 63.9 ‐ 10,514.7 10,409.2 11,224.7 Recreation & Culture 4,391.0 4,560.6 4,601.8 ‐ ‐ ‐ 2,869.0 2,821.9 2,942.0 7,260.0 7,382.4 7,543.8 Urban Development ‐ ‐ ‐ 118.86 ‐ ‐ 1,847.5 1,879.8 1,725.0 1,966.4 1,879.8 1,725.0 Public Transportation 7,031.1 7,336.5 8,326.4 ‐ ‐ ‐ 984.5 1,037.7 1,228.4 8,015.6 8,374.1 9,554.7 General Support 1,200.1 1,080.2 1,167.0 ‐ ‐ ‐ ‐ ‐ ‐ 1,200.1 1,080.2 1,167.0 Unallocated ‐ (75.0) (519.8) ‐ ‐ ‐ ‐ ‐ ‐ ‐ (75.0) (519.8) Public Utilities ‐ ‐ ‐ ‐ ‐ ‐ ‐ ‐ ‐ ‐ ‐ ‐ Capital Outlay 4,425.4 4,135.0 3,045.3 ‐ ‐ ‐ 8.6 100.0 ‐ 4,434.0 4,235.0 3,045.3 Debt Service Normal Redemption 72.89 ‐ ‐ 22,816.0 ‐ 28,230.0 ‐ ‐ ‐ 22,888.9 ‐ 28,230.0 Debt Service Early Redemption ‐ ‐ ‐ ‐ 2,780.0 850.0 ‐ ‐ ‐ ‐ 2,780.0 850.0 Debt Service ‐ Interest & Fees 6.69 ‐ ‐ 19,702.9 20,420.2 20,857.5 ‐ ‐ ‐ 19,709.6 20,420.2 20,857.5 Non Operating Expenses ‐ ‐ ‐ ‐ ‐ ‐ ‐ ‐ ‐ ‐ ‐ ‐ Transfers Out 5,143.4 5,764.7 2,284.2 21,955.7 21,124.4 16,379.2 122.5 390.7 943.6 27,221.5 27,279.8 19,607.0
Total Financial Uses 90,814.3 96,431.8 95,706.0 65,124.6 44,324.6 66,316.7 6,284.6 6,786.4 7,431.0 162,223.5 147,542.9 169,453.7 Surplus (Deficit) 1,946.0 (2,158.1) (2,925.0) 29,575.8 21,007.4 (1,007.7) 718.2 170.3 (244.0) 32,240.1 19,019.6 (4,176.7) Fund/Equity Balance, Beginning 37,230.0 39,176.0 36,317.9 61,094.9 90,670.7 111,678.1 1,821.1 2,539.4 2,709.7 100,146.0 132,386.1 150,705.7 Intra‐fund Transfer ‐ 700.0 1,200.0 ‐ ‐ ‐ ‐ ‐ ‐ ‐ 700.0 1,200.0 Fund/Equity Balance, Ending 39,176.0$ 36,317.9$ 32,192.9$ 90,670.7$ 111,678.1$ 110,670.4$ 2,539.4$ 2,709.7$ 2,465.7$ 132,386.1$ 150,705.7$ 145,329.0$
GOVERNMENTAL FUNDSNon Major Funds Total Governmental FundsGeneral Fund (Major Fund) Debt Service Fund ( Major Fund)
10

City of Fargo, North DakotaThree Year Summary of All Funds(In Thousands of Dollars) 2015 2016 2017 2015 2016 2017 2015 2016 2017 2015 2016 2017
Actual Budget Budget Actual Budget Budget Actual Budget Budget Actual Budget BudgetRevenues & Transfers In
Property Taxes ‐$ ‐$ ‐$ 744.0$ 824.0$ 932.3$ 744.0 824.0$ 932.3$ 27,251.7$ 26,546.0 29,139.3$ Sales Taxes ‐ ‐ ‐ ‐ ‐ ‐ ‐ ‐ ‐ 25,494.2 26,082.0 20,148.3 Other Taxes ‐ ‐ ‐ ‐ ‐ ‐ ‐ ‐ ‐ ‐ 2,519.9 1,906.9 Special Assessments ‐ ‐ ‐ ‐ 8.0 8.0 ‐ 8.0 8.0 26,793.4 26,401.7 30,002.0 Franchise Fees ‐ ‐ ‐ ‐ ‐ ‐ ‐ ‐ ‐ 4,943.4 5,332.0 5,391.5
Licenses & Permits ‐ ‐ ‐ ‐ ‐ ‐ ‐ ‐ ‐ 4,990.7 4,580.0 4,790.0 Federal Intergovernmental ‐ ‐ ‐ 3,372.0 10,000.0 6,883.0 3,372.0 10,000.0 6,883.0 9,256.6 16,259.4 12,469.1 State/Local Intergovernmental ‐ ‐ ‐ 845.4 140.0 140.0 845.4 140.0 140.0 22,183.0 18,611.3 17,803.0 Charges for Services ‐ ‐ ‐ ‐ ‐ ‐ ‐ ‐ ‐ 22,189.2 23,111.9 19,568.9 Fines & Forfeits ‐ ‐ ‐ ‐ ‐ ‐ ‐ ‐ ‐ 2,460.4 2,741.0 2,636.5 Investment Income 99.4 139.3 ‐ 308.5 3,088.8 2,466.7 407.9 3,228.1 2,466.7 2,981.1 5,843.2 5,895.7 Miscellaneous 162.5 35.0 15.00 208.1 1,140.5 1,543.1 370.6 1,175.5 1,558.1 1,959.6 2,431.6 3,239.7 Transfers In 1,300.0 3,962.1 3,942.6 6,051.1 2,616.5 4,066.5 7,351.1 6,578.5 8,009.1 18,892.0 28,056.7 32,283.3 Public Utility Fees 19,134.8 22,255.7 24,076.0 42,321.8 41,432.2 41,881.4 61,456.6 63,687.9 65,957.4 61,456.6 63,687.9 65,957.4 Byproduct Sales ‐ ‐ ‐ 1,183.0 1,185.0 1,185.0 1,183.0 1,185.0 1,185.0 1,183.0 1,185.0 1,185.0 Loans/Bonds Issued ‐ ‐ ‐ ‐ ‐ ‐ ‐ ‐ ‐ 38,159.2 ‐ ‐ Capital Contributions 28,728.9 ‐ ‐ 25,972.3 ‐ ‐ 54,701.1 ‐ ‐ 54,701.1 ‐ ‐
Total Revenues & Transfers In 49,425.5 26,392.1 28,033.6 81,006.2 60,435.0 59,105.9 130,431.7 86,827.0 87,139.5 324,895.3 253,389.5 252,416.5 Financial Uses: ‐ ‐
General Government ‐ ‐ ‐ ‐ ‐ ‐ ‐ ‐ ‐ 15,087.6 16,306.0 16,901.8 Public Safety ‐ ‐ ‐ ‐ ‐ ‐ ‐ ‐ ‐ 33,445.6 36,224.4 37,239.0 Public Works ‐ ‐ ‐ ‐ ‐ ‐ ‐ ‐ ‐ 10,479.2 11,246.8 12,027.6 Public Health & Welfare ‐ ‐ ‐ ‐ ‐ ‐ ‐ ‐ ‐ 10,514.7 10,409.2 11,224.7 Recreation & Culture ‐ ‐ ‐ ‐ 7,735.0 10,412.8 ‐ 7,735.0 10,412.8 7,260.0 15,117.4 17,956.6 Urban Development ‐ ‐ ‐ ‐ ‐ ‐ ‐ ‐ ‐ 1,966.4 1,879.8 1,725.0 Public Transportation ‐ ‐ ‐ ‐ 19,835.6 18,561.0 ‐ 19,835.6 18,561.0 8,015.6 28,209.7 28,115.7 General Support ‐ ‐ ‐ ‐ ‐ ‐ ‐ ‐ ‐ 1,200.1 1,080.2 1,167.0 Unallocated ‐ ‐ ‐ ‐ ‐ ‐ ‐ ‐ ‐ ‐ (75.0) (519.8) Public Utilities 9,604.7 11,274.0 12,876.7 28,380.4 24,658.8 24,001.7 37,985.1 35,932.8 36,878.5 37,985.1 35,932.8 36,878.5 Capital Outlay ‐ ‐ ‐ ‐ ‐ ‐ ‐ ‐ ‐ 4,434.0 4,235.0 3,045.3 Debt Service Normal Redemption ‐ 3,650.0 3,856.0 ‐ ‐ 719.5 ‐ 3,650.0 4,575.5 22,888.9 3,650.0 32,805.5 Debt Service Early Redemption ‐ ‐ ‐ ‐ ‐ ‐ ‐ ‐ ‐ ‐ 2,780.0 850.0 Debt Service ‐ Interest & Fees 421.3 299.2 135.1 989.6 ‐ 182.9 1,410.9 299.2 318.0 21,120.5 20,719.4 21,175.5 Depreciation 4,155.4 ‐ ‐ 17,829.6 ‐ ‐ 21,985.1 21,985.1 ‐ ‐ Non Operating Expenses 18.9 ‐ ‐ 290.5 ‐ ‐ 309.4 ‐ ‐ 309.4 ‐ ‐ Transfers Out 4,558.7 10,950.1 11,717.6 8,821.0 7,457.0 6,763.0 13,379.8 18,407.1 18,480.6 40,601.3 45,686.8 38,087.6
Total Financial Uses 18,759.0 26,173.3 28,585.4 56,311.2 59,686.4 60,640.9 75,070.2 85,859.7 89,226.3 237,293.7 233,402.5 258,680.0 Surplus (Deficit) 30,666.6 218.8 (551.8) 24,695.0 748.6 (1,534.9) 55,361.5 967.4 (2,086.8) 87,601.6 19,986.9 (6,263.5) Fund/Equity Balance, Beginning 178,231.6 208,898.1 209,116.9 478,228.8 502,923.8 503,672.4 656,460.4 711,821.9 712,789.3 756,606.4 844,208.0 863,495.0 Intra‐fund Transfer ‐ ‐ ‐ ‐ ‐ ‐ ‐ ‐ ‐ ‐ 700.0 1,200.0 Fund/Equity Balance, Ending 208,898.1$ 209,116.9$ 208,565.1$ 502,923.8$ 503,672.4$ 502,137.4$ 711,821.9$ 712,789.3$ 710,702.5$ 844,208.0$ 863,495.0$ 856,031.5$
PROPRIETARY FUNDSTotal Proprietary Funds GOVERNMENTAL & PROPRIETARY FUNDS
CONSOLIDATED TOTALSWater Utility (Major Fund) Non Major Utilities
11

Major Revenue Sources Review and Discussion
The Government Finance Officers Association (GFOA) best budget practices guidance recommends a discussion of major revenue source as an integral part of the budget document. A discussion of each major revenue source is provided to assist budget users in understanding where our funding is derived and how it is predicted in the annual budget process. The revenue categories are listed in order by the amount from largest to smallest and this discussion covers 70% of City‐wide revenues.
Sales Taxes
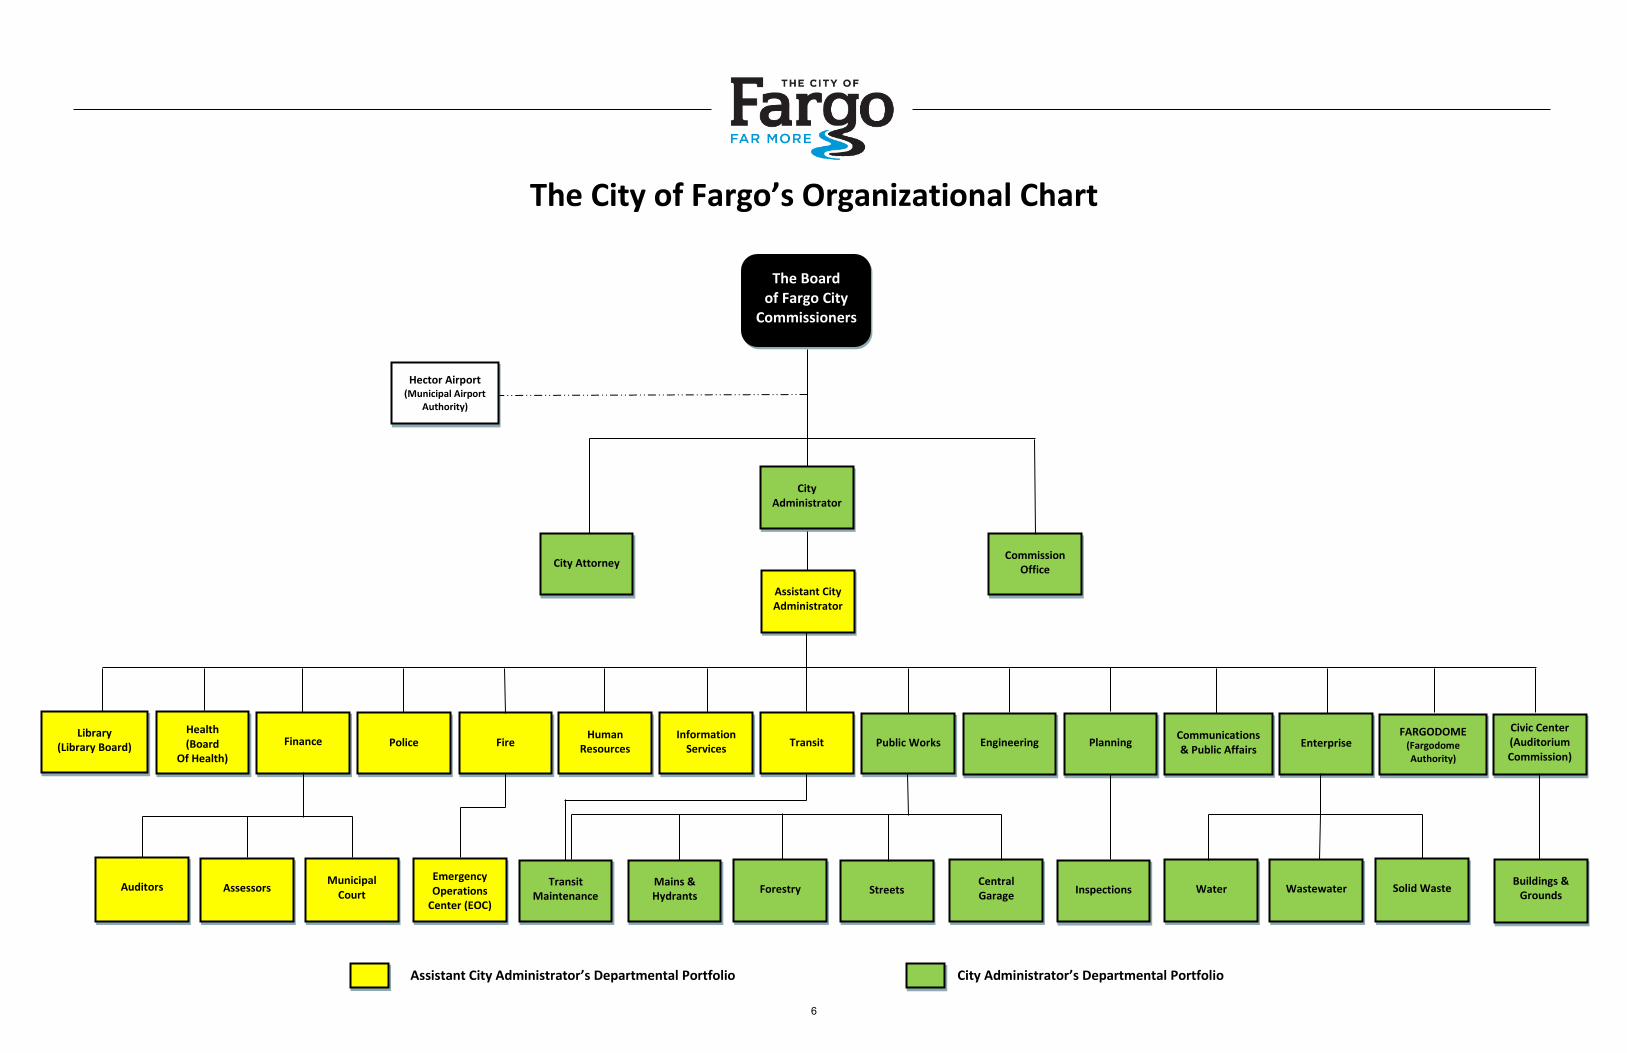
Sales taxes have been voter approved and are managed in accordance with the City’s Home Rule Charter sections 3(S), (T) and (U). All sales tax collected are dedicated by Charter for infrastructure projects and financing. Section 3(T) is dedicated for exclusive use on flood risk mitigation projects while section 3(S) and (U) have a broader definition of infrastructure. The combined sales tax rate levied by the City of Fargo is 2%. The State of North Dakota currently levies 5% sales and use tax and Cass County collects another .5%. All collections are administered by the State Tax Commission’s Office under contract with the City. Collections are remitted monthly as collected by the State. The City uses historical trending and a local economic assessment process in projecting future sales tax revenues. The City uses the same sales tax exemptions methodology as deployed by the State of North Dakota. We are forecasting collections of $53.7 million in 2017. A growth assumption of 3% has been applied to the sales tax revenue forecast based upon past practices and monitoring of our long term collection trends.
All sales tax resources are dedicated for infrastructure funding. A portion of our sales tax revenue is pledged to long term debt repayment for projects already constructed. Of the total expected sales tax collection of $53.7 million, $20.1 million is budgeted in the debt service funds and the remaining amount of $33.6 is allocated to the capital project fund. North Dakota State law does not require that capital project funds be included in our annual budget so the portion allocated to this fund group is not shown in our consolidated budget totals.
Voters will be asked to extend our sales tax authority for HRC Sections 3(T) and 3(U) to provide a long term funding source for the FM Area Diversion Project which was approved by the Army Corp of Engineers in July, 2016.
12
2013** 2014 2015 2016 2017Sales Tax 47.11 48.34 50.40 52.16 53.72% Increase 13.6% 2.6% 4.3% 3.5% 3.0%
$20
$30
$40
$50
$60Sales Tax Collections (in Millions)
** New 1/2 cent infrastructure sales tax began January 1, 2013
Public Utility Fees
Utility Fees
The City provides municipal utilities including water, wastewater, solid waste, storm sewer, street lighting, vector control and forestry services. All fees are established by resolution of the City Commission and are set at levels to sustain our utility services. We anticipate collecting of $55.1 million in public utility fees in 2017, up from $51.4 in 2016. Fargo becoming water service provider to the City of West Fargo in June of 2016 which increased our Water Fund revenues by approximately $2 million. In 2017 we expect consecutive user revenue to increase by an additional $2.2 million due to the change in our customer base by adding West Fargo. Rate increases are recommended in Forestry and Solid Waste landfill tipping fees.
Budgeting methodology for public utility fees include historical analysis of growth and demand for new services as new subdivisions develop. The City is a regional water service provider to Cass Rural Water Users District that operates in our southern areas as well as providing wastewater services to smaller cities adjacent to Fargo, including West Fargo.
We are also cognizant of what other cities charge for these utility services and participate in a regional rate study each year that compares several rate structures in other nearby cities as well as using innovative methods to keep our rates as low as possible. Currently, Fargo utility fees for water, wastewater, and storm sewer fees are approximately 12% lower than that average of fourteen other North Dakota cities.
13

Long term master planning for both operational and capital planning is updated annually. Sales tax resources are used to fund expensive infrastructure which allows us to keep utility rates stable.
$0 $10 $20 $30 $40 $50 $60
2013
2014
2015
2016
2017
2013 2014 2015 2016 2017Water $19.05 $18.31 $19.13 $22.21 $24.01
Soild Waste $11.18 $12.31 $11.85 $12.46 $13.87
Wastewater $11.05 $10.18 $10.33 $11.31 $11.48
Street Lighting $1.67 $1.70 $1.75 $1.68 $1.72
Forestry $1.39 $1.44 $1.46 $1.42 $1.68
Storm Sewer $1.56 $1.58 $1.60 $1.63 $1.65
Vector Control $0.65 $0.66 $0.68 $0.69 $0.70
SE Cass $0.04 $0.04 $0.03 $0.02 $0.02
Total $46.58 $46.21 $46.84 $51.42 $55.13
Public Utility Fees (in Millions)
Byproduct Revenues
Fargo has been a leader in innovation by leveraging our utility operations to maximum benefit. Innovative projects include converting methane gas from our landfill to electricity, selling surplus methane gas to a local business, and reusing wastewater for ethanol production. All of these initiatives are producing additional revenue as byproducts of our traditional utility operations. Long term agreements are in place and these operations continued to be a mutual benefit to our citizens and private partners. A total of $1.2 million is being budgeted for 2017.
14

Special Assessments
Special assessments are a widely used method of funding infrastructure projects in North Dakota.
Those who benefit from infrastructure projects help pay for these improvements. Special assessment benefit districts are established during the project planning phase and final project costs are allocated to property parcels after the projects are completed based upon the benefits they receive. Assessments are accounted for on a project specific basis and therefore we are able to predict our certified assessment revenues with a high degree of certainty. Most assessments are collected over a twenty‐five‐year period which mirrors the useful life of the infrastructure asset. A property owner may choose to prepay their entire assessment and funds accumulated are restricted within debt service funds for the payment of long term debt.
The amount budgeted in 2017 of $30 million is based upon projects currently on the assessment rolls and an allowance for assessment prepayments. This revenue source will continue to rise as our community continues to grow. Funds collected from certified assessment collections plus assessment prepayment accumulations are sufficient to cover our annual debt service requirements. We have increased our revenue projections slightly in anticipation of a continued pattern of citizens prepaying their special assessments.
2013 2014 2015 2016 2017
Special Assessment $28.20 $32.49 $26.79 $26.40 $30.00
$0
$10
$20
$30
$40
Special Assessment Fees (in Millions)
15

Property Taxes
Property taxes provide about 26% of our overall General Fund revenues. The City’s Home Rule Charter contains a tax mill cap of 64 mills. The 2017 approved budget recommends a mill levy reduction of two mills to 53 mills. This leaves an unused tax capacity of eleven mills. Tax collections are based upon the mill levy established by the Board of City Commissioners which is evaluated as part of our annual budget process. Tax collections are estimated based upon the final property tax rolls and are collected by Cass County and remitted to the City as they become due in February. We are projecting total property tax collections of $29 million an increase of 9.8%. Approximately 5% of the increase is directly related to newly constructed properties being added to the tax rolls and the remainder is a function of the increase in market valuations as required by State Law.
The City of Fargo reduced our tax mill levy by 2.25 mills during the 2016 development budget process.
2013 2014 2015 2016 2017Property Taxes $22.65 $23.31 $24.82 $26.55 $29.14
Mills 57.25 57.25 57.25 55.00 53.00
$0
$10
$20
$30
$40
Property Taxes (in Millions)
Intergovernmental Revenues
Intergovernmental revenues come directly from other governmental units. Funding is received from federal, state and local agencies. Revenues are commonly received in the form of grants for specific purposes or may be more general in nature.
16

Intergovernmental revenues have been increasing as a percentage of our overall revenue base in the past few years’ state resources have been rising during a time when federal revenues are declining. The State of North Dakota’s economic conditions have declined significantly in the past two years and as a result our state aid sources are also declining. The largest single State intergovernmental revenue source is from state aid that is derived from statewide sales tax collections. We are projecting a decline in this revenue source of approximately $3.8 million for 2017, along with an additional decline in state highway funds of $2.8 million, both of these revenues are accounted for in the general fund. Historical revenue trends for intergovernmental revenues in governmental funds are shown in the following chart.
$0.00 $5.00 $10.00 $15.00 $20.00 $25.00 $30.00 $35.00 $40.00 $45.00
2013
2014
2015
2016
2017
2013 2014 2015 2016 2017Federal $9.06 $8.78 $9.26 $16.26 $12.47
State $23.69 $20.98 $19.96 $23.36 $16.25
Local $2.09 $2.19 $2.22 $1.46 $1.55
Intergovernmental Revenue (in Millions)
The City budgets for grant revenue based upon approved grant agreements. Budgets are modified during the year as new grants are awarded and approved by the Board of City Commissioners. State intergovernmental revenues are estimated based upon financial statistics reported by the State of North Dakota or other entities, historical trending and an assessment of the statewide economy. We do not use an external economist to predict State revenues sources; however, our existing budget process contains a mid‐year revenue revision if needed. State intergovernmental revenues projections for 2016 have been reduced as a result of the current economic conditions.
17

Charge for Services
Building Permits
The City charges a variety of fees associated with the delivery of services to our citizens. Building permits are one of the most prominent of our fees. They are an important indicator of our economic strength and the level of construction activity in our local economy. Fees are established by the City Commission and are updated periodically.
Fargo set an all‐time record level of building activity in 2014 with permit values exceeding $ 1 billion. Significant expansions are occurring in our health services sector with Sanford and Essentia Hospitals building more or expanded capacity to meet the needs of the region. The past two years permit activity reflect continued strong demand for both residential and commercial construction. The revenue projection for permit fees reflects continued confidence in our local economy and as of July, 2016 single family home construction increased by over 252 units, or 50% as compared to the prior year.
2012 2013 2014 2015 2016
BuildingPermits $293 $378 $1,012 $501 $450
$0
$200
$400
$600
$800
$1,000
$1,200
Building Permits Value (in Millions)
Capital Project Engineering and Engineering Fees
Engineering and administrative fees are charged for the management and delivery of capital projects. These fees are part of our base revenues associated with the design, development, construction and administration of a robust infrastructure deployment program. The table below shows the trend of this revenue source. We expect this revenue source to remain in line with the 2016 budget levels.
18

Charges for Service
The trend for all charge for services revenue accounts is shown in the following graph. We anticipate overall revenue levels to be similar to the 2016 budgeted levels.
2013 2014 2015 2016 2017
Charges for Services $18.31 $20.67 $22.19 $23.11 $19.57
$0
$10
$20
$30
Charges for Services (in Millions)
2013 2014 2015 2016 2017Engineering &Admin Fees $8.70 $10.52 $12.14 $7.88 $8.38
$0
$4
$8
$12
$16Engineering and Administration Fees (in Millions)
19

Schedule of Changes in Governmental Fund Balances
Fund Fund % ChangeBalance Revenues & Expenditures & Intra‐fund Balance Increase / In Fund
Fund Year January 1 Transfers In Transfers Out Transfer December 31 (Decrease) Balance
General Fund2013 32,668,340 90,072,673 90,876,563 ‐ 31,864,450 (803,890) ‐2%
2014 (Revised) 33,280,588 93,283,503 89,334,053 ‐ 37,230,038 3,949,450 12%2015 37,230,038 92,760,292 90,814,278 ‐ 39,176,052 1,946,014 5%
2016 (Revised Budget) 39,176,052 94,273,741 96,431,814 700,000 36,317,979 (2,858,073) ‐7%2017 36,317,979 92,781,000 95,706,000 1,200,000 32,192,979 (4,125,000) ‐11%
Special Revenue Funds2013 241,807 8,263,452 8,125,310 ‐ 379,949 138,142 57%2014 379,949 10,904,165 9,462,966 ‐ 1,821,148 1,441,199 379%2015 1,821,148 7,002,858 6,284,612 ‐ 2,539,394 718,246 39%2016 2,539,394 6,956,694 6,786,409 ‐ 2,709,679 170,285 7%2017 2,709,679 7,187,000 7,431,000 ‐ 2,465,679 (244,000) ‐9%
Debt Service Funds2013 103,608,342 73,935,525 74,669,179 ‐ 102,874,688 (733,654) ‐1%2014 102,874,688 108,037,441 149,817,276 ‐ 61,094,853 (41,779,835) ‐41%2015 61,094,853 94,700,412 65,124,577 ‐ 90,670,688 29,575,835 48%2016 90,670,688 65,332,001 68,286,634 ‐ 87,716,055 (2,954,633) ‐3%2017 87,716,055 65,308,982 66,316,685 ‐ 86,708,352 (1,007,703) ‐1%
Total All Budgeted Governmental Funds2013 136,518,489 172,271,650 173,671,052 ‐ 135,119,087 (1,399,402) ‐1%2014 136,535,225 212,225,109 248,614,295 ‐ 100,146,039 (36,389,186) ‐27%2016 100,146,039 194,463,562 162,223,467 ‐ 132,386,134 32,240,095 32%
2016 132,386,134 166,562,436 171,504,857 ‐ 127,443,713 (4,942,421) ‐4%
2017 126,743,713 165,276,982 169,453,685 ‐ 122,567,010 (4,176,703) ‐3%
20

Fund Balance Definitions Fiscal Trends and Comments
Fund balance is the difference between assets and liabilities and is one of many measurements of an entities overall financial strength. Pursuant to the Governmental Accounting Standards Board standard fund balances should be categorized as follows: Non‐spendable – Cannot be spent as is legally restricted. Restricted – Subject to externally imposed restrictions, laws, bond covenants or other means. Committed – Constrained by action of the Board of City Commissioners. Cannot be used for other purposes unless approved at the same level of authority. Assigned – Intended to be used for a specific purpose. Intent can be expressed by City Commission or someone to whom authority has been delegated. Unassigned – Unrestricted and available to appropriate.
General Fund Balances are maintained
in this budget in accordance with the City’s fund balance policies.
The General Fund balance is projected to decrease by $2,925,000 in 2017.
There continues to be significant
accumulation of resources in our Debt Service funds associated with the prepayment of special assessments.
A schedule of projected changes in
governmental fund balances is included in the following pages by fund type. Capital project funds have been excluded since they are not required to be included in the budget pursuant to North Dakota budget law.
FUND BALAN
CE REPORTIN
G
21

Fund Description Fiscal Trends
The General Fund accounts for all revenues and expenditures of the City of Fargo which are not accounted for in other funds and is the largest and most important operating fund. Our revenue sources include a diverse blend of taxes, licenses & permits, intergovernmental revenues, charges for services, fines and forfeits, interest and other revenues. Major functional programs include General Governmental Services, Public Safety, Public Works, Public Health and Welfare, Recreation & Culture, Public Transportation, General Support, and Capital Outlay.
Budget strategy is focused on
continuation of providing high quality services and lowering the budget growth and modest use of fund balance.
Property tax values continue to increase as a result of a high level of residential and commercial construction. We expect this trend to continue.
State revenues have decreased significantly due to the slow‐down in the North Dakota’s economic conditions.
Construction activity and building
permit revenues remain strong. Single family home construction is exceeding last year’s pace by about 50%.
There are consistent demands upon
our allocable resources for items related to growth such as municipal facilities, staffing and operational costs.
General Fund balance goals will be
maintained in accordance with our fund balance policies.
GEN
ERAL FUND
22

2016Fund Balance, Beginning of Year 39,176,052$
Original Budgeted Resources 94,295,000
Revenue Revisions Approved Y-T-D 485,741Mid-Year Revenue Adjustment Recommendations (507,000)
REVISED RESOURCES AVAILABLE 94,273,741
Original Budget Expenditures & Transfers (94,115,000)Year End Budget Carryovers (1,592,390)Other Budget Amendments (664,424)Mid Year Expenditure Adjustments (60,000)
REVISED EXPENDITURES AND TRANSFERS (96,431,814)
Intra-fund Transfer (700,000)
2017: use of fund balance
Projected Fund Balance, Beginning of Year (2,858,073)$ 36,317,979$
PROJECTED REVENUES & TRANSFERS 91,581,000TRANSFER IN FROM REVENUE STABILIZATION FUND 1,200,000
Projected Resources Available In 2017 129,098,979
PROJECTED EXPENDITURES & TRANSFERS (95,706,000)
Intra-fund Transfer (1,200,000)
use of fund balanceProjected Fund Balance - December 31, 2017 (4,125,000)$ 32,192,979$
Summary 2017 Totals
Total Resources 92,781,000$
Total Expenditures & Transfers (95,706,000)
General Fund Projected Budget Surplus or (Deficit) (2,925,000)$
CITY OF FARGO, NORTH DAKOTAGENERAL FUND
2017 BUDGET SUMMARY(NDCC 40-40 Compliance Format)
23

State & Local Intergovt.
$17,621,990 19%
Property Tax$23,668,000
26%
Charges for Services$17,637,863
19%
Franchise Fees$5,391,500
6%
Licenses & Permits$4,790,000
5%
Federal Intergovt.$4,019,080
4%
Fines & Forfeits$2,536,500
3%
Investment Income$3,129,000
3%
Miscellaneous$921,067
1%
Transfers In$13,066,000
14%
CITY OF FARGO, ND2017 GENERAL FUND BUDGETED REVENUES
Total Budgeted Revenues = $92,781,000
24

2016 2017Approved Approved $ %
Revenue Source Budget Budget Change Change
Property Taxes 21,936,000$ 23,668,000$ 1,732,000$ 7.9%
Franchise Fees 5,332,000 5,391,500 59,500 1.1%
Licenses & Permits 4,580,000 4,790,000 210,000 4.6%
Federal Grants 3,873,000 4,019,080 146,080 3.8%
State Share Revenues 23,248,000 16,191,317 (7,056,683) -30.4%
Local Grant Revenues 1,397,000 1,430,673 33,673 2.4%
Charges for Services 17,217,850 17,637,863 420,013 2.4%
Fines 2,641,000 2,536,500 (104,500) -4.0%
Interest 1,957,000 3,129,000 1,172,000 59.9%
Miscellaneous 1,117,150 921,067 (196,083) -17.6%
Transfers In 10,996,000 13,066,000 2,070,000 18.8%
Totals 94,295,000$ 92,781,000$ (1,514,000)$ -1.6%
CITY OF FARGO, NORTH DAKOTAGENERAL FUND REVENUE ANALYSIS
BY SOURCE
25

2016 20172013 2014 2015 APPROVED APPROVED
REVENUE SOURCES ACTUAL ACTUAL ACTUAL BUDGET BUDGET
Property Tax 20,328,451$ 21,009,268$ 20,395,061$ 21,936,000$ 23,668,000$
25.4% 25.1% 24.8% 26.3% 29.7%
Franchise Fees 4,789,000 5,177,263 4,943,428 5,332,000 5,391,500
6.0% 6.2% 6.0% 6.4% 6.8%
Licenses & Permits 3,672,167 7,224,633 4,990,708 4,580,000 4,790,000
4.6% 8.6% 6.1% 5.5% 6.0%
Federal Intergovt. 4,603,373 4,603,373 4,325,830 3,873,000 4,019,080
5.8% 5.5% 5.3% 4.6% 5.0%
State & Local Intergovt. 23,849,002 20,221,659 21,285,924 24,645,000 17,621,990
29.8% 24.2% 25.9% 29.6% 22.1%
Charges for Services 16,883,991 19,161,378 20,609,014 17,217,850 17,637,863
21.1% 22.9% 25.1% 20.7% 22.1%
Fines & Forfeits 2,458,979 2,265,238 2,443,652 2,641,000 2,536,500
3.1% 2.7% 3.0% 3.2% 3.2%
Investment Income 2,320,162 2,724,205 2,117,194 1,957,000 3,129,000
2.9% 3.3% 2.6% 2.3% 3.9%
Miscellaneous 1,067,674 1,152,319 1,144,199 1,117,150 921,067
1.3% 1.4% 1.4% 1.3% 1.2%
Total Revenues 79,972,799$ 83,539,336$ 82,255,010$ 83,299,000$ 79,715,000$
100.0% 100.0% 100.0% 100.0% 100.0%
Operating Transfers In 10,099,874 9,744,167 10,505,282 10,996,000 13,066,000
Total Revenues &Transfers In 90,072,673$ 93,283,503$ 92,760,292$ 94,295,000$ 92,781,000$
GENERAL FUND RESOURCES TRENDS
CITY OF FARGO, NORTH DAKOTA
26

Public Safety$36,998,992
39%
General Government$16,901,825
18%
Public Works$11,675,588
12%
Public Health & Welfare
$11,224,691 12%
Public Transportation$8,326,384
9%
Recreation & Culture$4,601,818
5%
Capital Outlay$3,045,300
3%
Unallocated($519,803)
-1%
General Support$1,167,015
1%
Transfers Out$2,284,190
2%
CITY OF FARGO, ND2017 GENERAL FUND BUDGETED EXPENDITURES
Total Budgeted Expenditures = $95,706,000
27

2016 2017 2017Approved Divisional Approved %
Expense Category Budget Requests Budget of Total $ %
Salaries 46,254,137$ 50,935,453$ 48,830,866$ 47% 2,576,729$ 5.6%Benefits 16,397,418 17,071,404 17,616,445 17% 1,219,027 7.4%Other Services 9,844,388 11,315,510 10,421,095 10% 576,707 5.9%Capital Outlay 7,166,000 10,009,929 3,045,300 3% (4,120,700) -57.5%
Major Cost Categories 79,661,943 89,332,296 79,913,706 76% 251,763 0.3%
Transfers 1,794,000 1,859,000 2,284,190 2% 490,190 27.3%Energy 3,132,019 3,173,495 3,173,495 3% 41,476 1.3%Repairs and Maintenance 3,371,357 3,582,841 3,537,741 3% 166,384 4.9%General Supplies 2,525,976 2,673,861 2,643,861 3% 117,885 4.7%Miscellaneous 1,043,243 1,075,318 1,075,318 1% 32,075 3.1%Travel & Education 782,576 833,379 831,379 1% 48,803 6.2%Insurance 609,947 634,527 634,527 1% 24,580 4.0%Communications 492,971 495,301 495,301 0% 2,330 0.5%Rentals 370,758 742,222 742,222 1% 371,464 100.2%Advertising and Printing 283,910 348,660 291,160 0% 7,250 2.6%Major Supplies 44,200 61,000 61,000 0% 16,800 38.0%Debt Service 2,100 52,100 22,100 0% 20,000 0.0%
Minor Cost Categories 14,453,057 15,531,704 15,792,294 15% 1,339,237 9.3%
Totals 94,115,000$ 104,864,000$ 95,706,000$ 91% 1,591,000$ 1.7%
CITY OF FARGO, NORTH DAKOTAGENERAL FUND EXPENDITURES
BY CATEGORY
Change from 2016 Approved Budget to 2017 Approved Budget
28
2016 2017 2017FUNCTIONAL 2013 2014 2015 APPROVED DIVISIONAL APPROVEDCOST CATEGORY ACTUAL ACTUAL ACTUAL BUDGET REQUESTS BUDGET
General 13,227,490$ 14,255,796$ 15,087,608$ 15,929,468$ 16,839,582$ 16,901,825$ Government
17.2% 17.6% 17.6% 17.3% 16.3% 18.1%
Public 29,191,990 31,097,859 33,326,475 34,929,918 35,964,546 36,998,992 Safety
37.8% 38.4% 38.9% 37.8% 35.0% 39.7%
Public 8,989,463 9,646,066 9,716,904 11,214,525 11,534,828 11,675,588 Works
11.7% 11.9% 11.3% 12.1% 11.2% 12.5%
Public Health 9,487,094 9,647,197 10,412,765 10,692,534 11,093,511 11,224,691 & Welfare
12.3% 11.9% 12.2% 11.6% 10.8% 12.0%
Recreation 4,095,944 4,364,445 4,390,993 4,353,070 4,504,696 4,601,818 & Culture
5.3% 5.4% 5.1% 4.7% 4.4% 4.9%
Unallocated - - - (806,303) 2,912,270 (519,803)
0.0% 0.0% 0.0% -0.9% 2.8% -0.6%
Public 7,032,387 7,162,185 7,031,084 7,821,638 8,982,623 8,326,384 Transportation
9.1% 8.8% 8.2% 8.5% 8.7% 8.9%
General 1,214,200 1,000,608 1,200,135 1,020,150 1,163,015 1,167,015 Support
1.6% 1.2% 1.4% 1.1% 1.1% 1.2%
Capital 3,832,405 3,896,102 4,504,952 7,166,000 10,009,929 3,045,300 Outlay
5.0% 4.8% 5.3% 7.8% 9.7% 3.3%
100.0% 100.0% 100.0% 100.0% 100.0% 100.0%TotalExpenditures 77,070,973$ 81,070,258$ 85,670,916$ 92,321,000$ 103,005,000$ 93,421,810$
TransfersOut to Other Funds 13,805,590 8,263,795 5,143,362 1,794,000 1,859,000 2,284,190
Total Expendituresand Transfers Out 90,876,563$ 89,334,053$ 90,814,278$ 94,115,000$ 104,864,000$ 95,706,000$
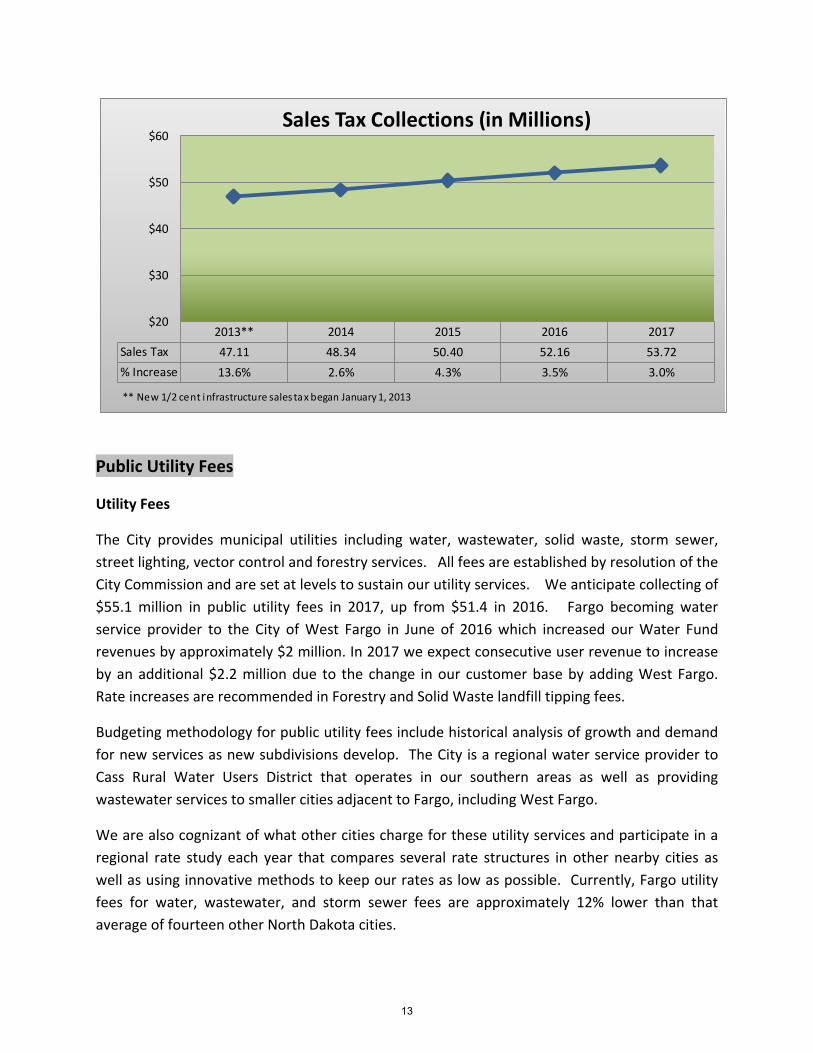
GENERAL FUND EXPENDITURES AND TRANSFERS
CITY OF FARGO, NORTH DAKOTA
29

Adjustment Detail Fund/Department Type Amounts Account # Reason For Adjustments
General Fund Revenue Adjustments:
Municipal Highway Funds General / Street & Eng. IG (2,000,000) 101-0000-335.10-00 State Aid Revenue DeclineState Aid Derived From Sales Tax General / Unrestricted IG (4,000,000) 101-0000-335.21-00 State Aid Revenue DeclineHUB City State Aid General / Unrestricted IG (200,000) 101-0000-335.15-00 State Aid Revenue DeclineCapital Project Administration General / Engineering CS 4,000,000 101-0000-348.05-10 Strong CIP and Infrastructure DemandCapital Project Administration General / Utilities CS 1,000,000 101-0000-348.05-15 Strong CIP and Infrastructure DemandCapital Project Administration General / Flood Control CS (500,000) 101-0000-348.05-20 CIP ProjectionPayroll Services General / Charges CS 18,000 101-0000-348.30-07 Payroll Services From FargoDomeTransit Bench Advertising General / Charges CS (25,000) 101-0000-361-85-20 Contract ChangesInterest Income General / Unrestricted MS 500,000 101-0000-360.20-00 Strong CIP and Infrastructure DemandTransfers In Other Funds General / Transfers TR 700,000 101-0000-391.10-00 Transfer From Revenue Stabilization
Total General Fund Revenues (507,000)$
General Fund Expenditure Adjustments:
Worker's Compensation General Support GS 60,000 101-1040-505-25-00 Increased premiums
Total General Fund Expenditures 60,000$
CITY OF FARGO, NORTH DAKOTA2017 GENERAL FUND MID-YEAR BUDGET ADJUSTMENTS
30

City of FargoGeneral Fund Revenue Projection Accuracy (In Millions)Summary of Last Ten Fiscal Years
Fiscal Original Revised Final VarianceYear Budget Budget Results Variance %
2015 80.6$ 81.8$ 82.1$ 0.3$ 0.4%2014 75.9 78.8 83.2 4.4 5.6%2013 70.5 79.5 79.9 0.4 0.5%2012 66.0 71.0 72.4 1.4 2.0%2011 60.3 67.4 73.1 5.7 8.5%2010 58.9 62.8 66.8 4.0 6.4%2009 56.2 62.6 63.5 0.9 1.4%2008 52.1 56.1 58.7 2.6 4.6%2007 48.1 52.9 51.6 (1.3) -2.5%2006 49.7 51.6 49.7 (1.9) -3.7%
Ten Year 618.3$ 664.5$ 681.0$ 16.5$ 2.5%
Analysis Notes:
Larger variances shown in 2010 and 2011 are a result of rapidly increasing Stateintergovernmental revenues derived from a very strong North Dakota economy whichwere unprecedented and very difficult to predict.
Larger variance shown in 2014 was the result of a record year for building permitsissued. The total value of building permits issued was $1.012 billion which is an all timerecord for the City. There was also a large increase in charges for services due to alarge volume and demand for infrastructure in new housing developments.
Data has been extracted from audited financial statements which are posted online @www.cityoffargo.com
31

Description of Service Provided Current or Emerging Issues
The City Administrator serves in the lead staff position responsible for policy and overall operations of the City and is the primary liaison between Departments and the City Commission. The City Administrator is an appointed position. Services include providing leadership, direction and ongoing support for City operations in addition to representing the City on several other Agencies or Authorities including: External: FM Diversion Authority Lake Agassiz Water Authority North Dakota Water Coalition Fargodome Building Committee Metropolitan Council of Governments Red River Valley Dispatch Center Local Governmental & Educational Units Internal: Budget Team, Public Works Evaluation, Personnel Evaluation, Utilities, CDBG, Building Authority, Emergency Management, Chair of Mayor's Cabinet, and other ad hoc committees assigned by the Mayor and City Commissioners.
In 2016, a reorganization of the City Administrator's Office occurred which added an assistant position as a new FTE. As a result, Michael Redlinger was competitively selected as the City's first Assistant City Administrator. The day‐to‐day departmental administrative duties have been divided in to portfolio assignments shared between the City Administrator and Assistant City Administrator. Major issues in 2017 are anticipated to include the following: FM Diversion In‐City Flood Protection Red River Valley Water Supply Project City Hall Construction Project Civic Plaza Development Civic Center Renovation/Replacement Project Downtown Parking Downtown Redevelopment City Center Comprehensive Plan Southside Area Planning Police Department Headquarters Water Plant Expansion Wastewater Plant Expansion Solid Waste Landfill Expansion Regionalization of Services Public Safety Staffing Etc.
City Adm
inistrator
32

2016 2016 20172015 Approved Revised Approved
Expenditures Actual Budget Budget BudgetSalaries 131,087$ 181,919$ 183,163$ 317,630$ Benefits 25,367 42,449 42,752 74,129 Other Services 35,425 15,200 15,200 50,200 Repairs and Maintenance ‐ 500 500 500 Rentals ‐ ‐ ‐ ‐ Insurance 664 730 730 730 Communications 952 1,400 1,400 1,400 Advertising and Printing ‐ 1,900 1,900 1,900 Travel & Education 6,422 13,550 13,550 15,700 Energy ‐ ‐ ‐ ‐ General Supplies 218 5,100 5,100 7,600 Major Supplies ‐ ‐ ‐ ‐ Miscellaneous 75 1,050 1,050 2,500 Capital Outlay ‐ ‐ ‐ ‐ Debt Service ‐ ‐ ‐ ‐ Transfers ‐ ‐ ‐ ‐
TOTAL 200,210$ 263,798$ 265,345$ 472,289$
Authorized Positions2015Actual
2016Approved
2016Revised
2017 Approved
Full Time Employees 1 1 2 2 Part Time Benefited ‐ ‐ ‐ ‐ Contracted Employees ‐ ‐ ‐ ‐
TOTAL 1 1 2 2
City Administrator
33

Description of Service Provided Current or Emerging Issues
The Human Resources Department is responsible for the direction of all human resource programs including the following:
Recruiting and Promotional Processes New Employee Orientation Compensation Job Classification Job Descriptions Benefit Administration Payroll Employee Maintenance Policy Development Performance Management Employee Relations Safety and WSI Administration Training and Development Compliance with Federal, state and local laws
and regulations.
Benefit and Leave Administration Based on pension eligibility projections, increased Affordable Care Act (ACA) Compliance requirements and the workload associated with leave of absences, the need for a Benefit and Leave Coordinator has become more evident. The development of a coordinator role would allow the HR Generalists to work more closely with their primary departments on employee engagement, employee relations, recruitment, performance management and succession planning.
Employee Engagement
A critical need exists to begin to measure the level of engagement and satisfaction for City of Fargo employees through an employee engagement survey. The survey results would give administration, HR and department heads the data needed to determine focus areas for continuous improvement in the employment experience.
Employee Health Program In collaboration with the health department, the HR Team will continue to develop the City of Fargo Employee Health Program including the addition of a Medical Consultant who will conduct pre‐placement medical examinations.
Operational Measures
Description 2015 Actual 2016 Expected 2017 Projected
Total Employees 1,070 1,805 1,850Total Positions Posted 122 130 150Total Applicants 3,043 3,200 3,400Employment Actions Processed 1,302 530 560
Hum
an Resou
rces
34
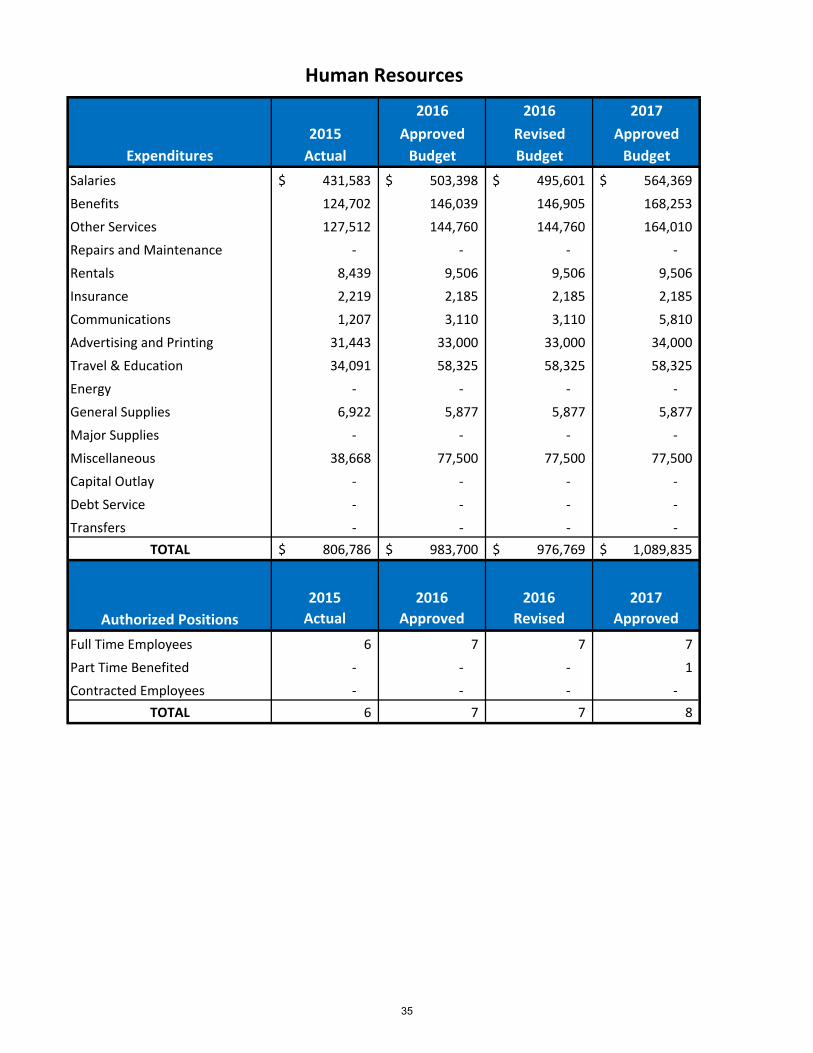
2016 2016 20172015 Approved Revised Approved
Expenditures Actual Budget Budget BudgetSalaries 431,583$ 503,398$ 495,601$ 564,369$ Benefits 124,702 146,039 146,905 168,253 Other Services 127,512 144,760 144,760 164,010 Repairs and Maintenance ‐ ‐ ‐ ‐ Rentals 8,439 9,506 9,506 9,506 Insurance 2,219 2,185 2,185 2,185 Communications 1,207 3,110 3,110 5,810 Advertising and Printing 31,443 33,000 33,000 34,000 Travel & Education 34,091 58,325 58,325 58,325 Energy ‐ ‐ ‐ ‐ General Supplies 6,922 5,877 5,877 5,877 Major Supplies ‐ ‐ ‐ ‐ Miscellaneous 38,668 77,500 77,500 77,500 Capital Outlay ‐ ‐ ‐ ‐ Debt Service ‐ ‐ ‐ ‐ Transfers ‐ ‐ ‐ ‐
TOTAL 806,786$ 983,700$ 976,769$ 1,089,835$
Authorized Positions2015Actual
2016Approved
2016Revised
2017 Approved
Full Time Employees 6 7 7 7 Part Time Benefited ‐ ‐ ‐ 1 Contracted Employees ‐ ‐ ‐ ‐
TOTAL 6 7 7 8
Human Resources
35

Description of Service Provided Current or Emerging Issues
The Information Services Department provides technology innovations, solutions, services, and support to all City of Fargo Departments and the Red River Regional Dispatch Center. IS also provided the same services to the Family HealthCare. The major services delivered are:
Support end users with the Helpdesk services to all technology needs.
Maintain and support hardware and software systems and lifecycle deployments.
Administer network infrastructure, servers, phone and deliver expansion for growth.
Manage the systems and software of all departments, including off‐the‐shelf and custom build software, integrations and data.
Manage and support the Public Safety software system used by all law enforcement and fire agencies in Cass and Clay Counties.
Lead and design custom built software solutions for internal business process and public services.
Provide, maintain and analyze GIS solutions, maps, aerial imagery, and data sets used throughout the city and regional area for city, regional, state, and federal projects.
Support and maintain the H.T.E. Accounting system on the IBM midrange platform.
Plan and support the technology needs for all city departments, the dispatch center, and Family HealthCare.
Managing Tablets and Smart Phones.
Mobility of applications and access to
software.
Security for the mobile trending workplace.
Cloud/Software‐as‐a‐Service (SAAS) services and solutions changing the software being used and solutions being provided.
Increase dependency on GIS information and applications to support workflow processes in the field.
Data Privacy/Transparency.
Increased demands for greater bandwidth (both wireless and wired).
Operational Measures
Description 2015 Actual 2016 Expected 2017 Projected
Help Desk Tickets 10,145 10,607 11,085 Personal Computing Devices 1,584 1,645 1,710
Inform
ation Services
36

2016 2016 20172015 Approved Revised Approved
Expenditures Actual Budget Budget BudgetSalaries 1,421,816$ 1,531,575$ 1,535,942$ 1,609,676$ Benefits 444,743 501,864 501,623 487,719 Other Services 22,030 21,000 21,000 21,000 Repairs and Maintenance 734,913 776,392 776,392 876,392 Rentals ‐ 1,000 1,000 1,000 Insurance 7,256 5,895 5,895 5,895 Communications 141,563 85,560 85,560 85,560 Advertising and Printing ‐ ‐ ‐ ‐ Travel & Education 22,637 36,000 36,000 36,000 Energy 864 1,443 745 1,443 General Supplies 15,075 19,000 19,000 19,000 Major Supplies ‐ ‐ ‐ ‐ Miscellaneous 1,750 4,550 4,550 4,550 Capital Outlay 112,107 ‐ ‐ ‐ Debt Service ‐ ‐ ‐ ‐ Transfers ‐ ‐ ‐ ‐
TOTAL 2,924,754$ 2,984,279$ 2,987,707$ 3,148,235$
Authorized Positions2015Actual
2016Approved
2016Revised
2017 Approved
Full Time Employees 22 24 24 24 Part Time Benefited 1 ‐ ‐ ‐ Contracted Employees ‐ ‐ ‐ ‐
TOTAL 23 24 24 24
Information Services
37

Description of Service Provided Current or Emerging Issues
The Manager of Communications and Public Affairs provides proactive administrative and technical assistance to the Mayor, Commissioners, department heads & the media. The office also plans, coordinates and provides management direction to other departmental public information officers (PIOs) regarding the timely dissemination of information. Communications and Public Affairs oversees external communications for the City of Fargo, including media relations, multimedia promotional campaigns, the City websites, overall web presence, social media outlets, branding, organizational communication policies, printed publications and the operation of government access television channels. The office also manages internal communications, including the quarterly employee newsletter, the intranet site, electronic communications and printed publications. It also maintains the City's crisis communication plan and directs communications efforts across departments during City emergencies. Major services delivered include:
• Employee outreach • Citizen engagement • Media relations • Promotional campaigns • City websites • 'FargoOne' Mobile app • Social media • Communication policies • Publications • Operation of government access television
channels • Creation of educational videos
The development of the new content management
system (CMS) for the City's website has been completed by the IS Department and user testing is currently underway. In the fall of 2016, individual departments will begin the task of content generation and input within the new CMS. The goal is to have the new website launched by the end of 2016/early 2017. The new site will look completely different and include several new features, such as the following: intuitive information architecture, a unified calendar of public meetings, graphically‐appealing layouts, a version designed for mobile users, language translation services and adjustable font sizes.
A new City logo and slogan were unveiled in June 2016. A process is currently underway to craft the overall strategy for the City of Fargo to effectively and uniformly implement this new brand.
FargoOne, the citizen reporting application powered by PublicStuff, has been in place for a little over a year. The response from those citizens using the app have been very positive. Additional training for City staff members will be undertaken in the fourth quarter of 2016 to answer outstanding operational questions and to ensure the system is being utilized to its full potential. Further marketing efforts will be undertaken in 2017 to promote the service to the public.
The Engineering Department recently contracted with an external marketing firm for Public Information Coordinator (PIC) services to assist with outreach surrounding several road construction projects in the metro. This contract is being jointly overseen by Engineering and Communications/Public Affairs.
Additional methods of successfully disseminating information to the public are constantly being evaluated. A request has been made in the 2017 budget to fund a text and email alerts program that departments would utilize to send information to citizens who subscribe for the service.
Funding to diversify and expand the programming content of the City's public access channels has been requested for 2017 to generate additional viewership of the stations.
Operational Measures
Description 2013 Actual 2014 Actual 2015 Actual
Website Hits 1,269,295 1,272,993 1,378,527Users 716,763 745,192 759,584
Pu
blic In
form
ation
38

2016 2016 20172015 Approved Revised Approved
Expenditures Actual Budget Budget BudgetSalaries 104,900$ 110,447$ 107,857$ 149,772$ Benefits 23,227 24,745 24,933 36,214 Other Services 15,695 40,000 40,000 52,400 Repairs and Maintenance ‐ ‐ ‐ ‐ Rentals ‐ ‐ ‐ ‐ Insurance 345 730 730 730 Communications ‐ ‐ ‐ 1,250 Advertising and Printing 693 450 450 1,200 Travel & Education 1,159 3,970 3,970 7,720 Energy ‐ ‐ ‐ ‐ General Supplies 338 ‐ ‐ 1,000 Major Supplies ‐ ‐ ‐ ‐ Miscellaneous 1,854 15,000 15,000 15,000 Capital Outlay ‐ ‐ ‐ ‐ Debt Service ‐ ‐ ‐ ‐ Transfers ‐ ‐ ‐ ‐
TOTAL 148,211$ 195,342$ 192,940$ 265,286$
Authorized Positions2015Actual
2016Approved
2016Revised
2017 Approved
Full Time Employees 2 2 2 2 Part Time Benefited ‐ ‐ ‐ ‐ Contracted Employees ‐ ‐ ‐ ‐
TOTAL 2 2 2 2
Public Information
39

Description of Service Provided Current or Emerging Issues
General legal services – upon request by all departments and elected officials Litigation oversight:
Coordinate and support legal defense of claims against (and by) the city
NDIRF covers most claims (Serkland) Additional affiliated or related services (billed separately):
Diversion Authority Bond Counsel services FargoDome Authority FM HRA RRRDC
With respect to City "general" legal
services, no significant changes are anticipated.
With respect to City "extra" legal services provided, the transition that occurred on the Diversion Project has been beneficial for the management of demands for legal services from City Attorney office. City Attorney office will continue to oversee City's interests and Diversion Authority's interests in Diversion Project, of course.
Significant development and growth of the city generates commensurate demand for legal services by city departments and elected officials.
City Attorne
y
40

2016 2016 20172015 Approved Revised Approved
Expenditures Actual Budget Budget BudgetSalaries ‐$ ‐$ ‐$ ‐$ Benefits ‐ ‐ ‐ ‐ Other Services 571,620 528,000 528,000 545,000 Repairs and Maintenance ‐ ‐ ‐ ‐ Rentals ‐ ‐ ‐ ‐ Insurance ‐ ‐ ‐ ‐ Communications ‐ ‐ ‐ ‐ Advertising and Printing ‐ ‐ ‐ ‐ Travel & Education ‐ ‐ ‐ ‐ Energy ‐ ‐ ‐ ‐ General Supplies ‐ ‐ ‐ ‐ Major Supplies ‐ ‐ ‐ ‐ Miscellaneous ‐ ‐ ‐ ‐ Capital Outlay ‐ ‐ ‐ ‐ Claims 919,845 ‐ ‐ 20,000 Transfers ‐ ‐ ‐ ‐
TOTAL 1,491,465$ 528,000$ 528,000$ 565,000$
City Attorney
41

Description of Service Provided Current or Emerging Issues
Prosecution of all violations of city ordinance in Municipal Court and Cass County District Court (occasional appeals to ND Supreme Court) Includes:
Code enforcement Health Department matters (tobacco
compliance and alcohol serving compliance)
Limited advising of police officers
Succeeded in optimizing city's share of
fines by remanding virtually 100% of cases from District Court back to Municipal Court. (City keeps 100% of fines when paid into Municipal Court and only 20% of fines when paid into District Court.)
Numbers still down‐ traffic ticket numbers and more serious driving violations down
Last year we replaced loss of all existing
lawyers in prosecution office with single fulltime prosecutor (Casey W. Moen) and with assistance from contracted lawyers (Lan Mclean and Dan Phillips) as well as some assistance from City Attorney office. Salary and hourly‐rate adjustments needed.
MARCY'S LAW, if approved by voters,
will likely have substantial impact on need for additional human resources in our office perhaps a $25,000 to $75,000 additional annual cost.
Reduced 2016 budget by $71,000 from
$327,000 in prior year to $256,000 as a result of cost‐saving measures implemented. So far in 2016, we have been able to stay within budget.
Operational Measures
Description 2015 Actual 2016 Expected 2017 Projected
City Prosecution $300,352 $256,730 $276,900
City Prosecutio
n
42

2016 2016 20172015 Approved Revised Approved
Expenditures Actual Budget Budget BudgetSalaries ‐$ ‐$ ‐$ ‐$ Benefits ‐ ‐ ‐ ‐ Other Services 298,873 256,000 256,000 276,000 Repairs and Maintenance ‐ ‐ ‐ ‐ Rentals ‐ ‐ ‐ ‐ Insurance 829 730 730 900 Communications ‐ ‐ ‐ ‐ Advertising and Printing ‐ ‐ ‐ ‐ Travel & Education ‐ ‐ ‐ ‐ Energy ‐ ‐ ‐ ‐ General Supplies ‐ ‐ ‐ ‐ Major Supplies ‐ ‐ ‐ ‐ Miscellaneous 100 ‐ ‐ ‐ Capital Outlay 550 ‐ ‐ ‐ Debt Service ‐ ‐ ‐ ‐ Transfers ‐ ‐ ‐ ‐
TOTAL 300,352$ 256,730$ 256,730$ 276,900$
City Prosecution
43

Description of Service Provided Current or Emerging Issues
The City of Fargo constructed a 4,500 seat baseball stadium located on the campus of North Dakota State University (NDSU). It is the home of the FM‐Redhawks baseball team, a member of the Northern League. The stadium is also leased to North Dakota State University for use by their college baseball program. The original cost of the stadium was $5.2 million and this cost has been recovered by stadium suite rentals pursuant to a lease agreement with Fargo Baseball, LLC. This recreational and entertainment facility continues to provide top quality events for our citizens to enjoy during the summer season.
Maintenance costs are trending higher due to the age of the facility that was built in 1995. A more formalized capital improvement plan will be developed in the future. A Stadium Management Committee structure is currently being organized to oversee the operations and interaction with Stadium stakeholders.
Operational Measures
Description 2014 Actual 2015 Actual 2016 Expected
Number of Seats 4,422 4,422 4,422 RedHawks Attendance 189,796 187,099 186,000
Ba
seba
ll Stad
ium
44

2016 2016 20172015 Approved Revised Approved
Expenditures Actual Budget Budget BudgetSalaries ‐$ ‐$ ‐$ ‐$ Benefits ‐ ‐ ‐ ‐ Other Services ‐ 10,000 10,000 5,000 Repairs and Maintenance ‐ 35,900 35,900 59,900 Rentals ‐ ‐ ‐ ‐ Insurance ‐ 5,000 5,000 2,000 Communications ‐ ‐ ‐ ‐ Advertising and Printing ‐ ‐ ‐ ‐ Travel & Education ‐ ‐ ‐ ‐ Energy ‐ ‐ ‐ ‐ General Supplies ‐ ‐ ‐ ‐ Major Supplies ‐ ‐ ‐ ‐ Miscellaneous ‐ 2,000 2,000 2,000 Capital Outlay ‐ 25,000 25,000 25,000 Debt Service ‐ 2,100 2,100 2,100 Transfers ‐ ‐ ‐ ‐
TOTAL ‐$ 80,000$ 80,000$ 96,000$
Baseball Stadium
45

Description of Service Provided Current or Emerging Issues
The Auditor’s Office provides fiscal administration services in support of our governmental functions. It also provides services to the Red River Regional Dispatch Center and the FM Diversion Authority pursuant to fiscal services agreements. The major services delivered include:
General Accounting and Payroll Budgeting Capital Financing & Debt Management Comprehensive Annual Financial Report Treasury Management Insurance and Risk Management Auditing and Financial Reporting Special Assessments City Utility Billing Licenses & Permits Records Management Defined Benefit Pension Administration Financial Policy Development Fiscal Agent for the FM Diversion
Our 2017 budget request has been
reduced by allocation of utility billing staff support directly to the utility funds.
GASB Standards number 67 & 68 have been implemented in our CAFR to improve transparency with City administered pension funds.
There are several large capital projects active in 2016 including a new City Hall, demolition of the Centennial Hall, and several flood control projects.
We delivered our CAFR and related independent audit report with a clean opinion and no audit findings. We expect the same results going forward.
Changes have been made to our investment management strategies to enhance our investment income.
We received the GFOA Certificate of Excellence in Financial Reporting for the past 18 years.
We plan to submit the 2017 Budget to the GFOA Distinguished Budget Presentation Awards Program as this is the highest level of budget reporting.
Operational Measures
Description 2015 Actual 2016 Expected 2017 Projected
Vendor Checks Processed 8,500 8,500 8,500 Credit Card Payments $16 million $18 million $20 million Number of Bond Issues 7 5 3 Number of Financial Documents Digitized
165,000 195,000 200,000
City Aud
itor
46

2016 2016 20172015 Approved Revised Approved
Expenditures Actual Budget Budget BudgetSalaries 1,015,176$ 1,047,798$ 1,056,327$ 951,263$ Benefits 304,932 318,100 323,480 261,600 Other Services 124,787 84,500 84,500 82,400 Repairs and Maintenance 1,309 1,000 1,000 1,500 Rentals 2,261 1,820 1,820 2,600 Insurance 3,678 3,370 3,370 3,870 Communications 1,505 1,000 1,000 1,450 Advertising and Printing 7,048 3,000 3,000 10,000 Travel & Education 22,544 17,100 17,100 19,225 Energy ‐ ‐ ‐ ‐ General Supplies 16,323 19,400 19,400 19,800 Major Supplies ‐ ‐ ‐ ‐ Miscellaneous 784 1,000 1,000 1,000 Capital Outlay 475 ‐ ‐ ‐ Debt Service ‐ ‐ ‐ ‐ Transfers ‐ ‐ ‐ ‐
TOTAL 1,500,822$ 1,498,088$ 1,511,997$ 1,354,708$
Authorized Positions2015Actual
2016Approved
2016Revised
2017 Approved
Full Time Employees 15 15 15 12 Part Time Benefited ‐ ‐ ‐ ‐ Contracted Employees ‐ ‐ ‐ ‐
TOTAL 15 15 15 12
City Auditor
47

Description of Service Provided Current or Emerging Issues
The Fargo Municipal Court has jurisdiction over criminal and non‐criminal violations of Fargo City Ordinances. These include class B misdemeanors, infractions, and traffic violations (as defined by the Fargo Municipal Code) that occur within the City of Fargo. Municipal Court currently holds 5‐6 court sessions per day on Tues, Wed and Thurs, and 1 session per day on Monday and Friday. Courtroom appearances can total over 100 per day. The Clerk’s office is responsible for administration of court records according to state and local statute, rules and policies. The major services delivered include:
Court Case Management Filing of Court Cases and Documents Management of the Court Calendar Court Policy Development Court Sentence Programming Monitoring of Court Sentences Payments of Traffic Tickets Fine Collection Management of Warrants and Summons Online access to court cases. Public
terminal provides access to scanned court documents.
Municipal Court recently migrated to the
North Dakota Supreme Court’s case management program. Ongoing collaboration with the Supreme Court to enhance features, and improve reporting and programming.
Continual research and interpretation of city and state laws and pending legislation, court rules, judicial system policies and court operations; determining any changes in operational procedures necessary to comply with law.
There is a trend toward alternative non‐traditional payment methods. Municipal Court offers phone payments, online web based payments, debit and credit card payments, and traditional mail and window payments.
Operational Measures
Description 2015 Actual 2016 Expected 2017 Projected
Warrants Issued 3,081 3,136 3,000 Total collections $1.7 million $1.7 million $1.7 million Receipts Issued 21,198 20,000 21,000 Cases filed 22,254 21,000 22,000 # of Documents Filed and Scanned 116,161 122,092 120,000 Hearings Scheduled 17,428 17,888 17,500
Mun
icipal Cou
rt
48

2016 2016 20172015 Approved Revised Approved
Expenditures Actual Budget Budget BudgetSalaries 417,071$ 433,599$ 438,219$ 443,851$ Benefits 136,915 146,091 146,832 154,829 Other Services 203,040 203,344 203,344 227,450 Repairs and Maintenance 2,038 4,900 4,900 4,900 Rentals ‐ 30,000 30,000 ‐ Insurance 2,125 2,185 2,185 2,185 Communications 617 640 640 640 Advertising and Printing 1,133 1,500 1,500 1,500 Travel & Education 2,455 4,845 4,845 4,845 Energy 31,386 30,000 30,000 32,000 General Supplies 3,018 5,000 5,000 5,000 Major Supplies ‐ ‐ ‐ ‐ Miscellaneous 76 3,100 3,100 3,100 Capital Outlay ‐ ‐ ‐ ‐ Debt Service ‐ ‐ ‐ ‐ Transfers ‐ ‐ ‐ ‐
TOTAL 799,874$ 865,204$ 870,565$ 880,300$
Authorized Positions2015Actual
2016Approved
2016Revised
2017 Approved
Full Time Employees 7 7 7 7 Part Time Benefited 1 1 1 1 Contracted Employees ‐ ‐ ‐ ‐
TOTAL 8 8 8 8
Municipal Court
49

Description of Service Provided Current or Emerging Issues
Class B misdemeanors are the only offenses under Fargo Municipal Code subject to imprisonment. These carry a maximum imprisonment penalty of 30 days. Most offenses do not carry a minimum mandatory imprisonment. Mandatory sentencing means the Judge does not have the choice to impose a lesser sentence. Offenses requiring mandatory minimum imprisonment include:
Driving Under Suspension – suspension a result of a DUI requires 4 days’ imprisonment.
DUI – second offense within 7 years requires 10 days’ imprisonment.
Incarceration services are provided by Cass County and Centre Inc. The City funds these costs from General Fund appropriation based upon incarceration service agreements in place. Centre Inc. provides minimum security incarceration at a lesser cost to the City than traditional jail. Centre inmates are sometimes assessed court costs if there is an indication that the person has the ability to pay, which further reduces the cost to the City. In‐home electronic monitoring is an additional option which is self‐pay by the defendant.
Current trends are to sentence first time offenders to incarceration at Centre or electronic monitoring. A majority of these include DUI and DUS sentences. Sentences served on electronic monitoring are generally of a short duration due to being self‐pay in advance. The majority of sentences served in the Cass County Jail are repeat offenders and those arrested on warrants for failing to comply with their sentences. Changes in DUS laws will result in fewer convictions and fewer sentences of incarceration.
Operational Measures
Description 2015 Actual 2016 Expected 2017 Projected
Days served in Cass County Jail
7,637 7,600 7,600
Days served in Centre Inc.
3,333 3,500 3,500
Days served on electronic monitoring
1,578 1,324 1,500
Incarceration
50

2016 2016 20172015 Approved Revised Approved
Expenditures Actual Budget Budget BudgetSalaries ‐$ ‐$ ‐$ ‐$ Benefits ‐ ‐ ‐ ‐ Other Services 822,479 767,000 767,000 820,000 Repairs and Maintenance ‐ ‐ ‐ ‐ Rentals ‐ ‐ ‐ ‐ Insurance ‐ ‐ ‐ ‐ Communications ‐ ‐ ‐ ‐ Advertising and Printing ‐ ‐ ‐ ‐ Travel & Education ‐ ‐ ‐ ‐ Energy ‐ ‐ ‐ ‐ General Supplies ‐ ‐ ‐ ‐ Major Supplies ‐ ‐ ‐ ‐ Miscellaneous ‐ ‐ ‐ ‐ Capital Outlay ‐ ‐ ‐ ‐ Debt Service ‐ ‐ ‐ ‐ Transfers ‐ ‐ ‐ ‐
TOTAL 822,479$ 767,000$ 767,000$ 820,000$
Incarceration
51

Description of Service Provided Current or Emerging Issues
The City Assessor’s Office is responsible for maintenance and circulation of all property ownership and legal description boundary information in the City of Fargo. The Assessor’s Office also appraises the value of property in the city as well as administers all property tax exemptions. The major services delivered include:
Assist the public in understanding and utilizing available tax exemptions.
Provide property tax and valuation estimates to developers, real estate professionals, and taxpayers.
Assist and coordinate valuation efforts of proposed projects for future development & private/public financing concerns.
Provide the legislature information on assessment valuation, procedure, and administration matters. Provide projected valuation information to local taxing jurisdictions for budgeting and levying purposes.
Ongoing legislative action relating to
property tax levels and administration continue to evolve. This impacts the ability of our department to deliver services to the public.
Functional support is ongoing to assist in assuring expedient and equitable property acquisitions in City and Diversion flood protection efforts.
Staff turnover in the past few years has produced opportunities to evaluate and alter work processes creating positive, productive, and efficient outcomes.
The recent increase in market valuations of properties has been more significant than ever before. This has significantly increased the value appeal workload. In response, cross training and alternative work processes are constantly being evaluated. Appraisal staff exposure to continuing educational offerings has also been increased.
Operational Measures
Description 2014 Actual 2015 Actual 2016 Projected
True & Full Property Valuation $10,818,566,700 $11,946,935,000 $13,284,450,300 True & Full Exempt Valuation $2,475,349,895 $2,577,248,618 $2,764,283,000 Taxable Valuation (% of T&F) $387,008,093 $436,837,979 $488,909,842 Estimated Property Taxes Generated $113,795,378 $128,292,519 $143,424,362 Estimated City Taxes Generated $20,221,173 $22,824,784 $25,545,539 Number of Parcels 34,278 35,194 35,477 These amounts will differ somewhat due to timing of value estimates, mill levy calculations, and actual tax payments. Current year estimated taxes to be generated are based on the previous year certified mill levy.
City Assessor
52

2016 2016 20172015 Approved Revised Approved
Expenditures Actual Budget Budget BudgetSalaries 766,922$ 797,390$ 805,438$ 836,691$ Benefits 244,865 256,387 258,723 255,327 Other Services 18,295 15,620 15,620 15,620 Repairs and Maintenance ‐ 6,700 6,700 6,700 Rentals 65,344 71,320 71,320 79,320 Insurance 4,163 4,505 4,505 4,505 Communications ‐ 160 160 160 Advertising and Printing 836 2,040 2,040 2,040 Travel & Education 19,279 22,180 22,180 24,480 Energy 7,237 16,893 15,913 16,893 General Supplies 12,948 13,100 13,100 18,100 Major Supplies ‐ ‐ ‐ ‐ Miscellaneous 563 1,100 1,100 1,100 Capital Outlay 1,332 8,800 8,800 ‐ Debt Service ‐ ‐ ‐ ‐ Transfers ‐ ‐ ‐ ‐
TOTAL 1,141,784$ 1,216,195$ 1,225,599$ 1,260,936$
Authorized Positions2015Actual
2016Approved
2016Revised
2017 Approved
Full Time Employees 11 11 11 11 Part Time Benefited ‐ ‐ ‐ ‐ Contracted Employees ‐ ‐ ‐ ‐
TOTAL 11 11 11 11
City Assessor
53

Description of Service Provided Current or Emerging Issues
General Support is a divisional cost center that pools costs that have not been allocated to other General Fund departmental budgets. Cost categories include worker’s compensation, communications, auditing fees, banking fees, credit card fees, security services, automobile and animal impounding, insurance, investment management fees, office supplies, publishing and other administrative costs. This cost center is managed by the Finance Department.
Workers’ compensation premiums are
increasing by as a result of program changes including raising the base for which premiums are charged.
The auditing services budget has been
increased to allow for review of PILOT and other tax exemptions pursuant to a proposed change in City tax exemption policies.
Legal publication costs have been
increased for taxpayer notifications required by NDCC relating to our tax levies and related budget approval hearings.
City staffs continue to refine our digital records management processes to reduce the cost of records administration. Staffs in the Auditor’s Office are seeking records management certifications.
Operational Measures
Description 2015 Actual 2016 Expected 2017 Projected
Workers Compensation Premiums
$479,000 $393,000 $480,000
Insurance Costs 152,000 126,350 151,000 Credit Card Fees 64,000 65,000 44,000
Gen
eral Sup
port
54

2016 2016 20172015 Approved Revised Approved
Expenditures Actual Budget Budget BudgetSalaries ‐$ ‐$ ‐$ ‐$ Benefits 478,859 393,000 393,000 480,000 Other Services 393,692 328,800 388,800 361,800 Repairs and Maintenance 11,330 18,000 18,000 16,000 Rentals ‐ ‐ ‐ ‐ Insurance 151,667 126,350 126,350 151,215 Communications (1,022) ‐ ‐ ‐ Advertising and Printing 53,327 54,000 54,000 63,000 Travel & Education ‐ ‐ ‐ ‐ Energy ‐ ‐ ‐ ‐ General Supplies 95,557 95,000 95,000 95,000 Major Supplies ‐ ‐ ‐ ‐ Miscellaneous 3,136 5,000 5,000 ‐ Capital Outlay ‐ ‐ ‐ ‐ Debt Service ‐ ‐ ‐ ‐ Transfers ‐ ‐ ‐ ‐
TOTAL 1,186,546$ 1,020,150$ 1,080,150$ 1,167,015$
General Support
55

Description of Service Provided Current or Emerging Issues
Buildings & Grounds is in charge of maintaining seven downtown structures, five “off‐campus” facilities, a Public Safety Building, and the Fargo Cass Public Health facility. At these locations staff takes care of the HVAC systems, plumbing, electrical, and mechanical. In addition inspections, testing, and service for alarm systems, sprinkler systems, emergency generators, fire extinguishers, and elevators are provided. Buildings & Grounds employees oversee grounds keeping, sidewalks, and parking lots through the four seasons. Staff also assists one City Bus Terminal and seven Fire Stations with troubleshooting and consultations on maintenance related issues. Buildings & Grounds is available for consultation with all City Departments regarding maintenance, roofs, asbestos, indoor air quality concerns, recommended vendors, etc.
Janitorial services that were previously provided under contract with Fargo Public Schools have been transitioned to our own janitorial staffing in 2016. Newer facilities are moving toward:
Rapidly changing electrical upgrades (LED’s, Ballasts, Auto Switches) resulting in higher initial costs but provide long life, low maintenance, and very high energy efficiency.
Compact, energy efficient boilers & updated chiller systems.
Computerized HVAC monitoring systems.
Our Planning Department has evaluated various energy saving strategies as a result of our work with building evaluations recently completed.
Operational Measures
Description 2015 Actual 2016 Expected
2017 Expected
Number of Buildings Serviced 13 13 15 Number of Full Time Employees 7 13 13 Building Repair Costs 175,000 210,000 283,000 Supplies 125,000 166,000 168,000 Energy 250,000 208,000 230,000
Bu
ildings & Groun
ds
56

2016 2016 20172015 Approved Revised Approved
Expenditures Actual Budget Budget BudgetSalaries 407,600$ 467,037$ 458,191$ 594,079$ Benefits 160,057 194,615 191,741 258,902 Other Services 459,159 664,140 664,140 457,040 Repairs and Maintenance 176,515 282,607 282,607 282,607 Rentals 3,000 10,700 10,700 10,000 Insurance 4,150 5,065 5,065 5,065 Communications 4,643 4,500 4,500 4,500 Advertising and Printing ‐ ‐ ‐ ‐ Travel & Education 1,329 ‐ ‐ 1,000 Energy 250,297 208,242 205,593 230,000 General Supplies 124,734 166,330 166,330 168,330 Major Supplies ‐ ‐ ‐ ‐ Miscellaneous 7,478 8,500 8,500 11,000 Capital Outlay ‐ ‐ ‐ ‐ Debt Service ‐ ‐ ‐ ‐ Transfers ‐ ‐ ‐ ‐
TOTAL 1,598,962$ 2,011,736$ 1,997,367$ 2,022,523$
Authorized Positions2015Actual
2016Approved
2016Revised
2017 Approved
Full Time Employees 7 7 13 13 Part Time Benefited ‐ ‐ ‐ ‐ Contracted Employees ‐ ‐ ‐ ‐
TOTAL 7 7 13 13
Buildings & Grounds
57

Description of Service Provided Current or Emerging Issues
Land Use Planning ‐ Responsibilities include comprehensive planning, growth plans, park plans, and special plans, studies, and area plans. Development Review – Responsibilities include review of applications for text amendments, map amendments, conditional use permits, variances, alternative access plans, and other applications provided for in the Land Development Code (LDC). Site plan reviews are done to check for compliance with the Land Development Code. Land Development Code Administration – Responsibilities include providing information on regulations and procedures to developers, builders, and property owners, and enforcement of the code. Community Development Planning – This includes the development of community development plans, housing plans, and neighborhood plans. Community Development Program Administration – This is the administration and implementation of housing and community development programs funded by HUD programs. Downtown Development and Redevelopment – Responsibilities consist of planning for and encouraging redevelopment. Programs include the Renaissance Zone program, storefront rehab/downtown projects, tax increment financing, and PILOT incentives. Parking – This is the planning and management of the downtown parking system, including parking ramps, the Ground Transportation Center, and surface lots. Special Commissions & Boards – Staff support is provided to the Planning Commission, Community Development Committee, Historic Preservation Commission, Human Relations Commission, Native American Commission, Arts and Culture Commission, Fargo Youth Initiative, efargo and other special task forces.
The growth of Fargo will require annexations, land use plans, and utility extensions to allow for future growth in the city.
The larger number of requests for development review may cause delays in their review. The volume of requests also delays land use planning and special studies.
Redevelopment and infill projects continue to gain interest as land value increases and availability of green fields decreases.
There is a greater interest in neighborhood planning and code enforcement from older neighborhoods.
Decreasing federal resources makes it more difficult to address community development and housing needs.
There is a growing interest in new buildings in downtown, as many underutilized buildings have been redeveloped. This will require more parking.
All downtown parking facilities are at capacity. One new parking facility is under construction, but it downtown will still be short of parking.
Operational Measures
Description 2015 Actual 2016 Expected 2017 Projected
Planning Commission Cases 132 150 165 Site Plan Reviews 371 400 420 Parking Spaces in City Facilities 1,557 1,417 1,802
Plan
ning
and
Develop
men
t
58

2016 2016 20172015 Approved Revised Approved
Expenditures Actual Budget Budget BudgetSalaries 836,954$ 907,283$ 914,899$ 919,841$ Benefits 233,842 269,068 267,588 261,666 Other Services 139,086 232,200 727,444 442,440 Repairs and Maintenance ‐ ‐ ‐ ‐ Rentals ‐ ‐ ‐ ‐ Insurance 3,380 2,695 2,695 2,430 Communications 1,707 2,400 2,400 1,800 Advertising and Printing 3,255 6,600 6,600 6,600 Travel & Education 25,750 21,750 21,750 24,250 Energy 174 242 90 ‐ General Supplies 1,997 2,000 2,000 2,000 Major Supplies ‐ ‐ ‐ ‐ Miscellaneous 1,010 2,000 2,000 2,000 Capital Outlay 4,424 ‐ ‐ ‐ Debt Service ‐ ‐ ‐ ‐ Transfers ‐ ‐ ‐ ‐
TOTAL 1,251,579$ 1,446,238$ 1,947,466$ 1,663,027$
Authorized Positions2015Actual
2016Approved
2016Revised
2017 Approved
Full Time Employees 14 15 15 16 Part Time Benefited 1 1 1 2 Contracted Employees ‐ ‐ ‐ ‐
TOTAL 15 16 16 18
Planning and Development
59

Description of Service Provided Current or Emerging Issues
The Inspections Division provides code enforcement services through review of building plans and the issuance of permits of various types for construction approval. Types of permits issued include building construction, energy, electrical, plumbing, mechanical, and signs. This is a law enforcement function of the City. Services provided:
Review of commercial construction plans Review of residential construction plans Permit issuance Construction inspections Inspections of existing buildings –
residential rentals Inspections for junk and junked vehicle
complaints Interpretations of code requirements Day care inspections Complaint inspections & response Zoning Inspections Certificate of Occupancy issuance Records retention Sign permits and sign code enforcement
An all‐pervasive issue is the scope, diversity, and number of building projects coming into the community as well as the need to maintain the resources to provide the expected service in a manner that satisfies demand effectively and assures the continued safety of our built community. Increasing geographic distance adds to the complexity of providing inspections in the timely and thorough manner to which our customers and citizens are accustomed. Another current issue is maintenance of the city’s stock of existing buildings through enforcement of its minimum standards. An increasing reliance on digital records requires more connectivity on the parts of our inspectors. New software allows customers to submit inspection requests on‐line but more‐flexible digital tools will be needed to offer the utility in permitting and payment that the public is coming to expect. We expect a new software system to be implemented in 2017. The area south of Interstate 94 and west of 45th Street will continue to develop rapidly with a wide variety of hotel, apartment, retail, and service industry projects intended to serve both the new hospital and the large amount of residential development in the southern end of the city.
Operational Measures
Description 2015 Actual 2016 Expected 2017 Projected
Commercial Plan reviews 371 380 392 Permits (all types) 11,023 11,400 11,500 Inspections (all types) 27,558 28,000 29,000 Day care inspections 34 40 46 Apartment inspections 5,627 units 4,000 units 5,000 units Vehicle removals 128 100 120
Inspectio
ns
60

2016 2016 20172015 Approved Revised Approved
Expenditures Actual Budget Budget BudgetSalaries 1,299,183$ 1,409,220$ 1,412,462$ 1,501,005$ Benefits 443,955 479,577 485,552 513,306 Other Services 345,243 310,150 923,720 310,150 Repairs and Maintenance 165 500 500 500 Rentals 1,523 2,000 2,000 2,000 Insurance 8,710 8,565 8,565 8,565 Communications 16,479 17,000 17,000 17,000 Advertising and Printing 1,743 1,750 1,750 1,750 Travel & Education 25,292 32,500 32,500 32,500 Energy 19,846 23,075 17,110 23,075 General Supplies 7,114 8,000 8,000 8,000 Major Supplies ‐ ‐ ‐ ‐ Miscellaneous 5,360 8,500 8,500 8,500 Capital Outlay 2,471 ‐ ‐ ‐ Debt Service ‐ ‐ ‐ ‐ Transfers ‐ ‐ ‐ ‐
TOTAL 2,177,084$ 2,300,837$ 2,917,659$ 2,426,351$
Authorized Positions2015Actual
2016Approved
2016Revised
2017 Approved
Full Time Employees 21 22 22 23 Part Time Benefited ‐ ‐ ‐ ‐ Contracted Employees ‐ ‐ ‐ ‐
TOTAL 21 22 22 23
Inspections
61

Description of Service Provided Current or Emerging Issues
Transit provides transportation services on the fixed route bus system and the complementary paratransit system (service for people with disabilities unable to navigate the fixed route system). Transit works closely with the Central Garage Department for inventory control, technicians, building maintenance, and bus washers; the Finance Department assists with grant management; the IS Department has been a critical resource. Overall, Transit's responsibilities fall into the following categories: • Provide safe, efficient mass transportation within the community. • Fiscally responsible management of local, state and federal funding. • Market the Transit system to attract choice riders and still serve needs of transit dependent. • Develop and maintain relationships with partners. • Demonstrate the technical capacity to provide grants administration and fiscal cash management. • Participate in program management and coordinated plans within the region and at the state levels. • Ensure adequate oversight of contractors and lessees. • Work closely with Maintenance to ensure proper oversight of federally funded assets. • Develop programs and guidelines to ensure compliance with ADA and Civil Rights (i.e. Title VI and DBE). • Procurement to ensure all local, state and federal requirements and certifications are met.
The over‐arching concern is the changes in funding from the Federal Transit Administration should the Fargo‐Moorhead metro area reach the 200,000 population in the 2020 census. The funding is currently formula for operating which is 50/50 (federal/local share), should the population reach 200,000, funding for operating changes and the City needs to explore a Transit Authority concept to preempt funding changes and be prepared for funding change impacts. The 5‐year Transit Development Plan identified gaps in transit services and proposed various cost ranges of needs/improvements requiring attention.
An on‐going concern is the lack of adequate administrative staffing to entirely address the needs of the Transit system. Existing staff has been able to minimally keep pace with all the requirements of the system. Additional staffing would foster a healthy growth of the Transit system and a more proactive approach. The administrative staff was increased by one position (Planner) in 2016, but had not increased since 2008 when the Mobility Manager position was moved from a half time position to a full time position.
Capital investments are struggling to keep pace with the growing system. The fixed route fleet and paratransit fleet status will be discussed in detail by Central Garage representatives. Please note access to discretionary funding for capital expenses has been drastically reduced.
The Metro Transit Garage (MTG) was built in late 2006. At the time, the facility was built 25% larger than the current need identified. This number has been exceeded and the MTG will require an expansion in the future.
Tran
sit
62

• Satisfactory continuing control of all Transit assets. • Ensure public comment processes are followed for service and fare changes, Transit Plans and projects. • Ensure the federal criteria are met for fare structures. • Ensure there is an element of Safety and Security to the local Transit system. • Develop, adopt and implement a Drug & Alcohol Policy which meets Federal Transit Requirements. This includes being responsible for the program and oversight of any contractors and lessees.
The Ground Transportation Center (GTC) was built in 1984 and acts as the main hub/transfer center for both Fargo and Moorhead. Moving forward the GTC will require not only on‐going upkeep, but given the state of disrepair of both the exterior and interior, a remodel project will be required to address the concerns.
Federal funding is now in a transportation bill, but the State funding is diminishing and unpredictable.
Fargo is a large regional destination for medical care, including the new regional Sanford medical complex opening in Fall2017. As the population ages, transit becomes a viable option for residents and visitors. That aging population will be the largest generation to
Operational Measures
Description 2015 Actual 2016 Expected
2017 Projected
Fixed Route Ridership 1,600,610 1,600,000 1,750,000 Paratransit Ridership 51,462 51,000 51,000 Peak number of buses in service in Fargo‐ West Fargo. 37 39 39
63

2016 2016 20172015 Approved Revised Approved
Expenditures Actual Budget Budget BudgetSalaries 188,537$ 227,268$ 223,436$ 263,771$ Benefits 61,935 83,218 80,536 85,341 Other Services 2,260,925 2,507,950 2,577,950 2,752,984 Repairs and Maintenance 5,043 5,200 5,200 7,000 Rentals ‐ ‐ ‐ ‐ Insurance 147,663 121,782 121,782 121,782 Communications 15,913 16,200 16,200 18,000 Advertising and Printing 15,345 26,300 26,300 26,300 Travel & Education 11,849 14,950 14,950 18,950 Energy 2,208 1,890 1,890 1,890 General Supplies 346 1,100 1,100 2,800 Major Supplies ‐ ‐ ‐ ‐ Miscellaneous 1,920 1,000 1,000 1,000 Capital Outlay ‐ ‐ ‐ ‐ Debt Service ‐ ‐ ‐ ‐ Transfers ‐ ‐ ‐ ‐
TOTAL 2,711,684$ 3,006,858$ 3,070,344$ 3,299,818$
Authorized Positions2015Actual
2016Approved
2016Revised
2017 Approved
Full Time Employees 3 4 4 4 Part Time Benefited ‐ ‐ ‐ ‐ Contracted Employees ‐ ‐ ‐ ‐
TOTAL 3 4 4 4
Transit Service Fixed Route
64

2016 2016 20172015 Approved Revised Approved
Expenditures Actual Budget Budget BudgetSalaries 98,075$ 128,844$ 130,023$ 118,853$ Benefits 38,093 46,114 46,317 44,425 Other Services 682,384 782,587 782,587 782,000 Repairs and Maintenance 53 ‐ ‐ ‐ Rentals ‐ ‐ ‐ ‐ Insurance 30,128 35,425 35,425 35,425 Communications 7,729 8,175 8,175 9,975 Advertising and Printing ‐ ‐ ‐ ‐ Travel & Education 1,427 1,500 1,500 2,000 Energy 63,304 33,193 54,534 33,193 General Supplies 3,830 9,800 9,800 8,800 Major Supplies ‐ ‐ ‐ ‐ Miscellaneous 213 1,000 1,000 1,000 Capital Outlay ‐ ‐ ‐ ‐ Debt Service ‐ ‐ ‐ ‐ Transfers ‐ ‐ ‐ ‐
TOTAL 925,236$ 1,046,638$ 1,069,361$ 1,035,671$
Authorized Positions2015Actual
2016Approved
2016Revised
2017 Approved
Full Time Employees 3 3 3 3 Part Time Benefited ‐ ‐ ‐ ‐ Contracted Employees ‐ ‐ ‐ ‐
TOTAL 3 3 3 3
Paratransit
65

2016 2016 20172015 Approved Revised Approved
Expenditures Actual Budget Budget BudgetSalaries ‐$ ‐$ ‐$ ‐$ Benefits ‐ ‐ ‐ ‐ Other Services 344,791 366,560 366,560 378,860 Repairs and Maintenance 37,980 24,000 24,000 31,000 Rentals ‐ ‐ ‐ ‐ Insurance 2,115 3,180 3,180 3,180 Communications ‐ ‐ ‐ ‐ Advertising and Printing ‐ ‐ ‐ ‐ Travel & Education ‐ ‐ ‐ ‐ Energy 34,218 24,819 24,819 24,819 General Supplies 9,661 19,000 19,000 17,000 Major Supplies ‐ ‐ ‐ ‐ Miscellaneous 1,564 1,500 1,500 1,500 Capital Outlay ‐ ‐ ‐ ‐ Debt Service ‐ ‐ ‐ ‐ Transfers ‐ ‐ ‐ ‐
TOTAL 430,329$ 439,059$ 439,059$ 456,359$
Ground Transportation Terminal
66

2016 2016 20172015 Approved Revised Approved
Expenditures Actual Budget Budget BudgetSalaries 36,203$ 38,142$ 30,477$ 32,427$ Benefits 10,194 10,934 11,007 11,537 Other Services 19,993 20,100 20,100 20,100 Repairs and Maintenance ‐ ‐ ‐ ‐ Rentals ‐ ‐ ‐ ‐ Insurance ‐ ‐ ‐ ‐ Communications ‐ ‐ ‐ ‐ Advertising and Printing ‐ ‐ ‐ ‐ Travel & Education ‐ ‐ ‐ ‐ Energy ‐ ‐ ‐ ‐ General Supplies ‐ ‐ ‐ ‐ Major Supplies ‐ ‐ ‐ ‐ Miscellaneous ‐ ‐ ‐ ‐ Capital Outlay ‐ ‐ ‐ ‐ Debt Service ‐ ‐ ‐ ‐ Transfers ‐ ‐ ‐ ‐
TOTAL 66,390$ 69,176$ 61,584$ 64,064$
Transit Planning
67

2016 2016 20172015 Approved Revised Approved
Expenditures Actual Budget Budget BudgetSalaries 70,857$ 61,220$ 58,189$ 65,270$ Benefits 16,580 10,301 10,405 22,765 Other Services 659 4,000 4,000 2,200 Repairs and Maintenance ‐ ‐ ‐ ‐ Rentals ‐ ‐ ‐ ‐ Insurance ‐ ‐ ‐ ‐ Communications 396 770 770 500 Advertising and Printing 4,067 8,500 8,500 6,000 Travel & Education 857 3,500 3,500 4,000 Energy ‐ ‐ ‐ ‐ General Supplies 13 1,000 1,000 600 Major Supplies ‐ ‐ ‐ ‐ Miscellaneous ‐ ‐ ‐ ‐ Capital Outlay ‐ ‐ ‐ ‐ Debt Service ‐ ‐ ‐ ‐ Transfers ‐ ‐ ‐ ‐
TOTAL 93,429$ 89,291$ 86,364$ 101,335$
Authorized Positions2015Actual
2016Approved
2016Revised
2017 Approved
Full Time Employees 1 1 1 1 Part Time Benefited ‐ ‐ ‐ ‐ Contracted Employees ‐ ‐ ‐ ‐
TOTAL 1 1 1 1
Transit Maintenance Organization
68

2016 2016 20172015 Approved Revised Approved
Expenditures Actual Budget Budget BudgetSalaries 679,330$ 673,019$ 679,937$ 791,828$ Benefits 211,139 229,241 230,362 274,953 Other Services 38,341 44,600 44,600 58,100 Repairs and Maintenance 937,714 920,204 920,204 920,204 Rentals ‐ ‐ ‐ ‐ Insurance 10,905 9,120 9,120 9,120 Communications 8,495 12,500 12,500 18,500 Advertising and Printing 3,340 3,500 3,500 3,500 Travel & Education 1,551 4,700 4,700 6,700 Energy 863,143 1,207,482 638,571 1,216,482 General Supplies 31,963 44,000 44,000 47,500 Major Supplies ‐ ‐ ‐ ‐ Miscellaneous 17,362 22,250 22,250 22,250 Capital Outlay 736 ‐ ‐ ‐ Debt Service ‐ ‐ ‐ ‐ Transfers ‐ ‐ ‐ ‐
TOTAL 2,804,019$ 3,170,616$ 2,609,744$ 3,369,137$
Authorized Positions2015Actual
2016Approved
2016Revised
2017 Approved
Full Time Employees 12 13 13 15 Part Time Benefited 2 2 2 2 Contracted Employees ‐ ‐ ‐ ‐
TOTAL 14 15 15 17
Transit Maintenance Facility
69

Description of Service Provided Current or Emerging Issues
Engineering Services Division
Support Platting Process with Technical Analysis of proposed plats Pre Development Support for Developers Site plan reviews Right of Way Acquisition, including permanent and temporary easements Annual Reporting Provides mapping support city‐wide Surveying, building, and lawn grades, and sidewalk. Row of Way Occupancy and Encroachment Management including the development of appropriate agreement documents Excavation permitting Mapping Utility locations & Providing field locates for City Owned Utilities New Development ‐Design and Construction Administration and Construction Inspection Oversight of Consultants that have been hired to perform Design, Construction Administration, and Construction Inspection of New Developments IT communication and software support
We continue to receive a significant number of requests for new developments. The outlook for 2017 at present is that this trend is continuing although we are seeing more construction on the northern edge of the City. With a significant number of plats and numerous infill projects, we have a high level of coordination for pre development meetings and site plan reviews. This has taken staff away from the normal design activities. The size and complexity of Site Plans has increased the time needed for staff review. Service provided for both new developments and reconstruction projects. Needs in this area have been escalating to keep up with the demand many duties have been pushed to the City Attorney's office. We have been working to provide some redundancy of ability within this area. We have started cross training additional staff to assist with the increased demands. Survey has been increasingly busy as we continue to support the elevations certificates for the new flood map along with the numerous construction projects and sidewalks, driveways, and rear yard grades. The city continues to provide survey the impacted properties for elevation certificates that they may need for insurance purposes. We have seen an increase in encroachment requests related to a heightened awareness by lenders requiring documentation of any encroachments found during alta surveys of property subject to mortgages. As construction activity grows permitting and locating responsibilities pick up as well. There has been a continuous demand for Right of Occupancy Requests associated with private utilities. In addition to the aggressive rollout of Mid Continent, which will continue into 2017, we hired 3 contract employees in 2014 to assist us in keeping up with the effort. We will need to keep these employees an additional year to assist with Mid Continent in 2017. We are also starting to see requests for new technology in our right of way that we are looking to write and ordinance for.
Engine
ering Dep
artm
ent
70

Description of Service Provided Current or Emerging Issues
We are seeing an increase in requests due to other construction projects including the in town levees associated with the Diversion and we will need an additional full time locator to continue to meet the demands of current construction along with continuous growth. We have not expanded our locating department since the inception of ONE CALL over 15 years ago. Driven by developer requests for infrastructure. We have bid $7 Million of the estimated $16 million of new development projects to date in 2016. This does not include carry over from 2014 and projects in the queue for bidding yet this year. This area continues to be demanding as the areas being developed are established areas that do not have infrastructure or are on the perimeters of our utilities. As the City implements new programs, we have to have staff that is trained to manage and assist other staff with questions. This is crucial in keeping up with the demand whether it be project related, survey requests, locates, or inspections.
Design and Construction Division Design and construction administration. Bidding process. Construction specifications and standards. New construction, reconstruction, and rehabilitation of municipal infrastructure. Oversight and management of a strategy for Watermain Replacement. Pavement Management Program. Sidewalk construction and reconstruction Program. Plan Review (In house‐ and Consultant designed) for New and Rehabilitation projects. Coordination of Sewer Spot Repair projects with Public Works. Day to day implementation and management of sewer repair policy.
Responsible for consistency of practices in the design and installation of infrastructure. Need for online bidding in near future. Primary responsibility for keeping City construction practices up with industry standards. Over all City index is good, largely due to new streets that raise the average. To maintain an acceptable rating a larger investment needs to be made in the Pavement Rehabilitation Program. This is driven completely by public requests and needs.
71

Operational Measures
Description 2015 Actual 2016 Expected 2017 Projected
Excavation Permits 6,456 6,600 6,600 Right of Occupancy Permits 17 15 15 One Call Tickets $24,525 $38,000 $38,000 Elevation Certificate Surveys 293 440 440 Sidewalk Survey 293 445 445 Driveway Survey 369 475 475 Yard Grades 209 480 480 Encroachment Agreements 4 processed
5 pending 10 10
Sidewalk Inspections 400 288 288 Driveway Approach Inspections
442 288 288
One Call Tickets were $1.10 in 2015 and 2016. Midcontinent is now franchised which will reduce the Right of Occupancy Permits.
72

2016 2016 20172015 Approved Revised Approved
Expenditures Actual Budget Budget BudgetSalaries 3,379,022$ 3,571,421$ 3,597,117$ 3,695,660$ Benefits 901,060 931,866 933,521 989,146 Other Services 48,147 88,300 88,300 58,500 Repairs and Maintenance 23,105 30,300 30,300 32,800 Rentals 1,386 2,000 2,000 2,500 Insurance 21,335 18,935 18,935 18,935 Communications 24,514 30,100 30,100 32,700 Advertising and Printing 11,099 18,350 18,350 18,350 Travel & Education 34,086 66,997 66,997 75,737 Energy 38,629 42,837 33,151 42,837 General Supplies 19,615 37,750 37,750 54,150 Major Supplies ‐ ‐ ‐ ‐ Miscellaneous 9,907 17,700 17,700 20,100 Capital Outlay 14,301 ‐ ‐ ‐ Debt Service ‐ ‐ ‐ ‐ Transfers ‐ ‐ ‐ ‐
TOTAL 4,526,206$ 4,856,556$ 4,874,221$ 5,041,415$
Authorized Positions2015Actual
2016Approved
2016Revised
2017 Approved
Full Time Employees 37 38 38 38 Part Time Benefited 1 1 1 1 Contracted Employees 3 3 3 3
TOTAL 41 42 42 42
Engineering
73

Description of Service Provided Current or Emerging Issues
The Traffic Engineering Department includes the City Transportation Engineer and the Sign and Signal Shop Operations. The Department is jointly operated and managed as part of the City's Engineering Department. The Traffic Engineering Department is responsible for the following activities:
Design, operation, management and maintenance of the City's traffic signal & intelligent transportation system
• Installation and maintenance of all regulatory, parking and warning signs (approx 25,000)
• Conducting traffic studies & traffic calming program • Construction administration of traffic signals,
pavement markings and traffic safety devices • Coordinate and staff the City's Traffic Technical
Advisory Committee Review traffic related features of site plans, plats
and long range plans, most notably access control for driveways and intersections to city roadways.
• Coordination & planning with NDDOT & Metro COG federal Aid transportation improvemen projects
• Coordination with contractors on lane/road closures, and other entities for special event traffic control
• Responsible for shared use path planning and construction
• Responsible for management of city bridges • 11 full time staff‐ 6 located in City Hall, 5 at Sign &
Signal Shop
Construction inflation costs continue to
escalate in this economic climate in NO where work is plenty and contractors overburdened. Pavement markings and traffic signal costs are increasing 10‐15% per year.
Improved intersection traffic controls at intersections, whether it be flashing yellow left turn arrows at traffic signals or it be roundabouts at other intersections, will continue to be recommended for implementation.
The Complete Street design concept, or
streets planned and designed for all users, will continue to be recommended for implementation, as recommended in the G02030 comp plan.
As the City continues to grow and how the
traffic signal world becomes more technologically based, there will be a need in the future for a new FTE for a Traffic Signal Electronic Specialist to assist with maintaining the Citywide system.
Operational Measures
Description 2015 Actual 2016 Expected 2017 Projected
Salaries 720,937 710,234 761,975 Pavement Markings 115,559 561,438 510,000 Traffic Signal Maintenance 183,256 176,400 200,000 Electricity 64,201 63,000 65,000 Over‐Dimensional Permits 2,864 3,200 3,200 Over Dimensional Permits Fees Collected
231,520 260,000 260,000
Over‐Dimensional Violations Fines Collected
22,535 100,000 125,000
Traffic
Engineerin
g
74

2016 2016 20172015 Approved Revised Approved
Expenditures Actual Budget Budget BudgetSalaries 799,552$ 770,054$ 777,690$ 848,157$ Benefits 206,919 205,673 213,923 208,767 Other Services 115,559 612,500 663,938 642,060 Repairs and Maintenance 9,683 17,000 17,000 17,000 Rentals ‐ ‐ ‐ ‐ Insurance 6,084 6,240 6,240 6,240 Communications 6,263 5,850 5,850 6,850 Advertising and Printing 492 500 500 ‐ Travel & Education 12,002 13,500 13,500 13,650 Energy 77,376 78,145 71,213 78,145 General Supplies 183,256 176,400 176,400 176,400 Major Supplies ‐ ‐ ‐ ‐ Miscellaneous 22,083 2,150 2,150 12,150 Capital Outlay 62,069 ‐ ‐ ‐ Debt Service ‐ ‐ ‐ ‐ Transfers ‐ ‐ ‐ ‐
TOTAL 1,501,338$ 1,888,012$ 1,948,404$ 2,009,419$
Authorized Positions2015Actual
2016Approved
2016Revised
2017 Approved
Full Time Employees 11 11 11 11 Part Time Benefited ‐ ‐ ‐ ‐ Contracted Employees ‐ ‐ ‐ ‐
TOTAL 11 11 11 11
Traffic Engineering
75

Description of Service Provided Current or Emerging Issues
The Public Works Street Department strives diligently to preserve and enhance the social and environmental quality of life in the City of Fargo. Through effective, efficient, and quality service the department not only maintains but focuses on improving public infrastructure that will assist in safeguarding the health, safety and welfare of all citizens. The Street Department provides a wide range of services essential to the public which can vary from street and utility repair to fighting major floods and snow storms. Overall the department’s primary responsibilities can be categorized into the following activities: Street & Bridge Maintenance:
o Asphalt & Concrete Street Repair o Mudjacking o Gravel Street & Alley Maintenance
including dust control o Sweeping o Snow Removal & Anti Ice Measures for all
Public Streets o Maintenance & Snow Removal of all City
Owned Sidewalks Gravity Sanitary Sewer System Maintenance
&Televising Storm Sewer System Maintenance & Televising Right‐of‐Way Grooming Street Sign Designation Replacement & Repair Sidewalk Ordinance Enforcement Parking Restriction Enforcement
The current rapid expansion in city development will have long term effects on departmental functions. Without adequate additions to staffing, a decline in levels of service will take place which, in turn, will cause frustration for the taxpayer.
Public Works is facing a growing concern of losing
both historical knowledge and public relations skills as we see an increase in staff retirements. In preparing for these departures, it is imperative for the city to have established training resources available to build management skills of our internal personnel. Often times, new managers are forced to learn proper management techniques on their own. Available resources and training programs would more quickly allow for acclimation into their new roles helping us to avoid an upset in staff moral and downward trending customer service.
In order to progress and continue to build upon the
success of current development within the City of Fargo, time will need to be spent rewriting and recreating the city’s ground rules within the Land Development Code. This is the future of our city and we need to ensure that we are laying the best foundation possible for the generations to come. We have an opportunity to establish the ground rules that will curb undesirable development and continue to strengthen the appeal and success of the City of Fargo.
Operational Measures
Description 2015 Actual 2016 Expected 2017 Projected
Lane Miles of Roadway Maintained 2,048 2,069 2,080 Miles of Sanitary Sewer Maintained 419 427 436 Miles of Storm Sewer Maintained 457 473 486 Storm Lifts Stations Maintained 76 76 78 Acres Mowed 1,057 880 890
Streets D
epartm
ent
76

2016 2016 20172015 Approved Revised Approved
Expenditures Actual Budget Budget BudgetSalaries 2,903,019$ 3,196,699$ 3,189,071$ 3,345,907$ Benefits 973,935 1,078,402 1,071,783 1,083,198 Other Services 176,579 469,100 469,100 470,300 Repairs and Maintenance 24,893 35,000 35,000 35,000 Rentals 193,720 145,256 145,256 260,256 Insurance 59,924 95,925 95,925 95,925 Communications 7,924 9,900 9,900 9,900 Advertising and Printing 235 900 900 900 Travel & Education 12,054 19,700 19,700 19,700 Energy 242,427 461,741 188,594 467,741 General Supplies 378,918 307,600 307,600 307,600 Major Supplies 84,649 530,046 530,046 530,046 Miscellaneous 7,982 7,700 7,700 7,700 Capital Outlay 797 ‐ ‐ ‐ Debt Service ‐ ‐ ‐ ‐ Transfers ‐ ‐ ‐ ‐
TOTAL 5,067,056$ 6,357,969$ 6,070,575$ 6,634,173$
Authorized Positions2015Actual
2016Approved
2016Revised
2017 Approved
Full Time Employees 54 55 55 55 Part Time Benefited ‐ ‐ ‐ ‐ Contracted Employees ‐ ‐ ‐ ‐
TOTAL 54 55 55 55
Street Department
77

Description of Service Provided Current or Emerging Issues
Along with its two divisions, Emergency Services and Transit, Central Garage provides a wide range of services to the City of Fargo departments. This is achieved by operating a maintenance facility and parts storeroom at both the Public Works building and the Metro Transit Garage. Overall the department’s primary responsibilities can be categorized into the following activities:
Vehicle and Equipment Procurement Developing and managing the vehicle and
equipment replacement schedule Liquidation of assets Preventative Maintenance Program Vehicle and Equipment Repairs Major Repair Outsourcing Road Service Assistance Process Licensing Documents Insurance Claim Processing Fuel Contract Purchases Fuel Sales to other Governmental Agencies Fueling Site Operation and Maintenance at
Public Works and Metro Transit Garage Track Lifecycle Costs for Vehicles and
Equipment DOT inspections, breathing apparatus
certification, aerial equipment certification Parts Storeroom
o Perform inventory control procedures o Ensure parts are processed to the work
orders o Provide monthly billing reports o Reconcile purchasing documentation
Bringing ADA compliance up to code as well as
adding a Mother’s Room in the existing Public Works building are significant challenges we are facing. Each has been given top priority for 2017.
A big challenge continues to be hiring and retaining qualified technicians. Nationwide there is a severe shortage of technicians and this trend is expected to continue as the number entering the workforce is not keeping up with the number of technicians retiring.
The rising cost of vehicles and equipment is putting a strain on the vehicle replacement budget which replaces vehicles and equipment for the General Fund Departments. These departments account for over $35,000,000 in vehicles and equipment. If we give everything a 15 year life cycle, to replace on this schedule would require a budget of $2,330,000/year.
With the mandate of cleaner emissions and utilization of advanced technology, we are experiencing a substantial increase in costs associated with equipment maintenance. It is not uncommon to see a cost of $5,000.00 each for the diesel particulate filter and the diesel catalyst filter.
Operational Measures
Description 2015 Actual 2016 Expected 2017 Projected
Repairs less than 1 day 82% 85% 85% Repairs 1 to 2 days 7% 6% 5% Repairs more than 2 days 10% 10% 10% Fleet Availability 93% 94% 95% Billable Labor Hours 31,091 31,500 32,000 Number of Work Orders Generated 8,852 9,000 9,000 Fuel Contract Savings $213,293 $250,000 $250,000
Ce
ntral G
arage
78

2016 2016 20172015 Approved Revised Approved
Expenditures Actual Budget Budget BudgetSalaries 1,184,634$ 1,312,401$ 1,310,055$ 1,430,524$ Benefits 408,328 437,093 443,849 501,236 Other Services 9,541 29,900 29,900 29,900 Repairs and Maintenance 901,618 865,652 877,171 884,452 Rentals ‐ 500 500 12,500 Insurance 11,040 8,840 8,840 11,150 Communications 4,242 5,000 5,000 4,300 Advertising and Printing 335 400 400 400 Travel & Education 13,207 28,300 28,300 28,300 Energy 66,449 193,434 93,066 197,794 General Supplies 41,179 32,400 32,400 37,950 Major Supplies ‐ ‐ ‐ ‐ Miscellaneous 18,165 25,000 25,000 25,000 Capital Outlay ‐ ‐ ‐ ‐ Debt Service ‐ ‐ ‐ ‐ Transfers ‐ ‐ ‐ ‐
TOTAL 2,658,738$ 2,938,920$ 2,854,481$ 3,163,506$
Authorized Positions2015Actual
2016Approved
2016Revised
2017 Approved
Full Time Employees 23 23 23 23 Part Time Benefited ‐ ‐ ‐ ‐ Contracted Employees ‐ ‐ ‐ ‐
TOTAL 23 23 23 23
Central Garage
79

Description of Service Provided Current or Emerging Issues
The Fargo Fire Department is dedicated to providing the community with progressive, high quality preventive and emergency services. 122 full time employees provide fire prevention, safety, and emergency education as well as emergency response to medical, fire, hazardous material, and technical rescue response. The fire department operates out of seven fire stations strategically located throughout the city. The department staffs seven engine companies, two ladder companies, and two battalion vehicles. The fire department service is usually considered a public good that has traditionally been provided by the community for the benefit of its citizens. By publicly providing these services, citizens can have services that would be cost prohibitive for individuals to provide for themselves. Consistent with that philosophy, the Fargo Fire Department continually recognizes the value of serving the needs of the citizens. Firefighting forces are the assets that protect the community’s economic and tax base as well as its health and welfare. This is a valuable asset that must be carefully provided and wisely managed. The FFD collaborates with many other fire protection agencies at the local, state, and federal levels. The department is organized into four divisions: Fire Administration, Fire Prevention/Inspection/Investigation, Emergency Operations, and Support Services. Fire Administration is responsible for all department activities, liaison to other city departments, accreditation, human resource issues, and final determinant in all budgetary matters. Fire Prevention provides proactive prevention services, such as fire safety inspections of commercial and University property, site plan reviews, and fire prevention education. Fire Support Services plans, develops, and coordinates in‐house training activities through the assistance of two training captains. This division also oversees the City’s Emergency Management program. The Assistant Chief of Support Services serves as the accreditation manager. The department was reaccredited in 2015 by the Commission on Fire Accreditation international.
Emergency operations services include emergency medical services, fire suppression, hazardous materials and technical rescue response. This division also oversees all facilities and equipment purchasing. This division conducts commercial building inspections, hydrant flushing, public education, and emergency response.
Calls for assistance continue to increase. The increase is most noticeable in the downtown and South Fargo areas. The City will need a station in South Fargo within the next 3 years to meet service demands.
The increased use of opioids in the community have led to the FFD to carry Narcan. This continues to expend service provided and requires additional training.
Fire Station 2 is in need of an update. It was recommended by the accreditation team that we look to move the station. There is not a suitable area for the station to be moved to. A remodel of the building is needed.
The fire burn building located with Station 4 is in need of repairs. The building is over 40 years old and the interior protective coating is starting to fall off. The facility needs to be made usable in the interim but a new facility is needed.
With the community growth we continue to upgrade and add to our warning system. New sirens are needed as well as replacement.
Changes in fire department responses have caused us to evaluate how we would respond with Fargo PD to an active shooter situation. Additional protective equipment needs to be purchased to ensure firefighter safety in these situations.
The current radio system will be unsupported in 2019. This will require a major investment in radio system infrastructure in the next 2 years.
Fire Dep
artm
ent
80

Operational Measures
Description 2015 Actual 2016 Expected 2017 Projected
Calls for Service 9,336 9,200 10,500 Number of Stations 7 7 7 Number of Apparatus 16 16 16 Hydrants Flushed 6,970 7,000 7,150 Suppression Inspections 4,987 5,200 5,250 Bureau Inspections 1,151 1,250 1,300 Average Response Time 244 sec. 240 sec. 240 sec. ISO Rating 3 2 2
81

2016 2016 20172015 Approved Revised Approved
Expenditures Actual Budget Budget BudgetSalaries 7,699,574$ 7,957,963$ 8,036,184$ 8,270,624$ Benefits 3,040,241 3,313,206 3,194,937 3,361,014 Other Services 129,630 184,500 194,500 195,000 Repairs and Maintenance 84,191 122,500 122,500 134,230 Rentals ‐ ‐ ‐ ‐ Insurance 41,228 35,020 35,020 35,020 Communications 13,972 21,500 21,500 21,500 Advertising and Printing 2,448 9,500 9,500 9,500 Travel & Education 77,743 62,612 113,022 74,000 Energy 217,637 232,492 192,243 232,492 General Supplies 79,942 105,100 105,100 117,100 Major Supplies ‐ ‐ ‐ ‐ Miscellaneous 103,028 116,275 122,275 122,000 Capital Outlay 7,557 ‐ ‐ ‐ Debt Service ‐ ‐ ‐ ‐ Transfers ‐ ‐ ‐ ‐
TOTAL 11,497,191$ 12,160,668$ 12,146,781$ 12,572,480$
Authorized Positions2015Actual
2016Approved
2016Revised
2017 Approved
Full Time Employees 121 122 122 122 Part Time Benefited ‐ ‐ ‐ ‐ Contracted Employees ‐ ‐ ‐ ‐
TOTAL 121 122 122 122
Fire Department
82

Description of Service Provided Current or Emerging Issues
The Fargo Police Department provides the community with a wide range of both basic and emergency policing services, which includes investigating and resolving crime, enforcing the city’s traffic regulations, responding to calls‐for‐service received from the general public and mitigating the other public‐safety concerns coming to our attention. The Fargo Police Department is divided into three operational divisions, each of which is commanded by a deputy chief: The Field Services Division consists of Patrol, SROs, Traffic Safety Unit, Truck Regulatory, Cultural Liaison. The Investigations Division consists of the following teams: Personal Crimes, Property Crimes, Financial Crimes, Intelligence, Narcotics and Street Crimes. The Administrative Division oversees training, budgets, grants, H.R., crime prevention, crime free housing, public information officer, media and marketing. The Field Services Division is sub‐divided into four patrol districts, each of which is managed by a police lieutenant who is responsible for police operations within their district. Each district is further divided into three patrol beats where the officers assigned each area are supervised by a police sergeant. The department utilizes processes known as “CompStat” and “Intelligence Led Policing”. These processes facilitate the use of data and intelligence information to assess when and where department resources are deployed, thus making the most effective and efficient use of those resources.
As Fargo continues its rapid and vibrant expansion the public‐safety issues associated with such growth will continue to increase as well. In order to maintain a relatively low crime rate throughout the city, the police department will need to add both sworn and non‐sworn personnel at a rate that meets or exceeds the city’s growth rate (I have included spread sheets describing the necessary personnel needed for the future). In addition to adding personnel to keep up with the city’s growth, the department’s on‐going initiatives to mitigate crime through prevention, public interaction and public awareness will be the best approach in maintaining the existing quality of life status throughout the city. Heroin and Fentanyl overdoses and deaths have become a critical issue locally, regionally and nationally. The police department has dedicated significant resources in personnel to battle this through awareness, education and enforcement efforts. As temporary relief for overcrowding and parking issues, the city has given the police department the old health department building across the street. We are grateful for the much needed space and parking this temporary solution has given us. The rapid geographic and elongated growth of the city presents a significant challenge for the police department’s response capabilities. I would like to see the city plan for a police station in the near future which would allow for the growth of the police department for the next 30 years and be more accessible to the public. A future location should also allow for quicker response throughout the city as compared to being located downtown.
Operational Measures
Description 2015 Actual 2016 Expected 2017 Projected
Calls‐for‐Service 74,516 78,117 83,419 Total Offenses 10,006 10,257 10,514 Traffic Crashes 2,746 2,505 2,588
Po
lice Dep
artm
ent
83

2016 2016 20172015 Approved Revised Approved
Expenditures Actual Budget Budget BudgetSalaries 11,648,593$ 12,119,309$ 12,238,067$ 12,747,138$ Benefits 3,829,683 4,357,936 4,532,456 4,736,184 Other Services 195,486 154,100 109,100 224,100 Repairs and Maintenance 336,730 142,136 142,136 133,190 Rentals 12,559 22,000 22,000 292,000 Insurance 69,494 57,610 57,610 57,610 Communications 76,071 150,256 150,256 133,456 Advertising and Printing 19,896 36,500 36,500 34,500 Travel & Education 148,421 160,150 160,150 160,150 Energy 245,682 266,057 208,423 265,657 General Supplies 307,533 192,125 192,125 231,535 Major Supplies ‐ ‐ ‐ ‐ Miscellaneous 190,130 155,222 155,222 155,222 Capital Outlay 82,305 ‐ 250,000 ‐ Debt Service ‐ ‐ ‐ ‐ Transfers ‐ ‐ ‐ ‐
TOTAL 17,162,583$ 17,813,401$ 18,254,045$ 19,170,742$
Authorized Positions2015Actual
2016Approved
2016Revised
2017 Approved
Full Time Employees 178 185 185 190 Part Time Benefited ‐ ‐ ‐ ‐ Contracted Employees 2 2 2 2
TOTAL 180 187 187 192
Police Department
84

Description of Service Provided Current or Emerging Issues
Fargo Cass Public Health mission is to assure a healthy community for all people through ongoing assessment, education, advocacy, education, prevention and collaboration. Currently there are 146 employees equating to 124 FTE's The major services delivered include:
Environmental Health (food inspections, water quality, nuisance complaints, other)
PH Emergency Preparedness WIC Nutritional Supplement Program Health Promotion (obesity prevention,
tobacco prevention, worksite wellness) Clinic based services (family planning,
immunizations) Nursing (home based, school, correctional
health) Disease Control (tuberculosis, sexually
transmitted disease, HIV) Employee Health Gladys Ray Shelter Fargo Detox Center Grants management/ Accreditation/Quality
Improvement
We are seeing an increase in grant funding that is being awarded on a regional basis rather than per individual county. This trend has increased our need to work collaboratively with other counties in the SE region. I anticipate that this trend will increase as federal and state funding patterns change. As funding from federal and state grant sources continues to decrease we will need to seek out alternative grants and position FCPH to be eligible for other funding sources. FCPH has officially applied for voluntary National Public Health Accreditation. This is the beginning of a 12‐18 month process. Doing so will identify FCPH as a nationally recognized, high quality health department. Throughout the process we will be focusing on continuous quality improvement, performance management, as well as reviewing policies, procedures and programmatic areas. Mental health and drug abuse issues continue to increase and are impacting the entire community as well as several of our program areas. The increase in heroin use and overdose deaths in our area will requires a community wide public health response. Staff time and resources will need to be allocated to this area. The safety of FCPH staff at the shelter and detox center is of concern as they work with guests who are often unpredictable and under the influence of unknown substances. Nursing staff who visit individuals in their homes are reporting more clients with significant mental health and substance abuse issues.
Operational Measures
Description 2015 Actual 2016 Expected 2017 Projected
Federal Grants $1,456,927 $1,491,000 $1,440,000 State Grants $602,200 $321,500 $272,000 State Aid $531,744 $571,505 $572,317 % of Health Records converted to electronic
80% of identified programs
100% of identified programs
Completed
Self‐Pay Revenue $600,321 $510,000 $413,000 Insurance Revenues $656,757 $580,000 $675,000 Environmental Health licenses issued
1,520 1,600 1,740
Fargo Ca
ss Pub
lic Health
85

2016 2016 20172015 Approved Revised Approved
Expenditures Actual Budget Budget BudgetSalaries 6,637,146$ 6,934,090$ 6,929,670$ 7,317,123$ Benefits 1,927,906 2,097,311 2,108,135 2,139,695 Other Services 674,182 475,720 507,988 530,720 Repairs and Maintenance 40,700 16,000 16,000 17,000 Rentals 38,205 15,960 15,960 9,000 Insurance 30,849 25,365 25,365 25,365 Communications 51,619 37,000 37,000 43,100 Advertising and Printing 17,392 17,100 20,500 16,600 Travel & Education 107,929 134,000 141,700 142,200 Energy 26,860 83,588 78,373 82,588 General Supplies 496,353 473,400 473,400 476,900 Major Supplies 25,977 20,000 20,000 20,000 Miscellaneous 2,982 1,000 1,000 1,000 Capital Outlay 19,627 ‐ 7,273 ‐ Debt Service ‐ ‐ ‐ ‐ Transfers ‐ ‐ ‐ ‐
TOTAL 10,097,727$ 10,330,534$ 10,382,364$ 10,821,291$
Authorized Positions2015Actual
2016Approved
2016Revised
2017 Approved
Full Time Employees 94 95 95 98 Part Time Benefited 40 39 39 39 Contracted Employees 1 1 1 1
TOTAL 135 135 135 138
Fargo Cass Public Health
86
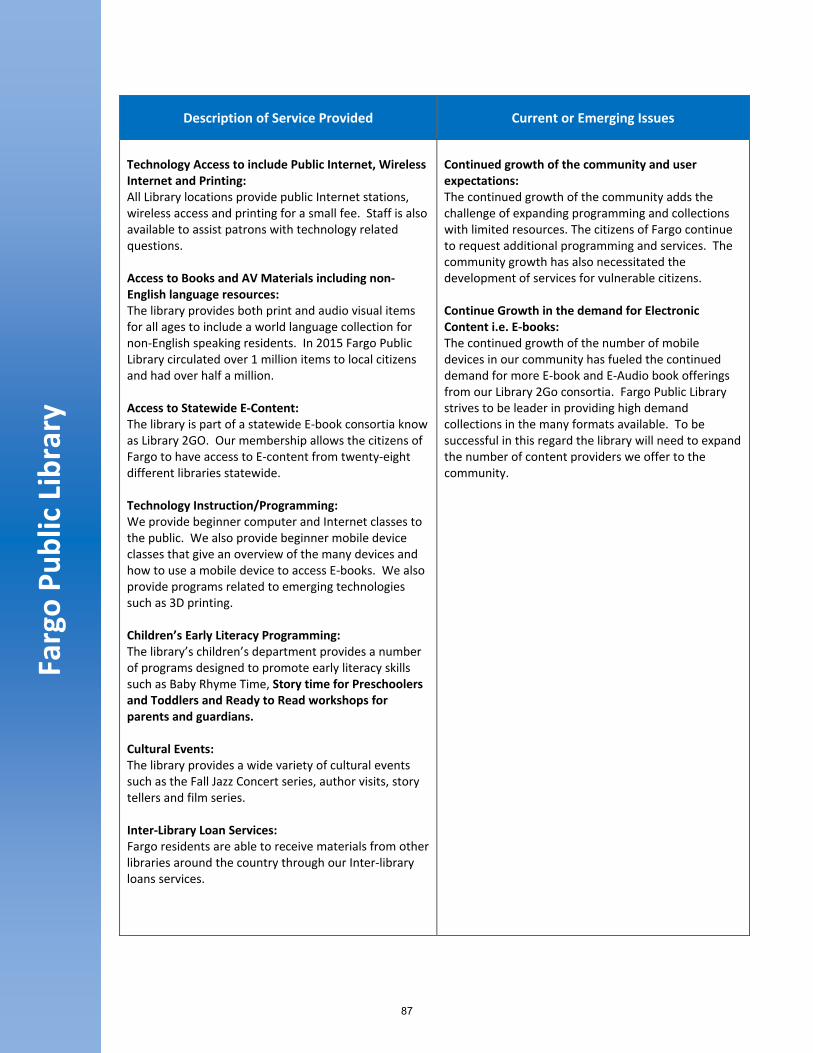
Description of Service Provided Current or Emerging Issues
Technology Access to include Public Internet, Wireless Internet and Printing: All Library locations provide public Internet stations, wireless access and printing for a small fee. Staff is also available to assist patrons with technology related questions. Access to Books and AV Materials including non‐English language resources: The library provides both print and audio visual items for all ages to include a world language collection for non‐English speaking residents. In 2015 Fargo Public Library circulated over 1 million items to local citizens and had over half a million. Access to Statewide E‐Content: The library is part of a statewide E‐book consortia know as Library 2GO. Our membership allows the citizens of Fargo to have access to E‐content from twenty‐eight different libraries statewide. Technology Instruction/Programming: We provide beginner computer and Internet classes to the public. We also provide beginner mobile device classes that give an overview of the many devices and how to use a mobile device to access E‐books. We also provide programs related to emerging technologies such as 3D printing. Children’s Early Literacy Programming: The library’s children’s department provides a number of programs designed to promote early literacy skills such as Baby Rhyme Time, Story time for Preschoolers and Toddlers and Ready to Read workshops for parents and guardians. Cultural Events: The library provides a wide variety of cultural events such as the Fall Jazz Concert series, author visits, story tellers and film series. Inter‐Library Loan Services: Fargo residents are able to receive materials from other libraries around the country through our Inter‐library loans services.
Continued growth of the community and user expectations: The continued growth of the community adds the challenge of expanding programming and collections with limited resources. The citizens of Fargo continue to request additional programming and services. The community growth has also necessitated the development of services for vulnerable citizens. Continue Growth in the demand for Electronic Content i.e. E‐books: The continued growth of the number of mobile devices in our community has fueled the continued demand for more E‐book and E‐Audio book offerings from our Library 2Go consortia. Fargo Public Library strives to be leader in providing high demand collections in the many formats available. To be successful in this regard the library will need to expand the number of content providers we offer to the community.
Fargo Pu
blic Library
87

Description of Service Provided Current or Emerging Issues
Access to Electronic Databases: The library provides a wide variety of online resources. The topics include: Auto Repair, Books and Reading, Encyclopedias, Genealogy, Health Resources, Investing, Language Learning, Legal Resources, Library Catalogs, Local History, Magazines and Newspapers, Non Profits, Research, Small Business, Teachers and Educators, Test Preparation and Skill Improvements. Reference and Readers Advisory Services: The library provides staff dedicated to assisting patron’s informational needs. Community Gathering Spaces: Each library location has meeting/program space available for community businesses, organizations and individual citizens. Recreational and Educational Programming for all Ages: Along with the cultural programs discussed above, the library continually provides the community a diverse offering of programs for all ages. http://www.cityoffargo.com/CityInfo/Departments/Library/CalendarofEvents Outreach Services: The library provides library materials to citizens in over twenty retirement and assistant living facilities to include a number of homebound individuals. Job Seeker Services: The library has provided classes for resume’ building and interview skills.
Operational Measures
Description 2015 Actual 2016 Expected 2017 Projected
Items Circulated 1,004,966 1,001,134 1,006,976 Library Visits 514,089 516,000 517,500 Program Attendance 21,551 20,318 24,000
88

2016 2016 20172015 Approved Revised Approved
Expenditures Actual Budget Budget BudgetSalaries 2,044,877$ 2,089,867$ 2,106,439$ 2,191,387$ Benefits 591,442 668,102 660,830 680,862 Other Services 68,150 86,200 86,920 55,700 Repairs and Maintenance 52,751 60,366 77,866 63,366 Rentals 57,616 56,196 56,196 59,040 Insurance 17,517 21,555 21,555 21,555 Communications 67,974 73,450 55,950 70,450 Advertising and Printing 26,896 27,000 27,000 27,000 Travel & Education 21,073 32,200 32,200 32,200 Energy 177,172 158,864 158,563 158,864 General Supplies 742,151 783,729 786,857 807,554 Major Supplies ‐ ‐ ‐ ‐ Miscellaneous 3,773 2,100 2,100 2,100 Capital Outlay ‐ ‐ ‐ ‐ Debt Service ‐ ‐ ‐ ‐ Transfers ‐ ‐ ‐ ‐
TOTAL 3,871,392$ 4,059,629$ 4,072,476$ 4,170,078$
Authorized Positions2015Actual
2016Approved
2016Revised
2017 Approved
Full Time Employees 27 28 28 29 Part Time Benefited 22 22 22 22 Contracted Employees ‐ ‐ ‐ ‐
TOTAL 49 50 50 51
Fargo Public Library
89

Description of Service Provided Current or Emerging Issues
The City Commission Office provides administrative services in support of the governing body including the Mayor and City Commissioners as well as the City Administrator. The Office also serves as the contact between constituents and their elected officials. The major services delivered include:
City Commission agenda creation Compilation of agenda packets to include
review of recommended motions to assure appropriate action by Commission
Preparation of on‐line agenda packets to link agenda items with background information
Preparation of City Commission minutes Proper follow‐up of City Commission
actions taken at meetings Review of pending legislation prior to and
during Legislative sessions and work with Legislators and various Departments
Ensure proper media notification of meetings to conform with open meetings laws
Liaison between City departments and the Commissioners
Liaison between the public and Commissioners
Arrange meetings for the Mayor, City Commissioners, the City Administrator and Assistant City Administrator.
Preparation of Proclamations Preparation of various documents for the
Mayor, Commissioners and City Administrator
This department is in a current state of
change. The previous Executive Assistant retired in March of 2016 after 49‐years in the commission Office. Leaving a vacant Principal Office Associate Position which was filled in the later part of June 2016. The department also appointed a new City Administrator in February of 2016 in addition to a new Assistant City Administrator in June of 2016. Two new City Commissioners were elected in June of 2016. This next year will be a learning experience for everyone in the department with all of the new individuals that were brought on board.
The Commission Office in conjunction with the Auditor's Office and the IS Department are going to begin the search for an Agenda/Meeting Management System. We are hoping for implementation still in 2016 or early 2017.
Operational Measures
Description 2015 Actual 2016 Expected 2017 Projected
Agenda Preparation 27 26 26 Minute Preparation 27 26 26 Legislative Bills Review 941 1,100 1,100
City Com
mission
90

2016 2016 20172015 Approved Revised Approved
Expenditures Actual Budget Budget BudgetSalaries 304,137$ 321,072$ 322,241$ 321,812$ Benefits 102,766 108,714 109,243 130,073 Other Services 58,648 64,557 64,557 11,000 Repairs and Maintenance ‐ 500 500 500 Rentals ‐ ‐ ‐ ‐ Insurance 1,588 1,945 1,945 1,945 Communications 3,638 5,000 5,000 5,000 Advertising and Printing 23,242 31,000 31,000 26,000 Travel & Education 82,205 100,100 100,100 99,600 Energy ‐ ‐ ‐ ‐ General Supplies 1,619 2,350 2,350 4,350 Major Supplies ‐ ‐ ‐ ‐ Miscellaneous 24,054 26,000 38,500 43,000 Capital Outlay ‐ ‐ ‐ ‐ Debt Service ‐ ‐ ‐ ‐ Transfers ‐ ‐ ‐ ‐
TOTAL 601,897$ 661,238$ 675,436$ 643,280$
Authorized Positions2015Actual
2016Approved
2016Revised
2017 Approved
Full Time Employees 3 3 3 3 Part Time Benefited 5 5 5 5 Contracted Employees ‐ ‐ ‐ ‐
TOTAL 8 8 8 8
City Commission
91

Description of Service Provided Current or Emerging Issues
The Fargo Civic Center provides multi‐purpose event space for concerts, trade shows, sporting events, corporate functions and community/regional events. Event services provided by the Fargo Civic Center includes:
Staffing Equipment set‐up and rental Ticketing Concessions
Centennial Hall was decommissioned in March of 2015. The decommissioning resulted in a loss of 50% of the rentable square footage. Demolition of Centennial Hall began in July of 2016 to facilitate the construction of a new City Hall. In spite of the loss of Centennial Hall, the Civic Center auditorium continues to schedule and host events. The Civic staff is committed to increasing activity by scheduling more events in the Civic Center. On August 31, 2015, the City Commission received and filed a feasibility study regarding a potential repurposing of the Civic Center into a multi‐purpose performance facility. In 2017, staff will revisit the results of the feasibility study and begin working on a preliminary plan and potential financing scenarios for a repurposing of the Civic center.
Operational Measures
Description 2015 Actual 2016 Expected 2017 Projected
Days occupied 70 77 100
Fargo Civic Ce
nter
92

2016 2016 20172015 Approved Revised Approved
Expenditures Actual Budget Budget BudgetSalaries 255,036$ 124,152$ 125,305$ 216,199$ Benefits 78,755 47,372 52,279 56,024 Other Services 15,607 9,200 9,200 22,500 Repairs and Maintenance 2,970 6,000 6,000 13,000 Rentals 2,666 2,500 2,500 2,500 Insurance 1,368 1,000 1,000 1,000 Communications 2,481 1,500 1,500 1,500 Advertising and Printing ‐ 120 120 120 Travel & Education ‐ 400 400 400 Energy 100,171 67,582 67,582 67,582 General Supplies 2,656 4,415 4,415 6,915 Major Supplies 42,152 24,200 24,200 41,000 Miscellaneous 1,115 5,000 5,000 3,000 Capital Outlay ‐ ‐ ‐ ‐ Debt Service ‐ ‐ ‐ ‐ Transfers ‐ ‐ ‐ ‐
TOTAL 504,977$ 293,441$ 299,501$ 431,740$
Authorized Positions2015Actual
2016Approved
2016Revised
2017 Approved
Full Time Employees 5 3 3 3 Part Time Benefited 1 1 1 1 Contracted Employees ‐ ‐ ‐ ‐
TOTAL 6 4 4 4
Fargo Civic Center
93
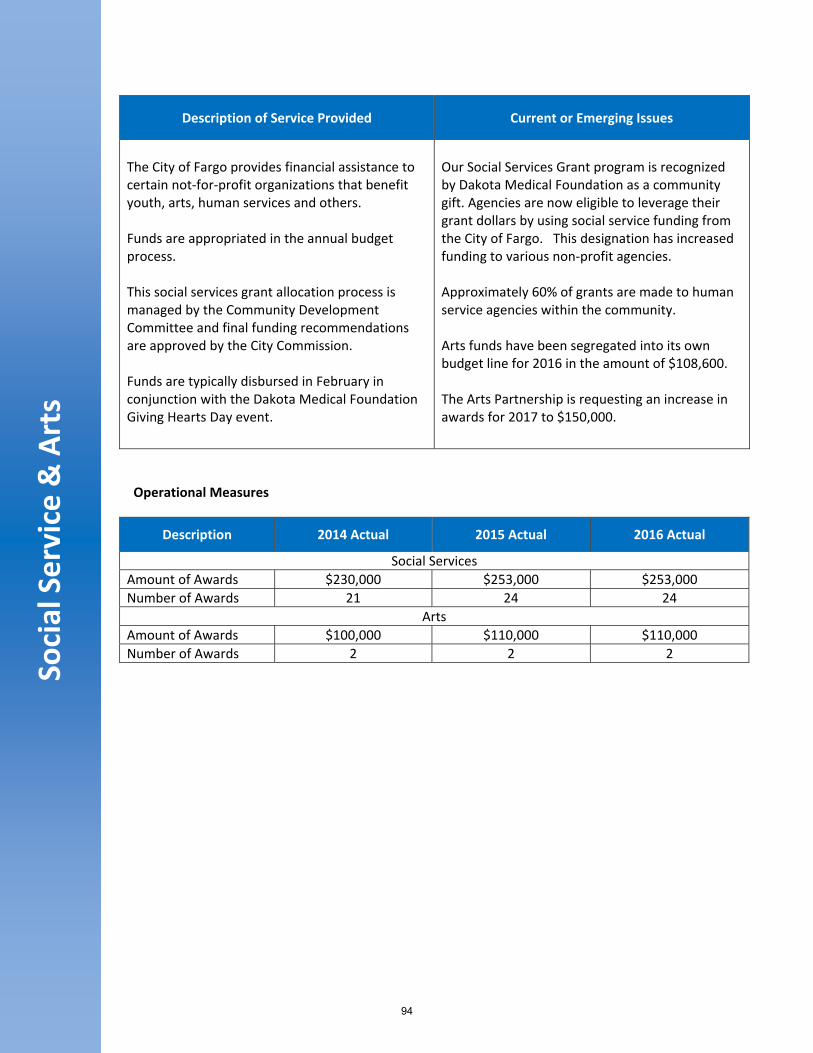
Description of Service Provided Current or Emerging Issues
The City of Fargo provides financial assistance to certain not‐for‐profit organizations that benefit youth, arts, human services and others. Funds are appropriated in the annual budget process. This social services grant allocation process is managed by the Community Development Committee and final funding recommendations are approved by the City Commission. Funds are typically disbursed in February in conjunction with the Dakota Medical Foundation Giving Hearts Day event.
Our Social Services Grant program is recognized by Dakota Medical Foundation as a community gift. Agencies are now eligible to leverage their grant dollars by using social service funding from the City of Fargo. This designation has increased funding to various non‐profit agencies. Approximately 60% of grants are made to human service agencies within the community. Arts funds have been segregated into its own budget line for 2016 in the amount of $108,600. The Arts Partnership is requesting an increase in awards for 2017 to $150,000.
Operational Measures
Description 2014 Actual 2015 Actual 2016 Actual
Social Services Amount of Awards $230,000 $253,000 $253,000 Number of Awards 21 24 24
Arts Amount of Awards $100,000 $110,000 $110,000 Number of Awards 2 2 2
Social Service & Arts
94

2016 2016 20172015 Approved Revised Approved
Expenditures Actual Budget Budget BudgetSalaries ‐$ ‐$ ‐$ ‐$ Benefits ‐ ‐ ‐ ‐ Other Services 343,096 362,000 322,579 403,400 Repairs and Maintenance ‐ ‐ ‐ ‐ Rentals ‐ ‐ ‐ ‐ Insurance ‐ ‐ ‐ ‐ Communications ‐ ‐ ‐ ‐ Advertising and Printing ‐ ‐ ‐ ‐ Travel & Education ‐ ‐ ‐ ‐ Energy ‐ ‐ ‐ ‐ General Supplies ‐ ‐ ‐ ‐ Major Supplies ‐ ‐ ‐ ‐ Miscellaneous ‐ ‐ ‐ ‐ Capital Outlay ‐ ‐ ‐ ‐ Debt Service ‐ ‐ ‐ ‐ Transfers ‐ ‐ ‐ ‐
TOTAL 343,096$ 362,000$ 322,579$ 403,400$
Social Service & Arts
95

Description of Service Provided Current or Emerging Issues
Capital assets are a key part of providing quality services to our citizens. Resources need to be allocated in amounts sufficient to meet the demands of our growing City.
All General Fund capital outlay requests are accumulated in the Capital Outlay Division for ease of budgeting and tracking. There is a detailed schedule of capital outlay requests and related funding in later section of this document. Department Heads are responsible to forecast their need for capital items to include buildings, heavy equipment, vehicles, equipment, software and other items that may be unique to their service delivery. The Budget Team reviews all capital requests and allocates budgetary resources for the highest priority initiatives. In some cases, a fixed dollar amount is allocated and Department Heads can determine which items will be purchased.
Capital outlay funding has been reduced in the 2017 budget by approximately $2 million to help offset revenue decline from the State. The ground breaking for the new City Hall project is beginning in August, 2016. Management continues to evaluate equipment replacement schedules to determine optimum useful life strategies.
Capital O
utlay
96
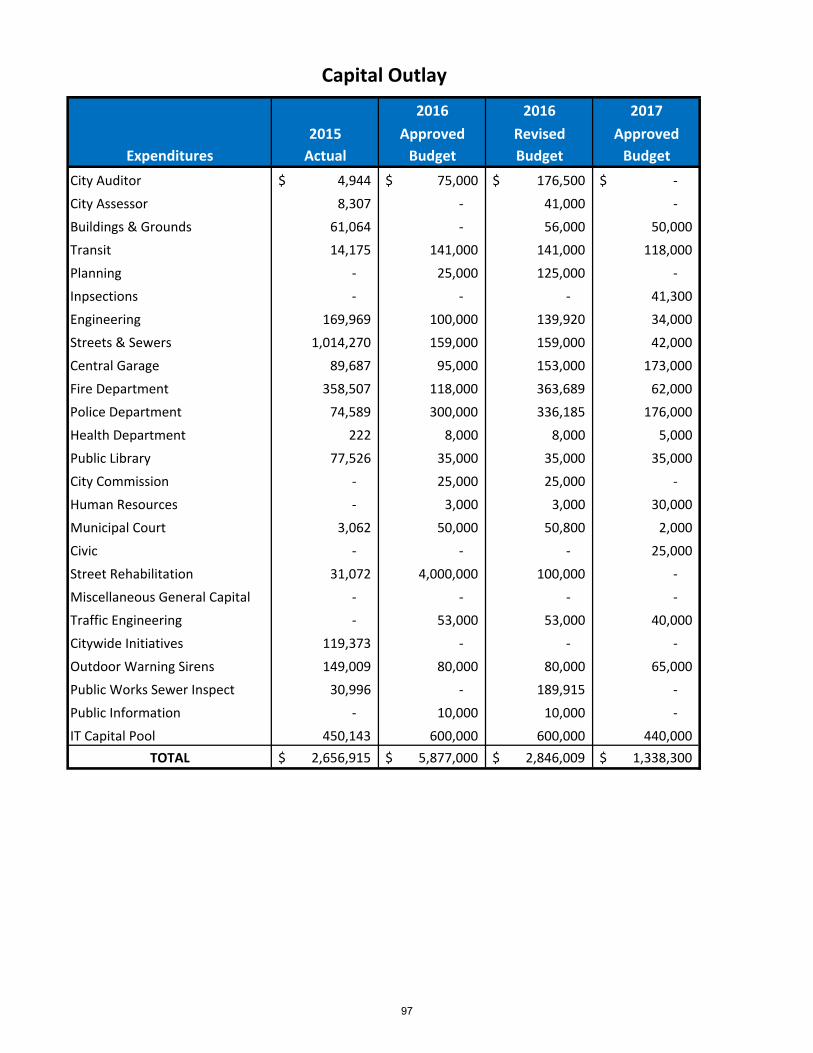
2016 2016 20172015 Approved Revised Approved
Expenditures Actual Budget Budget BudgetCity Auditor 4,944$ 75,000$ 176,500$ ‐$ City Assessor 8,307 ‐ 41,000 ‐ Buildings & Grounds 61,064 ‐ 56,000 50,000 Transit 14,175 141,000 141,000 118,000 Planning ‐ 25,000 125,000 ‐ Inpsections ‐ ‐ ‐ 41,300 Engineering 169,969 100,000 139,920 34,000 Streets & Sewers 1,014,270 159,000 159,000 42,000 Central Garage 89,687 95,000 153,000 173,000 Fire Department 358,507 118,000 363,689 62,000 Police Department 74,589 300,000 336,185 176,000 Health Department 222 8,000 8,000 5,000 Public Library 77,526 35,000 35,000 35,000 City Commission ‐ 25,000 25,000 ‐ Human Resources ‐ 3,000 3,000 30,000 Municipal Court 3,062 50,000 50,800 2,000 Civic ‐ ‐ ‐ 25,000 Street Rehabilitation 31,072 4,000,000 100,000 ‐ Miscellaneous General Capital ‐ ‐ ‐ ‐ Traffic Engineering ‐ 53,000 53,000 40,000 Citywide Initiatives 119,373 ‐ ‐ ‐ Outdoor Warning Sirens 149,009 80,000 80,000 65,000 Public Works Sewer Inspect 30,996 ‐ 189,915 ‐ Public Information ‐ 10,000 10,000 ‐ IT Capital Pool 450,143 600,000 600,000 440,000
TOTAL 2,656,915$ 5,877,000$ 2,846,009$ 1,338,300$
Capital Outlay
97

Description of Service Provided Current or Emerging Issues
The Fleet Purchasing Department provides a wide range of services essential to all departments by utilizing the City of Fargo Purchasing policy. Overall the department’s primary responsibilities can be categorized into the following activities: Product evaluations Vendor demonstrations Department Requests Fleet justifications Developing equipment specifications Requesting Proposals Asset Management Auction Services Equipment Liquidation
Enterprise fund vehicles and equipment are charged directly to the fund that utilizes them and are not included in this Divisional budget. This cost center is used to track ongoing end of life unit replacement of our fleet. Significant funding is needed to replace unit on a timely basis. Failure to replace them in an optimal timeline drives up repair costs. A Vehicle Replacement Committee meets periodically to monitor replacement recommendations and strategies to get the most value from our investment in these assets.
Extending life cycles of equipment per budget
restraints.
Both fleet expansion and staffing increases make equipment requests difficult to fulfill within the given budget.
Cost benefit of early cycle trading to keep up with inflation and equipment’s useful life.
Utilizing a motor pool system with a comprehensive life cycle billing.
Expected future equipment cost.
Street Sweeper $240,000 Fire Truck (Pumper) $550,000 Squad car w/equip $60,000 Snow Plow Truck $182,000 Motor grader $312,000
Operational Measures
Equipment Class Equipment Count Desired Replacement
Actual Replacement
Average Age by Year
Fire / Emergency Equipment
27 12 18 10
Police Squad 47 3 3.5 4 Sedans 70 10 12 6 SUV 56 10 14 7 Van 13 10 15 9 Pickup Trucks 71 10 15 10 1 Ton 31 12 15 6 Refuse 50 12 16 7 Dump / Plow trucks 54 12 15 11 Construction / Misc 66 12 14 7
Vehicle Re
placem
ent
98

2016 2016 20172015 Approved Revised Approved
Expenditures Actual Budget Budget BudgetStreets & Sewers 878,280$ 425,000$ 425,000$ 801,000$ Central Garage 254,797 175,000 175,000 280,000 Fire Department 291,283 295,000 295,000 295,000 Police Department 361,856 394,000 394,000 331,000
TOTAL 1,786,216$ 1,289,000$ 1,289,000$ 1,707,000$
Vehicle Replacement
99

2016 2016 20172015 Approved Revised Approved
Expenditures Actual Budget Budget BudgetSalaries ‐$ (661,050)$ (165,215)$ (713,991)$ Benefits ‐ ‐ ‐ 339,280 Other Services ‐ (75,000) (75,000) (74,839) Repairs and Maintenance ‐ ‐ ‐ ‐ Rentals ‐ ‐ ‐ ‐ Insurance ‐ ‐ ‐ ‐ Communications ‐ ‐ ‐ ‐ Advertising and Printing ‐ ‐ ‐ ‐ Travel & Education ‐ (70,253) (70,253) (70,253) Energy ‐ ‐ ‐ ‐ General Supplies ‐ ‐ ‐ ‐ Major Supplies ‐ ‐ ‐ ‐ Miscellaneous 13,589 ‐ ‐ ‐ Capital Outlay ‐ ‐ ‐ ‐ Debt Service ‐ ‐ ‐ ‐ Transfers ‐ ‐ ‐ ‐
TOTAL 13,589$ (806,303)$ (310,468)$ (519,803)$
Unallocated
100

Description of Service Provided Current or Emerging Issues
Fund transfers are used to move General Fund resources to other governmental funds for specific purposes. Specific uses include local share of capital grants, debt service, special revenue funding and capital projects. Certain budgeted expenditures are reclassified during the Comprehensive Annual Financial Report as transfers to other funds.
Fund transfers out for pay as we go capital have been lowered in 2016 and 2017 due to the decline of State of North Dakota revenues. The local share of transit capital grants for equipment replacement has been increased by $200,000 to synchronize to the proposed transit vehicle replacement cycles. Transfers required to meet our debt obligations on the City Hall bonds will be increased in 2018 to match our bond repayment schedule.
Tran
sfers T
o Other Fun
ds
101

2016 2016 20172015 Approved Revised Approved
Expenditures Actual Budget Budget BudgetTo Special Revenue Funds 112,726$ 69,000$ 69,000$ 69,000$ To Debt Service Funds 793,401 1,625,000 1,625,000 1,677,520 To Capital Project Funds 250,000 100,000 170,660 537,670 To Street Rehabiliation 3,987,235 ‐ 3,900,000 ‐
TOTAL 5,143,362$ 1,794,000$ 5,764,660$ 2,284,190$
Transfers To Other Funds
102

Fund Description Fiscal Trends and Comments
There are sixteen Special Revenue Funds maintained by the City of Fargo. Special Revenue Funds are used to account for specific revenues that are legally restricted to expenditures of a particular purpose.
Budget amendments have been
approved by the City Commission to transfer resources from the Parking Authority operations and Surplus fund into the Robert Street parking ramp project.
The Parking Authority’s budget has
been increased by $730,000 for debt service requirements on the Robert Street Parking ramp project approved in 2016 that will be opening in May, 2017. Recent changes in management structure have enhanced our overall parking system resources and customer service levels.
The Parking Authority Repair & Replacement Fund budget has been increased by $305,000 in anticipation of the results of a comprehensive review of our parking system infrastructure and related maintenance needs going forward.
There are no other significant changes in the composition or amount of Special Revenue Funds in 2017 other than the items listed above.
SPECIAL REVENUE FU
NDS
103
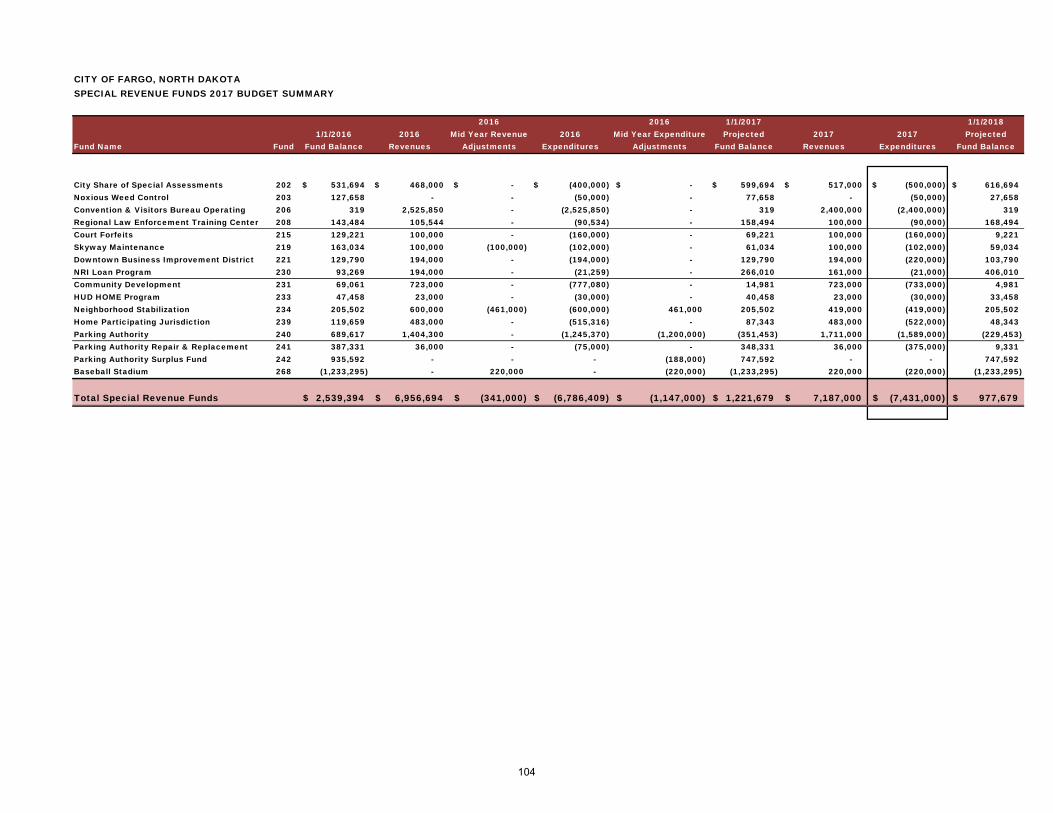
CITY OF FARGO, NORTH DAKOTASPECIAL REVENUE FUNDS 2017 BUDGET SUMMARY
2016 2016 1/1/2017 1/1/20181/1/2016 2016 Mid Year Revenue 2016 Mid Year Expenditure Projected 2017 2017 Projected
Fund Name Fund Fund Balance Revenues Adjustments Expenditures Adjustments Fund Balance Revenues Expenditures Fund Balance
City Share of Special Assessments 202 531,694$ 468,000$ -$ (400,000)$ -$ 599,694$ 517,000$ (500,000)$ 616,694$ Noxious Weed Control 203 127,658 - - (50,000) - 77,658 - (50,000) 27,658 Convention & Visitors Bureau Operating 206 319 2,525,850 - (2,525,850) - 319 2,400,000 (2,400,000) 319 Regional Law Enforcement Training Center 208 143,484 105,544 - (90,534) - 158,494 100,000 (90,000) 168,494 Court Forfeits 215 129,221 100,000 - (160,000) - 69,221 100,000 (160,000) 9,221 Skyway Maintenance 219 163,034 100,000 (100,000) (102,000) - 61,034 100,000 (102,000) 59,034 Downtown Business Improvement District 221 129,790 194,000 - (194,000) - 129,790 194,000 (220,000) 103,790 NRI Loan Program 230 93,269 194,000 - (21,259) - 266,010 161,000 (21,000) 406,010 Community Development 231 69,061 723,000 - (777,080) - 14,981 723,000 (733,000) 4,981 HUD HOME Program 233 47,458 23,000 - (30,000) - 40,458 23,000 (30,000) 33,458 Neighborhood Stabilization 234 205,502 600,000 (461,000) (600,000) 461,000 205,502 419,000 (419,000) 205,502 Home Participating Jurisdiction 239 119,659 483,000 - (515,316) - 87,343 483,000 (522,000) 48,343 Parking Authority 240 689,617 1,404,300 - (1,245,370) (1,200,000) (351,453) 1,711,000 (1,589,000) (229,453) Parking Authority Repair & Replacement 241 387,331 36,000 - (75,000) - 348,331 36,000 (375,000) 9,331 Parking Authority Surplus Fund 242 935,592 - - - (188,000) 747,592 - - 747,592 Baseball Stadium 268 (1,233,295) - 220,000 - (220,000) (1,233,295) 220,000 (220,000) (1,233,295)
Total Special Revenue Funds 2,539,394$ 6,956,694$ (341,000)$ (6,786,409)$ (1,147,000)$ 1,221,679$ 7,187,000$ (7,431,000)$ 977,679$
104
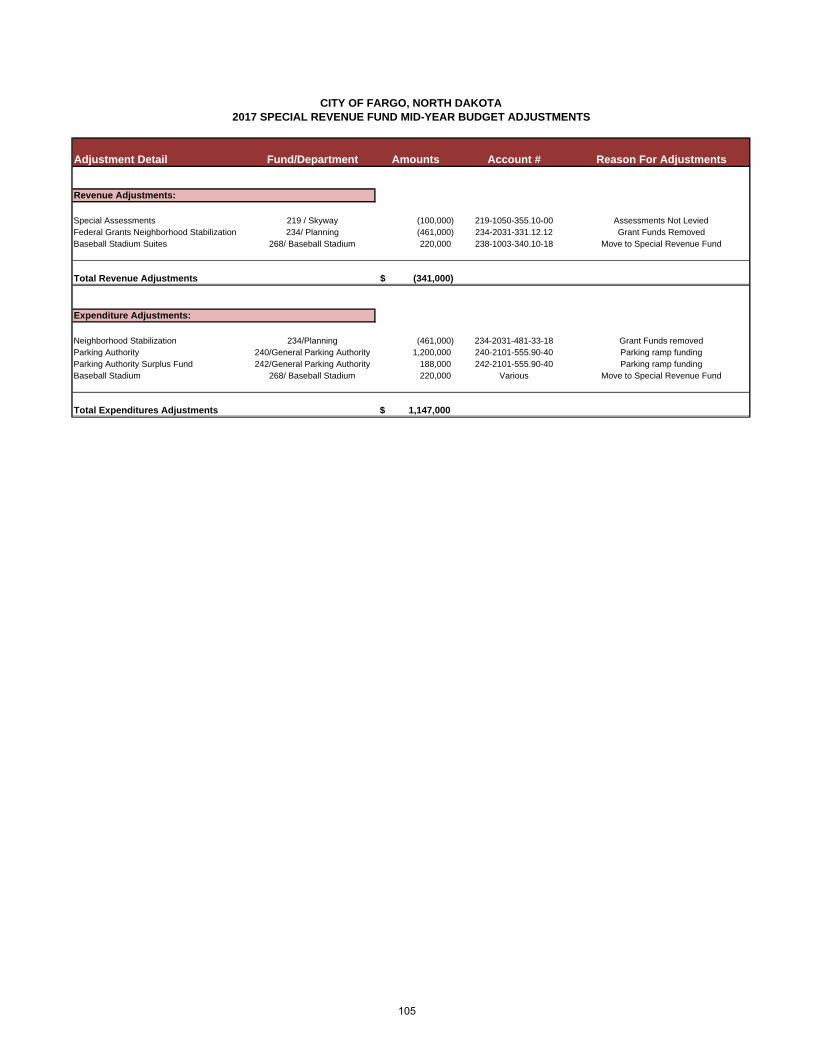
Adjustment Detail Fund/Department Amounts Account # Reason For Adjustments
Revenue Adjustments:
Special Assessments 219 / Skyway (100,000) 219-1050-355.10-00 Assessments Not LeviedFederal Grants Neighborhood Stabilization 234/ Planning (461,000) 234-2031-331.12.12 Grant Funds RemovedBaseball Stadium Suites 268/ Baseball Stadium 220,000 238-1003-340.10-18 Move to Special Revenue Fund
Total Revenue Adjustments (341,000)$
Expenditure Adjustments:
Neighborhood Stabilization 234/Planning (461,000) 234-2031-481-33-18 Grant Funds removedParking Authority 240/General Parking Authority 1,200,000 240-2101-555.90-40 Parking ramp fundingParking Authority Surplus Fund 242/General Parking Authority 188,000 242-2101-555.90-40 Parking ramp fundingBaseball Stadium 268/ Baseball Stadium 220,000 Various Move to Special Revenue Fund
Total Expenditures Adjustments 1,147,000$
CITY OF FARGO, NORTH DAKOTA2017 SPECIAL REVENUE FUND MID-YEAR BUDGET ADJUSTMENTS
105

2016 ‐ 2017Budget
2015 ‐ 2016Budget
2014 ‐ 2015Budget
REVENUESFargo Lodging Tax 1,558,755$ 1,680,000$ 1,679,699$ In‐Kind Contribution 125,000 ‐ ‐ Moorhead Lodging Tax 229,220 260,961 254,241 West Fargo Lodging Tax 118,930 144,000 60,000 Grant Income ‐ ‐ 8,000 Gift Shop Revenue 56,000 29,850 16,800 FMVG Advertising Revenue 15,000 15,000 ‐ Interest Income 7,172 10,107 8,589 Industry Partner Participation ‐ ‐ ‐ Housing Bureau Revenue 263,170 2,700 ‐ Miscellaneous 2,500 2,500 4,000 Frostival Event Revenue 24,000 ‐ ‐ TOTAL REVENUES 2,399,747 2,145,118 2,031,329
EXPENDITURESSalaries ExpendituresSalaries 640,129 634,500 546,700 Temporary Salaries 78,315 82,019 88,030 Overtime 3,600 ‐ ‐ Payroll Taxes 54,961 54,814 48,557 Retirement 19,204 18,742 16,401 Unemployment 8,285 8,285 9,532 Workers Comp 1,650 1,650 1,650 Health‐Dental Ins/Benefits 84,511 72,931 66,365 Total Salaries 890,655 872,941 777,235
2015 ‐ 2017 FM CVB OPERATING BUDGET
106

2016 ‐ 2017Budget
2015 ‐ 2016Budget
2014 ‐ 2015Budget
2015 ‐ 2017 FM CVB OPERATING BUDGET
Administration ExpendituresProfessional Fees 8,580 8,420 8,500 Accounting Services 17,520 19,200 16,490 Insurance 9,500 8,700 8,350 Postage & Shipping 22,800 23,850 26,250 Utilities 31,986 32,714 28,366 Telecommunications/PR 23,976 23,976 18,600 Office Repairs & Maintenance 2,000 2,000 1,200 Office & Clerical Supplies 9,125 9,125 9,000 Other Supplies 4,260 4,260 3,600 Maintenance Supplies 2,241 2,241 1,200 VIC Supplies 7,185 7,185 6,000 Airport Info Center 1,177 1,177 900 Scholarship 1,000 1,000 1,000 Maintenance Contracts ‐ Office & Equipment 1,000 1,000 940 Software Leases 3,192 4,164 ‐ Dues & Subscriptions 30,527 28,454 32,999 Miscellaneous 2,400 2,400 1,200 Gift Shop Merchandise 51,520 16,000 13,500 Bank & Credit Card Fees 3,000 1,800 1,200 Rent 125,000 ‐ ‐ Airfare 7,350 10,150 13,650 Lodging, Meals, Misc. 13,950 24,100 19,550 Tradeshow Expenses 16,140 13,000 5,500 Entertaining 2,400 2,400 2,400 Relationship Building ‐ ‐ ‐ Donations & Contributions 4,800 9,600 ‐ Travel ‐ Vehicle 3,960 5,460 5,340 Promotional Products 400 400 400 Registration Fees 10,219 13,179 11,225 Continuing Education ‐ 450 ‐ Staff Clothing 400 ‐ ‐ Promotional Sponsorships 32,050 48,050 44,500 Walk of Fame 1,400 2,100 2,700 Total Administration 451,058 326,555 284,560
107

2016 ‐ 2017Budget
2015 ‐ 2016Budget
2014 ‐ 2015Budget
2015 ‐ 2017 FM CVB OPERATING BUDGET
Convention Sales ExpendituresSoftware Leases & Subscriptions 13,500 19,500 9,500 Dues & Subscriptions 5,194 5,155 6,565 Miscellaneous ‐ ‐ 600 Airfare 4,100 6,560 6,640 Lodging, meals, misc. 8,650 16,531 20,700 Tradeshow Expenses 8,900 15,425 24,020 Entertaining 1,390 1,750 2,580 Relationship Building 1,140 ‐ ‐ Travel ‐ Vehicle 3,600 700 7,800 Advertising ‐ ‐ 1,250 Directories 1,135 1,375 1,325 Promotional Products 1,000 1,950 3,650 Events/Receptions 10,400 14,300 9,800 Annual Awards Event 4,500 5,000 5,000 Event Assistance 45,000 39,800 34,400 Event Hospitality 1,560 4,825 2,830 Registration Fees 5,178 7,333 5,960 Continuing Education ‐ 885 800 Staff Clothing 200 ‐ ‐ Fam Tours/Site Inspections 1,100 ‐ 2,000 Promotional Sponsorships 11,750 10,850 14,550 Total Convention Sales 128,297 151,939 159,970
Tourism Sales ExpendituresDues & Subscriptions 4,000 4,325 1,694 Miscellaneous ‐ ‐ 300 Airfare ‐ 800 4,100 Lodging, Meals, Misc. 350 1,050 7,900 Tradeshow Expenses 250 750 1,700 Entertaining 500 ‐ ‐ Relationship Building ‐ ‐ ‐ Travel ‐ Vehicle 430 ‐ 600 Advertising 500 ‐ ‐ Directories ‐ ‐ 510 Promotional Products 200 ‐ 2,800 Tour Planning Guide ‐ ‐ ‐ Events/Receptions 500 ‐ 7,600 Registration Fees ‐ 550 9,165 Continuing Education ‐ ‐ 1,000 FAM Tours/Site Inspections 6,500 8,450 ‐ Promotional Sponsorships 5,000 270 6,500 Total Tourism Sales 18,230 16,195 43,869
108

2016 ‐ 2017Budget
2015 ‐ 2016Budget
2014 ‐ 2015Budget
2015 ‐ 2017 FM CVB OPERATING BUDGET
Marketing ExpendituresMarketing Software Leases/Subscriptions 31,536 29,088 10,080 Dues & Subscriptions 1,745 380 745 Miscellaneous 1,200 1,200 1,800 Contract Labor 10,150 12,900 200 Airfare 3,550 8,450 8,300 Lodging, Meals, Miscellaneous 7,900 15,000 10,800 Entertaining 1,500 1,440 1,440 Relationship Building 600 600 ‐ Donations & Contributions 1,200 ‐ ‐ Travel‐Vehicle 1,950 2,000 1,700 Advertising 2,400 9,600 12,000 Newspaper ‐ 23,063 17,528 Magazine 55,449 79,997 100,845 Radio/TV/Cable TV 20,500 41,352 48,000 Convention Program Ads 1,235 5,590 4,150 Photography/Film 1,675 5,770 3,530 Internet Advertising 85,371 98,549 104,775 Directories 12,402 11,515 13,205 Outdoor Advertising ‐ 10,000 ‐ Promotional Products 3,300 3,500 9,200 Display Booth 400 2,150 1,500 Brochures & Guides ‐ ‐ 13,000 Frostival Annual Event Expense 14,325 ‐ ‐ Visitor Guide 72,000 70,000 60,000 Visitor Guide Distribution 8,525 13,950 17,550 City Maps 5,900 7,000 5,000 Website 58,705 2,350 11,100 Agency Fees 27,000 33,000 42,800 Registration Fees 6,010 10,220 8,900 Continuing Education 400 1,500 400 Printing ‐ Gen. & Admin 21,380 27,500 23,500 Special Promotions 10,080 20,450 18,000 Festival Marketing Assistance Program ‐ ‐ 18,000 Marketing Research 1,425 1,725 1,450 Staff Clothing 600 600 3,000 Promotional Sponsorships 2,500 6,250 9,250 Total Marketing Sales 472,913 556,689 581,748
109

2016 ‐ 2017Budget
2015 ‐ 2016Budget
2014 ‐ 2015Budget
2015 ‐ 2017 FM CVB OPERATING BUDGET
Athletic Sales ExpenditureDues & Subscriptions 2,830 2,400 2,400 Miscellaneous 10 10 ‐ Airfare 3,320 6,550 2,600 Lodging, Meals, Misc 9,175 10,700 5,000 Tradeshow Expenses 500 1,350 5,050 Entertaining 1,800 2,400 2,400 Relationship Building 780 ‐ ‐ Travel ‐ Vehicle 2,625 2,575 2,400 Promotional Products 5,200 13,100 4,900 Event Assistance 41,500 80,000 67,600 Frostival Annual Event Expense 46,000 ‐ ‐ Event Hospitality 14,500 15,300 28,000 Registration Fees 10,075 15,225 1,600 Continuing Education 1,800 2,800 600 Bid Fees ‐ 5,000 ‐ Staff Clothing 400 ‐ ‐ Fam Tours 600 600 ‐ Promotional Sponsorships 3,000 3,350 ‐ Total Athletic Sales 144,115 161,360 122,550
Housing Bureau ExpendituresHousing Bureau/Meeting Max 42,660 3,500 1,000 Housing Bureau Activity 180,850 1,550 ‐ Total Housing Bureau 223,510 5,050 1,000
Event Services ExpendituresIn Town Delivery Service 900 1,550 895 Dues & Subscriptions 365 285 485 Contract Labor 2,250 2,900 600 Airfare 650 845 1,050 Lodging, Meals, Misc 1,300 1,820 2,535 Relationship Building ‐ ‐ ‐ Travel ‐ Vehicle 650 360 640 Promotional Products 7,000 ‐ ‐ Event Assistance ‐ ‐ ‐ Event Hospitality 8,980 6,840 5,200 Banners and Supplies 13,200 12,600 7,200 Badges 33,600 30,000 24,000 Registration Fees 1,179 1,320 1,840 Continuing Education 500 250 1,000 Event Services In‐Town Meals 460 375 340 Total Event Services 71,034 59,145 45,785
TOTAL REVENUES 2,399,747$ 2,145,118$ 2,031,329$ TOTAL EXPENSES 2,399,812$ 2,149,873$ 2,016,717$
VARIANCE (65)$ (4,755)$ 14,612$
110

ACCOUNT # REVENUES2015 ‐ 2016BUDGET
2016 ‐ 2017BUDGET
400‐1000‐85 Fargo Lodging Tax 840,000$ 774,377$ 415‐1000‐85 West Fargo Lodging Tax 72,000 58,370 440‐1000‐85 Interest Income 7,277 7,277
Misc Capital ‐ ‐ TOTAL REVENUES $919,277 $840,024
EXPENDITURES170‐0000‐85 Furnishings ‐ Asset (Unknown) 3,000 3,000 175‐0000‐85 Technology Purchases ‐ Asset 6,000 16,000 180‐0000‐85 Bldg & Grounds Improv. ‐ Asset 2,000 2,000 190‐0000‐85 Vehicle ‐ Asset (trade‐in) ‐ 26,000 500‐0050‐85 Capital Grant Program 537,500 437,500 502‐1000‐85 Insurance (City Policies) 7,000 7,000 505‐1075‐85 Telecommunications Expense 2,800 3,000 505‐1085‐85 Technology Maintenance/Upgrades 182,045 105,609 506‐1000‐85 Building Repair/Maintenance/Upgrades 22,450 17,450 506‐1001‐85 Office Repair/Maintenance/Upgrades 9,200 1,200 506‐1010‐85 Grounds Maintenance 33,350 33,350 511‐1000‐85 Equipment Leases ‐ ‐ 512‐1000‐85 Maintenance Contracts ‐ Office & Equip 31,900 32,000 518‐1000‐85 Depreciation 73,200 73,200 558‐1000‐85 Real Estate Specials and Drains 5,000 5,000 632‐1000‐85 Bid Fees/Event Assistance 20,000 102,750
Future Capital Allocation Fund 60,000 ‐ TOTAL EXPENSES $995,445 $865,059
Total Revenues 919,277 840,024 Total Expenses 995,445 865,059 Variance (76,168)$ (25,035)$
* Fargo Lodging Tax based on 1/2 of 2% estimate on operating budget** West Fargo Lodging Tax based on 1/2 of 2% estimate on operating budget
2016 ‐ 2017 FMCVB CAPITAL BUDGET
111

Fund Description Fiscal Trends and Comments
Debt Service Funds are used to accumulate resources for the payment of long term debt. Financial resources are provided from various sources depending upon what type of debt is issued and what revenue streams are pledged for debt repayment. The City of Fargo has several different debt types currently outstanding and routinely issues additional bonds for infrastructure capital financing. Fargo is highly rated by Moody’s and Standard & Poor’s Corporation. Moody’s assigns an Aa1 rating for Fargo’s refunding improvement bonds while Standard & Poor’s assigns an AA‐ rating. Their credit rating reports cite strong economic data and consistently managed financial results.
Adequate financial resources are available to
pay all scheduled debt service payments and maintain the City’s bond covenant requirements.
Bond issued in 2015 that require new debt service resources include Series 2016A General Obligation Development Bonds for construction of a new City Hall and Series 2015E GO Obligations Development Parking Bonds for a downtown parking facility.
A direct bank loan that was executed in 2016 for the FM Diversion project in the amount of $100 million. This note will be paid by sales tax resources that have are currently authorized. Cass County, ND a co‐sponsor of this project borrowed an equal amount for this project.
Future debt issuance include continuation of Refunding Improvement Bonds for the growth and expansion of City infrastructure in 2017. The amount issued is dependent upon projects authorized by the City Commission and the status of their completion. We typically issue this type of debt in amounts in the $25 to $35 million range.
Tax Increment Financing District 2004‐01 Scatter Site TIF will be closed out in 2017. Tax Increment Financing District 2003‐01 Scatter Site TIF was closed out in 2016.
The City anticipates the maintenance of our existing bond ratings with Moody’s and Standard & Poor’s Corporation based upon the overall strength of our economy.
DEBT SERVICE FU
NDS
112

Approved ApprovedBudget Budget
Sources & Uses of Funds 2016 2017
Revenues:Tax Increment District Property Taxes 3,318,000$ 4,022,000$ Special Assessments Certified 22,723,000 24,750,000 Special Assessment Prepayments 3,376,650 4,950,000 Sales Taxes 26,082,000 20,148,345 Interest on Debt Service Reserves 150,000 300,000 Transfer In From General Fund for GO Debt 992,426 1,677,520 Transfer In From Special Revenue 337,800 735,635 Transfer in From Debt Service 225,000 616,800 Transfer For Sales Tax Bond Payments and Reserves 8,127,125 8,108,682
Total Revenues 65,332,001$ 65,308,982$
Expenditures & Transfers:General Obligation Bond Principal 755,000 1,601,000 General Obligation Bond Interest & Fees 407,826 1,432,555 Refunding Improvement Bond Principal 14,515,000 14,500,000 Refunding Improvement Bond Interest & Fees 12,933,383 13,412,103 Sales Tax Revenue Bond Principal 8,154,000 8,395,000 Sales Tax Revenue Bonds Interest & Fees 7,079,025 6,012,842 Tax Increment District Development Obligations 3,318,000 4,524,000 Debt Residual Expenditures - 60,000 Transfer Debt Residuals 1,450,000 1,450,000 Transfer To Debt Service Funds 8,127,125 8,725,482 Transfer Sidewalk and Sewer Assessments to Capital Project Fund 698,300 463,200 Transfer Sales Tax Surplus to Capital Project Fund 10,848,975 5,740,503
Total Expenditures & Transfers 68,286,634$ 66,316,685$
CITY OF FARGO, NORTH DAKOTAGOVERNMENTAL DEBT SERVICE FUNDS
SUMMARY BUDGET DATA
113

2017 DEBT SERVICE BUDGET
CERTIFIED UNCERTIFIED TRANSFERSPECIAL SPECIAL OTHER OTHER
BOND ISSUES FUND ASSMT. ASSMT. INTEREST FUNDS SOURCES TOTALS
Revenues:
General Debt Service 310 182,000$ 36,400$ 300,000$ -$ -$ 518,400$ 2000 SRF 342 115,000 23,000 - - - 138,000 2005 A RIB 355 1,206,000 241,200 - - - 1,447,200 2005 B RIB 356 280,000 56,000 - - - 336,000 2006 C RIB 359 250,000 50,000 - - - 300,000 2007 B RIB 360 776,000 155,200 - - - 931,200 2008 A RIB 361 1,880,000 376,000 - - - 2,256,000 2016 SERIES B Refunding RIB (2009 C RIB) 362 1,918,000 383,600 - - - 2,301,600 2009 A RIB 318 838,000 167,600 - - - 1,005,600 2010 B RIB (2014E RIB) 363 1,348,000 269,600 - - - 1,617,600 2010 C RIB 364 436,000 87,200 - - - 523,200 2011 A RIB 365 1,165,000 233,000 - - - 1,398,000 2011 B RIB 324 323,000 64,600 - - - 387,600 2011 C RIB 366 1,039,000 207,800 - - - 1,246,800 2011 D RIB 325 663,000 132,600 - - - 795,600 2011 E RIB 367 783,000 156,600 - - - 939,600 2012 SERIES A Refunding RIB 368 2,847,000 569,400 - - - 3,416,400 2013 C RIB 369 1,107,000 221,400 - - - 1,328,400 2014 D RIB 370 2,684,000 536,800 - - - 3,220,800 2014 F RIB 371 1,610,000 322,000 - - - 1,932,000 2014 G RIB Taxable 372 525,000 105,000 - - - 630,000 2015 SERIES A Refunding RIB 373 1,088,000 217,600 - - - 1,305,600 2015 D RIB 375 903,000 180,600 - - - 1,083,600 2016 RIB 326 395,000 79,000 - - - 474,000
TOTAL RIB FUND REVENUES 24,361,000$ 4,872,200$ 300,000$ -$ -$ 29,533,200$
ORIGINAL PAYING TRANSFERSBOND ISSUES FUND ISSUE PRINCIPAL INTEREST AGENT OUT TOTALS
Expenditures & Transfers :
General Debt Service 310 -$ -$ -$ -$ 1,450,000$ 1,450,000$ 2000 Storm Sewer SRF 342 1,816,295 105,000 10,875 4,600 - 120,475 2005 RIB Refunding Series (2014D) 355 12,640,000 655,000 481,650 1,800 - 1,138,450 2005 RIB Refunding Series B 356 10,675,000 370,000 22,931 1,800 - 394,731 2006 RIB Series C 359 6,465,000 850,000 18,656 1,800 - 870,456 2007 RIB Series B 360 13,045,000 470,000 404,108 1,800 - 875,908 2008 RIB Series E 361 26,285,000 810,000 1,117,970 1,800 - 1,929,770 2009 RIB Series A 318 13,190,000 1,330,000 125,963 1,800 - 1,457,763 2016 SERIES B Refunding RIB (2009 C RIB) 362 27,485,000 - 479,000 1,800 - 480,800 2010 B RIB (2014 E RIB) 363 19,440,000 695,000 605,857 1,800 - 1,302,657 2010 RIB Series C 364 8,250,000 475,000 270,550 1,800 - 747,350 2011 RIB Series A 365 19,180,000 620,000 699,838 1,800 - 1,321,638 2011 RIB Series B 324 5,430,000 165,000 190,956 1,800 - 357,756 2011 RIB Series C 366 20,965,000 545,000 669,669 1,800 - 1,216,469 2011 RIB Series D 325 10,085,000 310,000 316,181 1,800 - 627,981 2011 RIB Series E 367 9,515,000 585,000 212,808 1,800 - 799,608 2012 RIB Refunding Series A 368 34,180,000 2,355,000 967,449 1,800 - 3,324,249 2013 RIB Series C 369 16,705,000 505,000 613,498 1,800 - 1,120,298 2014 RIB Series D 370 39,760,000 1,125,000 1,601,675 1,800 - 2,728,475 2014 RIB Series F 371 40,445,000 1,065,000 1,749,675 1,800 - 2,816,475 2014 Taxable RIB Series G 372 8,355,000 245,000 297,876 1,800 - 544,676 2015 RIB Refunding A (2006B & 2007B) 373 18,250,000 470,000 738,012 1,800 - 1,209,812 2015 RIB Series B (Refunding) 374 15,325,000 - 600,312 1,800 - 602,112 2015 RIB Series D 375 34,675,000 750,000 1,172,394 1,800 - 1,924,194
TOTAL EXPENDITURES & TRANSFERS 14,500,000$ 13,367,903$ 44,200$ 1,450,000$ 29,362,103$
CITY OF FARGO, NORTH DAKOTA
REFUNDING IMPROVEMENT (SPECIAL ASSESSMENT) BONDS
114

2017 DEBT SERVICE BUDGET
SALES TAX TRANSFERBOND FUNDS: FUND COLLECTIONS IN TOTALS
REVENUES
CFP FLOOD SALES TAX REVENUE BONDS 603 6,716,115$ -$ 6,716,115$ SRF UTILITY WATER PROJECTS BONDS 607 6,716,115 - 6,716,115 SRF UTILITY WASTEWATER PROJECTS BONDS 608 6,716,115 - 6,716,115
TOTAL SALES TAX COLLECTIONS 20,148,345$ -$ 20,148,345$
ORIGINAL FY FY STATE PAYING TRANSFERBOND ISSUES OUTSTANDING: FUND ISSUANCE PRINCIPAL INTEREST ADMIN. FEE AGENT OUT TOTALS
EXPENDITURES & TRANSFERS4
CFP FLOOD SALES TAX REVENUE BOND 603 - - - - 416,955$ 416,955$ SRF UTILITY PROJECTS WATER BONDS 607 - - - - 3,734,033 3,734,033 SRF UTILITY PROJECTS WASTEWATER BONDS 608 - - - - 1,589,515 1,589,515
CFP SALES TAX REVENUE BONDS: SERIES 2013A 603 51,375,000 1,960,000 1,755,550 - 1,800 - 3,717,350 SERIES 2014B 603 32,512,000 1,320,000 1,260,010 - 1,800 - 2,581,810
TOTAL FLOOD CONTROL SALES TAX BONDS 83,887,000 3,280,000 3,015,560 - 3,600 - 6,299,160
SRF NOTES: (UTILITY INFRASTRUCTURE)SALES TAX REVENUE BONDS, SERIES 2008A 630 63,725,000 3,220,000 1,218,875 235,725 1,800 - 4,676,400 SALES TAX REVENUE BONDS, SERIES 2008B 610 29,240,000 1,460,000 634,782 108,900 1,800 - 2,205,482 SALES TAX REVENUE BONDS, SERIES 2008C 632 1,630,000 85,000 29,500 5,900 1,800 - 122,200 SALES TAX REVENUE BONDS, SERIES 2008D 612 2,270,000 125,000 40,000 8,000 1,800 - 174,800 SALES TAX REVENUE BONDS, SERIES 2010A 634 699,374 40,000 2,675 2,675 1,800 - 47,150 SALES TAX REVENUE BONDS, SERIES 2010D 636 3,651,075 185,000 78,375 15,675 1,800 - 280,850 SALES TAX REVENUE BONDS, SERIES 2013B 614 66,352,000 - 600,000 - 1,800 - 601,800
TOTAL SRF SALES TAX BONDS 167,567,449 5,115,000 2,604,207 376,875 12,600 - 8,108,682
TOTAL SALES TAX OBLIGATIONS 251,454,449$ 8,395,000$ 5,619,767$ 376,875$ 16,200$ 2,006,470$ 20,148,345$
DEBTCOVERAGE
REVENUE BOND DEBT SERVICE COVERAGE RATIOS: %
CFP SALES TAX REVENUE BONDS (3 issues) Flood Control 107%
SRF SALES TAX REVENUE WATER (3 issues) Water 225%
SRF SALES TAX REVENUE WASTEWATER (4 issues) Wastewater 131%
FINANCING RESERVE RESERVERESERVE BALANCE DEPOSIT BALANCE
REVENUE BOND RESERVE REQUIREMENTS: REQUIRED 1/1/2017 DEPOSITS NO. 12/31/2017
SALES TAX REVENUE BONDS, SERIES 2008A 631 Wastewater 4,442,000$ 4,442,000$ - 5 of 5 4,442,000
SALES TAX REVENUE BONDS, SERIES 2008B 611 Water 2,094,826 2,094,826 - 5 of 5 2,094,826
SALES TAX REVENUE BONDS, SERIES 2008C 633 Wastewater 118,375 118,375 - 5 of 5 118,375
SALES TAX REVENUE BONDS, SERIES 2008D 613 Water 173,250 173,250 - 5 of 5 173,250
SALES TAX REVENUE BONDS, SERIES 2010A 635 Wastewater 47,794 47,794 - 5 of 5 47,794
SALES TAX REVENUE BONDS, SERIES 2010D 637 Wastewater 281,875 281,875 - 5 of 5 281,875
SALES TAX REVENUE BONDS, SERIES 2013B 615 Water 4,248,300 - - 1 of 5 -
STATUS OF BOND RESERVE FUNDING 11,406,420$ 7,158,120$ -$ 7,158,120$
CITY OF FARGO, NORTH DAKOTA
SALES TAX REVENUE BONDS (SALES TAX BACKED)
115

CERTIFIED UNCERTIFIED OTHER TRANSFEROther Obligations FUND SPECIALS SPECIALS SOURCES IN TOTALS
Revenues:
2006-2015 Sidewalk 379 170,000$ 34,000$ -$ -$ 204,000$ General Sewer 388 219,000 43,800 - - 262,800
2009 G.O. Development Revenue Bonds 384 - - - 192,407 192,407 2014 US Bank Direct Loan (Public Health Building) 390 - - - 616,800 616,800 2015 G.O. Development Bond, Series E (Parking) 376 - - - 735,635 735,635 2016 G.O. Development Bond, Series A (City Hall) 396 - - - 1,260,313 1,260,313 2016 Fire Station Remodel Borrowing 391 - - - 224,800 224,800
TOTAL REVENUES 389,000$ 77,800$ -$ 3,029,955$ 3,496,755$
PAYING TRANSFERBOND ISSUES FUND PRINCIPAL INTEREST /FISCAL OUT TOTALSExpenditures & Transfers:
2006-2015 Sidewalk 379 -$ -$ 1,800$ 202,200$ 204,000$ General Sewer 388 - - 1,800 261,000 262,800
2009 G.O. Development Bonds (Fire Station #7) 384 125,000 65,607 1,800 - 192,407 2014 US Bank Direct Loan (Public Health Building) 390 565,000 50,000 1,800 - 616,800 2015 G.O. Development Bond, Series E (Parking) 376 430,000 303,835 1,800 - 735,635 2016 G.O. Development Bond, Series A (City Hall) 396 375,000 883,513 1,800 - 1,260,313 2016 Fire Station Remodel Borrowing 391 106,000 117,000 1,800 - 224,800
TOTAL EXPENDITURES & TRANSFERS 1,601,000$ 1,419,955$ 12,600$ 463,200$ 3,496,755$
CITY OF FARGO, NORTH DAKOTAOTHER GOVERNMENTAL DEBT
116

YEAR MATURITY PROPERTYTAX INCREMENT DISTRICTS STARTED DATE TAXES
Revenues:
C-1 TAX INCREMENT 285,000$ GREAT NORTHERN DEPOT 16,000 TAX INCREMENT 2001-01 ( MATRIX) 2001 2017 2,338,000 TAX INCREMENT 2002-01 ( ND HORSEPARK) 2002 NA 57,000 TAX INCREMENT 2005-01 ( FAYLAND) 2005 2020 759,000 TAX INCREMENT 2006-01 (BRISTOL ON BDWY) 2006 2021 91,000 TAX INCREMENT 2006-02 (JPR 19TH AVE NO.) 2006 2021 211,000 TAX INCREMENT 2007-01 (FM DEVELOPMENT PHASE I) 2007 2022 37,000 TAX INCREMENT 2007-02 (FEDER 12TH AVE N) 2007 2022 31,000 TAX INCREMENT 2008-01 (FM DEVELOPMENT II) 2008 2023 59,000 TAX INCREMENT 2011-01 (SHOTWELL) 2011 2026 79,000 TAX INCREMENT 2012-01 (914 LLC) 2012 36,000 TAX INCREMENT (710 LOFTS) 2016 2,000 TAX INCREMENT (BUTLER BUSINESS PARK) 2016 21,000
TOTAL TAX INCREMENT REVENUES 4,022,000$
PAYMENT OF TAX INCREMENT DISTRICTS OBLIGATIONS
Expenditures & Transfers :
C-1 TAX INCREMENT 787,000$ GREAT NORTHERN DEPOT 16,000 TAX INCREMENT 2001-01 ( MATRIX) 2001 2017 2,338,000 TAX INCREMENT 2002-01 ( ND HORSEPARK) 2002 NA 57,000 TAX INCREMENT 2005-01 ( FAYLAND) 2005 2020 759,000 TAX INCREMENT 2006-01 (BRISTOL ON BDWY) 2006 2021 91,000 TAX INCREMENT 2006-02 (JPR 19TH AVE NO.) 2006 2021 211,000 TAX INCREMENT 2007-01 (FM DEVELOPMENT PHASE I) 2007 2022 37,000 TAX INCREMENT 2007-02 (FEDER 12TH AVE N) 2007 2022 31,000 TAX INCREMENT 2008-01 (FM DEVELOPMENT II) 2008 2023 59,000 TAX INCREMENT 2011-01 (SHOTWELL) 2011 2026 79,000 TAX INCREMENT 2012-01 (914 LLC) 2012 36,000 TAX INCREMENT (710 LOFTS) 2016 2,000 TAX INCREMENT (BUTLER BUSINESS PARK) 2016 21,000
TOTAL EXPENDITURES & TRANSFERS 4,524,000$
CITY OF FARGO, NORTH DAKOTATAX INCREMENT FINANCING DISTRICT OBLIGATIONS
117

Adjustment Detail Fund/Department Amounts Account # Reason For Adjustments
Special Assessment Collections RIB Debt Service Revenue 6,000,000 various Estimated PrepaymentsSales Tax CFP Flood Sales Tax Revenue Bonds (6,520,500) 603-8502-313.10-00 Reallocation of Sales Tax
Total Debt Service Fund Revenues (520,500)$
Expenditure Adjustments:
Early Redemption Bond Principal RIB Fund 324 3,395,000 324-8502-520-80-10 RIB debt defeasanceEarly Redemption Bond Principal RIB Fund 325 9,200,000 325-8502-520-80-10 RIB debt defeasance
Total Debt Service Fund Expenditures 12,595,000$
CITY OF FARGO, NORTH DAKOTA2017 DEBT SERVICE FUNDS MID-YEAR BUDGET ADJUSTMENT
Revenue Adjustments:
118

Fund Description and Purpose Fiscal Trends and Comments
Capital Project funds are used to account for ongoing investment in municipal capital assets. Currently, the State of North Dakota’s budget law does not require a budget for capital project funds, and therefore none is presented. Fargo is a large regional economic center that requires quality infrastructure. Continued and systematic expansion of the City creates the need for extended collector roadways, local neighborhood streets, bridges, flood control assets, sanitary sewer, storm sewer, and water and wastewater infrastructure. As a result of continued need for infrastructure, voters have approved a local sales tax to help fund these expensive projects. Sales taxes are our largest single revenue source. A formalized and long term capital improvement plan that spans a twenty‐year planning horizon is updated annually for all municipal utility assets to include water and wastewater systems. A master planning effort links the needs of critical infrastructure projects to funding sources. Projects related to the utility master plan are incorporated into the budget approval process. General infrastructure planning for streets & roadways, subdivision underground utilities, pavement management, sidewalk construction, flood control projects, and other non utility projects are administered by the City Engineering Department. A capital improvement plan is prepared annually at year‐end which provides authorization to proceed with the subsequent year’s construction season. All assets in excess of $5,000 with an expected life of at least two years are capitalized and reported in the annual financial statements.
Demand for expansion of new housing
subdivisions is strong. Single family building permits exceed last year’s levels by about 50%.
A single largest capital project in process the expansion of our water treatment plant. The expansion will increase our capacity to 45 mgd and will be capable of removing sulphate from Devils Lake discharges into the Sheyenne River. This includes actual plant expansion and work on the Sheyenne River pumping station.
Work continues on a multi‐year flood control capital improvement plan to raise our flood levees to a higher level and seek a permanent long term solution to protecting ourselves from flooding. Funds will be allocated for home removals and raising protection levels along the Red River Corridor when the Engineering Department’s capital improvement plan is approved in December.
The FM Diversion project has been approved by the Army Corp. of Engineers. Work will progress on this project later this fall. Voters will be asked to extent sales tax authorization in Fargo and Cass County to fund this project on a long term basis. This is a large flood control project that will take several years to construct.
CAPITAL PROJECT FU
NDS
119

Fund Description Fiscal Trends and Comments
The City of Fargo operates ten Enterprise Funds to provide traditional municipal utility services to our citizens. There are approximately 30,000 customers serviced in our municipal utility services. They include Water, Wastewater, Solid Waste, Forestry, Street Lighting, Storm Sewer, Vector Control, Southeast Cass Sewer, Municipal Airport and the FargoDome. The Water fund is the largest municipal utility and is shown as a major fund in this budget document. Enterprise funds are operated on a business‐like basis and each fund carries all assets within the fund with final measurement of net assets. Utility rates are monitored annually and set by resolution of the Board of City Commissioners.
Forestry and Landfill rates will be increased in 2017.
Fargo became a regional water services provide under contract with the City of West Fargo beginning in June, 2016.
A recent comparison of Fargo’s utility bill for an
average household for water, wastewater and storm sewer fees showed that Fargo’s fees were 13% lower per month than the average in North Dakota.
Local sales tax revenues are used to pay for capital projects associated with utility infrastructure and, as a result, Fargo has been able to keep utility rates constant for the past several years.
A twenty‐year capital improvement plan and related revenue adequacy model is updated annually to assure that there will be adequate resources to provide high quality utility services. This includes rate revenue as well as sales tax revenue for capital programming.
A water treatment plant expansion is currently underway that will increase Fargo’s treatment and distribution capacity to 45 mgd.
Wastewater reuse is currently utilized and this byproduct is sold for the production of ethanol in a nearby community
Water Revenue Bonds Series 1997 will be paid off in 2017.
The Fargodome long‐term capital escrow fund balance is currently $33.6 million. This is reserved for the long term care and maintenance of the Dome.
The Fargodome is currently upgrading its video technology in 2016 at a cost of $8 million.
PROPRIETARY
FUNDS
120
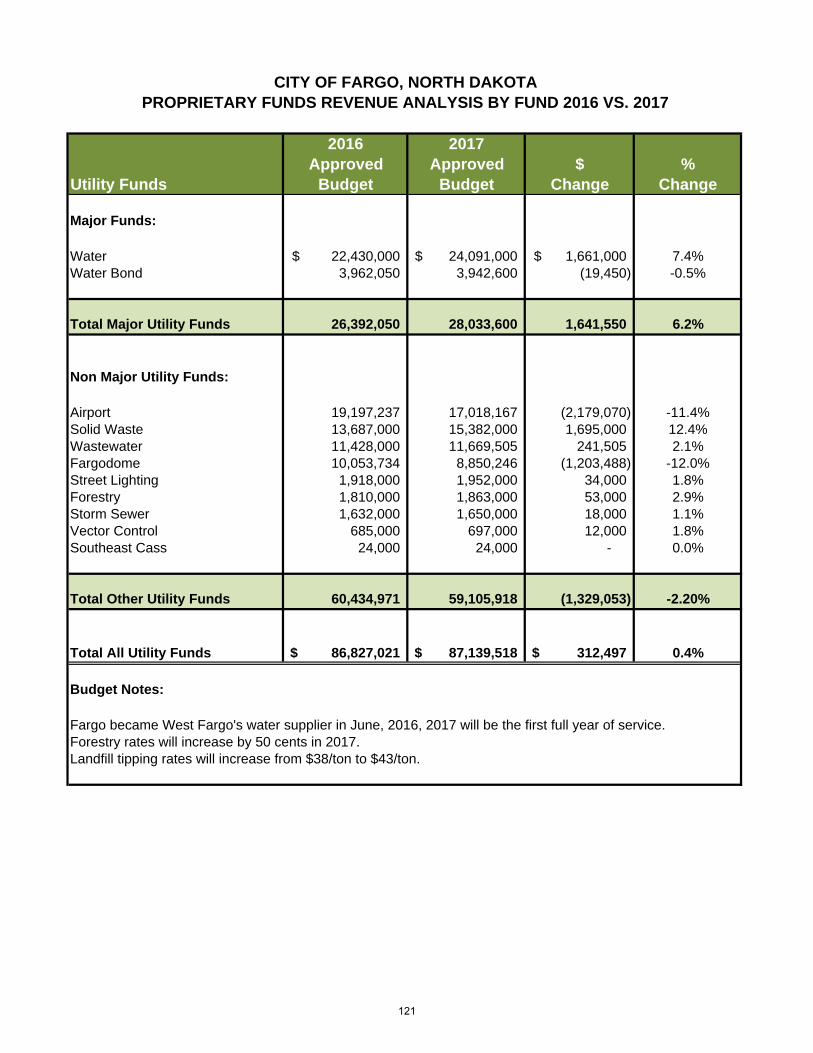
2016 2017Approved Approved $ %
Utility Funds Budget Budget Change Change
Major Funds:
Water 22,430,000$ 24,091,000$ 1,661,000$ 7.4%Water Bond 3,962,050 3,942,600 (19,450) -0.5%
Total Major Utility Funds 26,392,050 28,033,600 1,641,550 6.2%
Non Major Utility Funds:
Airport 19,197,237 17,018,167 (2,179,070) -11.4%Solid Waste 13,687,000 15,382,000 1,695,000 12.4%Wastewater 11,428,000 11,669,505 241,505 2.1%Fargodome 10,053,734 8,850,246 (1,203,488) -12.0%Street Lighting 1,918,000 1,952,000 34,000 1.8%Forestry 1,810,000 1,863,000 53,000 2.9%Storm Sewer 1,632,000 1,650,000 18,000 1.1%Vector Control 685,000 697,000 12,000 1.8%Southeast Cass 24,000 24,000 - 0.0%
Total Other Utility Funds 60,434,971 59,105,918 (1,329,053) -2.20%
Total All Utility Funds 86,827,021$ 87,139,518$ 312,497$ 0.4%
Budget Notes:
Fargo became West Fargo's water supplier in June, 2016, 2017 will be the first full year of service.Forestry rates will increase by 50 cents in 2017.Landfill tipping rates will increase from $38/ton to $43/ton.
CITY OF FARGO, NORTH DAKOTAPROPRIETARY FUNDS REVENUE ANALYSIS BY FUND 2016 VS. 2017
121

2016 2017Approved Approved $ %
Utility Funds Budget Budget Change Change
Major Fund:
Water 22,224,053$ 24,642,832$ 2,418,779$ 10.9%Water Bond 3,949,212 3,942,600 (6,612) -0.2%
Total Major Utility Fund 26,173,265 28,585,432 2,412,167 9.2%
Other Utility Funds:
Airport 19,835,594 18,610,992 (1,224,602) -6.2%Solid Waste 14,156,000 16,490,425 2,334,425 16.5%Wastewater 9,647,771 10,574,440 926,669 9.6%Fargodome 9,872,014 8,461,473 (1,410,541) -14.3%Street Lighting 1,889,000 1,962,005 73,005 3.9%Forestry 1,978,000 2,051,327 73,327 3.7%Storm Sewer 1,511,000 1,685,005 174,005 11.5%Vector Control 748,000 756,500 8,500 1.1%Southeast Cass 49,000 48,700 (300) -0.6%
Total Other Utility Funds 59,686,379 60,640,867 954,488 1.6%
Total All Utility Funds 85,859,644$ 89,226,299$ 3,366,655$ 3.9%
CITY OF FARGO, NORTH DAKOTAPROPRIETARY FUNDS EXPENDITURE ANALYSIS BY FUND 2016 VS. 2017
122

2016 2017Approved Approved %
Expense Category Budget Budget Change Change
Salaries 12,712,971$ 12,605,129$ (107,842) -0.8%Benefits 3,495,540 3,814,642 319,102 9.1%Other Services 7,038,515 10,416,218 3,377,703 48.0%Repairs and Maintenance 2,688,100 3,008,850 320,750 11.9%Rentals/ Leases 1,139,408 1,446,008 306,600 26.9%Insurance 614,453 610,853 (3,600) -0.6%Communications 86,675 87,475 800 0.9%Advertising / Printing 567,729 332,211 (235,518) -41.5%Travel / Education / Dues 350,905 364,370 13,465 3.8%Energy 4,985,825 5,852,297 866,472 17.4%General Supplies 1,389,951 1,507,751 117,800 8.5%Miscellaneous 5,646,501 3,513,063 (2,133,438) -37.8%Capital Outlay 19,380,587 16,948,010 (2,432,577) -12.6%Debt Service 6,228,434 6,451,822 223,388 3.6%Transfers To Other Funds 19,534,050 22,267,600 2,733,550 14.0%
Totals 85,859,644$ 89,226,299$ 3,366,655$ 3.9%
CITY OF FARGO, NORTH DAKOTAPROPRIETARY FUNDS EXPENSE ANALYSIS BY COST CATEGORY (ALL FUNDS)
2016 vs. 2017
123

2016 2017Approved Approved $ %
Fund Budget Budget Change Change
Operation & Maintenance 4,809,144$ 5,347,737$ 538,593$ 11.2%Construction 15,026,450 10,563,255 (4,463,195) -29.7%Passenger Facility Surcharge - 2,700,000 2,700,000 0.0%
Totals 19,835,594$ 18,610,992$ (1,224,602)$ -6.2%
CITY OF FARGO, NORTH DAKOTAMUNICIPAL AIRPORT AUTHORITY2016 VS. 2017 SUMMARY BUDGET
124

Description of Service Provided Current or Emerging Issues
The Water Treatment Plant is responsible for operating and maintaining a state‐of‐the‐art 30 million gallons per day (MGD) surface water treatment plant and all reserve storage facilities that supplement the City's water distribution system. The reserve storage facilities include 11 elevated storage tanks and 2 ground storage reservoirs and pumping stations with a total capacity of 20 million gallons. The water treatment plant supplies safe drinking water to the City of Fargo, portions of the Cass Rural Water Users District (consecutive user), and as of June 1, 2016, the City of West Fargo. The City's surface water treatment plant utilizes water from the Red and Sheyenne Rivers. River water is delivered to the WTP through pumping stations located on both the Red and Sheyenne Rivers. At the WTP, the water goes through a series of treatment processes including pretreatment, lime and soda ash softening, ozone disinfection and filtration. Following treatment, the finished water is pumped through the City's water distribution system to meet the daily and peak demand of consumers.
In 2015, the City began construction on a WTP expansion project. The project will involve installation of a parallel membrane treatment system which will expand the overall treatment capacity to 45 MGD. The new treatment system will include pretreatment, MF/UF (micro/ultra filtration) membranes, RO (reverse osmosis) membranes and disinfection. The capital expense associated with the WTP expansion will be financed with infrastructure sales tax and ND State Water Commission grant funds. With West Fargo, the 2017 budget has been increased to account the additional requirements for water production and pumping. The total increase in the proposed Division 3051 Water Treatment budget is consistent with predicted O&M cost increase to serve West Fargo during planning. An increase sludge disposal costs also resulted in an increase in 2017 expenses. However, the additional revenue from West Fargo exceeds increases in expenses and will help stabilize water rates to Fargo customers. With West Fargo as a customer, there are regionalization‐related capital projects being constructed, including two West Fargo booster pump stations and Sheyenne pump station improvements. The Water Utility is anticipating the use of infrastructure sales tax funds to cover these costs and has secured grant funds with the State Water Commission to assist in this effort (60% Cost‐Share).
Operational Measures
Description 2015 Actual 2016 Expected 2017 Projected
Average Day Demand 11,400,000 gallons 13,200,000 gallons 14,400,000 gallons Peak Day Demand 18,000,000 gallons 29,500,000 gallons 29,500,000 gallons Total Water Produced 4,200,000,000 gallons 4,700,000,000 gallons 5,100,000,000 gallons Consecutive User Demand
119,500,000 gallons 758,300,000 gallons 1,079,400,000 gallons
Water Meter Count 28,806 29,200 29,500 WTP Expansion 15% Complete 45% Complete 80% Complete Sheyenne Pump Station NA 5% Complete 50% Complete
Water Treatmen
t
125

2016 2016 20172015 Approved Revised Approved
Expenditures Actual Budget Budget BudgetSalaries 1,704,709$ 1,765,023$ 1,738,396$ 1,767,072$ Benefits 578,611 662,041 661,218 709,986 Other Services 868,006 1,014,776 1,014,776 1,764,776 Repairs and Maintenance 185,120 139,000 139,000 189,500 Rentals 4,353 7,000 7,000 7,000 Insurance 47,904 61,390 61,390 61,390 Communications 13,261 15,300 15,300 13,800 Advertising and Printing 12,215 16,500 16,500 14,000 Travel & Education 29,332 134,500 134,500 134,000 Energy 905,252 1,030,500 1,001,752 1,135,500 General Supplies 257,077 258,500 258,500 255,000 Major Supplies 1,702,311 2,500,000 2,500,000 2,600,000 Miscellaneous 20,181 18,500 18,500 18,500 Capital Outlay 190,538 235,300 235,300 228,700 Debt Service ‐ ‐ ‐ ‐ Transfers 8,554,032 10,950,050 10,950,050 11,717,600
TOTAL 15,072,902$ 18,808,380$ 18,752,182$ 20,616,824$
Authorized Positions2015Actual
2016Approved
2016Revised
2017Approved
Full Time Employees 27 27 27 28 Part Time Benefited ‐ ‐ ‐ ‐ Contracted Employees 1 1 1 1
TOTAL 28 28 28 29
Water Treatment
126

Description of Service Provided Current or Emerging Issues
The Mains and Hydrants Department provides a wide range of services essential to the public which can vary from fire hydrant repair to repair of broken water mains and even assisting with flood/snow events. The major services delivered include:
Repair of Water Main Failures Fire Hydrant Maintenance Program Water Main Valve Exercising Program Water Main Valve Maintenance Street Patch Repair Water Service Inspection New Construction/Rehab Inspection Boulevard Restoration and Repair Water Service Repairs Water Main & Service Locations Water Main Tapping Service Assisting other Departments
Frozen water services continue to be an
issue in the winter requiring a combination of mechanical thawing and physically digging the service to repair. As time allows, the department has been lowering high priority water services to prevent freezing in the future.
With aging infrastructure, the water main gate turning program is growing in importance, and is requiring more staff attention. The program is a proactive approach to maintaining water distribution condition.
The department continues to work on utilizing technology to better manage our assets. CityWorks has been implemented and is being utilized for asset management. In addition, leak detection is becoming more proficient with newly purchased leak detection equipment.
Midcontinent Communications started infrastructure expansion in 2014 and continues expanding services to Fargo. They have a three year plan to cover the entire city. The expansion has greatly increased water main locates within the department.
Operational Measures
Description 2015 Actual 2016 Expected 2017 Projected
Water Main Breaks 38 44 49 Service 132 144 155 Water Main Valves Repaired 30 31 32 Water Main Taps 121 120 118 Hydrant Repair/Replaced 136 120 104 Water Service Inspections 642 641 640 Water Main Gates Exercised 210 600 650
Water M
ains & Hydrant
127

2016 2016 20172015 Approved Revised Approved
Expenditures Actual Budget Budget BudgetSalaries 593,665$ 781,900$ 772,359$ 758,607$ Benefits 233,773 285,156 286,427 272,747 Other Services 128,121 146,500 146,500 146,500 Repairs and Maintenance 31,373 47,800 47,800 47,800 Rentals 24,765 26,500 26,500 101,500 Insurance ‐ ‐ ‐ ‐ Communications 3,339 4,200 4,200 5,200 Advertising and Printing 131 1,175 1,175 1,175 Travel & Education 8,710 13,800 13,800 14,800 Energy 40,622 70,069 33,066 74,069 General Supplies 167,927 110,900 110,900 130,900 Major Supplies 108,393 149,500 149,500 139,500 Miscellaneous 8,884 8,000 8,000 8,612 Capital Outlay 186,192 179,500 250,500 214,500 Debt Service ‐ ‐ ‐ ‐ Transfers ‐ ‐ ‐ ‐
TOTAL 1,535,895$ 1,825,000$ 1,850,727$ 1,915,910$
Authorized Positions2015Actual
2016Approved
2016Revised
2017Approved
Full Time Employees 11 12 12 12 Part Time Benefited ‐ ‐ ‐ ‐ Contracted Employees ‐ ‐ ‐ ‐
TOTAL 11 12 12 12
Water Mains & Hydrants
128

Description of Service Provided Current or Emerging Issues
The Water Meters division is responsible for procuring and installing all public water meters in the City of Fargo ranging in size from 5/8‐inches to 10‐inches. The division is also responsible for the replacement, calibration and maintenance of all public water meters in the City. At the request of the Auditor's office, the division conducts all water service shut‐off or turn‐on activities. At the request of the Auditor's office, the division assists with gathering monthly meter reading data for billing purposes. The meter count at the end of 2015 was as follows: Meter Size Count
5/8 13,547 3/4 11,779 1 801 1‐1/2 1,217 2 1,103 3 245 4 82 6 19 8 3 10 10 TOTAL 28,806
The Water Meters division currently obtains (reads) individual monthly meter data via manual reads, handheld touch pad devices or mobile radio devices. At this time, the meter reading technology distribution is as follows: Manual Read Meters 3 Touch Pad Read Meters 19,409 Mobile Read Meters 9,397 The meters division has been researching/evaluating newer technology for obtaining monthly meter data. The newer technology is referred to as fixed network where all meter data can be obtained from a central location. The division is researching a migrate‐able system to allow continued use of the City's existing radio read meters.
Operational Measures
Description 2015 Actual 2016 Expected 2017 Projected
New Meters 300 300 300 Meters Replaced 12 15 15 Registers Replaced 133 135 135 R900’s Replaced 22 20 20 Frozen Meters 41 40 40 Total Meter Count 28,806 29,200 29,500
Water M
eters
129

2016 2016 20172015 Approved Revised Approved
Expenditures Actual Budget Budget BudgetSalaries 347,545$ 352,644$ 356,335$ 364,508$ Benefits 113,979 119,519 121,903 148,585 Other Services 8,402 10,000 10,000 10,000 Repairs and Maintenance 21,709 25,700 25,700 26,100 Rentals 29,900 27,600 27,600 27,600 Insurance ‐ ‐ ‐ ‐ Communications 1,563 1,755 1,755 1,755 Advertising and Printing 272 400 400 550 Travel & Education ‐ ‐ ‐ ‐ Energy 14,403 18,700 14,916 15,500 General Supplies 5,223 6,250 6,250 6,050 Major Supplies ‐ ‐ ‐ ‐ Miscellaneous 2,130 1,550 1,550 2,400 Capital Outlay 225,538 175,000 175,000 180,000 Debt Service ‐ ‐ ‐ ‐ Transfers ‐ ‐ ‐ ‐
TOTAL 770,664$ 739,118$ 741,409$ 783,048$
Authorized Positions2015Actual
2016Approved
2016Revised
2017Approved
Full Time Employees 5 5 5 5 Part Time Benefited ‐ ‐ ‐ ‐ Contracted Employees 2 2 2 2
TOTAL 7 7 7 7
Water Meters
130

Description of Service Provided Current or Emerging Issues
Utility Billing Services provides administration, analysis, and payment processing services for the city’s utility bills.
Water Meter Reading & Analysis Utility Bill Account Assessment and
Production
The 2017 budget reclassified three FTE’s
from the Auditors office to Utility Billing Services, since this is a direct service.
There is significant, steady growth in the use of automatic payments and manual electronic payments.
In 2016, we deployed an online form for
starting or ending utility bill service that is available for residents 24 hours a day, enabling resident maximum flexibility to contact the City with service changes, versus needing to contact the office during business hours.
Operational Measures
Description 2015 Actual 2016 Expected 2017 Projected
Utility Accounts Active 29,981 30,560 31,360 Utility Phone Calls 44,538 45,000 46,000 Internet & IVR Payments 68,335 80,848 97,500 Utility ACH & Auto pay 137,945 130,736 128,957 Mail Utility Payments 116,662 114,024 110,124
Utility
Billing Services
131

2016 2016 20172015 Approved Revised Approved
Expenditures Actual Budget Budget BudgetSalaries ‐$ ‐$ ‐$ 148,634$ Benefits ‐ ‐ ‐ 57,861 Other Services ‐ ‐ ‐ 346,000 Repairs and Maintenance ‐ ‐ ‐ 1,000 Rentals ‐ ‐ ‐ ‐ Insurance ‐ ‐ ‐ ‐ Communications ‐ ‐ ‐ ‐ Advertising and Printing ‐ ‐ ‐ ‐ Travel & Education ‐ ‐ ‐ ‐ Energy ‐ ‐ ‐ ‐ General Supplies ‐ ‐ ‐ 2,000 Major Supplies ‐ ‐ ‐ ‐ Miscellaneous ‐ ‐ ‐ 2,000 Capital Outlay ‐ ‐ ‐ 3,000 Debt Service ‐ ‐ ‐ ‐ Transfers ‐ ‐ ‐ ‐
TOTAL ‐$ ‐$ ‐$ 560,495$
Authorized Positions2015Actual
2016Approved
2016Revised
2017Approved
Full Time Employees ‐ ‐ ‐ 3 Part Time Benefited ‐ ‐ ‐ ‐ Contracted Employees ‐ ‐ ‐ ‐
TOTAL ‐ ‐ ‐ 3
Utility Billing Services
132

2016 2016 20172015 Approved Revised Approved
Expenditures Actual Budget Budget BudgetSalaries ‐$ ‐$ ‐$ ‐$ Benefits ‐ ‐ ‐ ‐ Other Services 868,033 759,447 759,447 674,447 Repairs and Maintenance ‐ ‐ ‐ ‐ Rentals ‐ ‐ ‐ ‐ Insurance 36,020 31,608 31,608 31,608 Communications ‐ ‐ ‐ ‐ Advertising and Printing ‐ ‐ ‐ ‐ Travel & Education ‐ ‐ ‐ ‐ Energy ‐ ‐ ‐ ‐ General Supplies ‐ ‐ ‐ ‐ Major Supplies ‐ ‐ ‐ ‐ Miscellaneous 8,336 12,000 12,000 12,000 Capital Outlay 3,857,416 ‐ ‐ ‐ Debt Service 26,541 48,500 48,500 48,500 Transfers ‐ ‐ ‐ ‐
TOTAL 4,796,346$ 851,555$ 851,555$ 766,555$
Water Operating
133

Description of Service Provided Current or Emerging Issues
Water revenue bonds have been issued to pay for the water treatment plant built in 1992. Pursuant to the bond resolution, a bond fund has been established to pay for the long‐term debt outstanding. Bonds were issued in 1992 and were refinanced in 2007. They have a final maturity date of 1/1/2017. All bonds from this series are non‐callable bonds and will be paid in accordance with the existing debt service schedule.
Construction of an expanded water treatment facility began in 2015. This project will be funded by North Dakota State Water Commission appropriations and the local share will be financed with the issuance of State Revolving Fund loans repaid with infrastructure sales tax. The expanded plant will increase Fargo’s water treatment capacity to 45 mgd and sulphate removal equipment will be installed.
Water Reven
ue Bon
d
134

2016 2016 20172015 Approved Revised Approved
Expenditures Actual Budget Budget BudgetSalaries ‐$ ‐$ ‐$ ‐$ Benefits ‐ ‐ ‐ ‐ Other Services ‐ ‐ ‐ ‐ Repairs and Maintenance
Rentals ‐ ‐ ‐ ‐ Insurance ‐ ‐ ‐ ‐ Communications ‐ ‐ ‐ ‐ Advertising and Printing ‐ ‐ ‐ ‐ Travel & Education ‐ ‐ ‐ ‐ Energy ‐ ‐ ‐ ‐ General Supplies ‐ ‐ ‐ ‐ Major Supplies ‐ ‐ ‐ ‐ Miscellaneous ‐ ‐ ‐ ‐ Capital Outlay ‐ ‐ ‐ ‐ Debt Service 413,609 3,949,212 3,949,212 3,942,600 Transfers ‐ ‐ ‐ ‐
TOTAL 413,609$ 3,949,212$ 3,949,212$ 3,942,600$
Water Revenue Bond
135

Description of Service Provided Current or Emerging Issues
The Wastewater Treatment Plant (WWTP) is responsible for the treatment of wastewater before it can be discharged into the Red River. The WWTP has the capacity to treat an average daily flow (ADF) of 17.5 million gallons per day (MGD). In 2015, the ADF was 12.2083 MGD resulting in a total of 4.456 billion gallons of treated. The WWTP recorded a one‐day peak flow of 22.773 MG. The WWTP employs a mechanical and biological process creating a high quality effluent that is discharged to the Red River after meeting strict regulatory standards. Biosolids (solids) accumulated and generated in the wastewater process are treated (stabilized) using a biological process known as anaerobic digestion. One of the beneficial byproducts of the digestion process is methane biogas. This biogas is used to heat WWTP buildings in the winter months. Stabilized biosolids are then dewatered using drying beds and belt filter presses. Dewatered biosolids are disposed of in the city's landfill The total amount of biosolids delivered to the landfill in 2015 was 2,455 dry metric tons. The WWTP also operates and maintains 65 sanitary lift stations throughout the City of Fargo as well as the surrounding area. The SE Cass sewer system, which includes many rural subdivisions and small cities, utilize over 75 grinder pumps that are maintained by WWTP staff. The Sump Pump Compliance program has been reclassified to a Wastewater Compliance group. This change will allow staff to regulate the sump pump and foundation drain program, but will expand duties to include investigation of fats, oils and grease (FOG) issues, odor complaints, sample collection and provide assistance with the EPA regulated Industrial Pretreatment Program. The WWTP staff also operates and maintains an Effluent Reuse Facility (ERF). Treated effluent is diverted to the ERF and is further treated to high quality water that is pumped to an ethanol plant in Casselton. The technology used to achieve this high quality includes microfiltration and reverse osmosis. In 2015 the WWTP ERF produced over 324 million gallons of reclaimed water. In May 2016, the ERF had surpassed 2.3 billion gallons produced and sold since 2009.
The WWTP has recently updated the 2010 Facility Plan to reflect significant changes that have occurred since the original document was submitted in October 2010. The Facility Plan recommendations were prioritized in a phased approach based on the most immediate needs. Phase I recommendations include equipment upgrades to existing components due to age, condition, capacity and safety. These improvements are the most critical from a vulnerability standpoint to adequately and safely treat wastewater. The Phase I improvements were recently bid and awarded in 2015, with expected completion in 2017. Nutrient reduction recommendations for both the existing WWTP and proposed future plant expansion are addressed in the new document Potential impacts of becoming a larger regional facility (potential service to West Fargo, Horace & Mapleton) were also included. The updated facility plan included applicable technologies and costs to address nutrients in the WWTP effluent, and will provide staff a single document for Commissioners and Funding Agencies to illustrated that the Fargo Wastewater Utility is well prepared if additional effluent limits are implemented in the future. The plan also included analysis for plant expansion, an opinion of cost with an implementation schedule. The improvements will be ranked in order of importance to ensure efficient, reliable and trouble free operation of the WWTP well into the future. Some of the new technologies being considered include (but not limited to): • Integrated Fixed Film Activated Sludge (IFAS) • Moving Bed Biofilm Reactor (MBBR) • Membrane Bioreactor (MBR)
The WWTP historically has operated 24/7 with a minimum of one operator on duty at all times. In January 2015, the WWTP began to automate the processes so as not to have staff 24/7. Currently a call‐out alarm system has successfully been implemented along with the installation of a security gate. These changes have allowed the plant to reduce staffing to 20 hours per day. The goal is to reduce staffing even further in the near future.
Wastewater Treatmen
t
136

Operational Measures
Description 2015 Actual 2016 Expected 2017 Projected
Sewer Operating $558,393 $432,158 $432,158 Wastewater Treatment $4,408,255 $5,150,291 $5,014,791 Wastewater Transfers $4,806,055 $3,030,000 $3,168,000 Sewer Collection $394,673 $520,000 $520,000 Sump Pump $162,626 $168,139 $168,139 Wastewater $364,306 $347,183 $347,183 Total $10,694,308 $9,647,771 $9,512,271
137

2016 2016 20172015 Approved Revised Approved
Expenditures Actual Budget Budget BudgetSalaries 1,258,197$ 1,257,672$ 1,265,662$ 1,300,475$ Benefits 439,700 464,562 473,492 496,282 Other Services 1,045,678 849,815 849,815 960,815 Repairs and Maintenance 978,290 1,096,500 1,096,500 1,096,500 Rentals 4,108 70,000 70,000 70,000 Insurance 55,335 50,200 50,200 50,200 Communications 9,350 8,000 8,000 8,000 Advertising and Printing 1,654 3,750 3,750 3,750 Travel & Education 13,252 14,100 14,100 14,100 Energy 1,062,740 945,568 919,847 945,568 General Supplies 55,723 71,200 71,200 71,200 Major Supplies 534,180 487,500 487,500 487,500 Miscellaneous 17,195 16,704 16,704 17,350 Capital Outlay 3,993,477 1,282,200 1,282,200 1,884,700 Debt Service 260,800 ‐ ‐ ‐ Transfers 4,806,055 3,030,000 3,030,000 3,168,000
TOTAL 14,535,734$ 9,647,771$ 9,638,970$ 10,574,440$
Authorized Positions2015Actual
2016Approved
2016Revised
2017Approved
Full Time Employees 20 20 20 20 Part Time Benefited ‐ ‐ ‐ ‐ Contracted Employees ‐ ‐ ‐ ‐
TOTAL 20 20 20 20
Wastewater Treatment
138
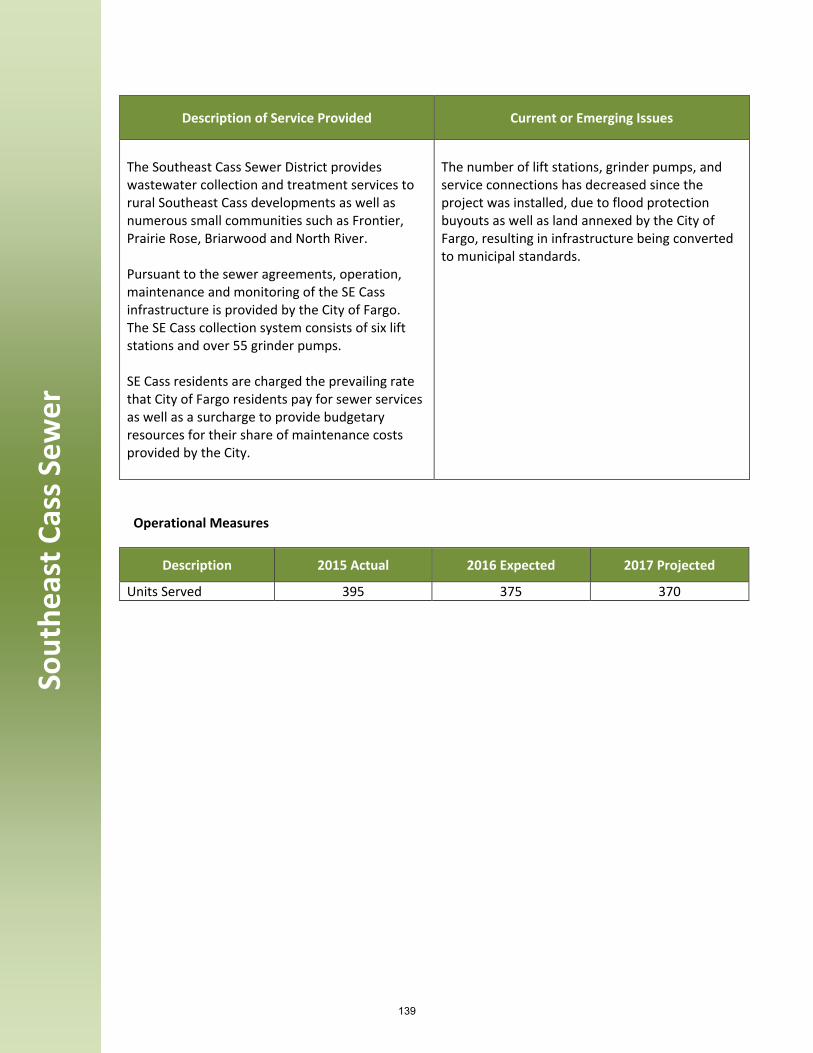
Description of Service Provided Current or Emerging Issues
The Southeast Cass Sewer District provides wastewater collection and treatment services to rural Southeast Cass developments as well as numerous small communities such as Frontier, Prairie Rose, Briarwood and North River. Pursuant to the sewer agreements, operation, maintenance and monitoring of the SE Cass infrastructure is provided by the City of Fargo. The SE Cass collection system consists of six lift stations and over 55 grinder pumps. SE Cass residents are charged the prevailing rate that City of Fargo residents pay for sewer services as well as a surcharge to provide budgetary resources for their share of maintenance costs provided by the City.
The number of lift stations, grinder pumps, and service connections has decreased since the project was installed, due to flood protection buyouts as well as land annexed by the City of Fargo, resulting in infrastructure being converted to municipal standards.
Operational Measures
Description 2015 Actual 2016 Expected 2017 Projected
Units Served 395 375 370
Southe
ast C
ass S
ewer
139

2016 2016 20172015 Approved Revised Approved
Expenditures Actual Budget Budget BudgetSalaries ‐$ ‐$ ‐$ ‐$ Benefits ‐ ‐ ‐ ‐ Other Services ‐ 300 300 ‐ Repairs and Maintenance 8,818 1,500 1,500 1,500 Rentals ‐ ‐ ‐ ‐ Insurance ‐ ‐ ‐ ‐ Communications ‐ ‐ ‐ ‐ Advertising and Printing ‐ ‐ ‐ ‐ Travel & Education ‐ ‐ ‐ ‐ Energy 28,462 12,863 12,863 12,863 General Supplies 17,035 21,337 21,337 21,337 Major Supplies ‐ ‐ ‐ ‐ Miscellaneous ‐ 13,000 13,000 13,000 Capital Outlay ‐ ‐ ‐ ‐ Debt Service ‐ ‐ ‐ ‐ Transfers ‐ ‐ ‐ ‐
TOTAL 54,315$ 49,000$ 49,000$ 48,700$
Southeast Cass Sewer
140

Description of Service Provided Current or Emerging Issues
The Storm Sewer Utility collects, routes and discharges precipitation back into the river throughout the City. To achieve this, a complex series of conveyances including natural features, legal drains, inlets, underground pipes, lift stations and retention ponds are used. The major services delivered include: Site plan reviews Pre and post construction determinations & verifications of building elevations
Issuance of Elevation Certificates Establishment of required minimum build elevations for developers
Oversee status of map changes through Flood Insurance Studies and Letters of Map Revisions & Amendments
Regulate and enforce restrictions on use of floodway and river setback ordinance
Review plans for non‐structural development in the floodplain and issue Development Permits for construction activities in the floodplain and river set‐back areas.
Respond to citizen complaints regarding use of floodway, development of floodplain and/or disturbance within the river setbacks.
Administer the Community Rating System (CRS) program by documenting actions being done to manage floodplain, developing new ways to educate public, and new ways to pro‐actively manage the floodplain. The City receives a discount for its citizens required to carry flood insurance by participating in this program. The responsibility for this program is a function of floodplain management.
Develop concepts for long term handling of storm water in areas of growth.
Size trunk line infrastructure appropriately to handle future contributing drainage areas.
Determine future locations where lift stations will be necessary.
Keep record of existing lift stations and the equipment, design capacities and operational features that are unique to each station. (Storm Sewer Lift Station Operations and Maintenance Manual)
Develop concepts to relieve stress from existing, aging drain systems that are at or approaching
The site plan submittals are at a very high level and are requiring significant staff time to review.
The current flood proofing construction policy requires any residential structure within the 41’ inundation area to be constructed with a flood proof basement. This requires more staff time to establish minimum build elevations, survey time to set those elevations, collect post elevations and issue Elevation Certificates.
This January 2015, the City adopted the Flood Insurance Study created by FEMA. This is requiring additional staff time to answer many questions from our residents.
New Letter of Map Changes are at all‐time high levels with the new residential developments being constructed and after the adoption of the new 1% annual chance floodplain.
Once the policy renewals on year two start occurring there could be a resurgence in call volume. Grandfathering, built in compliance and non‐ flood proofed EC requests/questions.
The expansion of the floodplain results in an increase of development permits to be issued for activities in the floodplain as well as addressing any disturbances within the setback areas.
In 2015, we had a scheduled CRS audit. At this audit We provided documentation to maintain our Class 7 rating. The goal of the audit is to gain more points to get closer to a Class 6 rating and also determine areas where additional points could be gained to try and achieve the Class 6 rating. Still no word on the outcome of this audit as of June, 2016
Due to the rapid growth south of current edges of the City we are currently in the final process of completing a master planning study for future storm trunk lines, storm sewer lift stations and flood protection options. This master planning will be very beneficial in the future planning of new developments in the southwest quadrant of the City.
With the recent new development, we have constructed and are in the process of constructing additional lift stations to handle the new infrastructure within these new additions. The additional lift stations will require additional work for scheduled maintenance and up keep, while there is an increasing need for repairs/replacement to existing lift stations that are reaching the end of their useful life.
Storm Sew
er
141

capacity on a regular basis with current development.
Provide for scheduled maintenance and upkeep of lift stations.
Review and track private connections to the storm sewer system.
Maintain Storm Sewer Design Manual and Standards.
Address ongoing concerns of the public related to individual local drainage systems and how they function.
Creating projects for maintenance to City’s storm sewer system.
Mange a list of properties affected by flooding. List information on elevation and river gage levels that affect the homes.
Proactively seek to increase the level of protection and affected residents through the Flood Protection and Incentive Program (FPIP) in areas that are not identified as areas of need for projects under the City‐wide comprehensive plan. City provides a cost share for properties increasing their level of protection through elevation of rear yards or floodwalls.
Identify areas of greatest risk and work to develop concepts and ultimately construction projects to reduce and/or eliminate risks associated with riverine flooding or flooding from intense storms. This typically requires the City to leverage partnerships with FEMA, USACE, NDSWC, SE Cass WRD, Cass County and other agencies.
Administer and update City of Fargo Storm Water Pollution Prevention Program addressing six minimum control measures mandated by NDDOH and Federal EPA under our MS4 permit with the State.
Current rate structure of the Storm Sewer Utility is out of date and needs updating. Funds generated from the current rate are insufficient for being able to complete required maintenance to the storm sewer system.
With the success of the voluntary buyout program this list is every changing. This list will continue to be updated as needed so that the City’s emergency efforts during a possible flood fight are readily available.
The implementation of the City‐wide comprehensive plan is continuing. This year we have numerous projects under construction as well as continuing to design numerous projects with a goal of completing enough projects to start some property removals from the Special Flood Hazard Area by 2018.
Future considerations with the implementation of the flood protection measures will be the long term annual inspections and operations and maintenance of the levees. Both items will require additional staff time and cost.
A new MS4 permit became effective 4‐1‐16 through 3‐31‐2021. Staff is in the process of implementing and updating any new requirements. Many familiar topics remained in this permit and more specific (targeted) control and reporting parameters comprise the bulk of changes. The EPA is requiring states to move toward a digital DMR (annual report) and our revised report format will facilitate a smooth transition to a digital format.
Operational Measures
Description 2015 Actual 2016 Expected 2017 Projected
Construction Stormwater Violations 496 425 425 Setback/Floodplain Violations 3 5 5 Stormwater Permits Issued 496 555 666 Floodplain Development Permits 23 25 27 Resident Calls (Drainage, Floodplain, Flood Insurance, etc.) 648 774 700
Building Elevation Requests & Issuance of Elevation Certificates 252 300 350
Number of Lift Stations 75 75 76
142

2016 2016 20172015 Approved Revised Approved
Expenditures Actual Budget Budget BudgetSalaries 402,671$ 427,880$ 408,508$ 422,081$ Benefits 94,533 102,806 100,635 99,982 Other Services 66,975 118,722 118,722 133,722 Repairs and Maintenance 47,768 62,500 62,500 62,500 Rentals ‐ ‐ ‐ ‐ Insurance 18,882 12,890 12,890 12,890 Communications 3,093 3,250 3,250 3,250 Advertising and Printing 1,049 3,400 3,400 3,400 Travel & Education 3,912 15,525 15,525 15,825 Energy 136,722 152,752 150,979 152,752 General Supplies 5,121 6,600 6,600 6,400 Major Supplies ‐ ‐ ‐ ‐ Miscellaneous 4,742 5,220 5,220 5,548 Capital Outlay 4,135,428 78,455 228,455 235,655 Debt Service 126,785 ‐ ‐ ‐ Transfers 757,700 521,000 521,000 531,000
TOTAL 5,805,381$ 1,511,000$ 1,637,684$ 1,685,005$
Authorized Positions2015Actual
2016Approved
2016Revised
2017Approved
Full Time Employees 5 5 5 5 Part Time Benefited ‐ ‐ ‐ ‐ Contracted Employees ‐ ‐ ‐ ‐
TOTAL 5 5 5 5
Storm Sewer
143
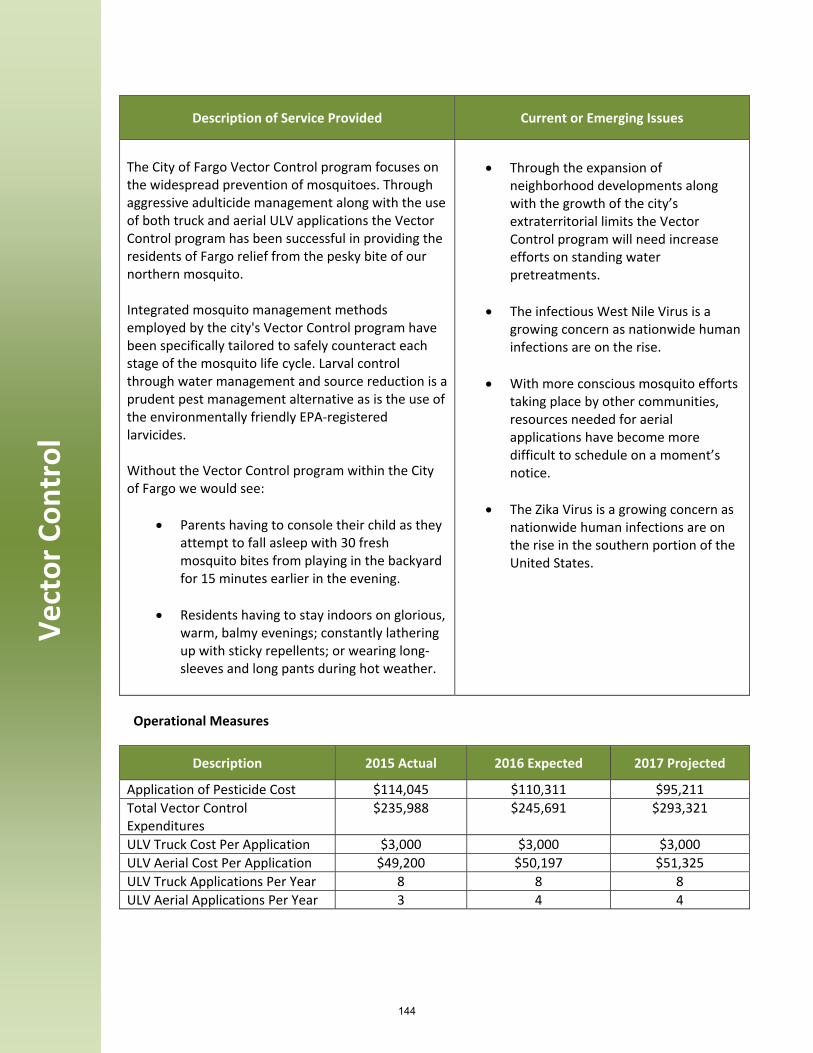
Description of Service Provided Current or Emerging Issues
The City of Fargo Vector Control program focuses on the widespread prevention of mosquitoes. Through aggressive adulticide management along with the use of both truck and aerial ULV applications the Vector Control program has been successful in providing the residents of Fargo relief from the pesky bite of our northern mosquito. Integrated mosquito management methods employed by the city's Vector Control program have been specifically tailored to safely counteract each stage of the mosquito life cycle. Larval control through water management and source reduction is a prudent pest management alternative as is the use of the environmentally friendly EPA‐registered larvicides. Without the Vector Control program within the City of Fargo we would see:
Parents having to console their child as they attempt to fall asleep with 30 fresh mosquito bites from playing in the backyard for 15 minutes earlier in the evening.
Residents having to stay indoors on glorious,
warm, balmy evenings; constantly lathering up with sticky repellents; or wearing long‐sleeves and long pants during hot weather.
Through the expansion of
neighborhood developments along with the growth of the city’s extraterritorial limits the Vector Control program will need increase efforts on standing water pretreatments.
The infectious West Nile Virus is a growing concern as nationwide human infections are on the rise.
With more conscious mosquito efforts taking place by other communities, resources needed for aerial applications have become more difficult to schedule on a moment’s notice.
The Zika Virus is a growing concern as nationwide human infections are on the rise in the southern portion of the United States.
Operational Measures
Description 2015 Actual 2016 Expected 2017 Projected
Application of Pesticide Cost $114,045 $110,311 $95,211 Total Vector Control Expenditures
$235,988 $245,691 $293,321
ULV Truck Cost Per Application $3,000 $3,000 $3,000 ULV Aerial Cost Per Application $49,200 $50,197 $51,325 ULV Truck Applications Per Year 8 8 8 ULV Aerial Applications Per Year 3 4 4
Ve
ctor Con
trol
144

2016 2016 20172015 Approved Revised Approved
Expenditures Actual Budget Budget BudgetSalaries ‐$ ‐$ ‐$ ‐$ Benefits ‐ ‐ ‐ ‐ Other Services 212,531 450,378 450,378 458,878 Repairs and Maintenance 674 6,200 6,200 6,200 Rentals ‐ ‐ ‐ ‐ Insurance 2,498 3,020 3,020 3,020 Communications ‐ ‐ ‐ ‐ Advertising and Printing ‐ 2,536 2,536 2,536 Travel & Education ‐ ‐ ‐ ‐ Energy ‐ 7,716 ‐ 7,716 General Supplies 171 6,000 6,000 6,000 Major Supplies 114,045 65,000 65,000 65,000 Miscellaneous 49 150 150 150 Capital Outlay 5,309 ‐ ‐ ‐ Debt Service ‐ ‐ ‐ ‐ Transfers 204,000 207,000 207,000 207,000
TOTAL 539,277$ 748,000$ 740,284$ 756,500$
Vector Control
145

Description of Service Provided Current or Emerging Issues
The Street Lighting Utility Department was created in 2010 by resolution of the City Commission. The Street Lighting Department includes two Street Lighting Maintenance Electricians. The Department is jointly operated and managed as part of the City's Engineering Department. The Street Lighting Department is responsible for the following activities:
Operation and maintenance of the City's street lighting system
Scheduling and coordinating repairs utilizing contractors
Meeting with suppliers on the latest trends in street lighting
2 full time staff, both located at Public Safety Building
Maintain approximately 9,000 City owned street lights
Coordinate, along with Xcel Energy and Cass County Electric Cooperative, the maintenance of over 1,600 utility company owned street lights
Maintain over 425 street light feed points Maintain over 400 miles of underground
wire
Construction inflation costs continue to
escalate in this economic climate in ND where work is plenty and contractors scarce.
As the City continues to grow, there will be
a need in the future for a new FTE for another Maintenance Electrician to assist with maintaining the Citywide system.
LED technology continues to be the new
street light fixture of choice as we continue to design and construct new roadways in town.
Operational Measures
Description 2015 Actual 2016 Expected 2017 Projected
Salaries $130,384 $135,000 $130,000 Street Light Maintenance $141,823 $182,000 $182,000 Electricity $1,092,783 $1,155,000 $1,200,000
Street Lighting
146

2016 2016 20172015 Approved Revised Approved
Expenditures Actual Budget Budget BudgetSalaries 141,423$ 147,570$ 148,952$ 151,780$ Benefits 40,425 41,913 42,171 40,208 Other Services 6,859 18,922 18,922 35,922 Repairs and Maintenance 141,823 182,000 182,000 182,000 Rentals ‐ ‐ ‐ ‐ Insurance 7,226 6,085 6,085 6,085 Communications 1,643 1,200 1,200 2,000 Advertising and Printing 3 50 50 50 Travel & Education 173 2,525 2,525 2,525 Energy 1,098,666 1,165,571 1,159,497 1,210,571 General Supplies 137,817 65,364 65,364 73,064 Major Supplies ‐ ‐ ‐ ‐ Miscellaneous 19,285 800 800 800 Capital Outlay 1,420,132 ‐ ‐ ‐ Debt Service ‐ ‐ ‐ ‐ Transfers 252,000 257,000 257,000 257,000
TOTAL 3,267,475$ 1,889,000$ 1,884,566$ 1,962,005$
Authorized Positions2015Actual
2016Approved
2016Revised
2017Approved
Full Time Employees 2 2 2 2 Part Time Benefited ‐ ‐ ‐ ‐ Contracted Employees ‐ ‐ ‐ ‐
TOTAL 2 2 2 2
Street Lighting
147

Description of Service Provided Current or Emerging Issues
The Division of Solid Waste is responsible for managing and directing all aspects of waste collection, disposal, and materials recycling which occurs in the City of Fargo (public and private). Specifically, the Division provides solid waste services in the following areas:
• Administration • Residential Collection • Commercial Collection • Roll‐off Collection Municipal Solid Waste (MSW) Landfill‐ to
include Renewable Energies • Recycling • Household Hazardous Waste
Facility plan development‐A review of all
current Solid Waste operations and a thorough evaluation of options available to the City to address both short and long‐term disposal needs.
Reclamation and reuse of the former landfill ‐ located on 150‐acres directly east of the current landfill} utilized from 1950‐1980. Reclamation would involve removal of the existing waste and placement in a newly constructed cell at the site. The intent would be for additional future landfill capacity and elimination of potential environmental liability due to off‐site migration of contaminants.
Renewable Energy Expansion‐ Expand the landfill gas collection system in filled areas of the current landfill. Complete Phase I of project which is converting the landfill gas to natural gas quality which will require less maintenance on the LFG electric generator. Begin Phase II which will include utilizing the converted gas as a fuel source for the Solid Waste fleet. In addition, continue to explore other renewable energy markets for the sale of captured and converted landfill gas.
Operational Measures
Description 2015 Actual 2016 Expected 2017 Projected
Residential Accounts 24,054 24,857 25,660 Commercial Accounts 966 1,004 1,042 Roll Off Activity (Pulls) 3,677 3,700 3,800 Landfill Tonnage 212,695 227,667 234,497 Facility Plan Development 75% Complete 100% Complete ‐ Old Landfill Reclamation 5% Complete 15% Complete 20% Complete Renewable Energy Expansion 5% Complete 20% Complete 50% Complete
Solid
Waste
148

2016 2016 20172015 Approved Revised Approved
Expenditures Actual Budget Budget BudgetSalaries 2,836,838$ 2,905,956$ 2,926,296$ 3,021,327$ Benefits 1,021,083 1,010,151 1,018,637 1,109,838 Other Services 1,267,381 930,083 930,083 1,142,888 Repairs and Maintenance 810,225 626,400 626,400 638,025 Rentals 21,121 1,003,308 1,003,308 1,214,108 Insurance 106,447 94,020 94,020 94,020 Communications 10,640 11,270 11,270 11,270 Advertising and Printing 11,841 19,450 19,450 19,450 Travel & Education 9,378 37,770 37,770 37,770 Energy 726,299 924,660 446,529 924,660 General Supplies 683,014 539,600 539,600 539,600 Major Supplies ‐ ‐ ‐ ‐ Miscellaneous 744,004 41,482 41,482 44,119 Capital Outlay 2,110,489 2,794,500 3,564,500 4,491,000 Debt Service 281,505 927,350 927,350 902,350 Transfers 2,611,283 2,290,000 2,290,000 2,300,000
TOTAL 13,251,548$ 14,156,000$ 14,476,695$ 16,490,425$
Authorized Positions2015Actual
2016Approved
2016Revised
2017Approved
Full Time Employees 50 50 50 50 Part Time Benefited ‐ ‐ ‐ ‐ Contracted Employees ‐ ‐ ‐ ‐
TOTAL 50 50 50 50
Solid Waste
149

Description of Service Provided Current or Emerging Issues
The Forestry Division works aggressively to promote and maintain a safe, healthy, and continuously progressive urban forest for the benefit of all residents.
Street tree pruning and maintenance Insect and disease management Planting: in‐house and contracted Residential Planting Assistance Program Removals and diversification Public education, workshops, &
presentations Volunteer coordination for forestry projects Annual risk assessment Respond to residential tree health requests Planting beds and small tree maintenance Residential Brush Chipping Program Annual Arbor Day celebration
Preparation efforts for the arrival of Emerald
Ash Borer continues. This includes aggressive diversification, in‐fill of vacant street tree locations, contractor agreements, public education opportunities, and partnerships with the ND Dept. of Agriculture and the ND Forest Service. Currently there are 15,809 ash street trees that make up 28.6% of the entire population.
In 2015, Dutch Elm Disease caused the removal nearly 400 elm trees. It is anticipated that 2016 will be approximately the same.
Land Development Code requires that street trees be planted. Enforcement efforts are on‐going in new residential areas.
Median and enhanced landscaping requests are becoming increasingly common from developers and planning. Additional funds for either in‐house or contracted staff will be necessary to keep up with required maintenance of these areas. Examples include 45th St S, 52nd Ave S, South University Dr., and Veterans Boulevard.
A 50 cent increase in rates is recommended
to offset Solid Waste Fund subsidy.
Operational Measures
Description 2015 Actual 2016 Expected 2017 Projected
Trees Pruned 7,575 8,500 9,000 Trees Planted 2,254 2,400 2,600 Trees Removed 1,037 1,100 1,200 Service Volunteers 400 450 475
Forestry
150

2016 2016 20172015 Approved Revised Approved
Expenditures Actual Budget Budget BudgetSalaries 764,834$ 805,294$ 812,217$ 844,061$ Benefits 244,824 255,489 253,636 271,826 Other Services 395,426 414,501 414,501 438,872 Repairs and Maintenance 44,385 45,000 45,000 45,000 Rentals 1,500 4,000 4,000 16,500 Insurance 12,116 11,940 11,940 11,940 Communications 1,759 2,500 2,500 2,500 Advertising and Printing 645 650 650 650 Travel & Education 15,515 18,450 18,450 20,650 Energy 30,900 62,276 27,444 63,276 General Supplies 53,050 53,800 53,800 57,200 Major Supplies ‐ ‐ ‐ ‐ Miscellaneous 5,906 9,100 9,100 8,852 Capital Outlay 119,819 203,000 295,945 170,000 Debt Service ‐ ‐ ‐ ‐ Transfers 90,000 92,000 92,000 100,000
TOTAL 1,780,679$ 1,978,000$ 2,041,183$ 2,051,327$
Authorized Positions2015Actual
2016Approved
2016Revised
2017Approved
Full Time Employees 11 11 11 11 Part Time Benefited ‐ ‐ ‐ ‐ Contracted Employees ‐ ‐ ‐ ‐
TOTAL 11 11 11 11
Forestry
151

Description of Service Provided Current or Emerging Issues
The Municipal Airport Authority is a five‐member board that was established to oversee airport activities and implementation of the airport master plan, and has since invested time and money into improvements to provide a safe and efficient airport. The Municipal Airport Authority normally meets the 2nd and 4th Tuesday of each month in the boardroom at the terminal building.
Fargo’s Hector International Airport provides the following services:
Commercial air service to 11 markets, corporate, general and military aviation
24/7 FAA Air Traffic Control Tower; US Customs & Border Protection clearance; Foreign Trade Zone #267
Fixed Base Operator Services for charter, aircraft fuel and maintenance
Long term auto parking and car rental services
There are ongoing issues regarding the
timely availability of Federal funding via the Airport Improvement Program. These funds are used to pay for eligible airport improvement projects.
Mergers in the airline industry have resulted in fewer airline options to provide service.
The industry is experiencing a pilot shortage that will have a significant impact on service to small communities unless the federal government reverses recent changes to pilot qualification requirements.
There is a need to increase State funding for North Dakota airports during the next biennium. Progress was made during the last session.
The Airport Authority is in the process of updating the Airport Master Plan and Airport Layout Plan.
Operational Measures
Description 2015 Actual 2016 Expected 2017 Projected
Enplaned Passengers 429,251 415,000 420,000 Aircraft operations 74,654 75,000 75,500
Fargo Airport A
utho
rity
152

2016 2016 20172015 Approved Revised Approved
Expenditures Actual Budget Budget BudgetSalaries 1,596,927$ 1,724,841$ 1,716,609$ 1,781,110$ Benefits 456,737 553,903 545,713 607,327 Other Services 1,225,366 2,116,000 2,116,000 4,000,600 Repairs and Maintenance 328,595 451,000 451,000 447,000 Rentals 829 1,000 1,000 1,000 Insurance 76,460 105,300 105,300 95,300 Communications 1,295 4,700 4,700 4,700 Advertising and Printing 265,364 249,100 249,100 249,150 Travel & Education 54,834 72,700 72,700 76,200 Energy 464,894 595,150 595,150 585,150 General Supplies 194,620 230,900 230,900 231,000 Major Supplies ‐ ‐ ‐ ‐ Miscellaneous 19,074 32,000 32,000 32,000 Capital Outlay 3,506,959 399,000 399,000 759,000 Debt Service 223,354 95,000 95,000 100,000 Transfers 7,340,740 13,205,000 13,205,000 9,641,455
TOTAL 15,756,048$ 19,835,594$ 19,819,172$ 18,610,992$
Authorized Positions2015Actual
2016Approved
2016Revised
2017Approved
Full Time Employees 26 27 27 27 Part Time Benefited ‐ ‐ ‐ ‐ Contracted Employees ‐ ‐ ‐ ‐
TOTAL 26 27 27 27
Fargo Airport Authority
153
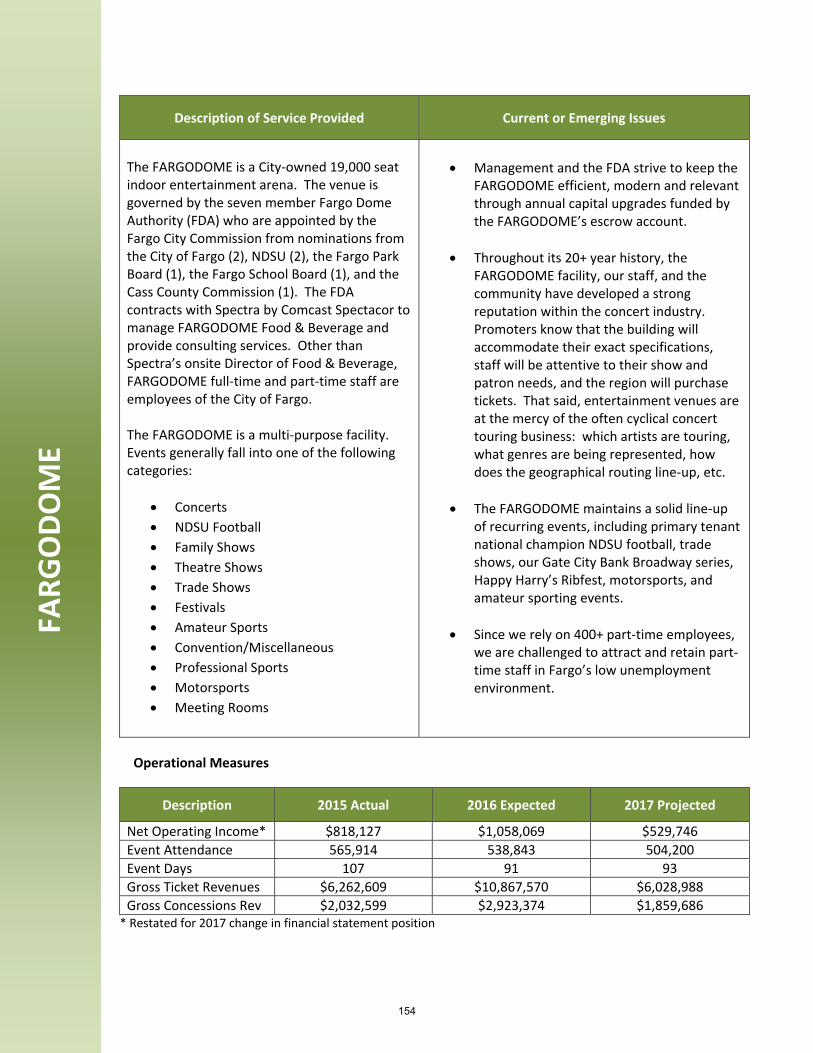
Description of Service Provided Current or Emerging Issues
The FARGODOME is a City‐owned 19,000 seat indoor entertainment arena. The venue is governed by the seven member Fargo Dome Authority (FDA) who are appointed by the Fargo City Commission from nominations from the City of Fargo (2), NDSU (2), the Fargo Park Board (1), the Fargo School Board (1), and the Cass County Commission (1). The FDA contracts with Spectra by Comcast Spectacor to manage FARGODOME Food & Beverage and provide consulting services. Other than Spectra’s onsite Director of Food & Beverage, FARGODOME full‐time and part‐time staff are employees of the City of Fargo. The FARGODOME is a multi‐purpose facility. Events generally fall into one of the following categories:
Concerts NDSU Football Family Shows Theatre Shows Trade Shows Festivals Amateur Sports Convention/Miscellaneous Professional Sports Motorsports Meeting Rooms
Management and the FDA strive to keep the
FARGODOME efficient, modern and relevant through annual capital upgrades funded by the FARGODOME’s escrow account.
Throughout its 20+ year history, the
FARGODOME facility, our staff, and the community have developed a strong reputation within the concert industry. Promoters know that the building will accommodate their exact specifications, staff will be attentive to their show and patron needs, and the region will purchase tickets. That said, entertainment venues are at the mercy of the often cyclical concert touring business: which artists are touring, what genres are being represented, how does the geographical routing line‐up, etc.
The FARGODOME maintains a solid line‐up
of recurring events, including primary tenant national champion NDSU football, trade shows, our Gate City Bank Broadway series, Happy Harry’s Ribfest, motorsports, and amateur sporting events.
Since we rely on 400+ part‐time employees,
we are challenged to attract and retain part‐time staff in Fargo’s low unemployment environment.
Operational Measures
Description 2015 Actual 2016 Expected 2017 Projected
Net Operating Income* $818,127 $1,058,069 $529,746 Event Attendance 565,914 538,843 504,200 Event Days 107 91 93 Gross Ticket Revenues $6,262,609 $10,867,570 $6,028,988 Gross Concessions Rev $2,032,599 $2,923,374 $1,859,686
* Restated for 2017 change in financial statement position
FARG
ODOME
154

2016 2016 20172015 Approved Revised Approved
Expenditures Actual Budget Budget BudgetSalaries 2,631,502$ 2,544,191$ 2,544,191$ 2,045,474$ Benefits ‐ ‐ ‐ ‐ Other Services 107,687 209,071 209,071 302,798 Repairs and Maintenance 242,970 4,500 4,500 265,725 Rentals 13,318 ‐ ‐ 8,300 Insurance 231,930 238,000 238,000 244,400 Communications ‐ 34,500 34,500 35,000 Advertising and Printing ‐ 270,718 270,718 37,500 Travel & Education 30,619 41,535 41,535 48,500 Energy 743,168 ‐ ‐ 724,672 General Supplies 137,025 19,500 19,500 108,000 Major Supplies ‐ ‐ ‐ ‐ Miscellaneous 1,053,802 2,286,006 2,286,006 55,736 Capital Outlay 2,384,564 878,632 878,632 990,000 Debt Service 104,792 1,208,368 1,208,368 1,458,368 Transfers 3,365,430 2,137,000 2,137,000 2,137,000
TOTAL 11,046,807$ 9,872,021$ 9,872,021$ 8,461,473$
Authorized Positions2015Actual
2016Approved
2016Revised
2017Approved
Full Time Employees 20 20 20 20 Part Time Benefited ‐ 1 1 1 Contracted Employees ‐ ‐ ‐ ‐
TOTAL 20 21 21 21
FARGODOME
155

Description Project # Amount
Capital Lease Payment #5 on Turf and Parking Projects FD1700 1,208,368$ 2016 Video Technology Upgrade Debt Payment FD1712 250,000 Parking Lot/Misc. Concrete Repair FD1701 15,000 Handicap Access Corners FD1702 100,000 Remodeling of Suites FD1703 270,000 Chiller Overhaul/Eddy Current Testing FD1704 35,000 Computer Switches for Sound System and Ticket Office FD1705 35,000 Bulding Pickup/Outdoor Vehicle FD1706 20,000 Custodial Equipment FD1707 20,000 Equipment - Food Service FD1708 25,000 Walk Through Metal Detectors FD1709 175,000 Spotlights FD1710 60,000 F&B Point of Sale System Platform Upgrade FD1711 200,000 Unallocated Capital 35,000
2,448,368$
2017 CAPITAL BUDGET
FARGODOME
156

Operating Revenues 4,363,771$
Operating Expenditures Labor 2,045,474 Operations 1,126,397 Management Fee 151,178 General and Administrative 497,320 Miscellaneous 13,656 Total Expenditures 3,834,025
Net Income 529,746$
FARGODOME
2017 APPROVED BUDGET
157

PENSIO
N TRU
ST FUNDS
Fund Description Fiscal Trends and Comments
A defined benefit pension option is offered to all full‐time employees of the City. Currently, the City administers two plans and has employee membership in two other plans that are maintained by other agencies. The pension plans includes: City Employee Police North Dakota Public Employee Retirement System Fire Relief Association The Board of City Commissioners have administrative control over the City Employee and Police pension systems, while the Fire Relief and the NDPERS is maintained by other governmental bodies. City‐administered plans are managed by elected Pension Board members who are City employees. Discretion includes asset management and investment policy recommendations. Accounting and financial reporting is handled by the City Finance and Human Resource staff. In addition to defined benefit pension plans, voluntary employee elective contributions can be made to Section 457 deferred compensation plans. These plans allow employees to save for retirement on a pre‐tax basis. Approximately 44% of eligible employees participate in Section 457 plans. Active Members: City Employee 139 Police 174 Fire Relief Assn. 119 NDPERS 536 Retirees and beneficiaries: City Employee 215 Police 111 Fire Relief Assn. 93 Market Value of Investments held for Pension Benefits: City Employee $39,690,569 Police $47,428,490 Fire Relief Assn. $25,009,344 Net Pension Liability: City Employee $16,405,656 Police $21,540,601 Fire Relief Assn. $18,037,143 NDPERS $17,759,740
A defined benefit pension funding policy was adopted in 2012 that increased employee and employer contributions to sustainable levels with the goal of fully funding the actuarial determined contribution (ADC) by FY 2018.
Investment returns for 2015 and 2016 are lagging our actuarial investment goal of 7.25%. In 2015 the return goal was reduced from 7.5% to 7.25% consistent with prudent actuarial principles prescribed by GASB.
Funding levels are stabilized as a result of an improved funding policy adopted in 2012.
The City Employee and Police Pension plans are pursing the goal of fully funding the actuarially determined contribution (ADC).
A multi‐year amortization period is in place with the goal of achieving a 100% funded status with current contribution levels for City sponsored plans.
Governmental Accounting Standards Board Statements No. 67 and 68 were implemented in 2015. This will increase the financial transparency for pension fund assets and liabilities.
The funded status of each plan as of as of the most recent actuarial study is:
City Employee 70.8% Police 68.8% Fire Relief Assn. 58.1% NDPERS 68.6%
A legislative bill has been drafted by NDPERS to raise plan contribution rates by 1% in 2018 as part of a long term stabilization plan.
158

2016 2017Approved Approved
Plans Administered Budget Budget
City Employees Pension: (Closed Membership)
Investment Income 3,150,000$ 3,045,000$ City - Employer Normal Contribution 617,000 584,000 Park - Employer Normal Contribution 96,000 98,000 City Supplemental ADC Contribution 1,042,000 1,153,000 Park Supplemental ADC Contribution 71,000 71,000 City Employee Contribution 456,000 495,000 Park Employee Contribution 96,000 98,000
Total City Employee Pension 5,528,000 5,544,000
Police Pension: (Open Membership)
Investment Income 3,750,000 3,550,000 Employer Normal Contribution 1,651,000 1,675,000 Employer Supplemental ADC Contribution 874,000 1,234,000 Employee Contribution 1,180,000 1,177,000
Total Police Pension 7,455,000 7,636,000
Total City Administrated Plans 12,983,000$ 13,180,000$
CITY OF FARGO, NORTH DAKOTAPENSION TRUST FUNDS REVENUE ANALYSIS 2016 VS 2017
159
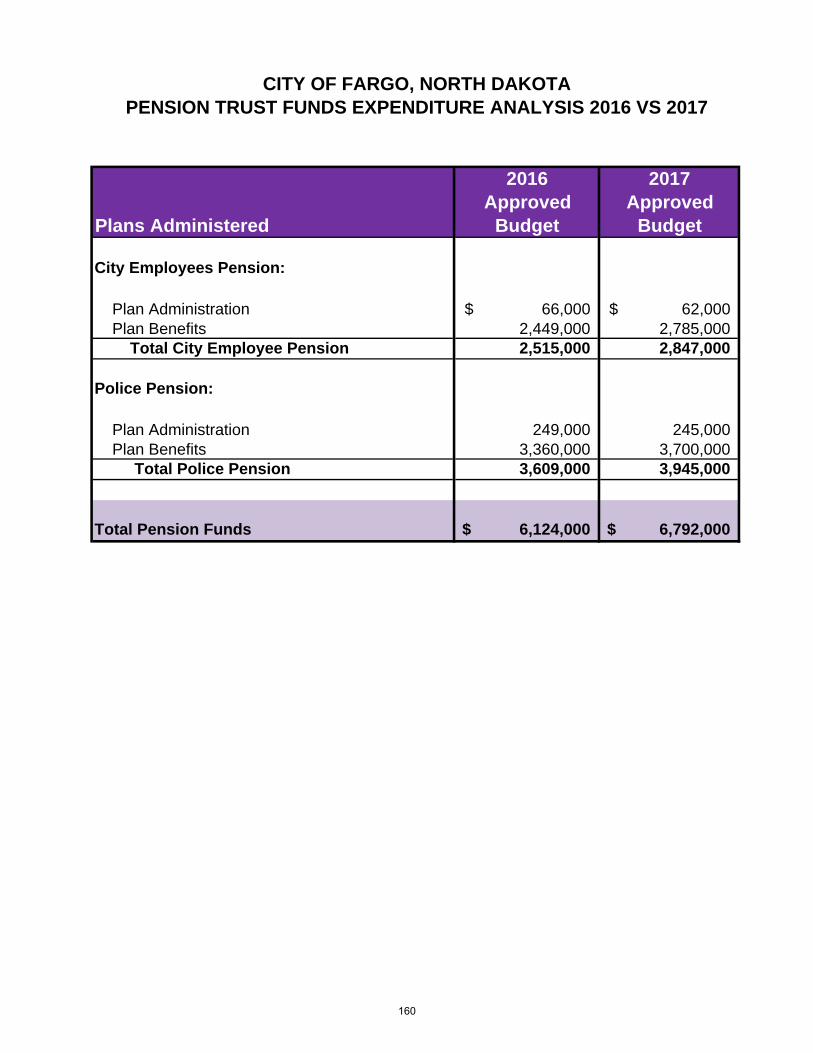
2016 2017Approved Approved
Plans Administered Budget Budget
City Employees Pension:
Plan Administration 66,000$ 62,000$ Plan Benefits 2,449,000 2,785,000 Total City Employee Pension 2,515,000 2,847,000
Police Pension:
Plan Administration 249,000 245,000 Plan Benefits 3,360,000 3,700,000 Total Police Pension 3,609,000 3,945,000
Total Pension Funds 6,124,000$ 6,792,000$
CITY OF FARGO, NORTH DAKOTAPENSION TRUST FUNDS EXPENDITURE ANALYSIS 2016 VS 2017
160
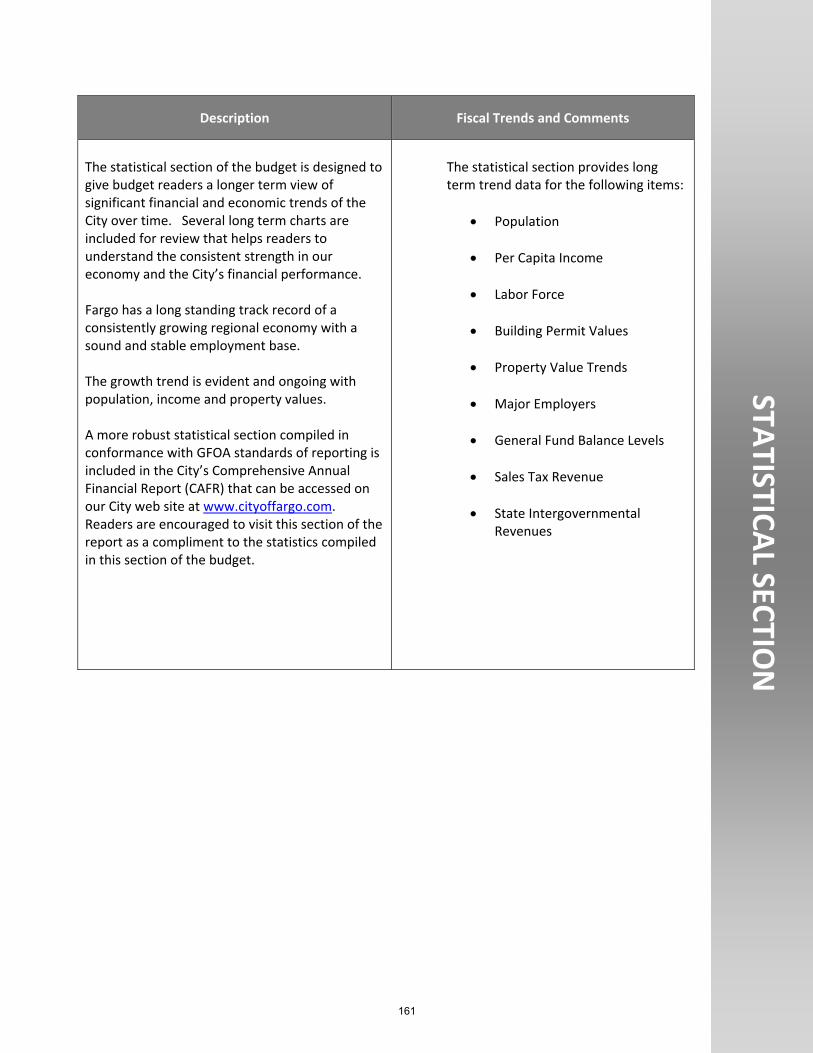
STATISTICAL SECTION
Description Fiscal Trends and Comments
The statistical section of the budget is designed to give budget readers a longer term view of significant financial and economic trends of the City over time. Several long term charts are included for review that helps readers to understand the consistent strength in our economy and the City’s financial performance. Fargo has a long standing track record of a consistently growing regional economy with a sound and stable employment base. The growth trend is evident and ongoing with population, income and property values. A more robust statistical section compiled in conformance with GFOA standards of reporting is included in the City’s Comprehensive Annual Financial Report (CAFR) that can be accessed on our City web site at www.cityoffargo.com. Readers are encouraged to visit this section of the report as a compliment to the statistics compiled in this section of the budget.
The statistical section provides long term trend data for the following items:
Population
Per Capita Income
Labor Force
Building Permit Values
Property Value Trends
Major Employers
General Fund Balance Levels
Sales Tax Revenue
State Intergovernmental Revenues
161

2006 2007 2008 2009 2010 2011 2012 2013 2014 2015Population 99,208 100,477 102,404 103,428 105,600 107,054 109,779 112,075 115,464 118,456% Increase 1.6% 1.3% 1.9% 1.0% 2.1% 1.4% 2.5% 2.1% 3.0% 2.6%
85,000
90,000
95,000
100,000
105,000
110,000
115,000
120,000
125,000
City of Fargo ‐ Population
162

2005 2006 2007 2008 2009 2010 2011 2012 2013 2014Personal Income 32,981 34,505 36,459 39,812 39,883 40,644 42,740 46,384 47,023 48,914% Increase 4.9% 4.6% 5.7% 9.2% 0.2% 1.9% 5.2% 8.5% 1.4% 4.0%
$20,000
$25,000
$30,000
$35,000
$40,000
$45,000
$50,000
$55,000
City of Fargo ‐ Per Capita Personal Income
163

2007 2008 2009 2010 2011 2012 2013 2014 2015 2016Bldg Permits $265 $301 $273 $221 $234 $293 $378 $1,012 $501 $450
$0
$200
$400
$600
$800
$1,000
$1,200
City of Fargo ‐ Building Permit Value (Millions)
164

2007 2008 2009 2010 2011 2012 2013 2014 2015 2016Market Value 6.16 6.40 6.65 6.84 7.04 7.32 7.60 8.16 9.20 10.33% Increase 8.4% 3.9% 3.9% 2.8% 2.9% 4.1% 3.8% 7.3% 12.7% 12.3%
$3.00
$3.50
$4.00
$4.50
$5.00
$5.50
$6.00
$6.50
$7.00
$7.50
$8.00
$8.50
$9.00
$9.50
$10.00
$10.50
$11.00
City of Fargo ‐ Property Market Value (Billions)
165

0 1,000 2,000 3,000 4,000 5,000 6,000 7,000
Microsoft Business Solutions
City of Fargo
U.S. Bank
Blue Cross Blue Shield of North Dakota
Department of Veterans Affairs
Noridian Healthcare Solutions
Fargo Public Schools
Essentia Health
North Dakota State University
Sanford Health
City of Fargo ‐Major Employers (Number of Employees)
166

$0.00
$5.00
$10.00
$15.00
$20.00
$25.00
$30.00
$35.00
$40.00
2008 2009 2010 2011 2012 2013 2014 2015 2016 2017
City of Fargo ‐ General Fund Balance Last Ten Years (Millions)
167

2008 2009 2010 2011 2012 2013 2014 2015 2016 2017Sales Tax 20.73 29.24 40.43 42.05 39.47 47.11 48.34 50.40 52.16 53.72% Increase 0.4% 41.1% 38.3% 4.0% ‐6.1% 19.4% 2.6% 4.3% 3.5% 3.0%
$0.00
$10.00
$20.00
$30.00
$40.00
$50.00
$60.00
City of Fargo ‐ Sales Tax Revenue (Millions)
168

2008 2009 2010 2011 2012 2013 2014 2015 2016 2017State Revenue 10.17 13.10 11.51 16.35 19.60 23.38 20.32 19.11 17.02 16.19% Increase 10.8% 28.8% ‐12.1% 42.1% 19.9% 19.3% ‐13.1% ‐5.9% ‐11.0% ‐4.8%
$0.00
$5.00
$10.00
$15.00
$20.00
$25.00
General Fund ‐ State Intergovernmental Revenue (Millions)
169
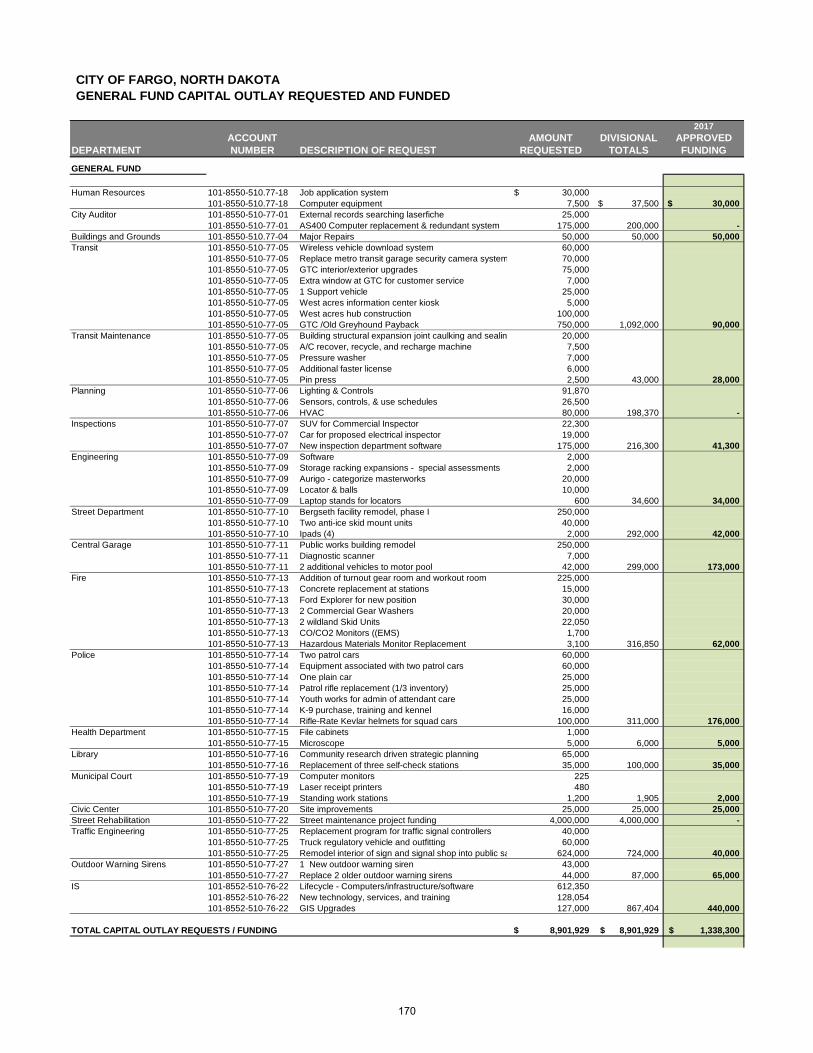
CITY OF FARGO, NORTH DAKOTAGENERAL FUND CAPITAL OUTLAY REQUESTED AND FUNDED
2017ACCOUNT AMOUNT DIVISIONAL APPROVED
DEPARTMENT NUMBER DESCRIPTION OF REQUEST REQUESTED TOTALS FUNDING
GENERAL FUND
Human Resources 101-8550-510.77-18 Job application system 30,000$ 101-8550-510.77-18 Computer equipment 7,500 37,500$ 30,000$
City Auditor 101-8550-510-77-01 External records searching laserfiche 25,000 101-8550-510-77-01 AS400 Computer replacement & redundant system 175,000 200,000 -
Buildings and Grounds 101-8550-510.77-04 Major Repairs 50,000 50,000 50,000 Transit 101-8550-510-77-05 Wireless vehicle download system 60,000
101-8550-510-77-05 Replace metro transit garage security camera system 70,000 101-8550-510-77-05 GTC interior/exterior upgrades 75,000 101-8550-510-77-05 Extra window at GTC for customer service 7,000 101-8550-510-77-05 1 Support vehicle 25,000 101-8550-510-77-05 West acres information center kiosk 5,000 101-8550-510-77-05 West acres hub construction 100,000 101-8550-510-77-05 GTC /Old Greyhound Payback 750,000 1,092,000 90,000
Transit Maintenance 101-8550-510-77-05 Building structural expansion joint caulking and sealin 20,000 101-8550-510-77-05 A/C recover, recycle, and recharge machine 7,500 101-8550-510-77-05 Pressure washer 7,000 101-8550-510-77-05 Additional faster license 6,000 101-8550-510-77-05 Pin press 2,500 43,000 28,000
Planning 101-8550-510-77-06 Lighting & Controls 91,870 101-8550-510-77-06 Sensors, controls, & use schedules 26,500 101-8550-510-77-06 HVAC 80,000 198,370 -
Inspections 101-8550-510-77-07 SUV for Commercial Inspector 22,300 101-8550-510-77-07 Car for proposed electrical inspector 19,000 101-8550-510-77-07 New inspection department software 175,000 216,300 41,300
Engineering 101-8550-510-77-09 Software 2,000 101-8550-510-77-09 Storage racking expansions - special assessments 2,000 101-8550-510-77-09 Aurigo - categorize masterworks 20,000 101-8550-510-77-09 Locator & balls 10,000 101-8550-510-77-09 Laptop stands for locators 600 34,600 34,000
Street Department 101-8550-510-77-10 Bergseth facility remodel, phase I 250,000 101-8550-510-77-10 Two anti-ice skid mount units 40,000 101-8550-510-77-10 Ipads (4) 2,000 292,000 42,000
Central Garage 101-8550-510-77-11 Public works building remodel 250,000 101-8550-510-77-11 Diagnostic scanner 7,000 101-8550-510-77-11 2 additional vehicles to motor pool 42,000 299,000 173,000
Fire 101-8550-510-77-13 Addition of turnout gear room and workout room 225,000 101-8550-510-77-13 Concrete replacement at stations 15,000 101-8550-510-77-13 Ford Explorer for new position 30,000 101-8550-510-77-13 2 Commercial Gear Washers 20,000 101-8550-510-77-13 2 wildland Skid Units 22,050 101-8550-510-77-13 CO/CO2 Monitors ((EMS) 1,700 101-8550-510-77-13 Hazardous Materials Monitor Replacement 3,100 316,850 62,000
Police 101-8550-510-77-14 Two patrol cars 60,000 101-8550-510-77-14 Equipment associated with two patrol cars 60,000 101-8550-510-77-14 One plain car 25,000 101-8550-510-77-14 Patrol rifle replacement (1/3 inventory) 25,000 101-8550-510-77-14 Youth works for admin of attendant care 25,000 101-8550-510-77-14 K-9 purchase, training and kennel 16,000 101-8550-510-77-14 Rifle-Rate Kevlar helmets for squad cars 100,000 311,000 176,000
Health Department 101-8550-510-77-15 File cabinets 1,000 101-8550-510-77-15 Microscope 5,000 6,000 5,000
Library 101-8550-510-77-16 Community research driven strategic planning 65,000 101-8550-510-77-16 Replacement of three self-check stations 35,000 100,000 35,000
Municipal Court 101-8550-510-77-19 Computer monitors 225 101-8550-510-77-19 Laser receipt printers 480 101-8550-510-77-19 Standing work stations 1,200 1,905 2,000
Civic Center 101-8550-510-77-20 Site improvements 25,000 25,000 25,000 Street Rehabilitation 101-8550-510-77-22 Street maintenance project funding 4,000,000 4,000,000 - Traffic Engineering 101-8550-510-77-25 Replacement program for traffic signal controllers 40,000
101-8550-510-77-25 Truck regulatory vehicle and outfitting 60,000 101-8550-510-77-25 Remodel interior of sign and signal shop into public sa 624,000 724,000 40,000
Outdoor Warning Sirens 101-8550-510-77-27 1 New outdoor warning siren 43,000 101-8550-510-77-27 Replace 2 older outdoor warning sirens 44,000 87,000 65,000
IS 101-8552-510-76-22 Lifecycle - Computers/infrastructure/software 612,350 101-8552-510-76-22 New technology, services, and training 128,054 101-8552-510-76-22 GIS Upgrades 127,000 867,404 440,000
TOTAL CAPITAL OUTLAY REQUESTS / FUNDING 8,901,929$ 8,901,929$ 1,338,300$
170

2017ACCOUNT AMOUNT DIVISIONAL APPROVED
DEPARTMENT NUMBER DESCRIPTION OF REQUEST REQUESTED TOTALS FUNDINGVEHICLE REPLACEMENTSStreet Department 101-8551-510-78-06 Track loader/cycle trade (2) 10,000
101-8551-510-78-06 Tool cat/cycle trade (2) 10,000 101-8551-510-78-06 Tool cat (2011) 46,000 101-8551-510-78-06 Truck (Tandem) (2) 364,000 101-8551-510-78-06 Street sweeper 250,000 101-8551-510-78-06 1-ton (dump) (2) 85,000 101-8551-510-78-06 Asphalt recycler 100,000 101-8551-510-78-06 Riding mower (2) 22,000 101-8551-510-78-06 Steamer 60,000 947,000 801,000
Central Garage 101-8551-510-78-07 Sedans (5) 90,000 101-8551-510-78-07 Engineering - SUV/Truck (5) 125,000 101-8551-510-78-07 Motor Pool - SUV/Truck (4) 100,000 101-8551-510-78-07 Surveyor - SUV/Truck 35,000 350,000 280,000
Fire 101-8551-510-78-08 Quint (3rd of 3yr lease) 295,000 295,000 295,000 Police 101-8551-510-78-09 Patrol vehicles (10) 296,000
101-8551-510-78-09 Large patrol vehicle 35,000 331,000 331,000 TOTAL VEHICLE REPLACEMENTS 1,923,000 1,923,000 1,707,000
TOTAL GENERAL FUND 10,824,929$ 10,824,929$ 3,045,300$
CAPITAL PROJECT FUNDS
Transit Capital Grant Equipment404-2061-510.74-10 3 Replacement vehicles local share of grant 285,000 404-2061-510.74-10 1 Paratransit vehicle local share of grant 16,000 404-2061-510.74-10 2 Support vehicles local share of grant 11,000 312,000 312,000
Total Transit Capital Grant Equipment 312,000 312,000 312,000
Water - SRF & Sales Tax SRF Funded Water plant expansion 35,914,368SRF Funded Existing WTP upgrades 1,500,000SRF Funded Sheyenne pump station 850,000 38,264,368 2,226,000 Sales Tax funded Soda ash feeders 200,000Sales Tax funded Sludge truck 150,000Sales Tax funded Filter testing skid 70,000Sales Tax funded Safety/access project 72,200Sales Tax funded Fire rated door project 50,700Sales Tax funded Chemical feed pump replacement 40,000Sales Tax funded Sump pumps (boiler room) 17,000Sales Tax funded Water tower recondition 2,750,000Sales Tax funded Existing WTP upgrades 1,200,000Sales Tax funded RRVWSP Conceptual design 850,000Sales Tax funded Water distribution GIS 97,000Sales Tax funded Planning/master plan update 120,000 5,616,900 5,616,900
Water Sales Tax Fund 43,881,268 43,881,268 7,842,900
WW - SRF & Sales Tax SRF Funded Phase 1A WWTF Improvements 4,043,400 SRF Funded Phase II PER/Design & Regulatory 500,000 4,543,400 5,270,155 Sales Tax Funded Wastewater Facilities R & R 170,000 .Sales Tax Funded South Gravity Sewer (60th Ave. S. to 64th Ave. S.) 622,250Sales Tax Funded South Gravity Sewer (45th St. to I-29) 487,000Sales Tax Funded Effluent Force Main Improvements - Phase 2 450,000Sales Tax Funded Broadway Force Main Improvements 1,980,000Sales Tax Funded Lift Station #1 and #2 Improvements 460,360Sales Tax Funded Lift Stations R & R 377,000Sales Tax Funded WWTP Expansion - Phase II Facility Plan 270,000Sales Tax Funded Sewer Cleaning and Televising 135,000Sales Tax Funded Wastewater System GIS 89,000Sales Tax Funded Future Lift Stations & FM 250,000 5,290,610 5,290,610
Wastewater Sales Tax Fund 9,834,010 9,834,010 10,560,765
CAPITAL PROJECT FUNDS 54,027,278$ 54,027,278$ 18,715,665$
171

2017ACCOUNT AMOUNT DIVISIONAL APPROVED
DEPARTMENT NUMBER DESCRIPTION OF REQUEST REQUESTED TOTALS FUNDING
PROPRIETARY FUNDS
WATER Water Treatment Plant 501-3051-441-74-10 Laboratory pure water system 8,000$
501-3051-441-74-10 ATP test equipment 6,000 501-3051-441-74-10 SCADA VPN 2,500 501-3051-441-74-10 Control room chairs 4,200 501-3051-441-74-10 Fork lift (MWTP Chemical area) 45,000 501-3051-441-74-10 Sampling vehicle (small SUV) 18,000 501-3051-441-74-10 Snow plow 6,300 501-3051-441-74-10 Plow truck 25,000 501-3051-441-74-10 Floor cleaner - walk behind 3,500 501-3051-441-74-10 Fulton boiler pump 5,000 501-3051-441-74-10 Filter press rehabilitation 29,200 501-3051-441-74-10 Sludge belts (4) 13,000 501-3051-441-74-10 Oil-in-water analyzer 20,000 501-3051-441-74-10 UV-254 Analyzer 8,000 501-3051-441-74-10 Radar level sensors for water tower 25,000 501-3051-441-74-10 GSR Trees 10,000 228,700$ 228,700$
Water Mains/Hydrants 501-3052-441-74-10 Rubber tire backhoe 100,000 501-3052-441-74-10 Wheeled skid steer 30,000 501-3052-441-74-10 Curb rolling machine 4,500 501-3052-441-74-10 Concrete roller stamps 3,000 501-3052-441.74-11 Laptop PC's for vehicles (2) 4,000 501-3052-441-74-20 Half ton pickup 29,000 501-3052-441-74-30 Furniture replacement for M&H's office personnel 5,500 501-3054-441-90-40 Water main replacement 2,800,000 501-3054-441-90-40 Distribution system extension 157,000 3,133,000$ 3,133,000
Water Meters 501-3053-441.74-10 Meter replacement 160,000 501-3053-441.74-10 3" and 4" Meters 15,000 501-3053-441.74-10 No-lead materials 5,000 180,000 180,000
Total Water 3,541,700 3,541,700 3,541,700
WASTEWATER 521-3061-442-73-63 Sewer main replacement 600,000 521-3061-442-73-63 Wastewater service to West Fargo 1,000,000 521-3061-442-74-10 Future lift stations & force mains 120,000 521-3061-442-74-10 Roll off box 11,000 521-3061-442-74-10 Lift stations repairs 35,000 521-3061-442-74-10 Lift station pump rehab 25,000 521-3061-442-74-10 Street department vactor lease payment 80,000 1,871,000 1,871,000
Total Wastewater 1,871,000 1,871,000 1,871,000
STORM SEWER 524-3064-443.74-50 SCADA Systems on lift stations 30,000 524-3064-443.74-50 Variable frequency drive retrofits for lift stations 40,000 70,000 70,000
Total Storm Sewer 70,000 70,000 70,000
SOLID WASTE Solid Waste- Admin 531-3071-431-74-30 Office equipment 4,000
531-3071-431-74-30 Office chairs 2,000 531-3071-431-72-20 Building improvements 50,000 56,000 56,000
Solid Waste-Residential 531-3072-432-44-20 2017 Automated Truck Leased Unit 221,830 531-3072-432-74-10 Residential carts 75,000 296,830 296,830
Solid Waste-Commercial 531-3073-432-44-20 2017 Rear Load Truck Leased Unit 158,000 531-3073-432-74-10 Commercial containers 40,000 198,000 198,000
Solid Waste-Landfill 531-3074-433-74-10 Skid Steer 5,000 531-3074-433-73-10 New cell construction - WLF 1,100,000 531-3074-433-73-10 Cell closure 250,000 531-3074-433-73-10 Waste excavation 1,100,000 531-3074-433-73-10 Placement of reclaimed waste 300,000 531-3074-433-73-10 Expand gas system landfill 300,000 3,055,000 3,055,000
Solid Waste - Roll Off 531-3075-432-74-10 Roll off containers 30,000 30,000 30,000Solid Waste - Recycling 531-3076-432-44-20 Automated Side Load Truck Leased Units (2) 443,660
531-3076-432-73-10 Recycling drop site relocation 50,000 531-3076-432-74-10 Rear load containers 55,000 531-3076-432-74-10 Comingled recycling program carts (25,000) 1,125,000 1,673,660 1,673,660
Solid Waste - Hazardous Waste 531-3079-433-72-20 Building remodel 5,000 5,000 5,000Total Solid Waste 5,314,490 5,314,490 5,314,490
FORESTRY 541-3081-440-74-20 One ton flatbed truck 50,000 541-3081-440-74-20 2000 Brush Bandit chipper 60,000 110,000 110,000
Total Forestry 110,000 110,000 110,000
172

2017ACCOUNT AMOUNT DIVISIONAL APPROVED
DEPARTMENT NUMBER DESCRIPTION OF REQUEST REQUESTED TOTALS FUNDING
FARGODOME Building 570-7003-461.74-10 Parking lot & misc. concrete repair 15,000 570-7003-461.74-10 Suite furnishings re-model 270,000 570-7003-461.74-10 Handicap access corners 100,000 570-7003-461.74-10 Chiller overhaul/Eddy current testing 35,000 570-7003-461.74-10 Sound system & ticket office switches 35,000 570-7003-461.74-10 Building pickup & other outdoor vehicle 20,000 570-7003-461.74-10 Custodial equipment 20,000 570-7003-461.74-10 Equipment - food service 25,000 570-7003-461.74-10 Walk through metal detectors 175,000 570-7003-461.74-10 Spotlights 60,000 570-7003-461.74-10 F&B Point of sale system platform upgrade 200,000 570-7003-461.74-10 2016 Video Technology Upgrade 250,000 570-7003-461.74-10 Unallocated capital 35,000 570-7003-391.50-00 Capital payments #5 on turf/parking projects 1,208,368 2,448,368 2,448,368
Total Fargodome 2,448,368 2,448,368 2,448,368
Total Proprietary Fund Capital Requests 13,355,558$ 13,355,558$ 13,355,558$
TOTAL CAPITAL OUTLAY REQUESTS 78,207,765$ 78,207,765$ 35,116,523$
173

ADDITIONAL PERSONNEL Grant Funding EstimatedDepartment Div. No. REQUESTS / DESCRIPTION FTE's GRADE Amount Percent Grant Proceeds
GENERAL FUNDHR 101-0515 Benefit and Leave Coordinator 1.00 14-1 81,667 -
101-0515 Human Resource Assistant 0.50 7-1 26,464 0.50 26,464 Public Information 101-0525 Communications Internship 18,839 18,839 IS 101-0520 GIS Analyst 1.00 13-1 76,547 - Auditors 101-1010 Capital Financing Manager 1.00 17-1 99,635 - Planning 101-2010 Assistant Planner 1.00 12-1 71,861 10% Parking
20% CDBG 21,558 1.00 50,303
101-2010 Cultural Planner (0.50) 14-11 (47,650) (0.50) (47,650) Inspectors 101-2040 Electrical Inspector I 1.00 12-1 71,861 1.00 71,861
101-2040 PT Temporary Seasonal 8,612 8,612 Transit 101-2061 Public Information Specialist 1.00 12-1 71,861 -
101-2061 Eliminate Intern Position (14,531) - 101-2069 Transit Fleet & Facilities Manager 1.00 15-1 87,197 80% Federal
4% Moorhead 73,245 1.00 87,197
101-2069 Transit Maintenance Attendant II Bus Cleaner 1.00 8-1 56,140 80% Federal 4% Moorhead
47,158 1.00 56,140
Engineering 101-3015 Special Assessments Manager 1.00 15-1 87,197 1.00 87,197 101-3015 Special Assessment Tech I (1.00) 9-11 (63,159) (1.00) (63,159)
Fire 101-4010 Fire and Line Safety Educator/Data Analyst 1.00 14-1 81,512 - 101-4010 Firefighters 3.00 X11-1 202,117 -
Police 101-5010 Crimes Against Children Sergeant 1.00 15-4 93,754 1.00 93,754 101-5010 Police Officers 4.00 12-1 286,914 4.00 286,914 101-5010 Public Information Officer 1.00 12-1 71,728 - 101-5010 Street Crimes Unit Sergeant (promotion of police officer at 12-7) 15-1 4,675 4,675 101-5010 Additional step 12 to Police pay 12-12 65,520 65,520 101-5010 Additional step 13 to Police pay 12-13 65,000 65,000
Public Health 101-6011 Shelter/Detox Advocate 0.60 5-1 27,031 0.60 27,031 101-6020 Public Health Nurse 1.00 13-1 76,547 99% 75,782 1.00 - 101-6020 Increase .6 FTE of Public Health Nurse to 1.0 FTE 0.40 13-6 29,435 0.40 29,435 101-6090 WIC Nutritionist I 1.00 10-1 63,361 90% 57,025 1.00 -
Library 101-7010 Library Associate I Tech Services 1.00 4-1 44,619 1.00 44,619 101-7010 Library Outreach Associate 1.00 4-1 44,619 - 101-7010 PT Seasonal No Benefits 8,135 8,135
Commission 101-8001 Increase Mayor's Salary 19,739 19,739 PEC Approvals Various PEC Reclassifications and Market/Equity Requests 1,166,561 186,395
TOTAL GENERAL FUND 23.00 2,983,808 274,768 13.00 1,127,021
ENTERPRISE FUNDSWastewater 521-3061 Phased Reorganization 22,607 -
521-3061 Overtime 16,148 - Water Treatment 501-3051 Operator reorganization (July 2017 - December 2017) 43,060 -
501-3051 Engineering Intern 3,230 - 501-3051 Reclass Contract Maintenance Attendant II to FT Maintenance Attendant II - - 501-3051 Operator II 1.00 09-1 59,642 1.00 59,642 501-3053 Full Time Overtime 1,615 - 501-3059 Reclass Contract Water Meter Reader I to a FT Water Meter Reader - -
Fargodome Various PEC Reclassifications and Market/Equity Requests 18,034
TOTAL ENTERPRISE FUNDS 1.00 146,302 - 1.00 77,676
Total Staffing Budget Request 24.00 3,130,110 - 274,768 14.00 1,204,697
FUNDINGAPPROVED
CITY OF FARGO, NORTH DAKOTA DEPARTMENTAL PERSONNEL REQUESTS FOR 2017
174

Note: Only requests over $15,000 are noted belowINCREASE 2017
ACCOUNT (DECREASE) DIVISIONAL APPROVED
DEPARTMENT NUMBER DESCRIPTION OF REQUEST REQUESTED TOTALS FUNDING
GENERAL FUND
City Administrator 101-0510-403.38-68 Lobbyist expense 35,000$ 35,000$ 35,000$ Human Resources 101-0515-405.33-50 Medical consulting services for Employee Health Program 51,240
101-0515-405.38-99 Regional market study and employee engagement study 14,750 65,990 15,000 IS 101-0520-409.43-50 Maintenance service contracts 100,000 100,000 100,000 City Attorney 101-0530-430.33-25 Legal Services 17,000
101-0530-403.85-01 Claim Payments 20,000 37,000 37,000 City Prosecutor 101-0531-403.33-25 Contracted Prosecution Services 20,000 20,000 20,000 Baseball Stadium 101-1003-464.43-10 Building repairs 24,100 24,100 24,000 Municipal Court 101-1025-402.34-36 Credit card processing fees 20,000
101-1025-402.44-10 Land and building rents (30,000) (10,000) (10,000) Incarceration 101-1026-413.38-52 Prisoner care - centre inc. 50,000 50,000 50,000 General Support 101-1040-505-38-99 Economic Development Grant 25,000
101-1040-505.25-00 Workers Compensation 87,000 112,000 112,000 Buildings and Grounds 101-1050-409.42-05 Cleaning services contract (200,000)
101-1050-409.62-51 Electricity 22,500 (177,500) (177,500) Planning 101-2010-409.33-15 Downtown Contract Planning Services 100,000
101-2010-409.33-97 Parking enforcement 110,240 210,240 210,000 Transit 101-2061-491.33-86 Bus driving services contract increases 97,234
101-2061-491.33-86 New route to Sanford starting fall of 2017 134,604 101-2061-491.33-86 Fixed route Sunday service 558,000 101-2061-491.33-86 Late night service Thursday to Saturday 193,000 101-2061-491.33-86 Route 15 thirty minute service on Saturday 38,994 101-2069-491.43-30 Outside mechanic service 45,000 1,066,832 232,000
Traffic Engineering 101-3020-415.33-10 Architectural services 25,000 101-3020-415.33-44 Metro COG Local Match 29,560 54,560 30,000
Street Department 101-3025-423.44-10 Land and building rent on public works building (Bergseth) 115,000 115,000 115,000 Central Garage 101-3030-409.43-30 Outside mechanic repairs 16,800 16,800 15,000 Police 101-5010-411.38-17 Physicals 49,000
101-5010-411.38-99 Other services 26,000 101-5010-411.53-60 Communications - State Radio Terminals (16,800) 101-5010-411.44-30 Building Lease 250,000 101-5035-411.44-20 Equipment and Vehicle Rent 20,000 101-5035-411.61-40 General Supplies 43,000 371,200 371,200
Health Department 101-6010-451.38-99 Other Services - Opioid Crisis 50,000 101-6020-451.61-21 Pharmacy/Drugs 30,000 101-6035-451.38-11 Contract services (16,000) 64,000 34,000
Library 101-7010-463.61-70 Books & Periodicals - Increase based on strategic plan goals 43,000 101-7012-463.38-61 Cessation of security services (20,500) 22,500 22,500
City Commission 101-8001-403.68-10 Miscellaneous 15,000 15,000 15,000 Civic Center 101-8005-461.63-10 Beverages 15,400 15,400 15,400 Social Services & Arts 101-8540-464.38-99 Public arts and culture activities (Arts Partnership) 41,160 41,160 41,160 Transfer to Other Funds 101-9001-555-90-40 Transfer to Transit Capital Equipment Fund for Local Share of Grants 287,670
101-9001-555.90-40 Transfer to Fargo Project Captial Project Fund 150,000 437,670 437,670
TOTAL GENERAL FUND OPERATING REQUESTS 2,686,952$ 2,686,952$ 1,744,430$
CITY OF FARGO, NORTH DAKOTAGENERAL FUND DEPARTMENTAL OPERATING AND TRANSFER REQUESTS FOR 2017
175