The application of MPAS in TTFRI fileThe application of MPAS in TTFRI 06.03.2015 CWB, Taipei, Taiwan...
25
The application of MPAS in TTFRI 06.03.2015 CWB, Taipei, Taiwan Li-Huan Hsu, Li-Rung Hwang, Yi-Chiu Lin, Gong-Do Hwang, Taiwan Typhoon and Flood Research Institute (TTFRI), National Applied Research Laboratories, Taiwan
-
Upload
truonghanh -
Category
Documents
-
view
216 -
download
0
Transcript of The application of MPAS in TTFRI fileThe application of MPAS in TTFRI 06.03.2015 CWB, Taipei, Taiwan...

The application of MPAS in TTFRI
06.03.2015CWB, Taipei, Taiwan
Li-Huan Hsu, Li-Rung Hwang, Yi-Chiu Lin, Gong-Do Hwang,
Taiwan Typhoon and Flood Research Institute (TTFRI),National Applied Research Laboratories, Taiwan

• Introduction about TTFRI
• Mission of water resource management in TTFRI
• The Model for Prediction Across Scales (MPAS)
• Results of 5 days typhoon forecasts in 2013, 2014
• Results of spring rainfall simulations/outlooks
• Summary and future works
OUTLINE

Vision
Taiwan Typhoon and Flood Research Institute (TTFRI) is established to improve the key technologies for the observation, analysis, simulation and forecast of typhoon and flood, and to enhance the interdisciplinary hydro-meteorology researches. In addition, an advanced forecast system will be developed and systematic evaluated to help improve the prediction for the national meteorological and hydrological services and the national disaster reduction operation.
Bridge the gap between the academia and the government agencies
Introduction about TTFRI

Keep water in wet season !
Save water in dry season !
Annual
MAY – OCT
(Wet season)
NOV – APR
(Dry season)
Mission of water resource management
Taiwan rainfall distribution in spatial and temporal is uneven
(Climate 1989-2014)

Mission of water resource management
Historical drought event distribution in Taiwan (1973-2006)
(Figure provided by NCDR)
event numbers
FEB-APR
MAY-JUNE
JULY-SEP
OCT-NOV
DEC-FEB
ShihmenReservoir
watershed
ZengwenReservoir
watershed
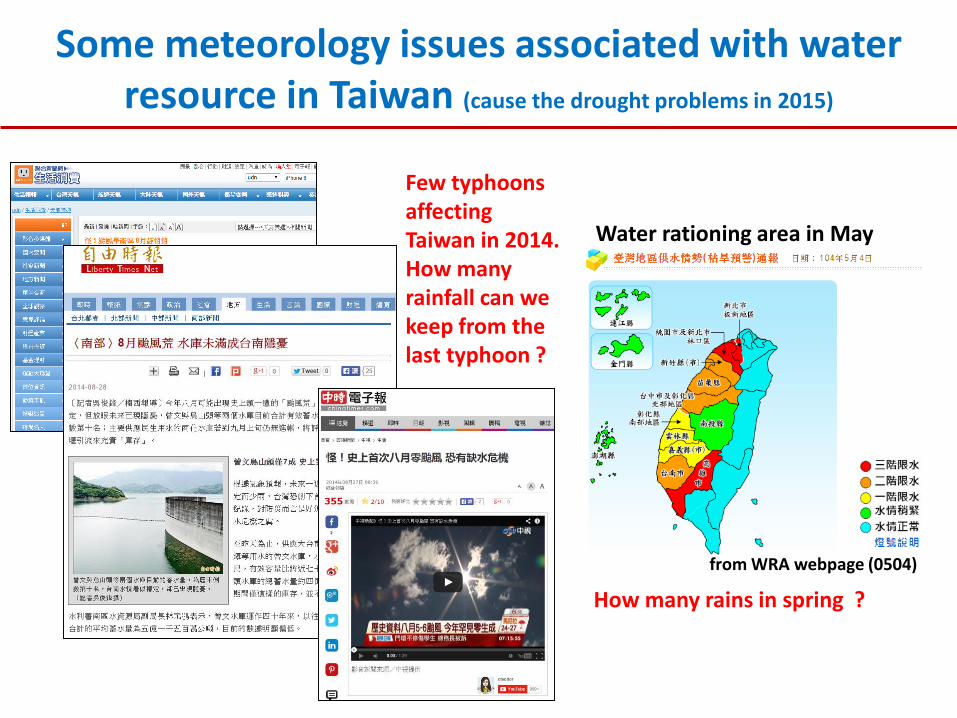
from WRA webpage (0504)
Some meteorology issues associated with water resource in Taiwan (cause the drought problems in 2015)
Few typhoons affecting Taiwan in 2014. How many rainfall can we keep from the last typhoon ?
How many rains in spring ?
Water rationing area in May

• Extend the typhoon forecast to 5-10 days, and provide the rainfall information in Taiwan during typhoon warning periods.
• Do the seasonal predictions for FEB-APR , and provide seasonal rainfall outlook information for water resource management .
Increase the resolution in WNP area with
variable resolution mesh
For the purpose of water resource management we want to:
NCAR MPAS meshes

• MPAS is an open sourced model with user-friendly documentations. The current MPAS release is version 4.0. Please refer to http://mpas-dev.github.io/ .
• Non-hydrostatic model with C-Grid Spherical Centroidal VoronoiMeshes.
• Unstructured variable resolution mesh allows smooth scale transition; potential application when computational resources are limited
• A subset of the Advanced Research WRF (ARW) model physics
• Data assimilation for MPAS is available as an ensemble Kalmanfilter (EnKF) implemented through Data Assimilation Research Testbed (DART) in 2015.
The Model for Prediction Across Scales (MPAS)

• WNP Typhoon Experiments in TTFRI – MPAS V1.5
– 10 days forecast experiments
– Preliminary results of 5 days performance for typhoon cases in 2013 and 2014.
Experiment design for typhoon experiments
grid resolution : 15 – 60 kmcenter : 20N 140E
TC name dtg numbersRainfall analysis period
(include sea warning period)TRAMI (2013) 2 082003-082300UTC
KONG-REY (2013) 5 082700-083000UTCUSAGI (2013) 7 091900-092300UTC
MATMO (2014) 5 072100-072400UTC
Domain resolution
• Model settings :– NCEP GFS initialization
– WSM6 microphysic scheme
– Tiedtke convection scheme
– No DA

Tracks and rainfall in typhoon experiments
CWB OBS
CWB OBS
rainfall analysis period082000-082300 UTC
CWB OBS
CWB OBS
rainfall analysis period091900-092300 UTC
rainfall analysis period082700-083000 UTC
rainfall analysis period072100-072400 UTC

Anomaly correlation coefficient with FNL
850hPa Temp NH (20N-80N)
TRAMIKONGREYUSAGIMATMOMean
500hPa Height NH (20N-80N)

Average typhoon track errors (2013, 2014)Along-Track and Cross-Track errors
Typhoon track verification
• The averaged 24h, 48h, 72h and 120h track errors are about 100 km, 150 km, 240 km and 350 km.
• The numbers of left/right and slow/fast cases are similar, but the errors of slower cases are larger.
(km)
(km)

TS score for forecast day 1, day 2 and day3
TS score for 24h, 48h, and 72h accumulated rainfall
TS score for total rainfall period (~ 72h)
Typhoon rainfall verification
• The TS score of forecast day 1 exceed 0.39 at threshold 200mm/24h.
• The TS score for 72h accumulated rainfall is better, but is similar with others for higher threshold.
• The TS score of total rainfall period at threshold 200mm exceed 0.42 for 4 typhoon cases in 2013, 2014.
day1
day2
day3
24h
48h
72h

• Model settings– MPAS V1.5
– 120 km horizontal uniform resolution
– 120 days of Spring simulation
– Kain-fritsch convection scheme
– No data assimilation
• Ensemble experiments settings– 2005-2014 Hindcast experiments
• 10 ensemble members per year
• I.C.s : 01/01-01/10 NCEP GFS analysis
• B.C.s: NCEP NOAA RTG SST analysis
– 2014, 2015 Forecast experiments
• 20 ensemble members
• I.C.s : 01/01-01/10 NCEP GFS analysis (10)
• B.C.s: NOAA CFSV2 7248 hours forecast SST from different date(2).
Experiment design for spring rainfall experiments

Monthly mean anomaly correlation coefficient with FNL(2014, 2015 forecast)
2014
2015

FEB MAR
FEB-APR
Precipitation probability for 2014
below aboveModel climate : 2005-2014
normal
(%)
APR

Precipitation probability for 2015FEB MAR
APR
below abovenormal
(%)
FEB-APR
Model climate : 2005-2014
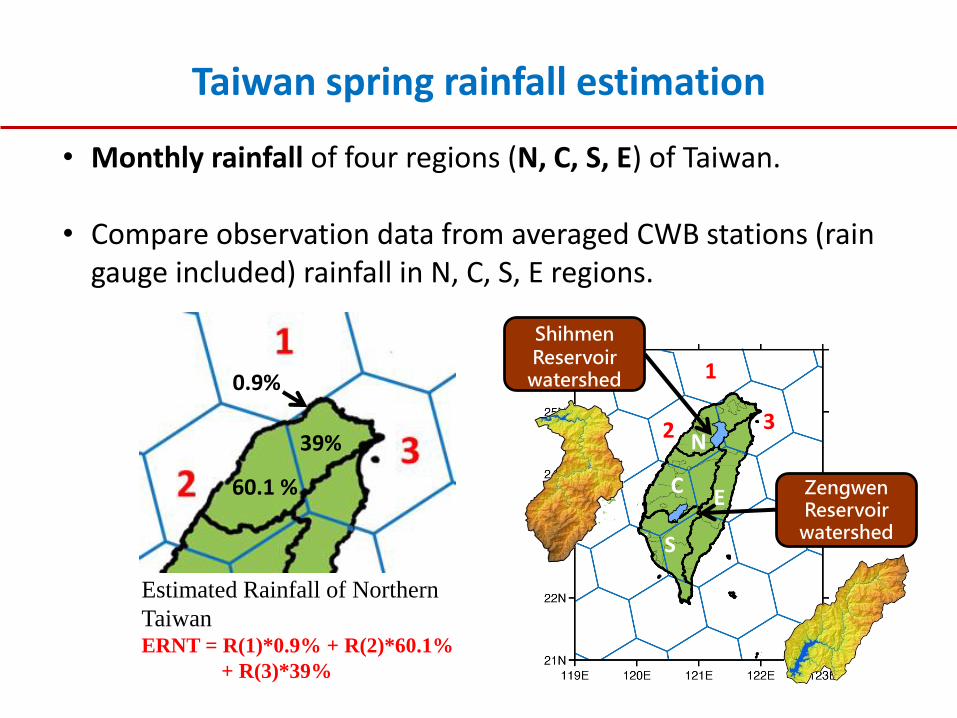
• Monthly rainfall of four regions (N, C, S, E) of Taiwan.
• Compare observation data from averaged CWB stations (rain gauge included) rainfall in N, C, S, E regions.
60.1 %
39%
0.9%
Estimated Rainfall of Northern
TaiwanERNT = R(1)*0.9% + R(2)*60.1%
+ R(3)*39%
Shihmen
Reservoir watershed
ZengwenReservoir
watershed
1
2 3N
C
S
E
Taiwan spring rainfall estimation
N
C
S
E
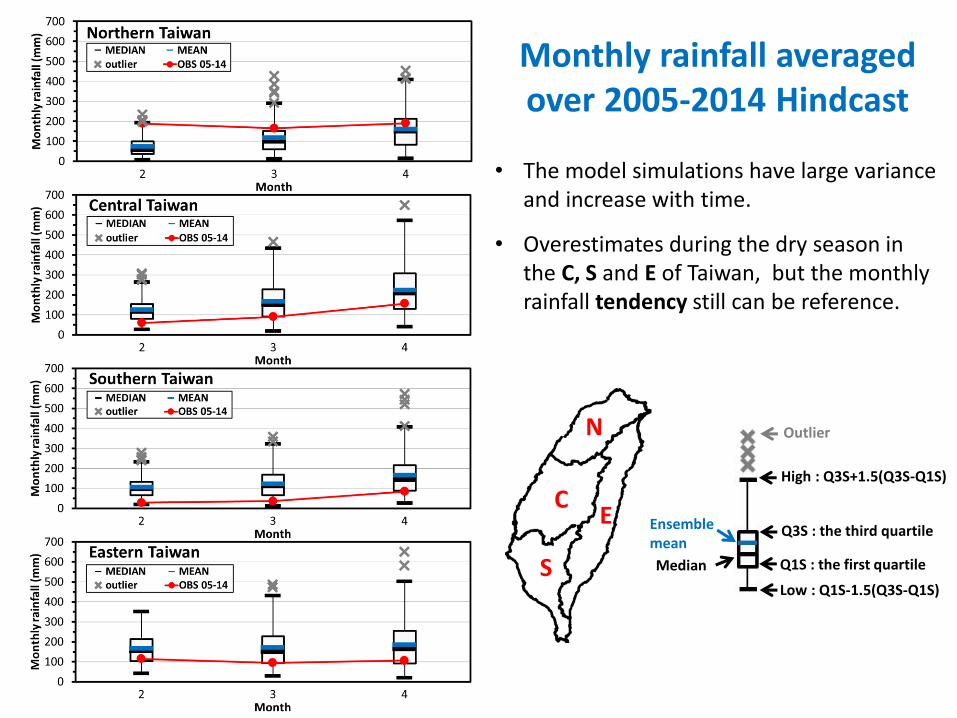
Monthly rainfall averaged over 2005-2014 Hindcast
• The model simulations have large variance and increase with time.
• Overestimates during the dry season in the C, S and E of Taiwan, but the monthly rainfall tendency still can be reference.
Ensemble mean
Median
Q3S : the third quartile
Q1S : the first quartile
High : Q3S+1.5(Q3S-Q1S)
Low : Q1S-1.5(Q3S-Q1S)
Outlier
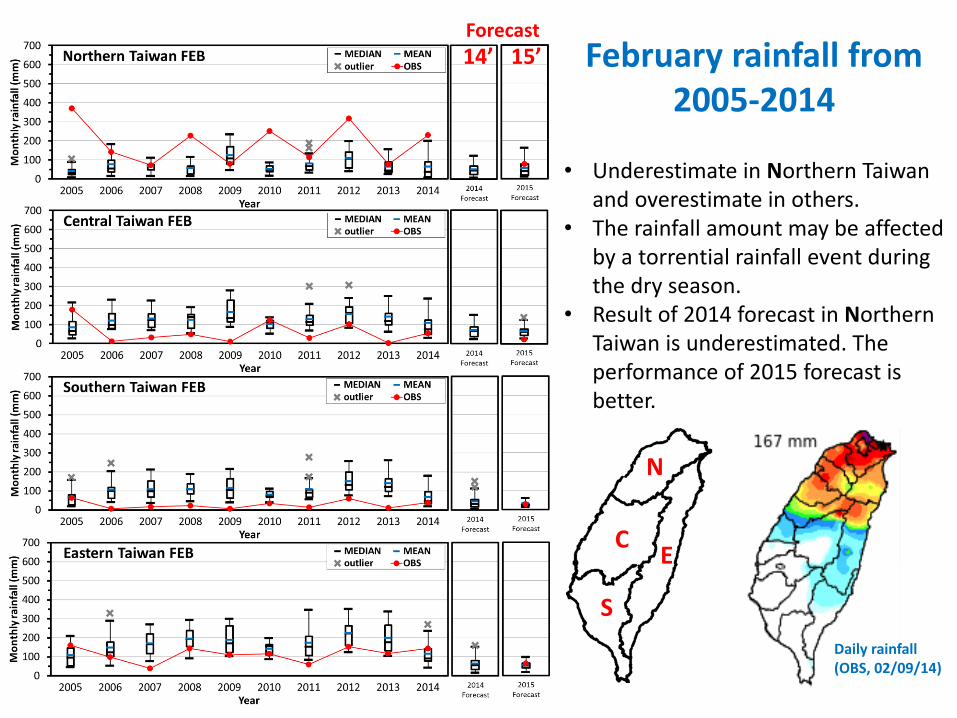
February rainfall from 2005-2014
• Underestimate in Northern Taiwan and overestimate in others.
• The rainfall amount may be affected by a torrential rainfall event during the dry season.
• Result of 2014 forecast in Northern Taiwan is underestimated. The performance of 2015 forecast is better.
Daily rainfall (OBS, 02/09/14)
Forecast
N
C
S
E
14’ 15’

March rainfall from 2005-2014
• Overestimate in C, S and E of Taiwan.
• The model can catch the interannual variation of monthly rainfall in Northern Taiwan.
• Result of 2014 forecast in Northern Taiwan is underestimated. The rainfall in C, S of Taiwan is slightly overestimate in 2015.
N
C
S
E
Forecast
14’ 15’

April rainfall from
2005-2014
• The rainfall tendency of April can be represented by model simulation.
• Overestimate in C, S and E of Taiwan.• Results of 2014, 2015 forecasts in C,
S Taiwan are overestimated.
N
C
S
E
Forecast
14’ 15’
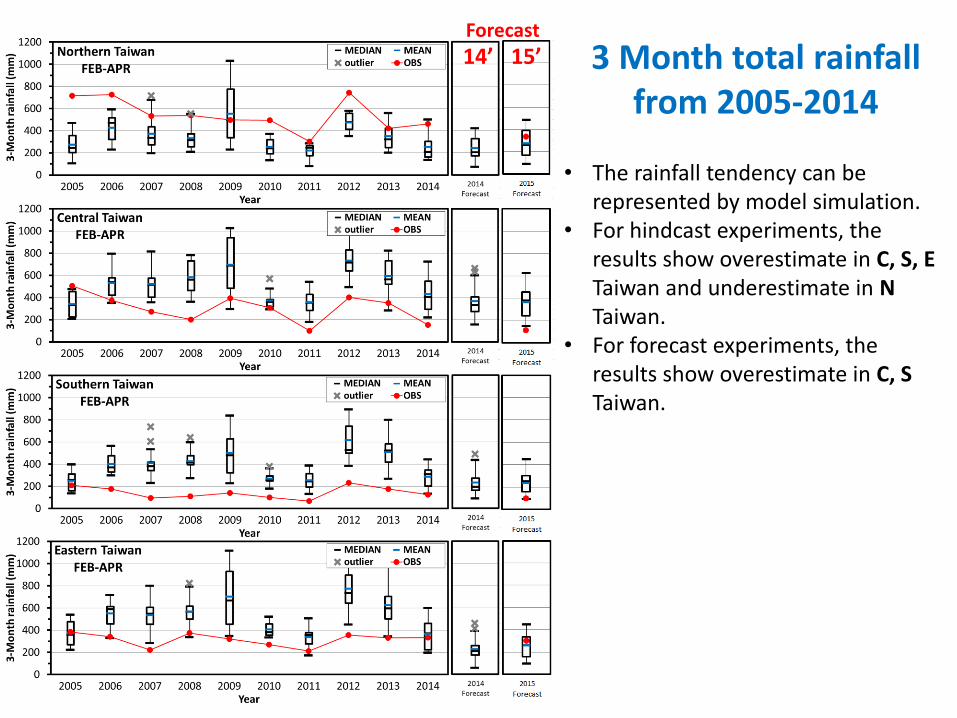
3 Month total rainfall from 2005-2014
• The rainfall tendency can be represented by model simulation.
• For hindcast experiments, the results show overestimate in C, S, E Taiwan and underestimate in N Taiwan.
• For forecast experiments, the results show overestimate in C, S Taiwan.
Forecast
14’ 15’

• Four typhoon cases are analyzed in 2013, 2014 with MPAS. TC track errorsare about 100 km, 150 km, 240 km and 350 km for 24h, 48h, 72h and120h track forecast. Some typhoon forecasts will behave slowertranslation speed than the observation.
• The TS score of forecast day 1 exceed 0.39 at threshold 200mm/24h. TheTS score of total rainfall period at threshold 200mm exceed 0.42.
• The spring rainfall simulations have large variance and increase with time,but the rainfall tendency of April can be represented by model simulation.
• The rainfall amount may be affected by a torrential rainfall event duringthe dry season. MPAS results show that the annual trend of spring rainfallcan be reproduced, but is overestimate in C, S Taiwan and underestimatein N Taiwan.
Summary
Future works We are currently updating the MPAS version, and evaluate more typhoon
cases The impact of Increasing horizontal grid resolution to seasonal forecast The application of rainfall information to hydrologic model

ENDThank you for your attention