The Application of Mass Spectrometry Techniques for the ...
62
University of Tennessee, Knoxville University of Tennessee, Knoxville TRACE: Tennessee Research and Creative TRACE: Tennessee Research and Creative Exchange Exchange Masters Theses Graduate School 12-2017 The Application of Mass Spectrometry Techniques for the Benefit The Application of Mass Spectrometry Techniques for the Benefit of Tungsten Impurity Transport Research and Nuclear Fusion of Tungsten Impurity Transport Research and Nuclear Fusion Jonah David Duran University of Tennessee, [email protected] Follow this and additional works at: https://trace.tennessee.edu/utk_gradthes Recommended Citation Recommended Citation Duran, Jonah David, "The Application of Mass Spectrometry Techniques for the Benefit of Tungsten Impurity Transport Research and Nuclear Fusion. " Master's Thesis, University of Tennessee, 2017. https://trace.tennessee.edu/utk_gradthes/5014 This Thesis is brought to you for free and open access by the Graduate School at TRACE: Tennessee Research and Creative Exchange. It has been accepted for inclusion in Masters Theses by an authorized administrator of TRACE: Tennessee Research and Creative Exchange. For more information, please contact [email protected].
Transcript of The Application of Mass Spectrometry Techniques for the ...

University of Tennessee, Knoxville University of Tennessee, Knoxville
TRACE: Tennessee Research and Creative TRACE: Tennessee Research and Creative
Exchange Exchange
Masters Theses Graduate School
12-2017
The Application of Mass Spectrometry Techniques for the Benefit The Application of Mass Spectrometry Techniques for the Benefit
of Tungsten Impurity Transport Research and Nuclear Fusion of Tungsten Impurity Transport Research and Nuclear Fusion
Jonah David Duran University of Tennessee, [email protected]
Follow this and additional works at: https://trace.tennessee.edu/utk_gradthes
Recommended Citation Recommended Citation Duran, Jonah David, "The Application of Mass Spectrometry Techniques for the Benefit of Tungsten Impurity Transport Research and Nuclear Fusion. " Master's Thesis, University of Tennessee, 2017. https://trace.tennessee.edu/utk_gradthes/5014
This Thesis is brought to you for free and open access by the Graduate School at TRACE: Tennessee Research and Creative Exchange. It has been accepted for inclusion in Masters Theses by an authorized administrator of TRACE: Tennessee Research and Creative Exchange. For more information, please contact [email protected].
To the Graduate Council:
I am submitting herewith a thesis written by Jonah David Duran entitled "The Application of
Mass Spectrometry Techniques for the Benefit of Tungsten Impurity Transport Research and
Nuclear Fusion." I have examined the final electronic copy of this thesis for form and content
and recommend that it be accepted in partial fulfillment of the requirements for the degree of
Master of Science, with a major in Nuclear Engineering.
David C. Donovan, Major Professor
We have read this thesis and recommend its acceptance:
John D. Auxier II, Lawrence H. Heilbronn
Accepted for the Council:
Dixie L. Thompson
Vice Provost and Dean of the Graduate School
(Original signatures are on file with official student records.)

The Application of Mass Spectrometry Techniques for the Benefit of Tungsten Impurity
Transport Research and Nuclear Fusion
A Thesis Presented for the Master of Science
Degree The University of Tennessee, Knoxville
Jonah David Duran December 2017

ii
Copyright © 2017 by Jonah David Duran All rights reserved.

iii
ACKNOWLEDGEMENTS
Thank you to those who have fostered my interest in academics and science from day one. Your constant love and support is never forgotten.

iv
ABSTRACT Several barriers prevent the capability of on the grid nuclear fusion power
plants. With the research presented here, these issues are confronted and the work makes progress towards addressing known gaps in the fusion community’s understanding of material and impurity migration in fusion devices. Recent successes that were achieved during the DIII-D metal rings campaign of the summer in 2016 must continue to develop in preparation for testing on additional plasma devices. During this campaign, impurities generated from the metal tiles of DIII-D were collected on graphite collector probes. These were then studied with several techniques, and it has been shown that traditional analytical techniques such as Rutherford backscattering and inductively coupled plasma mass spectrometry (ICP-MS) are able to determine the presence and isotopic ratios of heavy metals. Adding to these tools, an in depth study of laser ablation mass spectrometry (LAMS) is necessary. Methods have been developed so that they may be used in direct solid sample analysis of graphite collector probes using LAMS. With these procedures in place, a comparative study has be completed between the LAMS system and traditional aqueous intake ICP-MS. With these results in hand, empirical evidence may be used to benchmark computational techniques for interpretive modeling of impurity transport in fusion devices like the DIVIMP-OEDGE-WallDYN code.

v
TABLE OF CONTENTS Chapter One Introduction and General Information .............................................. 1
Energy Demand on the Rise ............................................................................. 1 Nuclear Fusion .................................................................................................. 1 Project Motivation and Overview ....................................................................... 4 ICP-MS .............................................................................................................. 7
ICP-TOF-MS .................................................................................................. 7 ICP-CRC-Q-MS ............................................................................................. 9 LAMS ............................................................................................................. 9
DIVIMP-OEDGE-WallDYN ................................................................................ 9 Chapter Two Literature Review .......................................................................... 11
Mass Spectrometry ......................................................................................... 11 Sample Introduction ..................................................................................... 11 Plasma Box.................................................................................................. 13 Cones .......................................................................................................... 13 Ion Lenses and Reaction Cells .................................................................... 14 Detectors ..................................................................................................... 14
Sample Preparation ......................................................................................... 15 Laser Ablation ................................................................................................. 16
Standards .................................................................................................... 16 Methods and Technique .............................................................................. 17
Graphite Collector Probes ............................................................................... 17 Chapter Three Materials and Methods ................................................................ 19
DIII-D Experimental Details ............................................................................. 19 RBS Analysis................................................................................................... 19 ICP-TOF-MS Analysis ..................................................................................... 21 LA-ICP-QMS Analysis ..................................................................................... 21
UP-213 Specifications ................................................................................. 21 Gas Lines..................................................................................................... 23 Mass Hunter ................................................................................................ 24 Tuning Materials and Sampling Methods ..................................................... 26
Chapter Four Results and Discussion ................................................................. 27 DIII-D Probe Exposures .................................................................................. 27 SNL Rutherford Backscattering Spectrometry Analysis .................................. 30 ICP-TOF-MS Analysis ..................................................................................... 32 LAMS Analysis ................................................................................................ 34
Chapter Five Conclusions and Recommendations ............................................. 44 List of References ............................................................................................... 45 Appendix ............................................................................................................. 49 Vita ...................................................................................................................... 53
vi
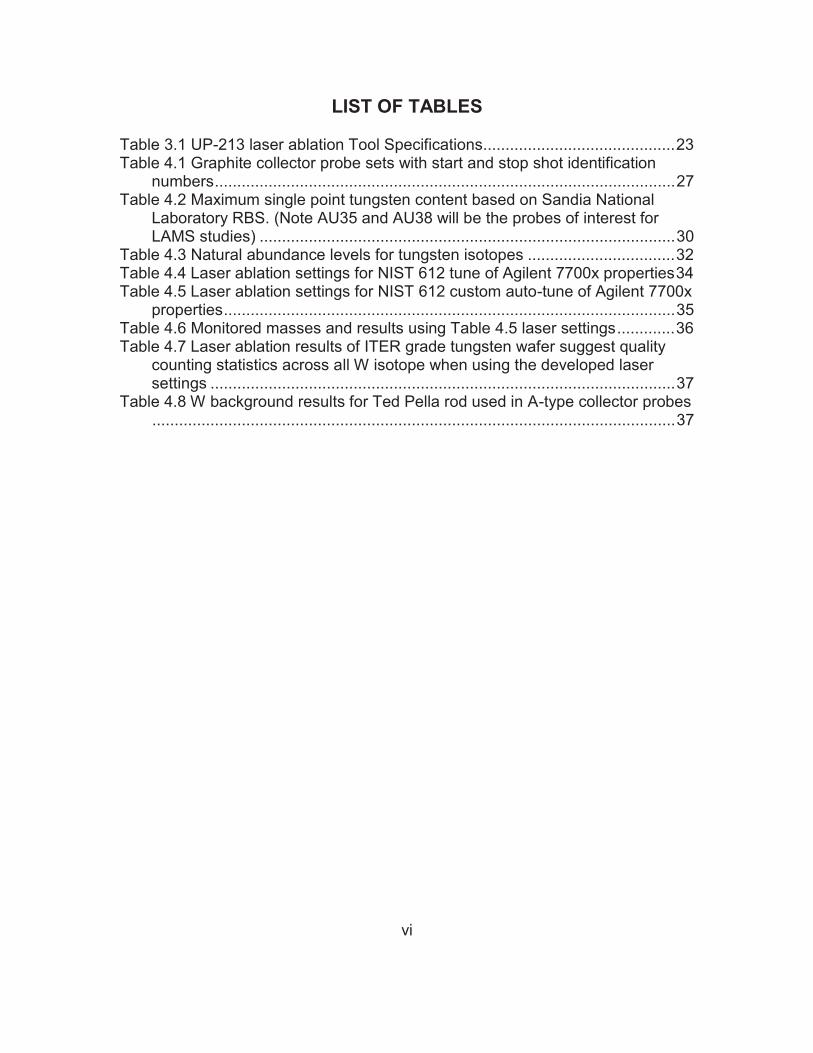
LIST OF TABLES Table 3.1 UP-213 laser ablation Tool Specifications........................................... 23 Table 4.1 Graphite collector probe sets with start and stop shot identification
numbers ....................................................................................................... 27 Table 4.2 Maximum single point tungsten content based on Sandia National
Laboratory RBS. (Note AU35 and AU38 will be the probes of interest for LAMS studies) ............................................................................................. 30
Table 4.3 Natural abundance levels for tungsten isotopes ................................. 32 Table 4.4 Laser ablation settings for NIST 612 tune of Agilent 7700x properties 34 Table 4.5 Laser ablation settings for NIST 612 custom auto-tune of Agilent 7700x
properties ..................................................................................................... 35 Table 4.6 Monitored masses and results using Table 4.5 laser settings ............. 36 Table 4.7 Laser ablation results of ITER grade tungsten wafer suggest quality
counting statistics across all W isotope when using the developed laser settings ........................................................................................................ 37
Table 4.8 W background results for Ted Pella rod used in A-type collector probes ..................................................................................................................... 37

vii
LIST OF FIGURES Figure 1.1 This graphic shows the fusion triple product achieved on different
magnetic fusion facilities [6] ........................................................................... 3 Figure 1.2 Description of SOL, Separatrix, and Divertor within a tokamak [12] .... 6 Figure 1.3 Illustrative overview of several of the modern available ICP-MS
platforms [15] ................................................................................................. 8 Figure 2.1 Illustrative overview of Agilent 7700 ICP-MS platform ....................... 12 Figure 3.1 Image of Collector Probes inserted into the DIII-D tokamak for impurity
studies ......................................................................................................... 20 Figure 3.2 Schematic of the DIII-D tokamak for impurity studies during the metal
rings campaign ............................................................................................ 20 Figure 3.3 Assembly of the LA-ICP-CRC-QMS station at ORNL Stable Isotope
Division with ESI UP-213nm YAG laser ablation unit on left and Agilent 7700x Quadrupole ICP-MS unit on right ...................................................... 22
Figure 3.4 Comparison of spot area using Argon and Helium as carrier gas. Helium is shown to increase sample transport efficiency. The legend line is 50μm in length [33] ...................................................................................... 25
Figure 4.1 RBS W content profile for probe AD15. Emphasis is placed on the scraped area in order to highlight the lack on W content seen in the area .. 33
Figure 4.2 RBS W content profile for probe BU2. Similar decreasing trend lines are seen on all probes ................................................................................. 33
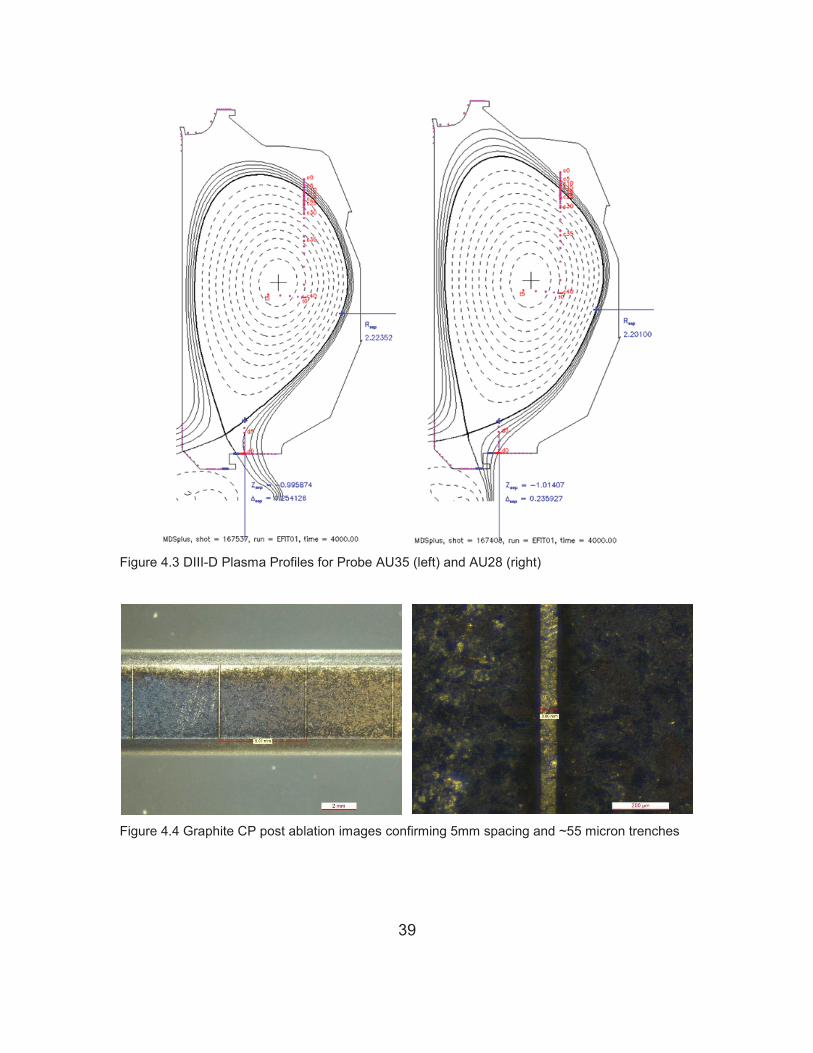
Figure 4.3 DIII-D Plasma Profiles for Probe AU35 (left) and AU28 (right) ........... 39 Figure 4.4 Graphite CP post ablation images confirming 5mm spacing and ~55
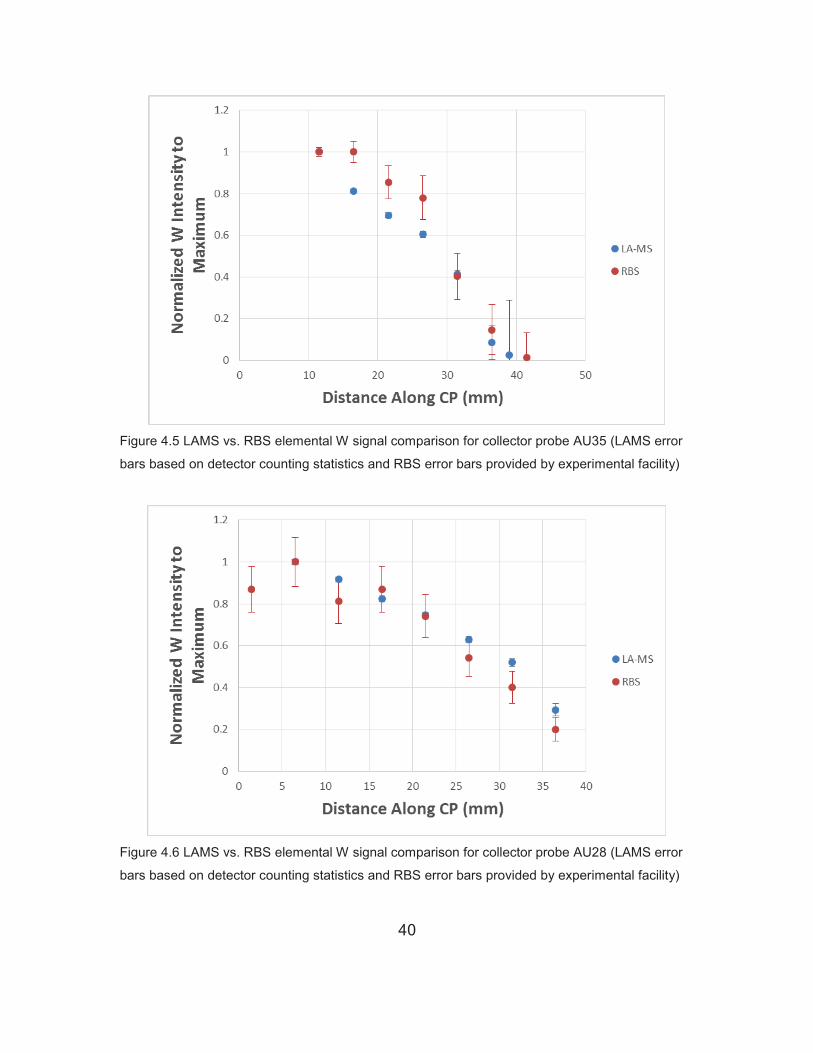
micron trenches ........................................................................................... 39 Figure 4.5 LAMS vs. RBS elemental W signal comparison for collector probe
AU35 (LAMS error bars based on detector counting statistics and RBS error bars provided by experimental facility) ......................................................... 40
Figure 4.6 LAMS vs. RBS elemental W signal comparison for collector probe AU28 (LAMS error bars based on detector counting statistics and RBS error bars provided by experimental facility) ......................................................... 40
Figure 4.7 Isotopic enrichment profile for probe AU35 (error bars based on detector counting statistics) ......................................................................... 41
Figure 4.8 Isotopic enrichment profile for probe AU28 (error bars based on detector counting statistics) ......................................................................... 41
Figure 4.9 Illustrates a schematic example of a natural river system for which the relative fractions of natural and anthropogenic metal sources can be quantified by metal isotope signatures [35] .................................................. 43
Figure 4.10 Illustrates an example where fractions of W content from each metal ring may be added together to determine the total W signal measured on a graphite collector probe ............................................................................... 43
1
CHAPTER ONE INTRODUCTION AND GENERAL INFORMATION
Energy Demand on the Rise
Around the globe, the demand for energy is on the rise. With greater implementation of technology in everyday life, there is a need for greater production of electricity. Personal electronic devices, a growing population, developing countries, and many more aspects of this world are adding to these demands. Projections show, with varying dependence on economic growth, electricity demand has the potential to reach an increase of 56% by 2040 [1, 2]. If fossil fuels are used to meet these demands, the future outlook may be grim [3]. This introduces the opportunity to meet the rise in need for energy with more sustainable options while offsetting the carbon footprint that has been generated.
Solar, wind, biomass, geothermal, hydropower, nuclear fission and fusion
all have the potential to assist in meeting these needs without the production of harmful greenhouse gasses [4]. While many of these are being implemented both privately and publicly, many of these options only function under specific conditions. Nuclear fusion, however, has the unique opportunity to provide large quantities of electricity with readily available fuel while minimizing the resulting amounts of irradiated materials and essentially eliminating greenhouse gas production. However, the structures of nuclear fusion facilities would need to be monitored for nearly 100 years in order to account for ten half-lives of the tritium isotope that is planned to be used as a fuel in the reactors. Compared to fission fuel storage, this is much more manageable as we can plan for several decades into the future rather than attempting to predict and protect the plans of humans many centuries from now [5]. Another concern with fusion facilities relates to the worst case scenario for a fusion plant. This incident is nowhere near the destructive potential of a nuclear fission meltdown scenario. Instead, an airborne tritium release to the public is considered the largest public hazard. In the end, fusion systems positives outweigh the negatives and have the theoretical energy output necessary to place Earth’s energy economy on a more safe and sustainable path.
Nuclear Fusion
Nuclear fusion experiments began in the 1940’s when researchers were starting the search for ways in which fusion reactions could be produced and controlled for the benefit of energy production on Earth. While the underlying physics show that fusion is feasible, there are many material and engineering

2
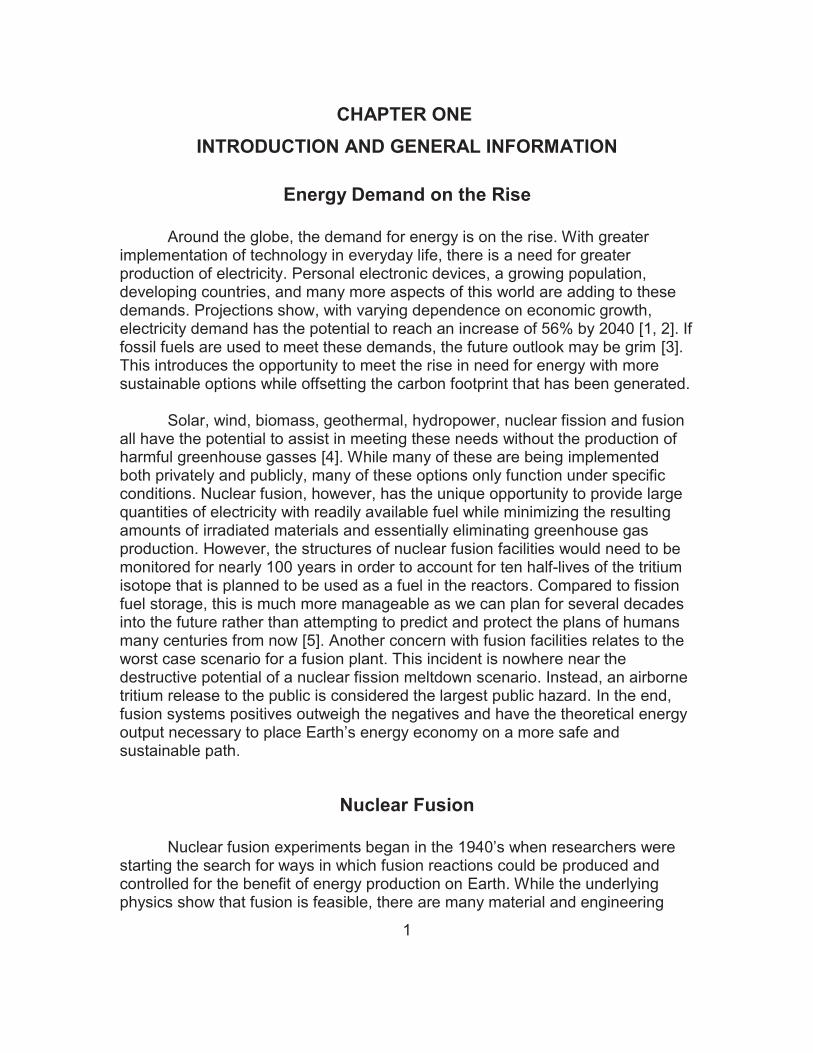
challenges that remain between current fusion research reactors and a fully functional nuclear fusion power plant. The International Thermonuclear Experimental Reactor (ITER), Joint European Torus (JET), Korean Superconducting Tokamak Reactor (KSTAR), Experimental Advanced Superconducting Tokamak (EAST), and many other facilities are tackling these issues in an attempt to prepare for the first demonstration that nuclear fusion is capable of generating electricity. The DEMOnstration Power Station (DEMO) is the next concept, which will build on the discoveries that are uncovered with ITER and other facilities while introducing methods for generating electricity. As seen in figure 1.1, there have been many different experiments over the years that are for the benefit of fusion energy research. The triple product listed as fusion product on the ordinate axis is an essential factor that is representative of the quality of a fusion reactor. In order for a fusion experiment to reach a self-sustaining region called ignition, this triple product must be sufficiently high to ensure that power produced exceeds radiative power losses. This may be seen in equation 1.1.
1.1
In this equation, represents the fuel ion density, is the fuel temperature, and stands for the energy confinement time. While this equation does not consider the power that is needed to upkeep the plasma current in a tokamak, it is still the primary consideration for fusion experiments and the bar which must be met for fusion to be a viable energy source.
The graph shows clearly that new facilities performed better than previous
ones. The present large machines, from the point of view of the fusion product, have now achieved their engineering limits so that only the next step facility, ITER, can bring about decisive progress. As seen in figure 1.1, ITER is expected to reach the highest triple product values when compared to any current experiments. In addition, ITER hopes to reach what is called breakeven. This is where the input energy is equal to the output energy of the systems. If this is proven, DEMO will then continue towards proving that a fusion reactor may be connected to a Rankine or steam turbine cycle in order to generate electricity through a deuterium (D) and tritium (T) reaction seen in the equations 1.2.
1.2
3
Figure 1.1 This graphic shows the fusion triple product achieved on different magnetic fusion
facilities [6]

4
While the DD reactions in equations 1.2 are currently used for many experiments, DT reactions are considered the most likely candidate for fusion energy. With the production of 3.54 MeV alphas ( ), the fusion reaction may be self-heating. This has the capability of sustaining the high plasma temperatures required for ignition. However, with this reaction, reactive products are generated with the incident neutrons. These products are in much lower levels than current nuclear fission reactors, and there are less dangers involved with nuclear fusion. This sort of reaction introduces several engineering and materials issues that must be addressed before the construction of DEMO. These include boundary and divertor plasma physics, plasma-surface interactions, plasma facing components, and compatibility of boundary solutions with attractive core plasmas [7]. These stand between the current experimental reactors and nuclear fusion power plants.
Project Motivation and Overview The research and projects presented in this thesis seeks to address several issues through studies being led by Dr. David Donovan from the University of Tennessee, Knoxville (UTK) and Dr. Ezekial Unterberg from Oak Ridge National Lab (ORNL) while working towards addressing known gaps in the fusion community’s understanding of material and impurity migration in fusion devices. These innovative studies include the metal rings campaign of 2016 when working with the DIII-D fusion research reactor in San Diego, CA. The primary mission of the DIII-D Research Program is to “establish the scientific basis for optimization of the tokamak approach to fusion energy production. The DIII-D Program is a cornerstone element in the national fusion program strategy” [8]. Currently the program is in collaboration with nearly 90 institutions and therefore operates as a user facility. With these opportunities, we have been able to secure time with the facility for impurity transport studies using graphite collector probes.
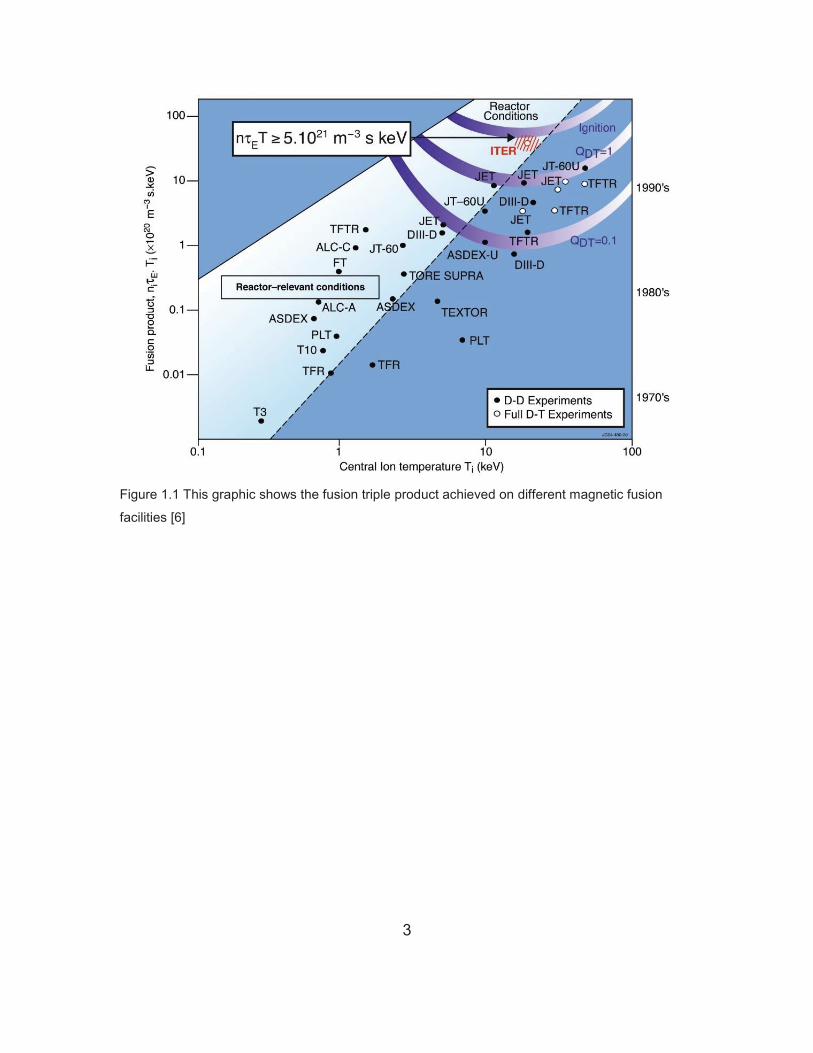
For experiments with DIII-D, ORNL produced two full rings of TZM (molybdenum alloyed with 0.5% titanium and 0.08% zirconium) Molybdenum tiles, which introduced a first of its kind method that calls for using isotopic tracer particles in particle migration studies for a magnetic fusion device. One ring of tiles was coated with natural tungsten (W) using a chemical vapor deposition (CVD) along with another, which was coated at ORNL using electron beam physical vapor deposition with 93.5% isotopically enriched W-182 [9]. Once the tiles were inserted into the divertor of DIII-D, the plasma strike point was directed towards these metal tiles so that W impurities would generate and transport throughout the tokamak. In order to gather information on the traveling impurities, graphite collector probes were created based on previous studies [10] and inserted into the scrape off layer (SOL) of the device near the midplane of the

5
vessel for quantitative measurements of high-Z impurities in the SOL plasma near the main separatrix [11].These terms are described in figure 1.2.
Many probes underwent this procedure and were then removed and stored for later analysis using Rutherford backscattering spectroscopy (RBS) and inductively coupled plasma time-of-flight mass spectrometry (ICP-TOF-MS). The RBS studies, performed at Sandia National Laboratory (SNL) have proven the viability of this technique as W concentrations on the collector probes have been measured up to 0.65 ± 0.03 x 10¹⁵ W-atoms/cm2 [13]. Additionally, a decreasing trend for W concentration has been observed from the tip to the base of the collector probes. Considering RBS is a non-destructive technique, these collector probes were then shipped to UTK where ICP-TOF-MS studies have been completed in conjunction with the Radiochemistry Center of Excellence and the Institute for Nuclear Security. These studies have revealed the isotopic ratios of the deposited W along the length of the probes which was found when using RBS. These ratios cover a wide range of values across the many probes that were tested. Some probes show 182W signatures at natural levels, 26.5%, while others have enriched signatures up to 92.5%. This suggests multiple sourcing mechanisms of W impurities which are dependent on the strikepoint of the plasma in DIII-D.
With the successes seen in the metal rings campaign, this research must
continue to develop and be tested on other devices in order to assist in bridging the gaps found in the fusion community’s understanding of material and impurity migration in fusion devices. Currently, ORNL has a laser ablation inductively coupled plasma mass spectrometry (LAMS) system which may be utilized for direct solid sample analysis and characterization of the graphite collector probes. This technique was not readily available at the beginning of the metal tile campaign. However, with laser ablation, there is no longer a need for the timely and hazardous W-digestion chemistry needed for traditional aqueous sample introduction systems. Instead quick turnaround times and W-ratio analyses may be completed on a micro-destructive scale. These results may yield a similar quality of data, when compared to conventional ICP-MS systems, while also providing an expedited approach to determining the elemental and isotopic abundances of W and Mo.
With these tools at the ready, future engineering efforts may be conducted for revised collector probes. This would start with conceptual designs and develop into a physical prototype for future testing on plasma devices. Different type of probes would be created and be used such as a temporally-resolved, spatially-distributed measurements of high-Z elements on a tile surface deposition probe (TSDP). Then the developed analysis methods may be used to characterize the collected materials on the probes.
6
Figure 1.2 Description of SOL, Separatrix, and Divertor within a tokamak [12]
7
Overall this work is of high importance to the fusion community as it also aims to provide experimental evidence and results that may be tied into modelling efforts which are currently under way within the research groups at UTK. This work is directly relevant to ongoing fusion research priorities at both ORNL and UTK. Previous work at UTK included the use of ICP-MS along with the accompanying development of methods for dissolution and sample introduction. There the stable isotope mixing model (SIMM) was also utilized in order to de-convolute the isotopic signatures found on the collector probes and to identify how much of the deposited W came from each divertor ring. A high priority at UTK is to implement the unique aspects of the isotopically enriched tracer particles and the mid-plane collector probes into existing computational modeling efforts, namely the DIVIMP-OEDGE-WallDYN suite [14]. The work presented here is directly applicable to this modeling effort by providing a quantifiable calibration standard that may be used to determine minimum measurement sensitivities of ICP-TOF-MS and LAMS. These values may then indicate the required minimum level of deposited impurities (therefore minimum number of exposed discharges) on a collector probe for the LAMS tool to be successful in determining enrichment ratios. This interaction with modeling within the research group at UTK also better informs the development of new types of collector probes for other fusion experiments such as WEST, Proto-MPEX, or again during another campaign with DIII-D.
ICP-MS
As a tool that has been heavily used in the quantitative environmental and bio-analysis fields, ICP-TOF-MS has developed into one of the most versatile tools for providing qualitative and quantitative elemental and isotopic information. With many different systems available, the detection limits for these instruments may be as low as parts per trillion (pg/L). This progress was made possible due to a number of instrumental developments during the last decade. These developments introduce many of the different state-of-the-art hyphenated detection schemes that are discussed in the subsequent sections and seen in Figure 1.3 [15].
ICP-TOF-MS
Inductively coupled plasma time-of-flight mass spectrometry (ICP-TOF-MS) should be mentioned as a possible analyzer hardware system; however, from a commercial point of view the systems play a minor role. While they offer rapid analysis of many isotopes simultaneously, there are better alternatives that may be used for isotopic determination [16]. A GBC Optimass 9500 ICP-TOF-MS, made available by the UTK Radiochemistry Center of Excellence, has been

8
Figure 1.3 Illustrative overview of several of the modern available ICP-MS platforms [15]

9
used in the early stages of this experiment. The resulting data has be used in order to deliver an initial estimate as to the enrichment ratios of the collected W content on the graphite collector probes that have been inserted into the DIII-D tokamak.
ICP-CRC-Q-MS
Inductively coupled plasma collision reaction cell quadrupole mass spectrometry is used for this experiment as an Agilent 7700x instrument has been made available within the Stable Isotope Division of ORNL. With this system comes the additional benefit of an optional collision reaction cell which may be used to rectify polyatomic interferences. These systems are most common within the ICP-MS community as they are also economical. The primary benefit of interest with this system comes with the available option to couple additional sample introduction systems as seen below.
LAMS
Laser ablation mass spectrometry has recently been the preferred method for direct solid sample analysis. LAMS is a micro-destructive technique while also providing fast turn-around times for determining the isotopic ratios of a given sample. However, the system was not readily available at the beginning of the metal rings campaign. Using the UP-213nm wavelength laser ablation tool from New Wave Research™, the option is available to use for direct ablation of the graphite collector rods. This is a method used commonly in geology where gems and metals are often observed for material constituents. This research aims to introduce LAMS to the fusion community for heavy metal and trace impurity analysis for fusion plasma facing material evaluation.
DIVIMP-OEDGE-WallDYN
This Monte Carlo simulation code package is in development for modelling efforts that will benefit fusion science. As a coupled code including three packages, this is commonly referred to as the DOW code. The package operates as an ideal computational effort to study the connection between impurity sourcing and final deposition through predictive modelling capabilities. The focus is on how the impurities will travel locally whether through erosion and prompt re-deposition or re-erosion or on the global reactor scale, which includes transport processes through the main plasma and/or the scrape off layer. DIVIMP-OEDGE-WallDYN also aims to assist in the definition of impurity fluxes at the wall of fusion experiments from sources that are throughout the device in

10
question. This has large implications for the graphite collector probe studies. Through looking at trace quantities of elemental isotopes, benchmarking opportunities may be provided by empirical evidence that is gathered using the aforementioned analytical chemistry techniques.
11
CHAPTER TWO LITERATURE REVIEW
Mass Spectrometry In order to continue the success found with initial ICP-MS studies, additional sample preparation and acquisition techniques have been explored. Through experience gained when working with traditional ICP-TOF-MS, it is evident that tungsten chemistry has a deficiency in the analytical chemistry community. Research thus far has shown that digestion of W is not trivial and requires a specialized study for heavy metal chemistry. Unique methods must be developed based on the small list of available dissolution techniques in order to prepare samples for introduction to the ICP-MS. While some chemicals have shown success, these have been further explored. Other hyphenated techniques offer additional methods for sample introduction such as laser ablation. These methods provide for a faster sampling time for isotope ratio analysis. An example of the systems that will be explored in the following sections is available in figure 2.1.
Sample Introduction
Sample introduction for mass spectrometry is a diverse region of ICP-MS systems. With a host of options to choose from, samples of nearly any phase may be directly introduced into a mass spectrometer. It is often best to think of an ICP-MS device as a detector while considering peristaltic pumps, gas chromatography (GC) systems, and laser ablation (LA) units as methods for sample introduction into said devices. With these three systems alone, a majority of samples may be analyzed for isotopic and concentration evaluation.
Most common amongst these systems is the traditional peristaltic pumps.
With these systems an input solution is then forced into the ICP-MS with a peristaltic action. Typically an inert PTFE tubing is chosen and may be used to effectively deliver near 1mL/min of aqueous liquids. In order to control these systems, users may select their tubing size and rate of pump rotation. Issues with the systems only occasionally arise when users have not checked tubing and clamp pressure on the pumps or if crimps and blockages exist in the plumbing. Considering that the tubing is relatively inexpensive, regular replacement of the peristaltic pump lines is common practice.
Once the liquid is in the lines, it must be converted into a liquid aerosol. In
order to acquire this small particle size, the sample is sent through a nebulizer and spray chamber. The nebulizer passes the liquid over a gas line which then

12
Figure 2.1 Illustrative overview of Agilent 7700 ICP-MS platform
13
sprays through the flowing liquid to produce the small particle sizes that are necessary for introduction into the plasma box. Once nebulized, the sort of mist is sent to a spray chamber where it is cooled to stable temperatures. These come pre-installed with most commercially available ICP-MS systems.
The more advanced techniques such as GC and LA require additional
training as well as separate units that may be installed through a network of plumbing between the sample introduction unit and the detector. However, once connected, the systems prepare the observed sample for introduction into the plasma torch of the ICP-MS. In order to introduce a sample, a small quantity is required. For this reason, traditional aqueous introduction techniques mitigate the sample intake through rotation speed and tubing size as described above. Similarly with the LA tool, a micro portion of the sample is ablated by a pulsed laser. Many sample materials including solids, gels, oils, powders and even liquids have been tested using the technique. The following plume of ablated particles is then passed into the plasma torch via the inlet argon or helium carrier gas flow in preparation for the ICP torch.
Plasma Box
In the plasma box region, there are several systems involved with converting the aerosolized particles into a plasma. The primary carrier for a sample that has been prepared for ionization is the plasma torch. Several different designs are available for multiple applications. The most common of these is a quartz design where the central flow is an injector used to carry the aerosol towards the cones. As the sample passes through the torch, coolant and auxiliary gas lines are introduced into the torch and mixed with the sample. These are vitally important in that they prevent the torch from melting due to the plasma as well as increasing the sample flow rate to near 15 L/min while focusing the sample. Once the sample reaches the end of the torch, it passes through a region where a load coil surrounds the sample and torch for inductive heating. Once power is applied to the coil, 1200W or more ignites the introduced sample into a plasma where near 8000°C is attained. In order to protect the torch from the high load being used to generate the plasma, a platinum shield and bonnet are used to ground the torch and reduce the potential and focus the ion energy. This soup of ions is then sent onto the next major region of the ICP-MS units.
Cones
Once the sample plasma is generated, a series of cones are used in order to shave down the amount of sample that is being introduced into ICP-MS
14
device. These include the sample cone, skimmer cone, and extraction lenses. The sample cone introduces the plasma into the vacuum portion of the system. Once inside, the skimmer cone allows for entry and transit of sample species into the extraction region. These lenses have an applied voltage which collects and shapes the ion beam in preparation for filtering. Many options exist for these cones depending on what type of sample is being passed through the instrument. For most common samples, copper and nickel cones are sufficient. For more difficult samples, such as those with a hydrofluoric acid matrix, platinum cones are available. Buildup and erosion are common issues with the cones, so regular cleaning procedures are an important portion of any analysis method. The cones are also made out of copper for heat dissipation. Cooling of the cones is achieved with a water circulating gate, which is in contact with the cones.
Ion Lenses and Reaction Cells After passing through the system of cones, the ions require additional filters prior to being sent towards a detection system. Extraction lens assemblies and octopole reaction cells are used with the Agilent 7700x. A negative bias is used to redirect incoming ions towards an octopole cell while a physical discriminator is used against neutrals, photons, and electrons. Once in the reaction cell, the interference problems that are found on a spectrum may be improved by utilizing the application of cell gases such as H2, He, Xe, O2, or NH3. Here, most polyatomic interferences can be physically separated from the targeted ions or minimized to an insignificant level utilizing kinetic energy discrimination (KED).
Detectors
There are two primary systems used for analyzing the masses that are present within a sample. The first system that has been used for the experiments presented here comes with the GBC 9500 OptiMass ICP-MS as a time of flight (TOF) analyzer. These are used to record an entire spectra of ion masses. The resulting spectra benefit from the high resolution and mass accuracy of the TOF instruments, and also from their ability to recognize all ions in parallel, without scanning across different voltages [17]. This system takes in the remaining ions that have not been filtered using the lenses and cells that ions experience prior to this section of the ICP-MS. Once ions reach the TOF analyzer, it allows for the separation of ions based on mass to charge ratios that are present due to different times of passing a fixed distance within the instrument. This occurs after ions have been accelerated to the same kinetic energy. The ions are then directed into a detector region with this same voltage at the same time. These ions are then reflected with an ion mirror towards a

15
detector where travel time is recorded. Now ions with a lower mass to charge ratio will have less travel time compared to their heavier counterparts. The required time for said ions to travel to a detector is correlated with the mass when reaching the detector. Thus, all ions may be simultaneously detected for a full mass spectrum [18].
Quadrupole mass spectrometry systems are a common alternative in the
current field of ICP-MS. The ions separate in the quadrupole according to their mass to charge ratio. Only masses with an m/z value that correlates with the mass of interest will finally make it to a detector. Because these systems are able to discriminate against all ions that do not have a corresponding mass to charge ratio, they are able to reduce the signal to noise ratio during analysis. This improves the results for the ions of interest while sacrificing information regarding other ions [19]. Signal from the quadrupole is then sent to an electron multiplier detector. These systems provide for both digital pulse and analog modes with several orders of dynamic range for standard operating conditions, and amplify the ion signal through a series of dynodes through similar process that a photomultiplier tube may use. These detectors are often chosen for their speed and large range of detection. While other types of detectors exist, these options were not explored for this study.
Sample Preparation
The current available techniques for heavy metal analysis using ICP-MS often require acid digestions methods for sample preparation. After reviewing the available methods that have been developed, it is clear that the EPA does not include aqueous sample preparation methods for tungsten in their list of recoverable metals using SW-846 Method 3051A [20]. This is a microwave-assisted acid digestion method for many environmental metals. However, there are modified acid digestion techniques that are available for digesting tungsten into an aqueous solution for ICP-MS sample introduction [21]. While the introduction of these methods increases the sample recovery percentage, it also introduces the use of hazardous chemicals to the workflow and methods. Other studies have attempted to digest W using similar techniques that include chemical digestions using hydrofluoric acid and nitric acid along with heat. One in particular was in development by the U.S. Army Corps of Engineers where they looked into the digestion of tungsten for analysis in soil samples [22]. After using W for shell casings on a firing range, the soil was collected and then studied. The material is of concern for military range sites across the U.S. so additional work in the area is necessary.
Additional modifications have been made to these techniques using nitric acid in a solution mixed with hydrofluoric acid. Once these two chemicals are

16
mixed together and placed into a microwave digestion vessel, the pressure and temperature may rise to drive the reaction within the vessel and force W into an aqueous solution. With this method, W has been detected at UTK using the available GBC Optimass 9500 ICP-TOF-MS. This system has been able to yield qualitative W signatures which may be used in order to determine isotopic enrichment on the different W isotopes: 182W, 183W, 184W, and 186W and one is slightly radioactive, 180W with an extremely long half-life of 1.8 ± 0.2 Ea (1018 years).
Again with the success seen thus far, these methods must continue to
grow in preparation for future studies using graphite collector probes. From the early stages of the experiment, LAMS has been a technique of interest as it is ideal for direct solid sample analysis, requires little to no sample preparation, and instead allows for users to focus their efforts on sample preservation.
Laser Ablation
While traditional aqueous digestion techniques are common for liquid sample introduction, there is the introduction of experimental error with sample preparation. In addition, the methods that allow for full dissolution of W into this phase require the use of hazardous chemicals and require long periods of time for analysis. This is where laser ablation techniques provide a new tool that will remove the need for sample preparation. Assuming the sample fits into the sample chamber, no additional sample preparation is required and ablation methods on the probe may be completed in a matter of minutes. In the fusion community, laser ablation has been used for cleaning mirror diagnostics and W analysis using laser induced breakdown spectroscopy (LIBS) [23, 24]. The work presented here adds to the capabilities and application of laser ablation based science to fusion applications.
Standards
In order to use LAMS, standard reference materials (SRMs) are needed in order to tune the plasma for optimized operating conditions. Traditional aqueous techniques use SRMs in order to develop a calibration curve that is used to convert intensity values to concentrations. This is an additional benefit where LAMS often encounters issues. With aqueous SRMs, the acids used in the matrix of the liquid often match those used for sample digestion. This results in matching properties in the plasma when running an analysis and valid results. When using LAMS, the SRMs need to match the samples being analyzed. Often, these solid SRMs are not commercially available.

17
Methods and Technique
Solid sample introduction by laser ablation for inductively coupled plasma mass spectrometry experiments have been in development since the mid-1980s. Early pioneers for the method tested the technique in order to determine the viability of analyzing samples for isotopic information, and found reasonable success when using ruby lasers and plasma injector gas flow for sample introduction [25]. The positive results prompted the new technique to continue use and is now considered a staple method for solid isotopic analysis for many fields of science. The technique is often used in radiation safety, gemology, forensics, and many other fields for its high spatial resolution and rapid direct analysis benefits as well as the significant decrease in cost compared to secondary ion mass spectrometry (SIMS) and increased sensitivity when compared to laser induced breakdown spectroscopy (LIBS).
With the technique a high energy laser beam is produced and within fractions of a second, the laser may be pulsed using Q switching in order to rapidly remove particles from a sample of interest. Once the laser pulse hits the sample, the solid particle are essentially vaporized and converted into a plasma at the ablation site. Due to this phenomena, spectroscopy techniques often take advantage of the light that is emitted during the process in order to identify the constituents of the plasma that are generated from the sample. Other techniques will instead sweep the generated plume into an ICP-MS through a network of connections and carrier gas.
As it stands, there are few studies that have focused on using laser ablation for tungsten or fusion. Several have highlighted a focus on LIBS as an in situ technique for layer thickness evaluation, but none have been found in regards to isotopic analysis for impurity transport studies [26-29]. This opens up a realm of possibility for development of methods and techniques for analysis W that has eroded and re-deposited on the graphite collector probes (CPs) which were inserted into DIII-D.
Graphite Collector Probes
Impurity transport within the scrape off layer (SOL) is a topic of interest for the fusion community as it is the main boundary condition for the primary plasma at the core of any fusion device. Understanding this region of a plasma also addresses the crucial issues related to erosion and deposition processes for generated impurities. Studies using graphite collector probes have been conducted since the late 1970s to understand this area of plasma physics. The TEXTOR and ASDEX experiments led the early measurements of particle fluxes at the outer midplane of the experiments. Here, techniques including RBS
18
nuclear reaction analysis (NRA), and proton induced X-ray emission (PIXE) have been implemented in order to understand the elemental profiles for these studies; however, isotopic profiles for the collected particles has yet to be presented.
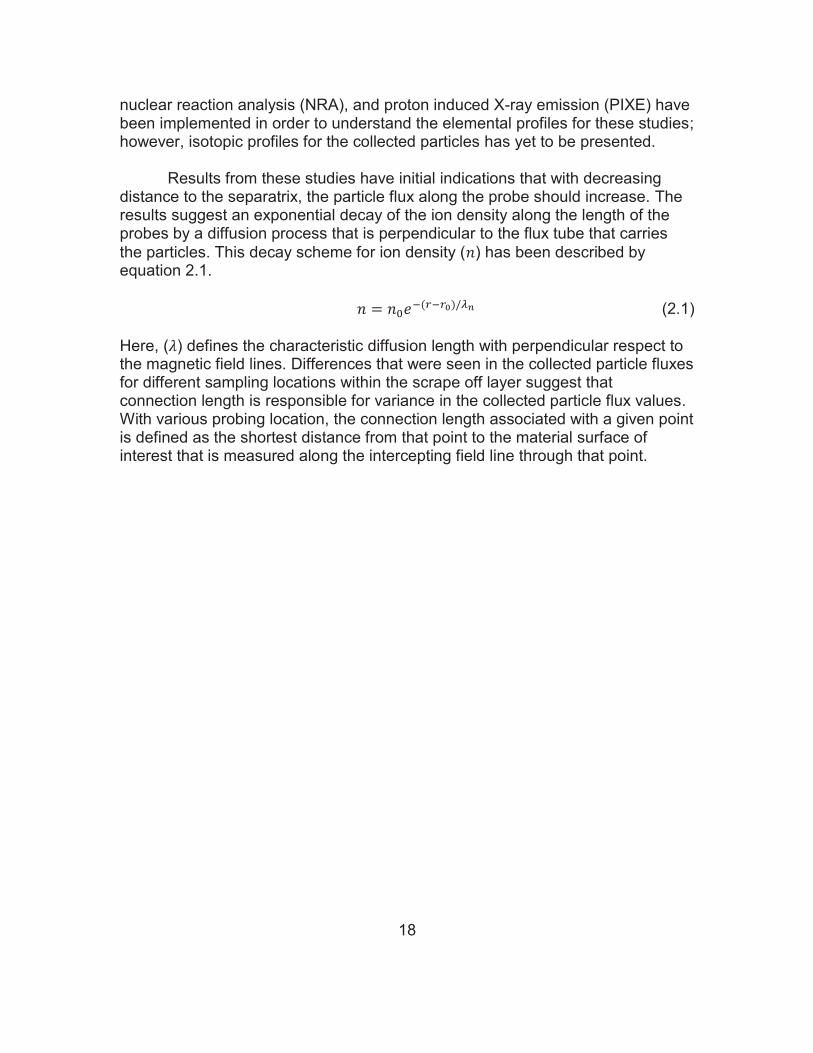
Results from these studies have initial indications that with decreasing
distance to the separatrix, the particle flux along the probe should increase. The results suggest an exponential decay of the ion density along the length of the probes by a diffusion process that is perpendicular to the flux tube that carries the particles. This decay scheme for ion density ( ) has been described by equation 2.1.
(2.1)
Here, ( ) defines the characteristic diffusion length with perpendicular respect to the magnetic field lines. Differences that were seen in the collected particle fluxes for different sampling locations within the scrape off layer suggest that connection length is responsible for variance in the collected particle flux values. With various probing location, the connection length associated with a given point is defined as the shortest distance from that point to the material surface of interest that is measured along the intercepting field line through that point.
19
CHAPTER THREE MATERIALS AND METHODS
DIII-D Experimental Details Again, for the experiments conducted at DIII-D, W coated TZM inserts were created at ORNL. One source used during deposition included natural W while a second set of tile arrays used a 93.5% isotopically enriched 182W source. Once the tile inserts were ready, they were inserted into two tile arrays within the DIII-D tokamak divertor. In order to sample impurities generated from the tiles during plasma operation, collector probes CPs were created using multiple types of graphite. Three different models were created in order to produce collector probe sets to be inserted into the plasma and sample impurities during different plasma operating conditions while also allowing for sampling different SOL surfaces. Also, different diameters have different connection lengths along the magnetic field lines [30]. ATJ graphite was used to create the B and C type probes and Ted Pella rods were used for the type A CPs. These were installed at the outboard midplane of the reactor in order to sample the far SOL of the plasma. An example of these probes may be seen in figure 3.1 and additional drawings are available in appendices 1 and 2. Once the probes were constructed by UTK, ORNL, and the University of California – San Diego (UCSD), the probes were installed in triplet sets at the outboard mid-plane of the reactor vessel as seen in figure 3.2.
RBS Analysis
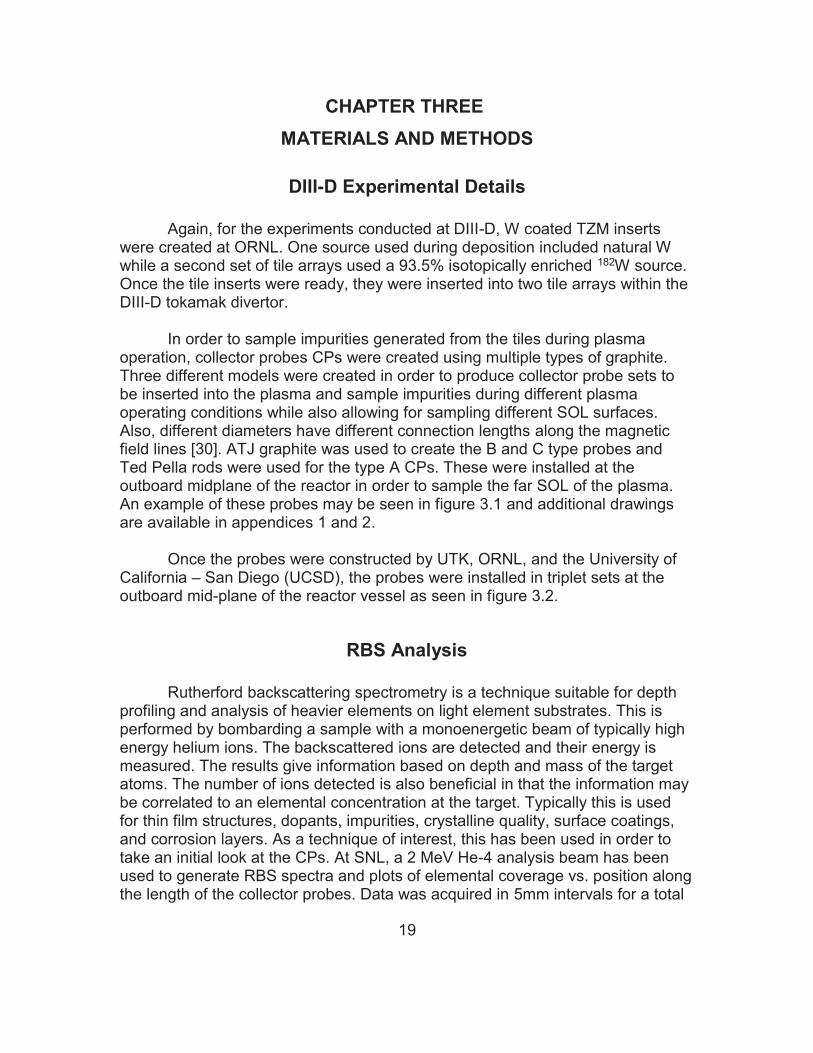
Rutherford backscattering spectrometry is a technique suitable for depth profiling and analysis of heavier elements on light element substrates. This is performed by bombarding a sample with a monoenergetic beam of typically high energy helium ions. The backscattered ions are detected and their energy is measured. The results give information based on depth and mass of the target atoms. The number of ions detected is also beneficial in that the information may be correlated to an elemental concentration at the target. Typically this is used for thin film structures, dopants, impurities, crystalline quality, surface coatings, and corrosion layers. As a technique of interest, this has been used in order to take an initial look at the CPs. At SNL, a 2 MeV He-4 analysis beam has been used to generate RBS spectra and plots of elemental coverage vs. position along the length of the collector probes. Data was acquired in 5mm intervals for a total

20
Figure 3.1 Image of Collector Probes inserted into the DIII-D tokamak for impurity studies
Figure 3.2 Schematic of the DIII-D tokamak for impurity studies during the metal rings campaign
21
of twenty locations along each analyzed probe. Data above the limits of detection (~1012 W atoms/mm2) is presented in the subsequent sections.
ICP-TOF-MS Analysis Again, with ICP-TOF-MS a GBC Optimass 9500 has been used in collaboration with the UTK Radiochemistry Center of Excellence. The system has been equipped with HF rated hardware in order to analyze samples that have been forced into aqueous solution through the previously mentioned microwave chemical digestion techniques. Initial results have confirmed the RBS finding through aqueous sample isotopic analysis of several isotopes. As a primary interest, tungsten was monitored across all samples. The resulting spectra are then analyzed for the presence and ratios of the isotopes of interest.
LA-ICP-QMS Analysis
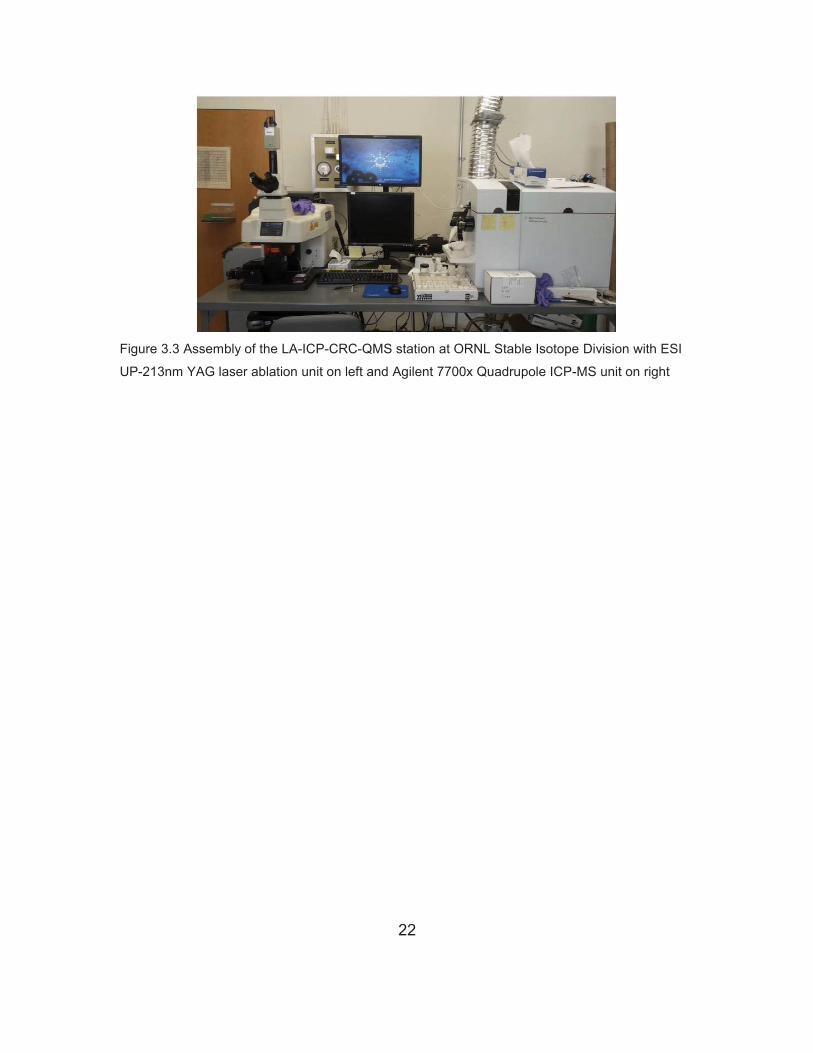
With the findings using ICP-TOF-MS, there is the additional need for testing of the collector probes. Using laser ablation techniques now offers an innovative approach to analyzing the probes for tungsten content and isotopics. This project has bridged together a UP-213 nm NewWave™ laser ablation tool with an Agilent 7700x Quadrupole ICP-MS. This is a common pairing of systems for LAMS studies, and the setup may be seen in figure 3.3. These two systems were provided by different departments within ORNL in order to be used for future sample analysis in the Stable Isotope Division. Here, bulk material analysis and isotope identification is of high importance when delivering enriched materials to customers. As a system which is capable of detecting unique isotopes in minute quantities, resources have been appropriated to revive the units for the Stable Isotope Division and the experimental efforts presented here.
UP-213 Specifications
The UP-213 specifications are presented in appendix 3 and provided by the product brochure [31]. These settings have been modified in order to receive an optimal sample to introduce into the ICP-MS. A list of these settings may be seen in table 3.1
In order to ablate a sample, it must first be mounted into an ablation cell. The stock cell which comes with the UP-213 allows for small (60mm ID, 50mm deep) samples to be inserted for ablation. With this sample chamber, magnetic samples may also be analyzed. For larger samples, a large format cell (LFC) is available from NewWave™. The LFC has several improvements over the smaller
22
Figure 3.3 Assembly of the LA-ICP-CRC-QMS station at ORNL Stable Isotope Division with ESI
UP-213nm YAG laser ablation unit on left and Agilent 7700x Quadrupole ICP-MS unit on right

23
alternative. Sample sizes may be increased to fit within the dimensions (WxLxD) 6” W x 6”L x 1”L (15.24 cm x 15.24 cm x 2.54 cm). Also, the performance of the cell improves because the aerosol that is generated at the ablation site is quickly captured by the collection cup that is positioned overhead. Additionally, the gas flow dynamics are greatly improved which results in an increase in the spatial reproducibility. This cell is ideal for analyzing the graphite collector probes because they will fit completely within the cell. The sample chamber also allows for multiple sample loading at a time. Tuning standards and samples may both be mounted which will shorten acquisition times and require less purging. This cell has been purchased by the Stable Isotope Division, but has not yet been installed. Therefore, graphite collector probes must be shortened to fit into the stock cell. Future studies will include the LFC seen below.
Table 3.1 UP-213 laser ablation Tool Specifications
Setting Description Lasing Medium Nd:YAG
Fundamental Wavelength 1064 nm Operating Wavelength 5th Harmonic 213 nm
Repetition Rate 1-20 Hz
Energy < 3 mJ
Spot Size < 100 μm
Beam Condition Flat beam profile
Lighting Transmitted, Ring, Coaxial
Ablation Type Continuous, Pulsed, Single
Gas Lines In order to connect the NewWave™ UP213 with the Agilent 7700x, a network of proper plumbing must be created in order to properly flow gas from ultra-high purity (UHP) argon and helium tanks and finally into the ICP-MS. It is recommended that 99.999% pure helium and argon gas be used as the cell and/or makeup gas. In order to ensure additional purity on the helium line, an Agilent Gas Clean GC/MS filter is used in order to increase the purity by an additional factor. The supplies are then flow controlled using a gas flow box mass flow controller in order to ensure the best analytical stability. Tygon tubing is used as transport tubing for its flexibility and robustness. Argon gas was originally used for experiments as a carrier gas through LAMS systems, but helium gas

24
has started showing a higher level of importance when considering what atmosphere to use in an ablation cell. The presence of helium has been shown to increase the fraction of small particles in the aerosol which has led to an increased transport efficiency of the aerosol from the cell where materials are being ablated to the ICP. This introduction of helium also has managed to reduce the time and energy that is required for complete atomization [32]. One study in particular clearly highlights this added benefit with the image seen in figure 3.4 where two different areas on one sample have been ablated. One spot has been ablated using traditional argon carrier gas. Around the sample a sort of snowfall is evident. This precipitation is present when argon is used as the ablation cell carrier gas. The ablated material is not efficiently carried to the ICP and instead fall back onto the sample. With helium, this is not the case. Instead, the sample is carried to the ICP where increased signal is observed [33]. In order to introduce a sample into the Agilent 7700x, the laser ablation tool has an outlet line which carries the ablated sample into the ICP-MS as seen in figure 3.5. When helium is used as the primary gas for the ablation cell, argon gas is fed into the line via a Y-port. This allows for proper gas flow rates into the ICP-MS torch. Otherwise, the argon line is sent into the gas inlet and fed straight into the glass torch adaptor and ICP-MS after traveling through the ablation cell.
Mass Hunter In order to prepare the ICP-MS for laser ablation analysis, several software settings must be adjusted in order to incorporate the appropriate hardware. While traditional aqueous intake ICP-MS requires the use of a peristaltic pump, spray chamber cooling system, and a nebulizer, LAMS studies require that these options are shut off and adjusted for laser ablation sample introduction. During analysis, the collision reaction cell (CRC) may also be turned on in order to remove spectral interferences through kinetic energy discrimination. Helium is introduced into the cell at a variable flow rate of up to 5mL/min. With this level of helium flow, overall signal intensity and polyatomic interferences are both reduced. There are also several software considerations for analyzing samples including signal monitoring, spectrum analysis and time resolved analysis (TRA). During signal monitoring, masses of interest are selected and counts are averaged during the monitoring time on those mass values. With spectrum analysis, counts are gathered across the selected masses and compiled into a spectrum for each sample that is introduced into the ICP-MS. TRA offers a time integrated approach for analyzing samples which may compensate for laser ablation cell washout times along with a period for plasma stabilization. TRA is the preferred method for LAMS studies.

25
Figure 3.4 Comparison of spot area using Argon and Helium as carrier gas. Helium is shown to
increase sample transport efficiency. The legend line is 50μm in length [33]
Figure 3.5 Schematic of gas connections used to carry ablated sample and necessary mixing
gasses to ICP-MS with a laser ablation sample introduction tool [34]
26
Tuning Materials and Sampling Methods Tuning is the first step in a method that must occur in order to optimize the plasma parameters. The laser settings are adjusted for optimal signal output when tuning. A strong signal on the monitored masses is associated with higher ablation settings. The high signal allows for a more efficient plasma tuning. It is important to tune the plasma across a broad range of mass values. This means tuning the plasma so that signal at low and high masses is stable. For this purpose, standard reference materials with a multitude of spike elements is desired. Traditionally the NIST 612 glass is used for the tuning of the extraction lens, the omega bias, the omega lens, cell gasses, torch axis settings, and reflected power. Once these parameters have been adjust, relative standard deviation values are minimized and the plasma is ready for sample acquisition.

27
CHAPTER FOUR RESULTS AND DISCUSSION
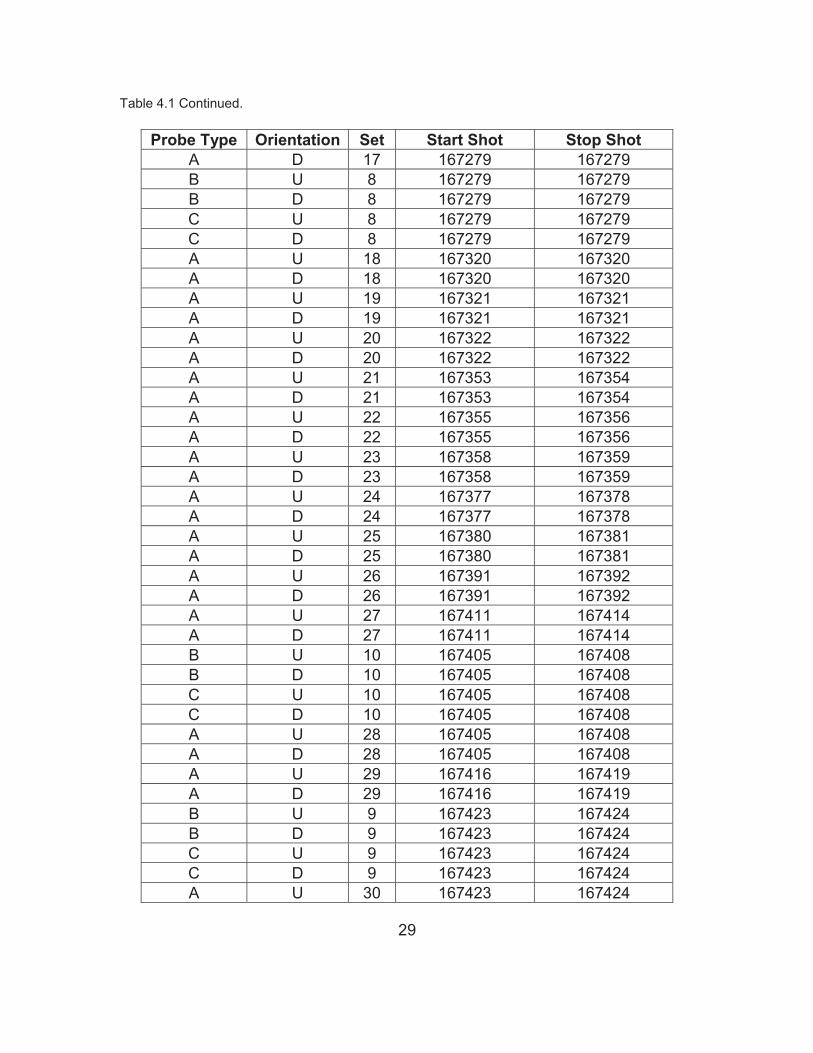
DIII-D Probe Exposures During the campaign, one hundred and fourteen graphite probes were exposed to the DIII-D plasma in nearly forty unique configuration sets and conditions. The probes are labeled based on which DIII-D plasma discharge (“shot”) marked the start of exposure and then the end shot. Details for each shot are located on the DIII-D internal servers. In order to access this data, specific scripts are in development within the research group led by Dr. David Donovan at UTK. The stored information will connect the physics based knowledge to the analytical information on isotopics that is presented within this thesis. A list of the exposed probes and their associated shot numbers may be seen in table 4.1.
Table 4.1 Graphite collector probe sets with start and stop shot identification numbers
Probe Type Orientation Set Start Shot Stop Shot A U 1 167173 167185 A D 1 167173 167185 B D 1 167173 167185 B U 1 167173 167185 C D 1 167173 167185 C U 1 167173 167185 A D 2 167196 167220 A U 2 167196 167220 B D 2 167196 167220 B U 2 167196 167220 C D 2 167196 167220 C U 2 167196 167220 A U 3 167227 167228 A D 3 167227 167228 B U 3 167227 167230 B D 3 167227 167230 C U 3 167227 167230 C D 3 167227 167230 A U 4 167229 167230 A D 4 167229 167230 B U 4 167231 167236 B D 4 167231 167236

28
Table 4.1 Continued.
Probe Type Orientation Set Start Shot Stop Shot C U 4 167231 167236 C D 4 167231 167236 A U 5 167231 167235 A D 5 167231 167235 A U 6 167236 167236 A D 6 167236 167236 A U 7 167237 167238 A D 7 167237 167238 A U 8 167247 167247 A D 8 167247 167247 B U 5 167247 167247 B D 5 167247 167247 C U 5 167247 167247 C D 5 167247 167247 A U 9 167253 167255 A D 9 167253 167255 B U 6 167253 167255 B D 6 167253 167255 C U 6 167253 167255 C D 6 167253 167255 A U 10 167258 167258 A D 10 167258 167258 A U 11 167266 167266 A D 11 167266 167266 A U 12 167268 167268 A D 12 167268 167268 A U 13 167274 167275 A D 13 167274 167275 B D 7 167274; 167277 167275; 167277 B U 7 167274; 167277 167275; 167277 C D 7 167274; 167277 167275; 167277 C U 7 167274; 167277 167275; 167277 A U 14 167276 167276 A D 14 167276 167276 A U 15 167277 167277 A D 15 167277 167277 A U 16 167278 167278 A D 16 167278 167278 A U 17 167279 167279
29
Table 4.1 Continued.
Probe Type Orientation Set Start Shot Stop Shot A D 17 167279 167279 B U 8 167279 167279 B D 8 167279 167279 C U 8 167279 167279 C D 8 167279 167279 A U 18 167320 167320 A D 18 167320 167320 A U 19 167321 167321 A D 19 167321 167321 A U 20 167322 167322 A D 20 167322 167322 A U 21 167353 167354 A D 21 167353 167354 A U 22 167355 167356 A D 22 167355 167356 A U 23 167358 167359 A D 23 167358 167359 A U 24 167377 167378 A D 24 167377 167378 A U 25 167380 167381 A D 25 167380 167381 A U 26 167391 167392 A D 26 167391 167392 A U 27 167411 167414 A D 27 167411 167414 B U 10 167405 167408 B D 10 167405 167408 C U 10 167405 167408 C D 10 167405 167408 A U 28 167405 167408 A D 28 167405 167408 A U 29 167416 167419 A D 29 167416 167419 B U 9 167423 167424 B D 9 167423 167424 C U 9 167423 167424 C D 9 167423 167424 A U 30 167423 167424

30
Table 4.1 Continued.
Probe Type Orientation Set Start Shot Stop Shot A D 30 167423 167424 A U 31 167463 167464 A D 31 167463 167464 A U 32 167481 167482 A D 32 167481 167482 A U 33 167530 167531 A D 33 167530 167531 A U 34 167534 167535 A D 34 167534 167535 A U 35 167536 167537 A D 35 167536 167537 A U 36 167542 167542 A D 36 167542 167542 A U 37 167616 167619 A D 37 167616 167619
SNL Rutherford Backscattering Spectrometry Analysis
Several probe sets were sent to SNL based on priority. The results have yielded information that has been helpful in determining which probes are most likely to result in a W signal using chemical digestion techniques along with ICP-TOF-MS. The probes with the highest concentrations of W are the best candidates for analysis. A ranking of the probes that have been analyzed using RBS thus far may be seen in table 4.2. Table 4.2 Maximum single point tungsten content based on Sandia National Laboratory RBS.
(Note AU35 and AU38 will be the probes of interest for LAMS studies)
Probe Name Max Tungsten Content [1e15 W/cm2] BD2 0.651880412 BU2 0.493683492 AD2 0.475954527 CU2 0.151378087 AU2 0.143195488
AU35 0.143195488 AU34 0.135012889 AD28 0.133649122

31
Table 4.2 Continued.
Probe Name Max Tungsten Content [1e15 W/cm2] CD2 0.115920157
AU28 0.115920157 AU32 0.11455639 CD10 0.099554958 CU10 0.098191192 BD10 0.091372359 BU10 0.073643394 AU33 0.070915861 AD34 0.058641962 CD7 0.053186896 BD7 0.050459362
AD35 0.049095596 AD17 0.045004296 AD31 0.045004296 AD33 0.040912997 BD8 0.03954923
AD32 0.03954923 AU19 0.034094164 AU17 0.032730397 AU31 0.032730397 CU7 0.027275331 AD19 0.027275331 BU7 0.024547798 CU8 0.023184031 AD15 0.020456498 AD18 0.019092732 AD21 0.016365199 BU8 0.012273899
AU21 0.012273899 AU15 0.008182599 AU20 0.008182599 AD20 0.008182599 AU18 0.006818833
32
In the table, the clear case for highest W content may be seen on the second set of probes for shots 167196 through 167220 with up to 0.652 x 10¹⁵ W/cm2. These levels of content are considered well above the limits of detection at 1 x 10¹² W/cm2. As a proof of principle, several previously sampled probes were analyzed for W content. In the locations where the probes had been scraped for sample acquisition, there was no detectable W content in these locations. This is best seen by the profile seen in figure 4.1.
In the profile presented in figure 4.1, there is a decreasing trend of W content when moving down the length of the probe. This trend is not easy to see considering the probe has shown some of the lowest content through RBS scans. Instead, this trend is much more obvious when observing the profile for probe BU2 in figure 4.2. This decreasing trend is consistent across the available probe profiles. In some cases the beginning of the trend is a bit lower on content, but then the concentration values peak and decrease to background levels of W content. This is due to the collection of W that occurs when sampling during plasma exposure. As the probes are inserted from the vessel wall, the tip of the probe is placed closer to the main plasma of DIII-D. However, the probes stop just outside and sample the scrape off layer of the plasma. Transport of impurities through the SOL appears to hold higher impurity content closer to field lines that are associated with the strike point of the plasma. The trend then supports the concepts stating that the radial particle velocity component is outward for the SOL.
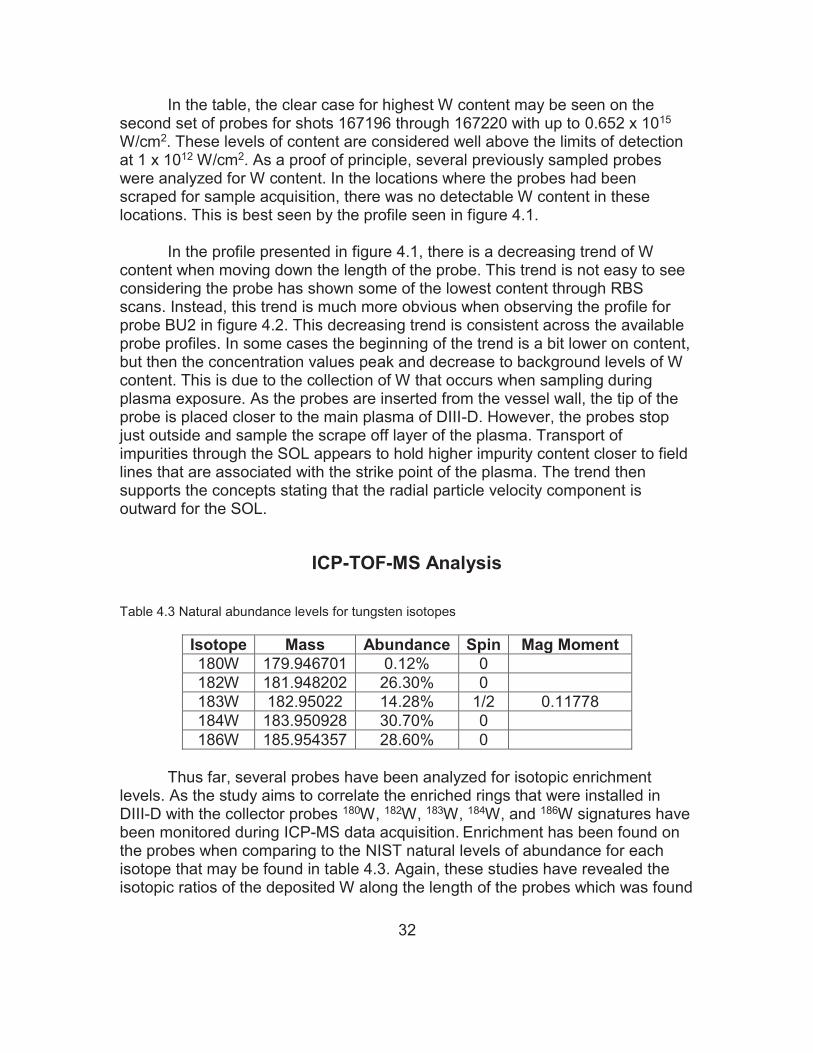
ICP-TOF-MS Analysis Table 4.3 Natural abundance levels for tungsten isotopes
Isotope Mass Abundance Spin Mag Moment 180W 179.946701 0.12% 0 182W 181.948202 26.30% 0 183W 182.95022 14.28% 1/2 0.11778 184W 183.950928 30.70% 0 186W 185.954357 28.60% 0
Thus far, several probes have been analyzed for isotopic enrichment levels. As the study aims to correlate the enriched rings that were installed in DIII-D with the collector probes 180W, 182W, 183W, 184W, and 186W signatures have been monitored during ICP-MS data acquisition. Enrichment has been found on the probes when comparing to the NIST natural levels of abundance for each isotope that may be found in table 4.3. Again, these studies have revealed the isotopic ratios of the deposited W along the length of the probes which was found

33
Figure 4.1 RBS W content profile for probe AD15. Emphasis is placed on the scraped area in
order to highlight the lack on W content seen in the area
Figure 4.2 RBS W content profile for probe BU2. Similar decreasing trend lines are seen on all
probes

34
when using RBS. These ratios cover a wide range of values across the many probes that were tested. Some probes show W-182 signatures at natural levels, 26.5%, while others have enriched signatures up to 92.5%. This suggests multiple sourcing mechanisms of W impurities which are dependent on the strike point of the plasma in DIII-D.
LAMS Analysis It is important to reiterate that tuning is the first step that must occur in any valid method in order to optimize the plasma parameters. Once the plasma has been turned on via the Mass Hunter® software, the carrier gas flowing through the LA-cell is set to bypass the sample chamber. Then, the NIST 612 SRM glass is loaded into the cell and purged for nearly 30 seconds in order to introduce the carrier gas and remove air from the chamber. To ensure the integrity of the plasma, the gas flow rate is throttled to near zero and then accelerated until a flow rate of 0.750-1L/min is achieved directly prior to the end of the purge. Next, the laser settings are adjusted for tuning experiments, which may be seen in table 4.4. These are the highest laser settings available. A strong signal on the monitored masses is associated with maximum ablation settings which are desirable for tuning. Table 4.4 Laser ablation settings for NIST 612 tune of Agilent 7700x properties
Setting Value Scan Raster Raster Spacing 100 μm Passes 1 Scan Speed 10 μm/sec Output 100 % Rep. Rate 20 Hz Spot Size 100 μm Energy at Sample Surface ~2 mJ
Fluence at Sample Surface ~25 J/cm2
Once the laser is set, the ablation begins. Sample is introduced into the plasma for nearly 30 seconds before tuning begins in order to allow for plasma stabilization. At this point, mass values 11, 139, and 232 are monitored during an auto-tune. These are associated with B, La, and Th which have mass fractions of 32, 36, and 37.79 mg/kg within SRM 612. This allows for the extraction lens, the

35
omega bias, the omega lens, cell gasses, torch axis settings, and reflected power to be adjusted for the most consistent signal on the monitored masses. At the end of an auto-tune, a report will be printed for the experiment. Here, relative standard deviation (RSD) values are observed. For LAMS auto-tuning, RSD values near 8% are most common. With aqueous intake and Agilent tuning solution Part # 5185-5959 where Ce, Co, Li, Mg, Tl, and Y are present at 1μg/L, the RSD values are typically below 3%. While the aqueous intake RSD values are lower, the LAMS auto-tune still gives confidence to sample acquisition for almost all masses. Any signal values at masses 40, 56, and 80 are not often considered reliable due to the interference lines that are present due to Ar, ArO, and Ar-Ar peaks. Luckily, the tungsten mass values only see partial interference with Ta, Hf, and Os at mass values 180,184, and 186 where W is still the most abundant at these masses other than 180 where any counts may be considered negligible due to a W-180 abundance of 0.1198%. This tuning method may be improved with a custom user tune rather than an auto-tune. Using the NIST 612 is still standard for tuning; however, a new range of masses and laser parameters are suggested for optimal plasma. The suggested laser settings are available in table 4.5. Table 4.5 Laser ablation settings for NIST 612 custom auto-tune of Agilent 7700x properties
Setting Value Scan Line
Raster Spacing 100μm
Passes 1
Scan Speed 10μm/sec
Output 63% Rep. Rate 20Hz
Spot Size 55μm
Fluence at Sample Surface 15J/cm2
These new settings are combined with a new list of monitored masses and mass ratios. A list of these masses, ratios, and associated results from the laser settings above may be seen in table 4.6. These values are the result of a custom user tune with the Agilent 7700x rather than an auto-tune. Mass 29 is monitored for sensitivity. When ablating, this is dominated by 29Si as Si is the ‘filler’ material for NIST 612. These counts are expected to be very high as seen in the range column of the table above. It is

36
important to note the values for average counts from day to day because there should be little variance if the system is functioning with the same parameters. Masses 45,175, and 238 may also be monitored for sensitivity and mass balance. These should result in lower counts for Si, but the average counts should be similar to one another. They are each present within the NIST glass at about the same concentration, and they are the most abundant isotope for each element (Sc, Lu, U respectively), and they ionize at similar rates. This means they are decent markers for mass balance. The absolute value day to day will again depend on the plasma parameters for the systems used. Ratio of mass values 248/232 is used to observe the oxide ratio within the system which indicates the oxygen levels. These values are greatly reduced compared to using an aqueous tune because the oxygen in water is not being sent to the ICP-MS. The ratio should be less than 0.7%. If this value rises above 1%, this may be an indication that the cell has not been properly purged or that the drawer is not fully shut. The tubing for carrier gas should also be checked for leaks with values greater than 1%. The 232/238 ratio is the Th/U ratio. These are in equal concentrations within the NIST 612, so the ratio should be near 100%. Mass 220 is a null mass; therefore, nothing should be present in the system at this value. With this type of tune, notice the RSD values are consistently on the lower end (~5%) compared to the higher uncertainty values obtained with an auto-tune. Table 4.6 Monitored masses and results using Table 4.5 laser settings
Mass or Ratio Counts Average Counts RSD%
29 893936 979757.8 4.5 56 18086 18273.2 4.15 45 14518 15392.7 4.42
175 23445 24843.3 5.58 238 21810 21824.10 6.44
248 / 232 0.0076 0.67% 10.46 232 / 238 0.9467 103.47% 3.33
220 0 0.5 171.37 Once tuned, initial tests were performed on an “ITER Grade” W wafer
sample, which was near mirror polished and cleaned. The analysis was performed in order to evaluate the laser settings that are necessary for ablating W and acquiring a stable signal across its isotopes. The results from this test may be seen in table 4.7.
The results observed in table 4.7 were achieved with a continuous ablation at 10Hz and variable power was performed at a single spot while monitoring a live signal to the ICP-MS. Laser power was ramped starting at 0%

37
until W was present in the natural abundance ratios at low RSD while minimizing damage to the sample. 30% power shows an increase in the monitored spectrum, so 40-45% of the full laser power is used for ablation experiments per recommendation of the ORNL forensics division. Table 4.7 Laser ablation results of ITER grade tungsten wafer suggest quality counting statistics
across all W isotope when using the developed laser settings
Mass Average Counts RSD % Abundance % Error 180 49460.9 4.14 0.1049395 12.40 182 12447542.7 5.72 26.4095259 0.34 183 6583851.4 5.31 13.9687325 2.41 184 14398150.10 4.93 30.5480629 0.31 186 13653771 4.67 28.9687392 1.91
Before moving onto testing the graphite collector probes, a background spectrum should be obtained from the stock material used to create the collector probes. Considering the results from the collector probe testing will be from the A-type probes, testing a blank Ted Pella graphite rod is necessary. When using laser settings that are found to yield quality signal with the ITER grade W, Ted Pella background results in little to no W signal on each isotope. These results may be seen in table 4.8. It is important to note that the low counts are indication that any signal obtained above these values must be from outside sources. Therefore, it may be assumed that the W signal on the A-type probes is collected from the DIII-D experiment. Table 4.8 W background results for Ted Pella rod used in A-type collector probes
Ted Pella Stock LAMS Isotope Range Count Avg. Count RSD
180 2.00E+01 1 0.5 180.04 182 2.00E+01 1 1.3 131.02 183 2.00E+01 0 1.3 202.16 184 2.00E+01 0 1.30 149.41 186 2.00E+02 0 8.7 378.47
In order to then validate the experiment, two probes were selected for
analysis. The probes were selected based on the location of the strike point during operation. Two scenarios are important to consider – when the plasma strike point is located on the enriched 182W ring and when the strike point is on

38
the naturally enriched ring. Probes AU28 and AU35 were selected as probes that meet these considerations as seen in their shot profiles in the figure 4.3. Here we can see that the plasma is directed at the enriched ring for probe AU35 and floor ring for AU28. With two probes selected, methods for tuning the plasma, and laser parameters for ablating tungsten in place, the experiment may continue. In order to correlate LAMS data with RBS data, 5mm ablating lines down the length of the probes have been selected. 55 micron line scans have been completed in order to evaluate the probe. The resulting probe scans may be seen in figure 4.4.
Data has been collected during each scan seen in the images in figure 4.4
and compared with the available RBS data that was collected by William Wampler at SNL . When comparing the two data sets, similar trends are observed between the two as observed in figures 4.5 and 4.6.
As one may observe in the figures 4.5 and 4.6, the signal is clearly indicating W above the background Ted Pella rod W signature presented in table 4.8. These figures alone indicate that LAMS is a valid method for detecting W on the graphite collector probe. The resemblance between the two trends which show normalized W intensity to the maximum value both agree with a negative trend as suggested by theory seen in equation 2.1 where an exponential decay of ion flux along the length of the probes is defined. One outlier for the LAMS profile at 1.5mm that does not fall in line with the other points may easily be explained by the hardware setup seen in the probe holder drawing which is located in the appendix 1. When the A-type probes are inserted into the holder, the tip of the probe is partially covered by the casing. Consider the values presented in figure 4.6 are from averaged scans across the full width of the flat face of the probe. The portion of probe that is covered by this holder will result in less W content. Therefore, the average across this face will be weighted down from what one might expect on the portion of the probe that was exposed to the plasma. Another primary interest from these experiments is the enrichment profile of the graphite collector probes. These profiles may be seen in figures 4.7 and 4.8.
The isotopic enrichment profiles are noteworthy due to the high 182W enrichment that is observed on both probes AU35 and AU28. When first looking at AU35, recall that the strike point was located on the enriched ring during the shots. With this in mind, we expect high levels of isotopic 182W to dominate the signal received during LAMS. Consistently along the length of the probe, nearly 85% enrichment is observed. This correlates well with the expectation on enriched 182W eroding from the enriched tile, traveling along the edge plasma
39
Figure 4.3 DIII-D Plasma Profiles for Probe AU35 (left) and AU28 (right)
Figure 4.4 Graphite CP post ablation images confirming 5mm spacing and ~55 micron trenches
40
Figure 4.5 LAMS vs. RBS elemental W signal comparison for collector probe AU35 (LAMS error
bars based on detector counting statistics and RBS error bars provided by experimental facility)
Figure 4.6 LAMS vs. RBS elemental W signal comparison for collector probe AU28 (LAMS error
bars based on detector counting statistics and RBS error bars provided by experimental facility)

41
Figure 4.7 Isotopic enrichment profile for probe AU35 (error bars based on detector counting
statistics)
Figure 4.8 Isotopic enrichment profile for probe AU28 (error bars based on detector counting
statistics)

42
and collecting on the graphite collector probes. One may call in to question the falling levels of enrichment seen between 30 and 35mm along the length of the probe. These data sets correlate with lower levels of total W content. When referring to the RBS data, 0.045 x 10¹⁵ and 0.016 x 10¹⁵ W atoms/cm2 is measured at these points. This may be the limit of detection for dependable enrichment detection using LAMS or some other phenomena related to impurity transport physics. Again, there are two scenarios which are important to consider. One scenario has been observed with AU35 when the plasma strike point is located on the enriched 182W ring. Now consider the AU28 collector probe when the strike point is on the natural abundance W ring. Recall the natural abundance ratios for W found in table 4.3. Note the 182W signal as 26.3% while the AU28 collector probe has obtained a nearly 64% enrichment profile. At first thought, this may appear as a red flag. However, one must observe the DIII-D profile in figure 4.3 more closely. While the strike point is located on the floor of the device or the natural abundance W ring, there are still field lines within the SOL which intercept the enriched ring as well. Due to this scenario, we must consider a model where mixing of the two sources is a possibility. In the scenario with AU35, the strikepoint was on the enriched ring and the content on the probes was highly enriched. Now we see enrichment with AU28, but not quite the same level of enrichment as AU35. This brings into consideration the stable isotopic mixing model (SIMM). With this model, one may determine the relative contribution from each source with unique ‘isotopic fingerprints’ from either the natural or the enriched W rings. This is best represented by the example seen in figure 4.9. However, in the example with the DIII-D collector probes, the plasma is the river, the natural metal sources correlate with the natural W ring, and the enriched ring is associated with the anthropogenic metal sources. At the sampling point, we assume this is the location of the collector probe. Therefore, the total signature from the two metal sources is a sum of the two relative fractions of metal sources. This model may be used to back calculate the quantity for each source signature as seen in figure 4.10.

43
Figure 4.9 Illustrates a schematic example of a natural river system for which the relative
fractions of natural and anthropogenic metal sources can be quantified by metal isotope
signatures [35]
Figure 4.10 Illustrates an example where fractions of W content from each metal ring may be
added together to determine the total W signal measured on a graphite collector probe

44
CHAPTER FIVE CONCLUSIONS AND RECOMMENDATIONS
In conclusion, successful development of methods for utilizing LAMS for surface characterization of graphite collector probes has been completed LAMS has proven its viability for determining the isotopic ratios of W that are present on the graphite collector probes. LAMS has also succeeded in evaluating the relative trend of total W or elemental W content as a function of distance along the CPs. The resulting trend lines are in agreement with the elemental W trends determined using RBS. Future improvements to the experiment may include the use of the large format cell provided by Electro Scientific Industries. With the improvement of the LFC, higher sensitivities may be achieved which will allow for increased accuracy and even simple sample preparation during surface characterization. The data presented here allows for forward progress towards a PhD dissertation which explores the associated physics and theory associated with the collector probe experiments. Additionally, the empirical results may now be a part of the larger computational efforts underway with computational techniques for interpretive modelling of impurity transport in fusion devices such as the DIVIMP-OEDGE-WallDYN suite.

45
LIST OF REFERENCES

46
1. EIA, Annual Energy Outlook 2015 with Projections to 2040. 2015. 2. Inglesi-Lotz, R., The impact of renewable energy consumption to
economic growth: A panel data application. Energy Economics, 2016. 53: p. 58-63.
3. Nordås, R. and N.P. Gleditsch, Climate change and conflict. Political Geography, 2007. 26(6): p. 627-638.
4. Armaroli, N. and V. Balzani, The future of energy supply: Challenges and opportunities. Angewandte Chemie-International Edition, 2007. 46(1-2): p. 52-66.
5. Zucchetti, M., et al., The feasibility of recycling and clearance of active materials from fusion power plants. Journal of Nuclear Materials, 2007. 367: p. 1355-1360.
6. Fusion, E., Progress in Fusion. 2011. 7. Energy, U.S.D.o., Fusion Energy Sciences Workshop on Plasma Materials
Interactions: Report on Science Challenges and Research Opportunities in Plasma Materials Interactions, F.E. Science, Editor. 2015.
8. Atomics, G. DIII-D. 2017 April 4, 2017 [cited 2017 June 6]; Available from: https://fusion.gat.com/global/DIII-D.
9. Holtrop, K., et al., The Design and Use of Tungsten Coated TZM Molybdenum Tile Inserts in the DIII-D Tokamak Divertor. Fusion Science and Technology, 2017: p. 1-6.
10. The, A.T., et al., Impurity fluxes in ASDEX studied with a solid graphite collector probe. Journal of Nuclear Materials, 1990. 176: p. 935-940.
11. Rudakov, D.L., et al., DiMES PMI research at DIII-D in support of ITER and beyond. Fusion Engineering and Design.
12. Stacey, W.M., Fusion: An Introduction to the Physics and Technology of Magnetic Confinement Fusion, Second Edition. 2010.
13. Stangeby, P.C., et al., An experimental comparison of gross and net erosion of Mo in the DIII-D divertor. Journal of Nuclear Materials, 2013. 438: p. S309-S312.
14. Stangeby, P.C., et al., Interpretive modeling of simple-as-possible-plasma discharges on DIII-D using the OEDGE code. Journal of Nuclear Materials, 2003. 313–316: p. 883-887.
15. Profrock, D. and A. Prange, Inductively Coupled Plasma-Mass Spectrometry (ICP-MS) for Quantitative Analysis in Environmental and Life Sciences: A Review of Challenges, Solutions, and Trends. Applied Spectroscopy, 2012. 66(8): p. 843-868.
16. Guilhaus, M., V. Mlynski, and D. Selby, Perfect timing: Time-of-flight mass spectrometry. Rapid Communications in Mass Spectrometry, 1997. 11(9): p. 951-962.
17. Chernushevich, I.V., A.V. Loboda, and B.A. Thomson, An introduction to quadrupole-time-of-flight mass spectrometry. Journal of Mass Spectrometry, 2001. 36(8): p. 849-865.

47
18. Balcerzak, M., An overview of analytical applications of time of flight-mass spectrometric (TOF-MS) analyzers and an inductively coupled plasma-TOF-MS technique. Analytical Sciences, 2003. 19(7): p. 979-989.
19. Bramer, S.E.V., An Introduction to Mass Spectrometry. 1997, Widener University.
20. Agency, U.S.E.P., Technical Fact Sheet - Tungsten, O.o.S.W.a.E. Response, Editor. 2014. p. 6.
21. C. Griggs, S.L., C. Nestler and M. Thompson, Coupling of oxygen and pH requirements for effective microwave-assisted digestion of soils for tungsten analysis. Land Contamination & Reclamation, 2009. 17(1).
22. Clausen, J.L., et al., Challenges and successes in using inductively coupled plasma mass spectrometry for measurements of tungsten in environmental water and soil samples. International Journal of Environmental Analytical Chemistry, 2010. 90(10): p. 773-783.
23. Paris, P., et al., Laser ablation of thin tungsten layers deposited on carbon substrate. Fusion Engineering and Design, 2009. 84(7-11): p. 1465-1467.
24. Wisse, M., et al., PICOSECOND AND NANOSECOND LASER ABLATION OF MIXED TUNGSTEN/ALUMINUM FILMS. Fusion Science and Technology, 2014. 66(2): p. 308-314.
25. Gray, A.L., SOLID SAMPLE INTRODUCTION BY LASER ABLATION FOR INDUCTIVELY COUPLED PLASMA SOURCE-MASS SPECTROMETRY. Analyst, 1985. 110(5): p. 551-556.
26. Philipps, V., et al., Development of laser-based techniques for in situ characterization of the first wall in ITER and future fusion devices. Nuclear Fusion, 2013. 53(9): p. 12.
27. Schweer, B., et al., Laser techniques implementation for wall surface characterization and conditioning. Physica Scripta, 2009. T138: p. 7.
28. Zlobinski, M., et al., Hydrogen retention in tungsten materials studied by Laser Induced Desorption. Journal of Nuclear Materials, 2013. 438: p. S1155-S1159.
29. Zlobinski, M., et al., In situ measurements of fuel retention by laser induced desorption spectroscopy in TEXTOR. Physica Scripta, 2011. T145: p. 4.
30. Stangeby, P.C., The Plasma Boundary of Magnetic Fusion Devices. 2000: Taylor & Francis.
31. Research, N.W., UP213 Universal Platform Laser Ablation System, ESI, Editor. 2008.
32. Wang, Z., B. Hattendorf, and D. Günther, Analyte Response in Laser Ablation Inductively Coupled Plasma Mass Spectrometry. Journal of the American Society for Mass Spectrometry, 2006. 17(5): p. 641-651.
33. D'Oriano, C., et al., Laser-Ablation Inductively Coupled Plasma Mass Spectrometry (LA-ICP-MS): setting operating conditions and instrumental performance. Periodico Di Mineralogia, 2008. 77(3): p. 65-75.
34. Wave, N., UP-213 & UP-266 Pre-Installation Guide

48
35. Wiederhold, J.G., Metal Stable Isotope Signatures as Tracers in Environmental Geochemistry. Environmental Science & Technology, 2015. 49(5): p. 2606-2624.

49
APPENDIX

50
Appendix 1

51
Appendix 2

52
Appendix 3

53
VITA
Jonah D. Duran was born on November 4th 1992 in Athens, Georgia. As an undergraduate student, he studied Nuclear Engineering at the University of Tennessee, Knoxville. As an undergraduate, Jonah also gained experience as an undergraduate research assistant with both Dr. Brian Wirth and Dr. Maik Lang where his focus was on nuclear materials. In addition, he was working as a resident assistant (RA) for the university from 2013 until graduation in 2015. During this time, as an RA, he received several awards for RA of the month and the highest honor of being inducted into the RA Hall of Fame. Here, he finished his undergraduate career and obtained a Nuclear Engineering Bachelor of Science degree in May of 2015. Jonah continued his studies in Nuclear Engineering as a graduate student under the advisement of Dr. David Donovan with an emphasis on nuclear fusion science and technology. During his time in the graduate program, he has been an author on several posters, conference presentations, and a published paper in the Journal of Nuclear Materials. He has written this thesis for a Master’s degree in Nuclear Engineering and plans to graduate in December of 2017.