The application of Geographic Information Systems (GIS) to illustrate
23
The application of Geographic Information Systems (GIS) to illustrate geographical distribution of notifiable diseases in KSA, during the 1990s Introduction: Geographic information system “GIS” have been defined in different ways, based on their functions, basic components and uses. Antenucci et al defined GIS as a computer system that stores and links non-graphic attributes or geographically referenced data with graphic map features to allow a wide rang of information processing and display operations, as well as map production, analysis, and modeling 1 . Parr defined a GIS according to its basic components, which include: 1)data input and editing, 2)data management, 3)data query and retrieval, 4)analysis , modeling, and synthesis, and 5)data display and output functions 2 . Cowen viewed GIS as the integration of spatial data for decision-support systems 3 . In the most restrictive usage, GIS refers only to hardware and software. In common usage, it includes hardware, software, and data. In some organizations GIS also implies the people and procedures involved in GIS operation 4 . Computers were first applied to geography as analytical and display tools during the 1960s. GIS emerged as a multidisciplinary field during the 1970s due to several factors combined to reinforce GIS development. First, computers became more accessible and less costly. Second, mainframe computers gave way to minicomputers and then workstations, which gave great power to the user and included the access to networks that has led to its own revolution in technology. Third, the types of user interface required to operate technical software changed from batch, command-line, and 1
Transcript of The application of Geographic Information Systems (GIS) to illustrate

The application of Geographic Information Systems
(GIS) to illustrate geographical distribution of
notifiable diseases in KSA, during the 1990s
Introduction:
Geographic information system “GIS” have been defined in different
ways, based on their functions, basic components and uses. Antenucci et al
defined GIS as a computer system that stores and links non-graphic
attributes or geographically referenced data with graphic map features to
allow a wide rang of information processing and display operations, as well
as map production, analysis, and modeling 1. Parr defined a GIS according
to its basic components, which include: 1)data input and editing, 2)data
management, 3)data query and retrieval, 4)analysis , modeling, and synthesis,
and 5)data display and output functions 2. Cowen viewed GIS as the
integration of spatial data for decision-support systems3.
In the most restrictive usage, GIS refers only to hardware and
software. In common usage, it includes hardware, software, and data. In
some organizations GIS also implies the people and procedures involved in
GIS operation4.
Computers were first applied to geography as analytical and display
tools during the 1960s. GIS emerged as a multidisciplinary field during the
1970s due to several factors combined to reinforce GIS development. First,
computers became more accessible and less costly. Second, mainframe
computers gave way to minicomputers and then workstations, which gave
great power to the user and included the access to networks that has led to
its own revolution in technology. Third, the types of user interface required
to operate technical software changed from batch, command-line, and
1

remote access to windowing systems and "point and click" graphic
interaction4, 5.
The current GIS list hundreds of system suppliers and sources of
information and catalogs system capabilities. GIS has now developed to the
extent that the contributions of a growing number of parallel disciplines
have both influenced and been influenced by GIS. Disciplines now affecting
GIS include forestry, transportation planning, emergency services delivery,
natural hazards planning, marketing, archeology, surveying, and criminal
justice4, 5.
The power of GIS lies in its ability to 1) integrate and display the
spatial and other kind of information within a single system-offering a
consistent frame work, 2) allows for manipulating and displaying
geographical knowledge in new and exciting ways by putting maps and other
spatial information into digital form, 3) makes connections between
activities based on geographic proximity, 4) allows for access to
administrative records 6.
GIS functional capabilities:
GIS functional capabilities follow the standard GIS definitions; data
can be input into the GIS by importing the data formats both for image-
type (raster) and line-type (vector) digitized maps. These maps are
commercially available. If such a map is not available, the clear alternative is
to prepare a map independently. This can be done through one of three
methods: electronic digitizing, data conversion, or the use of global
positioning systems (GPS) 7.
GIS system captures spatial data for map preparation; Storing,
handling, and integrating geographically referenced data from different
2

sources, that is, it performs some functions of a database manager system;
Retrieving or locating geographic data. GIS Produces various types of data
analyses, including a capability for defining certain conditions as adjacency,
inclusion, and proximity; Producing output in several formats such as maps,
graphs, and tables5.
Spatial analysis refers to the "ability to manipulate spatial data into
different forms and extract additional meaning as a result. Spatial analysis
capabilities allow users to examine and display data in new highly effective
ways. It encompasses the many methods and procedures, developed in
geography, statistics, and other disciplines, for analyzing and relating spatial
information5.
Gatrell and Bailey described three general types of spatial analysis
tasks: visualization, exploratory data analysis, and model building. These
ranges in complexity from simple map overlay operations to statistical
models such as spatial interaction and diffusion models 8.
Visualization can be used to explore the results of traditional
statistical analysis. It determines geographical distribution and variation of
diseases, and their prevalence and incidence. Ranged color maps or
proportional symbol maps can be used to denote the intensity of disease or
vectors. The second general class of GIS methods addresses exploratory
spatial analysis. These methods allow the analyst to shift meaningfully
through spatial data, identify "unusual" spatial patterns, and formulate
hypotheses to guide future research. Among the most important exploratory
methods for epidemiology and public health are methods for identifying
space-time clusters. Modeling, the final class of spatial analysis methods,
modeling involves the integration of GIS with standard statistical and
epidemiological methods. Spatial interaction models analyze and predict the
movements of people, information, and goods from place to place, spatial
3

interactions are central to disease transmission. By accurately modeling these
flows, it is possible to identify areas most at risk for disease transmission and
thus target intervention efforts. Spatial diffusion models analyze and predict
the spread of phenomena over space and time and have been widely used in
understanding spatial diffusion of disease 5.
GIS software:
GIS software has improved remarkably and will undergo still more
changes. The following GIS software are used in the public health domain:
ArcView/Arc GIS and various extentions: this software is produced by
Environmental Systems Research Institute (ESRI). It is used extensively by
researchers and to a lesser extent by practitioners.
MapInfo: this is another popular commercial GIS package developed by
MapInfo. It has many capabilities in public health domain, but not as many
as some of the ESRI products.
EpiInfo/EpiMap: this software was developed by U.S Centers for Disease
Control. It is freely available to help public health professionals develop
questionnaires, customize the data entry process and analyze and map data.
Data values may be entered from the keyboard or supplied in Epi Info or
dBase files.
HealthMapper: It is a joint WHO/UNICEF programme based within the
Department of Communicable Diseases of WHO. It is available at no cost
to public health departments, and provides an excellent means of analyzing
epidemiological data, revealing trends, dependencies and inter-relationships
that would be more difficult to discover in tabular format.
4

ChildInfo: It is a database initially developed in India as a database on
indicators related to nutrition and eventually expanded to include over 100
indicators on women and children. The database was developed by
UNICEF, and has simple tools to link with features that allow users to easily
make tables, graphs and maps based on the data9,10.
Data and files required of a GIS in their sources:
There are essentially two types of data used in a geographical
information system: cartographic data and descriptive or attribute data.
Cartographic data provide a spatial or geographical reference for an object,
whereas descriptive or attribute information indicates the characteristics of
the object.
In general, a GIS contains four types of information and computer
files: geographic, map, attribute, and data-point files. Geographic files are
the heart of a GIS; they contain the data, including the coordinates defining
each unit that are going to be mapped. The map files contain information
on the names of geographical files and other related files forming the GIS;
e.g., names or labels, coverage, colors, map scale, and lines. Attribute files
are rectangular data files whose columns list variables and whose rows
correspond to individual cases or geographical points. Finally, data-point
files are those produced by linking interfacing attribute files and geographic
files through a process called geocoding, using an identifier 7.
5

GIS in Health:
The idea that place and location can influence health is a very old and
familiar concept in Medicine. As far back as the time of Hippocrates, (460-
370 BC), the father of Modern Medicine, when he observed that certain
diseases seem to occur in some places and not in others. In 1854, John
Snow demonstrated the utility of mapping disease outbreaks to gain insights
as to their cause. Snow, an anesthesiologist, mapped the highest density of
cases that occurred in households, which used the public pump on Broad
Street as their water source (figure 1)10.
Since the 1990s, GIS have been increasingly used in public health
settings 11. The WHO and UNICEF created the Public Health Mapping
Programme in 1993, to establish a GIS to support management and
monitoring of the Guinea worm Eradication programme. This has been
expanded to a much wider range of public health applications and now
includes the promotion and use of GIS for other disease control
programmes and in public health departments of a number of countries12.
The ability of GIS to combine different entities based on their
common geographic occurrence makes it a very valuable tool in
epidemiological research, disease surveillance and monitoring. Some recent
applications of GIS include vector borne diseases, water borne diseases,
environmental health and modeling exposure to electromagnetic fields 13.
Also GIS is highly relevant to meet the demands of outbreak investigation
and response, where prompt location of cases, rapid communication of
information, and quick mapping of the epidemic’s dynamics are vital 12.
GIS is being used by public health administrators and professionals,
including policy makers, statisticians, epidemiologist, medical and district
medical officers. Some of its applications in public health are to: find out
6

geographical distribution and variation of diseases, analyse spatial and
temporal trends, identify gaps in immunization, map populations at risk and
stratify risk factors, document health care needs of community and assess
resource allocations, forecast epidemics, plan and target interventions,
monitor diseases and interventions over time, monitor the utilization of
health centers, route health workers and equipments supplies to service
locations, publish health information using maps on the internet and locate
the nearest health facility 14.
Spatial and Temporal Analysis in epidemiology:
Public health practice needs timely information on the course of
disease and other health events to implement appropriate actions. Most
epidemiological data have a location and time reference. Knowledge of the
new information offered by spatial and temporal analysis will increase the
potential for public health action. GIS are an innovative technology ideal for
generating this type of information15,16.
Spatial Analytic Techniques:
Spatial variation in health related data is well known, and its study is a
fundamental aspect of epidemiology. Representation and identification of
spatial patterns play an important role in the formulation of public health
policies. Some of the graphic and exploratory spatial data analytic techniques
are:
Point Patterns: also known as dot maps, attempt to display the distribution
of health events as data locations. The ability to overlay data locations with
other relevant spatial information is a general tool of considerable power. It
7
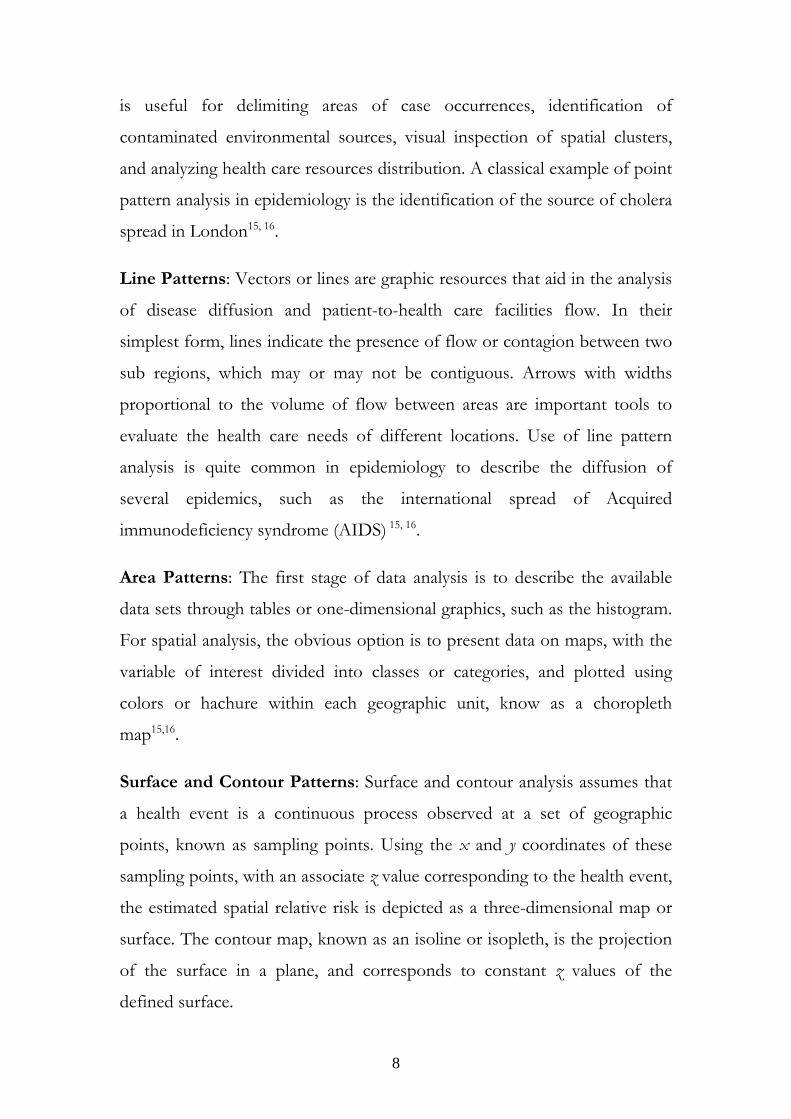
is useful for delimiting areas of case occurrences, identification of
contaminated environmental sources, visual inspection of spatial clusters,
and analyzing health care resources distribution. A classical example of point
pattern analysis in epidemiology is the identification of the source of cholera
spread in London15, 16.
Line Patterns: Vectors or lines are graphic resources that aid in the analysis
of disease diffusion and patient-to-health care facilities flow. In their
simplest form, lines indicate the presence of flow or contagion between two
sub regions, which may or may not be contiguous. Arrows with widths
proportional to the volume of flow between areas are important tools to
evaluate the health care needs of different locations. Use of line pattern
analysis is quite common in epidemiology to describe the diffusion of
several epidemics, such as the international spread of Acquired
immunodeficiency syndrome (AIDS) 15, 16.
Area Patterns: The first stage of data analysis is to describe the available
data sets through tables or one-dimensional graphics, such as the histogram.
For spatial analysis, the obvious option is to present data on maps, with the
variable of interest divided into classes or categories, and plotted using
colors or hachure within each geographic unit, know as a choropleth
map15,16.
Surface and Contour Patterns: Surface and contour analysis assumes that
a health event is a continuous process observed at a set of geographic
points, known as sampling points. Using the x and y coordinates of these
sampling points, with an associate z value corresponding to the health event,
the estimated spatial relative risk is depicted as a three-dimensional map or
surface. The contour map, known as an isoline or isopleth, is the projection
of the surface in a plane, and corresponds to constant z values of the
defined surface.
8

Temporal Analytic Techniques:
Surveillance of diseases requires continuous systematic collection and
analysis of a series of quantitative measurements. The detection and
interpretation of changes in the pattern of the constructed time series is very
important and therefore this presents a major challenge to the public health
systems, as late detection of the 'disease' may result in missed opportunities
for intervention.
Quality Control Charts: Industrial quality control has developed a series of
methods for monitoring. Among them, three major methods appeared in
the public health surveillance literature — the Shewhart test, the simple
cumulative sum test, and V-mask. These methods are based on a
comparison of incoming values from the time series with constant values,
usually defined empirically from historical data. The advantages of these
methods are that they can provide graphic information, and as such can be
incorporated into an information system, helping public health professionals
in the surveillance process15, 16.
Statistical Monitoring: A common measure used by epidemiologists to
identify increases in case occurrence of diseases, is the ratio of case numbers
at a particular time to past case occurrence using the mean or median. Based
on this concept, a monitoring technique has been developed and is currently
in use at CDC (Centers for Disease Control and Prevention, USA).
Expected values for the current month are computed as the average of data
from the corresponding, previous, and subsequent months for the last 5
years15, 16.
Time Series Analysis: To account for the evolving nature of surveillance
data, time series analysis is an alternative for monitoring case occurrence of
health events. The common analytical framework uses time series models to
9

forecast expected numbers of cases, followed by comparison with the actual
observation. Detection of changes from historical patterns through forecast
error uses the difference between the actual and estimated values at each
point in time. In contrast to other monitoring schemes, time series methods
use the correlation structure of the data at different time intervals in making
estimates15, 16.
Temporal Cluster Analysis: This method consists of counting the number
of cases in each possible time interval of fixed length. The largest number of
cases in any such intervals is tested under the null hypothesis that this value
is likely to occur in a case of no epidemic. Application of this method
involves the assumption of a constant population at risk and a constant
detection rate of cases. A modification of the method has been suggested to
avoid the restrictive assumptions involved in the scan statistic. Studies of
temporal clusters based on the time interval between events have also been
described in the literature. These methods assume that the random time
intervals of successive cases form an independent and identically distributed
sequence of exponential random variables15,16.
Spatio-Temporal Analytic Techniques:
Space-time interaction among health events or between health events and
environmental variables is as an important component for epidemiological
studies and public health surveillance. The bulk of the development in
spatio-temporal patterns of health problems has been based on modeling
and simulation because of the paucity of available data sets. Similarly with
time series analysis, the basis of spatio-temporal analytical techniques is the
assumption that observed spatial patterns arise from an underlying process.
Modeling this underlying spatial processes allows for the study of disease
10

diffusion process, and the estimation of linear spatial transfer functions
which best transform a map at time t into that at time t + 1 15,16.
Limitation in using GIS:
Data problems in the world:
In the developed world many data sets that can form at least the
skeleton of a GIS project are available. Geographic data is not of equal
quality, and can contain errors and uncertainty that need to be recognized
and dealt with. Sources of error may be either in the positioning of objects,
errors in the attributes associated with objects, and errors in modeling
spatial variation. While locational data for GIS are easy to obtain in the
United States, health data are not. Public policies and legal guidelines
regarding confidentiality and privacy of health care information are neither
clear nor complete. In the developing world, lack of data is the biggest
problem. Complete data on disease conditions and health at fine scales of
resolution are rare. For example, because lack of reliable data made it
impossible to determine the level of malaria incidence and mortality in
African countries 13.
Training on how to use the software:
There are two levels of training issues; the first relates to how to use a
basic GIS package, and the second relates to how to use GIS software to
better understand and manage the data. Appropriate training is important to
promote the application9.
11

GIS in epidemiological surveillance :
GIS is valuable in strengthening the whole process of epidemiological
surveillance information management and analyses.
In data collection and management :
GIS provides an exellent means of collecting , updating and managing
epidemiological surveillance and related information. It also serves as a
common platform for convergence of multidisease surveillance activities.
Standaradized georeferencing of epidemiological data facilitate standaradized
approaches to data managments.
In data analysis:
GIS provides an exellent means of visualizing and analysing
epidemiological data, thus revealing trends, dependencies and
interrelationships that would be more difficult to discover in other
formats17.
Surveillance in Saudi Arabia:
Health surveillance programs in Saudi Arabia are as old as the
Kingdom itself, beginning in 1933 (1353 Hejira) with a Royal decree
implementing communicable disease prevention efforts. In 1940, Aramco
began malaria control activities, particularly in the Eastern Region, to
protect its employees from major endemic health problems. The Saudi
Arabia government in 1952 began its own malaria control efforts to protect
pilgrims on their route to Makkah and Madinah. This program was later
expanded to include all malarious areas of the Kingdom. In 1963, the Saudi
government and the World Health Organization agreed on a plan of co-
12

operation along the lines of the worldwide malaria control program. In
1979, the First comprehensive annual report of communicable diseases was
published by the department of Preventive Medicine, Ministry of Health,
and over the years, the surveillance system has been expanded.
The surveillance system in Saudi Arabia functions on several levels.
The primary health care centers (PHCCs) collect morbidity data for
reportable diseases and compare that data with previous information in
order to detect any change. This information is passed that on to the
regional level for action in instituting preventive measures. At the regional
level, surveillance data from the PHCCs are analyzed and the diagnosis and
preventive measures verified. These data are passed on to the central
authority for action. The data are compared with other regional and national
figures. Regional health authorities also provide technical and educational
support for employees.
Finally, the central level collects, tabulates and presents all regional
data. Regional and national incidence rates are compared with each other
and with international figures.The central authority verifies reasons for
trends as described by local and regional levels and provide technical
support as needed ,either by personal visit or by phone and fax. Finally, it
ensures that preventive and control measures are within stated policy and
decides whether changes in policy are needed (figure 2)18.
Objectives of the study:
This study was conducted to investigate the application of the
geographic information system “GIS” to illustrate the geographical
distribution of some of the notifiable diseases in the Kingdom of Saudi
Arabia during the period from 1990 to 1999.
13

Materials and Methods :
Source of data:
A spatially referenced database: Nonlocational or descriptive data refer to
the features or attributes (surviellance data) of 15 notifiable diseases in Saudi
Arabia in the period from 1990 to 1999, which are measles, mumps,
diphtheria, chichen pox, whooping cough, hepatitis A, B, & C, brucellosis,
meningococcal meningitis, syphilis, Amoebic dsentery, tetanus and tetanus
Neonatorum.
Locational or spatial data is a coverage shape file for Saudi Arabia, scale
1:2,000,000 was provided from ministry of health, Saudi Arabia.
The epidemiological geographic information system (EPI-GIS) was
established using the health mapper GIS software. Linking the descriptive
database (on access xp) to the GIS software required the conversion data
tables into Access 97, a DBF format . By using the database manager it was
possible to join the DBF descriptive data tables to the features attribute
tables using the command JOIN. We have used a suitable indicator of the
disease which in this study was total number of reported cases yearly for
health regions, or created a new indicator if it is not available. The pattern of
spatial analysis used was point and area pattern. Digitised data from existing
maps provided base layers (topography, land use, roads, rivers, surface
water) on which other data can be overlaid. The distribution of cases was
displayed as data locations through HealthMapper using the command
overlay indicator. Each layer was related to one year or sum of years
according to what was requested.
14

Notifiable diseases in Saudi Arabia:
Thirty one diseases were reported from 20 health regions in the
annual health report of 1999. Twenty two of these disease have been
reportable since 1990. They were from 18 health regions. Those disease are
Whooping cough, tetanus neonatorum, other forms of tetanus,
poliomyelitis, measles, mumps, rubella, chickenpox, brucellosis,
meningococcal meningitis, other meningitis, hepatitis A, hepatitis B,
unspecified hepatitis, amoebic dysentery, typhoid, paratyphoid, shigellosis,
salmonellosis, purperal fever, rabies, syphilis and other venereal diseases.
In 1992, reporting health provinces were increased to 19 when Bishah
was added to the previous ones (Riyadh, Makkah, Jeddah, Taif, Medinah,
Qaseem, Eastern, Al-Ahssa, Hafr-Albaten, Asir, Tabouk, Hail, Northern,
Jazan, Najran, Al-Bahah, Aljouf and Al-Qurayyat). Diphtheria was added to
the notifiable diseases in the same year. Guillian-Barre syndrome was added
in 1993, and hepatitis C, echinococcus (hyadatid disease), transverse myelitis,
other suspected cases of poliomylitis, pnemococcal meningitis, haemophilus
meningitis, and hemolytic uraemic syndrome were added in 1995. In 1996,
health provinces rose to 20 provinces when Al-Qunfudah was added.
15

Results:
A sequence of maps was produced comparing density of reported cases in
all health regions in the kingdom during 1990s. Dots in each health region
on the maps mean presence of this number of cases in this health region but
do not specify the real location of the cases in each health region.
The present study demonstrates use of GIS and spatial analysis to 15
notifiable diseases.
Measles: It is clear from measles maps that high density of measles cases
were seen in 1992 and another increase were in 1997-1998 (figure 3, 4).
Mumps: In 1990, Mumps cases were high all over the kingdom with
maximum levels in Jeddah (figure 5, 6).
Diphtheria: It was reported in the annual health report for the first time in
1992. By comparing six years from 1992 to 1997, there were few scattered
cases, which increased to eight in 1993 (figure 7, 8).
Chickenpox: Graduated colors have been used to illustrate density of
chickenpox every two years from 1991 to 1997 at all health regions. It was
clear that the highest density of chickenpox cases were in 1991. Eastern
province followed by Riyadh had the highest density of cases (figure 9).
Whooping cough: Maps demonstrate increase of whooping cough cases in
1992 and in 1998 compared to reported cases in other years (figure 10, 11).
Hepatitis A: Hepatitis A map has illustrated presence of cases all over the
kingdom. In 1990, Najran was free of hepatitis A. Asir reported highest level
of hepatitis A from 1990 till 1996 (figure 12).
Hepatitis B: By comparing hepatitis B cases every two years, it was clear
that number of reported cases of hepatitis B did not decline during 1990s
16

and maximum level was reported from Jeddah. Northern region had
registered the lowest level of reported hepatitis B cases (figure 13, 14).
Hepatitis C: Comparing five years from1995 to 1999 of hepatitis C cases, it
was clear that number of cases were increasing in Makkah and Jeddah
(figure 15).
Rubella: Figure 16 demonstrated maximum level of rubella cases were in
1992, which were reported from Riyadh and Asir.
Brucellosis: Highest level of brucellosis was in 1990, northern region
showed declined level of reported cases (figure17, 18)
Tetanus and tetanus neonatorum: Few cases of tetanus and tetanus
neonatrom were reported, they were concentrated in Jeddah and Makkah
(figure 19, 20, 21, 22).
Meningococcal meningitis: There was increase in reported
meningococcal meningitis in 1997 with maximum level in Makkah (figure
23, 24, 25).
Syphilis: Maps of syphilis demonstrate low level at northern region. Eastern
province reported maximum level particularly in1992 followed by Jeddah
(figures 26, 27).
Amoebic dysentery: During period from 1990 to 1994, Asir reported
maximum level of Amoebic dysentery. From 1995, Jeddah started to report
the highest level of reported amebic cases (figure 28, 29).
17

Discussion:
This computer-based technology has been available for a number of
years but it is only recently that it has been widely appreciated as a powerful
new tool that supports health situation analysis, operations research, and
surveillance for the prevention and control of health problems.
Health Geographic Information System (HGIS) has proven to be a
potent tool for risk assessment, decision-making, intervention evaluation
and health planning19. The use of this technology can be tailored to suit a
wide range of application; some recent applications include vector-borne
diseases, water-borne diseases and environmental health. One of the best
examples is application of GIS in malaria control programs which worthy in
many countries. In the kingdom effort has been made to implement GIS in
malaria control mainly in malarious areas like Jizan and Asir.
GIS was also very efficient when it was used for planning of Jeddah
health care facilities, Murad applied GIS to analyze accessability to hospitals
in Jeddah, Saudi Arabia in 200120. That application identified the parts of the
city which require more attention regarding their health care supply.
Identifying health care needs is one of the important tasks which health
authorities frequently do. Information technology in general and GIS in
particular can help the health authorities to make their decision.
GIS and remote sensing have been also used to study the
transmission and outbreak of Rift valley fever (RVF) in Jizan region, Saudi
Arabia.21 Geographical databases and disease epidemiology have been
integrated into decision support system.
The present study demonstrates use of GIS and spatial analysis to 15
notifiable diseases. It compares the density of reported cases from all health
regions over time every year or every two years which provide quick and
18

reliable information for discussion, planning, assessment, analysis and
decision making.
Mapping of the incidence/ prevalence of notifiable diseases over
geographic areas is the basic application but this information was not
available. We therefore used reported cases of notifiable diseases from the
annual health report, ministry of health. GIS could generate hundreds of
maps and charts of the reported diseases and this study illustrates examples
of them. Each layer represent data of one year , moving from one layer to
another by activate layer or more reveal where was the density of the
reported cases came from and what has changed during that period.
Comparing maps of different years can provide excellent means of
visualizing trends.
Quick response by activation of one layer or more was very
informative when data have been displayed. Comparing maps and charts by
using GIS technology has provided immediate visualization of the density
difference of reported cases between the health regions during 1990s and
was extremely effective in understanding the data.
19
Conclusions:
GIS technology has the potential to revolutionize health surveillance.
It gives health professionals quick and easy access to large volumes of data.
GIS is valuable in strengthening the whole process of epidemiological
surveillance information management and analyses.
Moreover, these systems provide analytical support for the planning,
programming, and evaluation of activities and interventions in the health
sector. Thus, GIS can be considered part of the decision-support systems
for people who formulate and follow health policy.
20

Limitations:
• Skills how to use GIS software which need training and
imaginative use of the researchers.
• Lack of population size for each health region to calculate the
incidence rates.
Recommendations:
• Use of GIS in collecting, updating, managing public health
data.
• Completion of reporting data is a very important issue for GIS
setup.
• Address many characteristics of notifiable disease into the
reporting system e.g. risk factors, incidence and prevalence
rate.
• GIS is a new technology that staffs with GIS training and skills
are in high demand.
Acknowledgment:
We would like to thank the World Health Organization which
provides the GIS-software (HealthMapper). Also we would like to thank
biostatistic department in Ministry of Health for supplying annual statistical
books.
21

References:
1- Anenucci J.K., Brown P.L., Croswell M.J., Kevany M.J., Archer H. Geographic
information systems: A guide to the technology. New York: Van Nostrand Reinhold.
1991.
2- Parr D.M. Introduction to geographic information systems workshop. The Urban&
Regional Information Systems Association.1991.
3- Cowen D.J. GIS versus CAD versus DBMS: what are the differences? In introductory
readings in geographic information systems. ed. D J Peuquet and D F Marble.1990; 52-
61. London: Taylor & Francis.
4- Richards T, Croner C, Rushton G, Brown C, Fowler L. Geographic Information
Systems and Public Health: Mapping the Future. Public Health Reports.1999; 114:359-
373.
5- Clarke K, McLafferty S, Tempalski B. On Epidemiology and Geographic Information
Systems: A Review and Discussion of future directions. Emerging infectious
diseases.1996; 2(2)
6- Drake V. GIS- Intro lecture . Earth Sciences Department. Santa Monica College.2001
7- Pan American Health Organization. Use of Geographic Information Systems in
Epidemiology (GIS-Epi) Epidemiological Bulletin.1996; 17(1)
8- Gatrell A, Bailey T. Can GIS be made to sing and dance to an epidemiological tune?
Presented at the International Symposium on Computer Mapping and Environmental
Health, Tampa, FL, February 1995
9- Sipe N, Dale P. Challenges in using geographic information systems (GIS) to
understand and control malaria in Indonesia. Malaria Journal 2003; 2(36)
10- Balaji L. GIS in health. UNICEF, India country office. (www.gisdevelopment.net
/application /health).
11- Kaiser R, Spiegel P, Henderson A, Gerber M. The application of geographic
information systems and global positioning systems in humanitarian emergencies: lessons
learned, programme implications and future research. Disasters. 2003; 27 (2): 127-40
12- World Health Organization. GIS and public health mapping. (www.who.int ). 2004
22

13- Oppong J. Data problems in GIS and health. University of North Texas.
14- Johnson C, Johnson J. GIS: A tool for monitoring and management of epidemics.
Map India 2001 Conference, New Delhi, February 2001.
15- Gupta R, Jay D, Jain R. Geographic Information Systems for the study and control
of infectious diseases. Pilani. India. (www.gisdevelopment.net /application /health).
16- Nobre F, Carvalho M. Spatial and Temporal Analysis of Epidemiological Data. GIS
for Health and the Environment. February 1996
17- World Health organization. Weekly Epidemiological Record.1999;74(34):281-288
18- Ministry of Health. Surveillance in Saudi Arabia. Saudi Epidemiology Bulletin.
1993;1(2)
19-Karsenty E, Leventhal A. Health Geographic Information System (HGIS)—a tool for
health planning and epidemiology. Harefuah.2002; 141(12):1070-5, 1089
20- Murad A. Application of GIS in health care facilities planning. (www.GIS
development.2001).
21-Aldosari A, Webb B, Quine T, Coles T. Uses GIS and remote sensing to study
outbreak of Rift valley fever in Jizan region, Saudi Arabia.(www.ex.ac.uk/ geography/
staff/ aldosari.html).
23