
Manuel João de Albuquerque Rocha Pereira Bóia [email protected]
Upload
aubrey-alexanderCategory
view
220download
3
The application of CIS to Portugal:The application of CIS to Portugal:
Survey Implementation and Survey Implementation and Results Analysis - Innovation vs. ProductivityResults Analysis - Innovation vs. Productivity
Manuel João Bóia Manuel João Bóia
[email protected]@dem.ist.utl.pt
Pedro Faria Pedro Faria
[email protected]@dem.ist.utl.pt
Science and Technology Policy ProgramScience and Technology Policy Program
MSc Engineering Policy and Management of TechnologyMSc Engineering Policy and Management of Technology
5th November 20045th November 2004
OutlineOutline
Part 1 – Innovation IndicatorsPart 1 – Innovation Indicators
1.1. Innovation IndicatorsInnovation Indicators
2.2. The Community Innovation SurveyThe Community Innovation Survey
3.3. Students PresentationStudents Presentation
4.4. Results (CIS 3),Results (CIS 3),
Innovative Enterprises by Sector and CIS Trajectories in the Innovative Enterprises by Sector and CIS Trajectories in the European ContextEuropean Context
Input vs. Output of Innovation in EuropeInput vs. Output of Innovation in Europe
Some Innovation CharacteristicsSome Innovation Characteristics
Other Strategic and Organizational Important ChangesOther Strategic and Organizational Important Changes
Innovation SourcesInnovation Sources
Innovation BarriersInnovation Barriers
5.5. Lessons Learned and ConclusionsLessons Learned and Conclusions

OutlineOutline
Part 2 - Innovation and Productivity: Part 2 - Innovation and Productivity: What can we learn from the CIS 3 Results for What can we learn from the CIS 3 Results for Portugal?Portugal?
1.1. Innovation and Productivity TheoryInnovation and Productivity Theory
2.2. A model for the analysis of innovation and productivity in the short A model for the analysis of innovation and productivity in the short runrun
3.3. Results with CIS 3 dataResults with CIS 3 data
4.4. Lessons Learned and ConclusionsLessons Learned and Conclusions
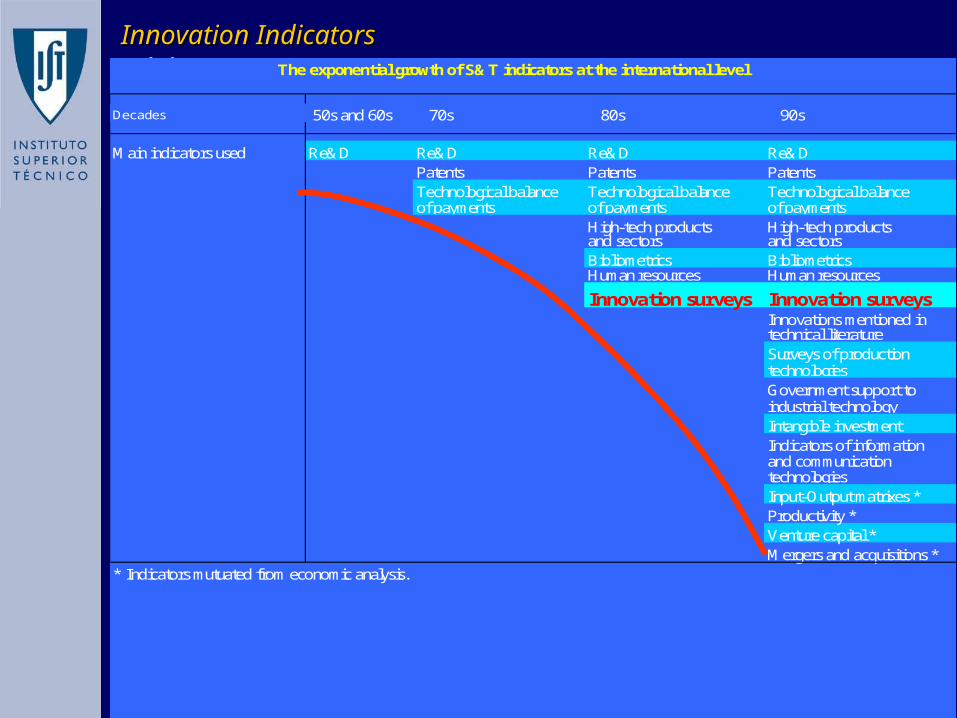
Innovation IndicatorsInnovation Indicators1.11.1 The exponential growth of S&T indicators at the international level
Decades 50s and 60s 70s 80s 90s
Main indicators used Re&D Re&D Re&D Re&DPatents Patents PatentsTechnological balance Technological balance Technological balanceof payments of payments of payments
High-tech products High-tech productsand sectors and sectorsBibliometrics BibliometricsHuman resources Human resources
Innovation surveys Innovation surveysInnovations mentioned intechnical literatureSurveys of productiontechnologiesGovernment support toindustrial technologyIntangible investmentIndicators of informationand communication technologiesInput-Output matrixes *Productivity *Venture capital *Mergers and acquisitions *
* Indicators mutuated from economic analysis.
CIS 3CIS 32.12.1
PortugalPortugal
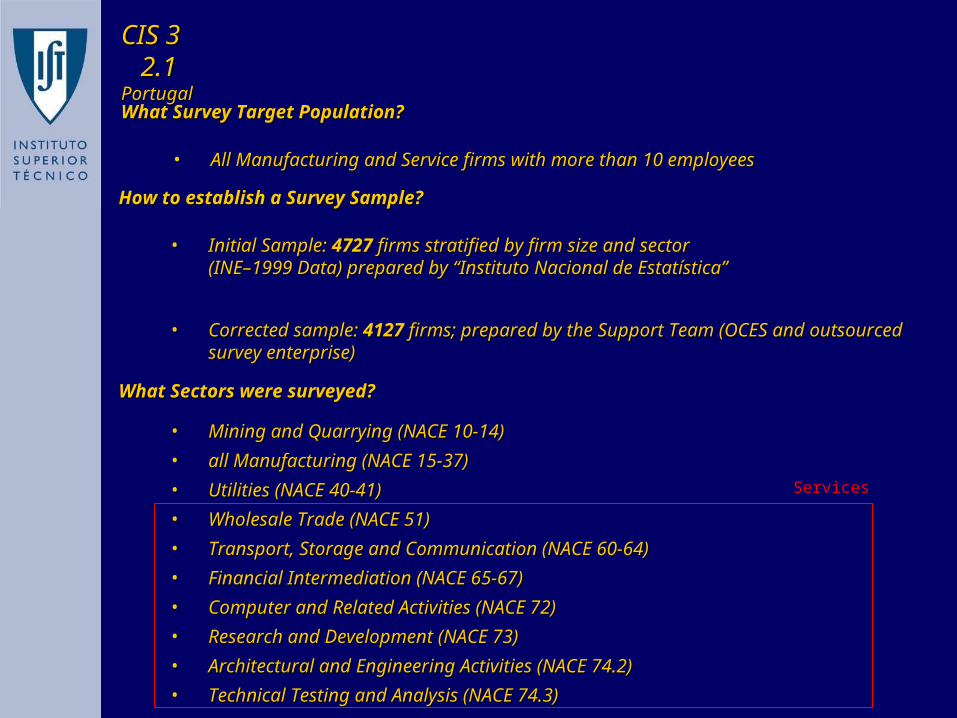
How to establish a Survey Sample?How to establish a Survey Sample?
• Initial Sample: Initial Sample: 47274727 firms stratified by firm size and sector firms stratified by firm size and sector (INE–1999 Data) prepared by “Instituto Nacional de Estatística”(INE–1999 Data) prepared by “Instituto Nacional de Estatística”
• Corrected sample: Corrected sample: 41274127 firms; prepared by the Support Team (OCES and firms; prepared by the Support Team (OCES and outsourced survey enterprise)outsourced survey enterprise)
What Sectors were surveyed?What Sectors were surveyed?
• Mining and Quarrying (NACE 10-14)Mining and Quarrying (NACE 10-14)
• all Manufacturing (NACE 15-37)all Manufacturing (NACE 15-37)
• Utilities (NACE 40-41)Utilities (NACE 40-41)
• Wholesale Trade (NACE 51) Wholesale Trade (NACE 51)
• Transport, Storage and Communication (NACE 60-64)Transport, Storage and Communication (NACE 60-64)
• Financial Intermediation (NACE 65-67)Financial Intermediation (NACE 65-67)
• Computer and Related Activities (NACE 72)Computer and Related Activities (NACE 72)
• Research and Development (NACE 73)Research and Development (NACE 73)
• Architectural and Engineering Activities (NACE 74.2)Architectural and Engineering Activities (NACE 74.2)
• Technical Testing and Analysis (NACE 74.3)Technical Testing and Analysis (NACE 74.3)
What Survey Target Population?What Survey Target Population?
• All Manufacturing and Service firms with more than 10 employeesAll Manufacturing and Service firms with more than 10 employees
Services
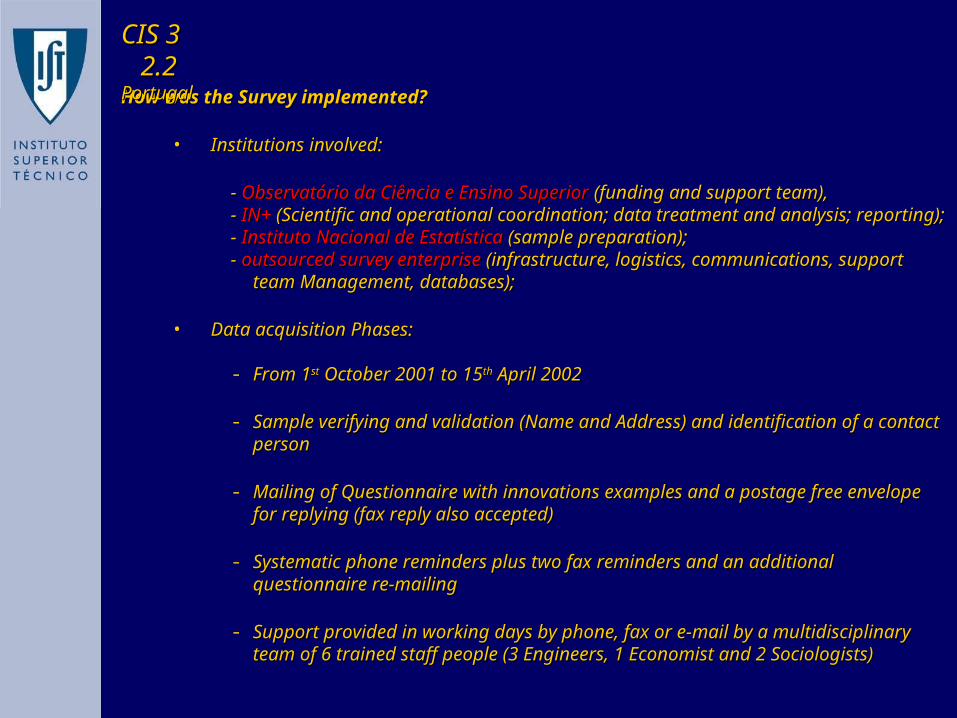
How was the Survey implemented?How was the Survey implemented?
• Institutions involved: Institutions involved:
- - Observatório da Ciência e Ensino SuperiorObservatório da Ciência e Ensino Superior (funding and support team), (funding and support team),- - IN+IN+ (Scientific and operational coordination; data treatment and analysis; (Scientific and operational coordination; data treatment and analysis;
reporting); reporting); - - Instituto Nacional de EstatísticaInstituto Nacional de Estatística (sample preparation); (sample preparation); - - outsourced survey enterpriseoutsourced survey enterprise (infrastructure, logistics, communications, (infrastructure, logistics, communications,
support team Management, databases); support team Management, databases);
• Data acquisition Phases:Data acquisition Phases:
- From 1From 1stst October 2001 to 15 October 2001 to 15thth April 2002 April 2002
- Sample verifying and validation (Name and Address) and identification of Sample verifying and validation (Name and Address) and identification of a contact persona contact person
- Mailing of Questionnaire with innovations examples and a postage free Mailing of Questionnaire with innovations examples and a postage free envelope for replying (fax reply also accepted) envelope for replying (fax reply also accepted)
- Systematic phone reminders plus two fax reminders and an additional Systematic phone reminders plus two fax reminders and an additional questionnaire re-mailingquestionnaire re-mailing
- Support provided in working days by phone, fax or e-mail by a Support provided in working days by phone, fax or e-mail by a multidisciplinary team of 6 trained staff people (3 Engineers, 1 Economist multidisciplinary team of 6 trained staff people (3 Engineers, 1 Economist and 2 Sociologists)and 2 Sociologists)
CIS 3CIS 32.22.2
PortugalPortugal
Innovation Definition Used:Innovation Definition Used:
• Market introductionMarket introduction of a product (Good or Service) of a product (Good or Service) new or significantly new or significantly
improvedimproved, or the introduction of new or significantly improved processes, , or the introduction of new or significantly improved processes,
based on new technological developments, new combinations of existing based on new technological developments, new combinations of existing
technologies or on the use of other type of knowledge acquired.technologies or on the use of other type of knowledge acquired.
The innovation should be The innovation should be new to the companynew to the company and not necessarily to the market. and not necessarily to the market.
CIS 3CIS 32.32.3
PortugalPortugal
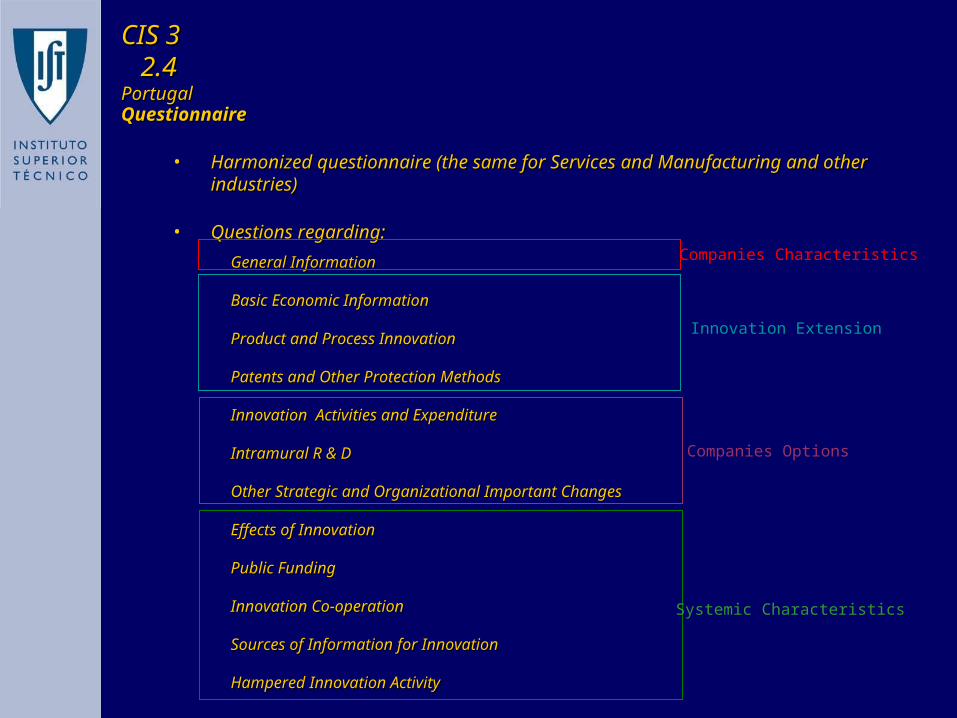
QuestionnaireQuestionnaire
• Harmonized questionnaire (the same for Services and Manufacturing and Harmonized questionnaire (the same for Services and Manufacturing and other industries)other industries)
• Questions regarding:Questions regarding:
General InformationGeneral Information
Basic Economic InformationBasic Economic Information
Product and Process InnovationProduct and Process Innovation
Patents and Other Protection MethodsPatents and Other Protection Methods
Innovation Activities and ExpenditureInnovation Activities and Expenditure
Intramural R & DIntramural R & D
Other Strategic and Organizational Important ChangesOther Strategic and Organizational Important Changes
Effects of InnovationEffects of Innovation
Public FundingPublic Funding
Innovation Co-operationInnovation Co-operation
Sources of Information for InnovationSources of Information for Innovation
Hampered Innovation ActivityHampered Innovation Activity
Companies Characteristics
Innovation Extension
Companies Options
Systemic Characteristics
CIS 3CIS 32.42.4
PortugalPortugal
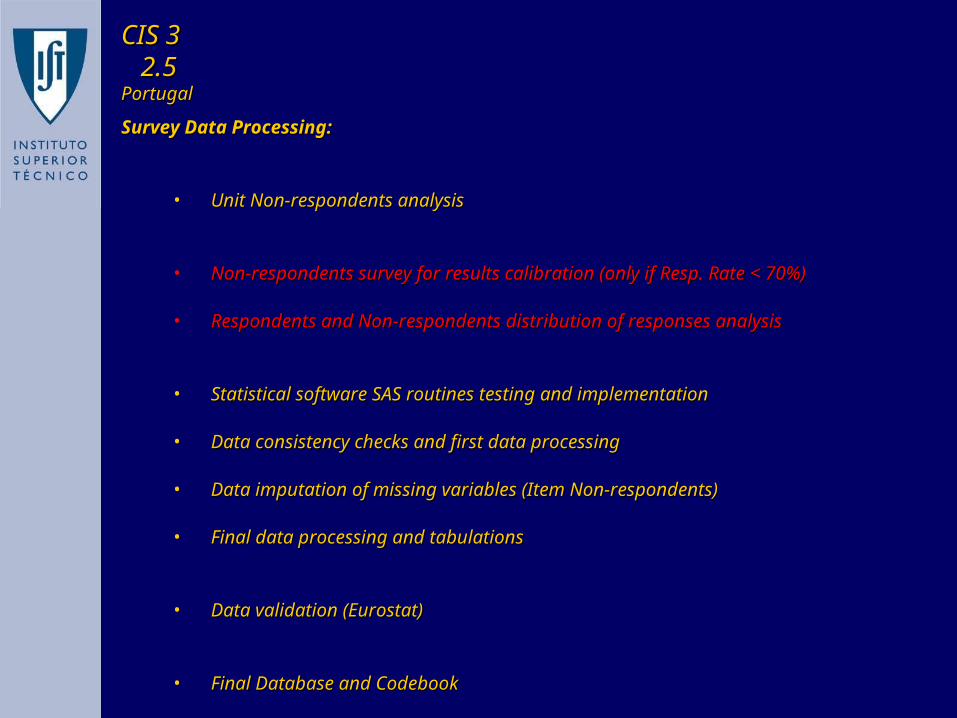
Survey Data Processing:Survey Data Processing:
• Unit Non-respondents analysis Unit Non-respondents analysis
• Non-respondents survey for results calibration (only if Resp. Rate < 70%)Non-respondents survey for results calibration (only if Resp. Rate < 70%)
• Respondents and Non-respondents distribution of responses analysisRespondents and Non-respondents distribution of responses analysis
• Statistical software SAS routines testing and implementationStatistical software SAS routines testing and implementation
• Data consistency checks and first data processingData consistency checks and first data processing
• Data imputation of missing variables (Item Non-respondents)Data imputation of missing variables (Item Non-respondents)
• Final data processing and tabulationsFinal data processing and tabulations
• Data validation (Eurostat)Data validation (Eurostat)
• Final Database and CodebookFinal Database and Codebook
CIS 3CIS 32.52.5
PortugalPortugal
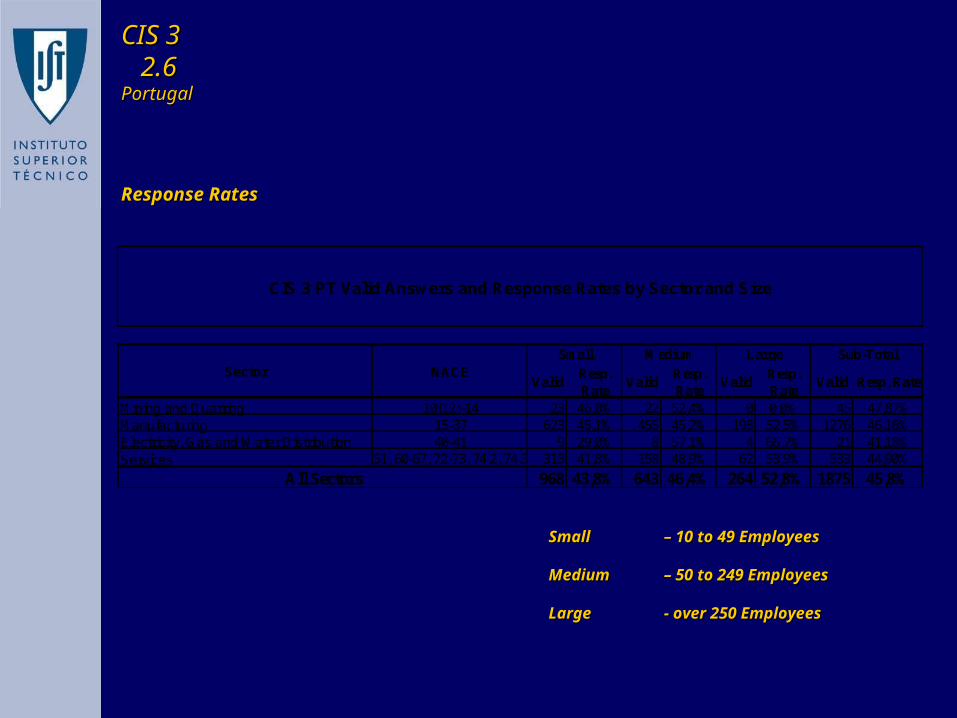
Response RatesResponse Rates
ValidResp. Rate
ValidResp. Rate
ValidResp. Rate
Valid Resp. Rate
Mining and Quarring 10(12)-14 23 46,0% 22 52,4% 0 0,0% 45 47,87%Manufacturing 15-37 623 45,1% 455 45,2% 198 52,5% 1276 46,16%Electricity, Gas and Water Distribution 40-41 9 29,0% 8 57,1% 4 66,7% 21 41,18%Services 51, 60-67, 72-73, 74.2, 74.3 313 41,8% 158 48,9% 62 53,9% 533 44,90%
968 43,8% 643 46,4% 264 52,8% 1875 45,8%
Sector
All Sectors
CIS 3 PT Valid Answers and Response Rates by Sector and Size
Small Medium Large NACE
Sub-Total
Small Small – 10 to 49 Employees– 10 to 49 Employees
Medium Medium – 50 to 249 Employees– 50 to 249 Employees
Large Large - over 250 Employees- over 250 Employees
CIS 3CIS 32.62.6
PortugalPortugal
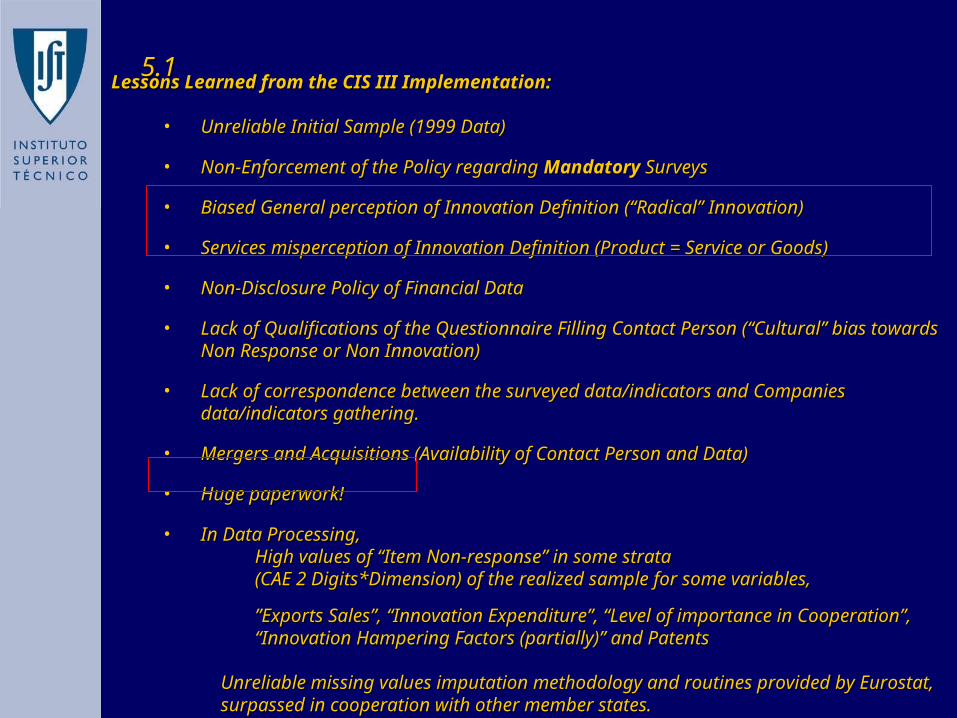
Lessons Learned from the CIS III Implementation:Lessons Learned from the CIS III Implementation:
• Unreliable Initial Sample (1999 Data)Unreliable Initial Sample (1999 Data)
• Non-Enforcement of the Policy regarding Non-Enforcement of the Policy regarding MandatoryMandatory Surveys Surveys
• Biased General perception of Innovation Definition (“Radical” Innovation)Biased General perception of Innovation Definition (“Radical” Innovation)
• Services misperception of Innovation Definition (Product = Service or Goods)Services misperception of Innovation Definition (Product = Service or Goods)
• Non-Disclosure Policy of Financial DataNon-Disclosure Policy of Financial Data
• Lack of Qualifications of the Questionnaire Filling Contact Person (“Cultural” Lack of Qualifications of the Questionnaire Filling Contact Person (“Cultural” bias towards Non Response or Non Innovation)bias towards Non Response or Non Innovation)
• Lack of correspondence between the surveyed data/indicators and Companies Lack of correspondence between the surveyed data/indicators and Companies data/indicators gathering.data/indicators gathering.
• Mergers and Acquisitions (Availability of Contact Person and Data)Mergers and Acquisitions (Availability of Contact Person and Data)
• Huge paperwork!Huge paperwork!
• In Data Processing,In Data Processing,High values of “Item Non-response” in some strata High values of “Item Non-response” in some strata (CAE 2 Digits*Dimension) of the realized sample for some variables,(CAE 2 Digits*Dimension) of the realized sample for some variables,
”Exports Sales”, “Innovation Expenditure”, “Level of importance in ”Exports Sales”, “Innovation Expenditure”, “Level of importance in Cooperation”, “Innovation Hampering Factors (partially)” and PatentsCooperation”, “Innovation Hampering Factors (partially)” and Patents
Unreliable missing values imputation methodology and routines provided by Unreliable missing values imputation methodology and routines provided by Eurostat, surpassed in cooperation with other member states.Eurostat, surpassed in cooperation with other member states.
5.15.1

Students PresentationsStudents Presentations
IrelandAustria
Germany
The Netherlands
UK
Sweden
Norway
France
Luxemburg
Belgium
0%
20%
40%
60%
80%
20% 40% 60% 80%
Proportion of Manufacturing Innovating Enterprises
Pro
po
rtio
n o
f
Ser
vic
e In
no
vati
ng
E
nte
rpri
se
s
Portugal Italy
Finland
Greece
DenmarkSpain
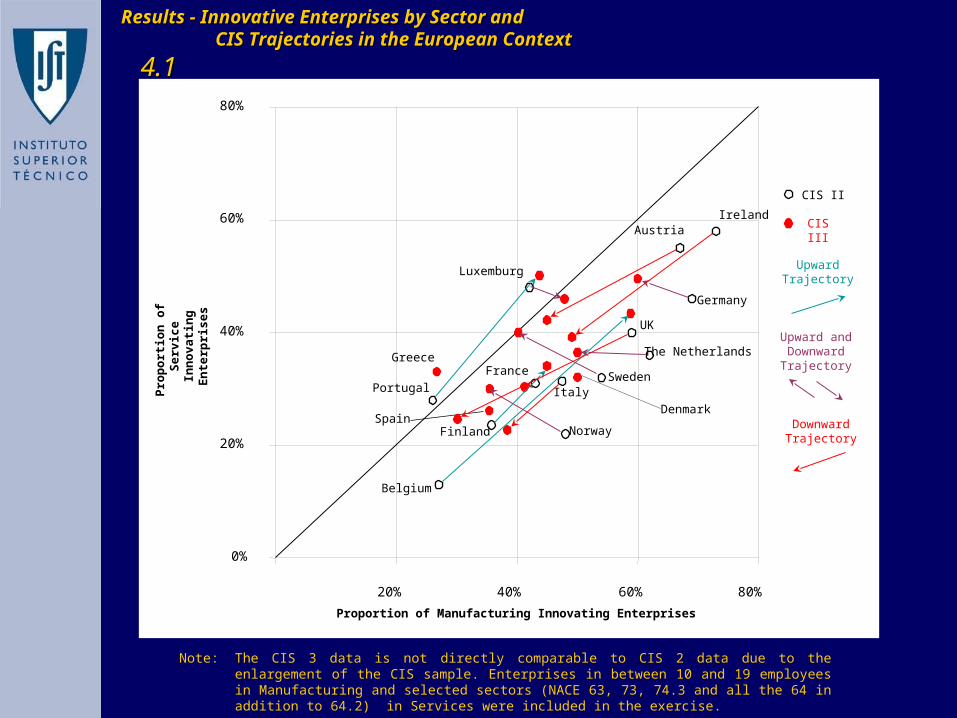
Results - Innovative Enterprises by Sector and Results - Innovative Enterprises by Sector and CIS Trajectories in the European ContextCIS Trajectories in the European Context
Note: The CIS 3 data is not directly comparable to CIS 2 data due to the enlargement of the CIS sample. Enterprises in between 10 and 19 employees in Manufacturing and selected sectors (NACE 63, 73, 74.3 and all the 64 in addition to 64.2) in Services were included in the exercise.
CIS III
CIS II
Upward Trajectory
Upward and Downward Trajectory
Downward Trajectory
4.14.1
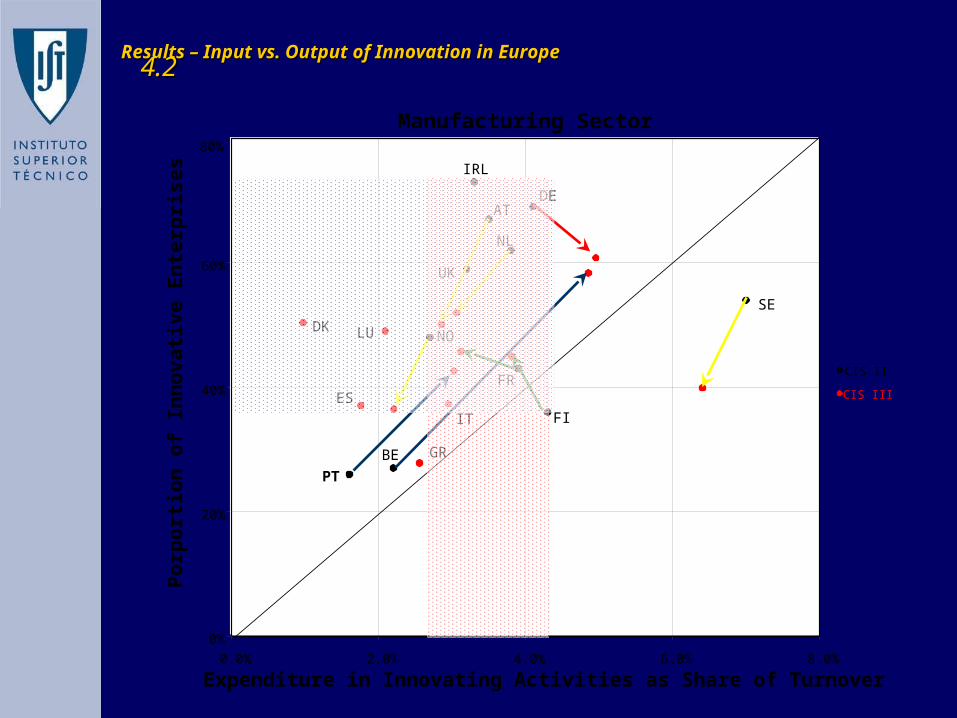
Results – Input vs. Output of Innovation in EuropeResults – Input vs. Output of Innovation in Europe4.24.2
IRL
DEAT
NL
UK
SE
NO
FR
FI
BE
PT
0%
20%
40%
60%
80%
0.0% 2.0% 4.0% 6.0% 8.0%
Expenditure in Innovating Activities as Share of Turnover
Po
rpo
rtio
n o
f In
no
va
tiv
e E
nte
rpri
se
s
Manufacturing Sector
CIS III
CIS II
GR
ES
IT
LUDK
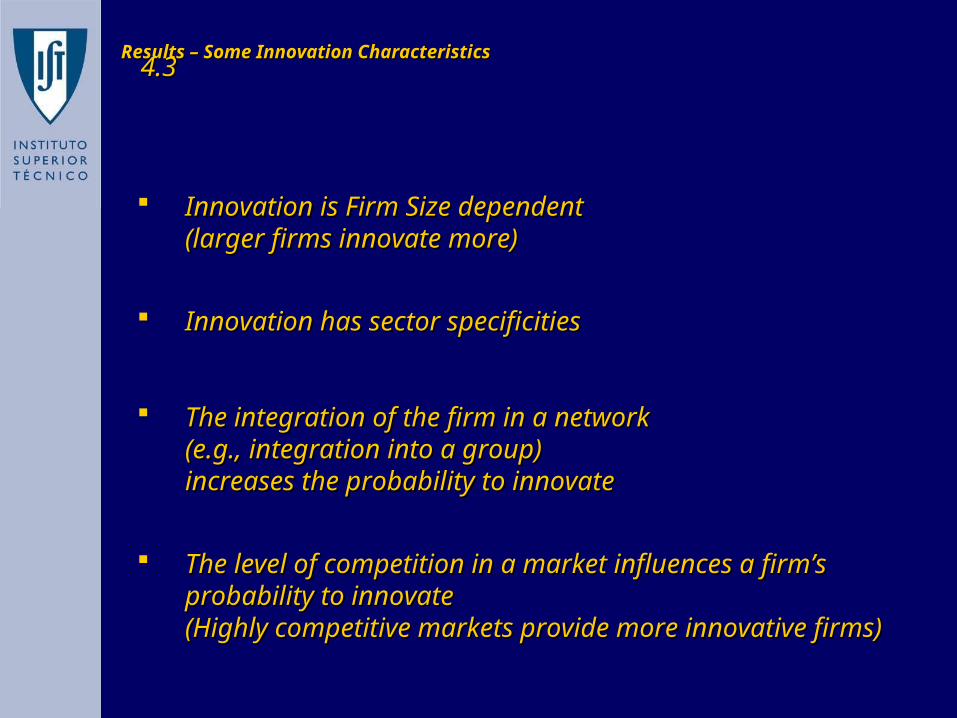
Results – Some Innovation CharacteristicsResults – Some Innovation Characteristics4.34.3
Innovation is Firm Size dependent Innovation is Firm Size dependent (larger firms innovate more)(larger firms innovate more)
Innovation has sector specificitiesInnovation has sector specificities
The integration of the firm in a network The integration of the firm in a network (e.g., integration into a group) (e.g., integration into a group) increases the probability to innovateincreases the probability to innovate
The level of competition in a market influences a firm’s The level of competition in a market influences a firm’s probability to innovate probability to innovate (Highly competitive markets provide more innovative (Highly competitive markets provide more innovative firms)firms)
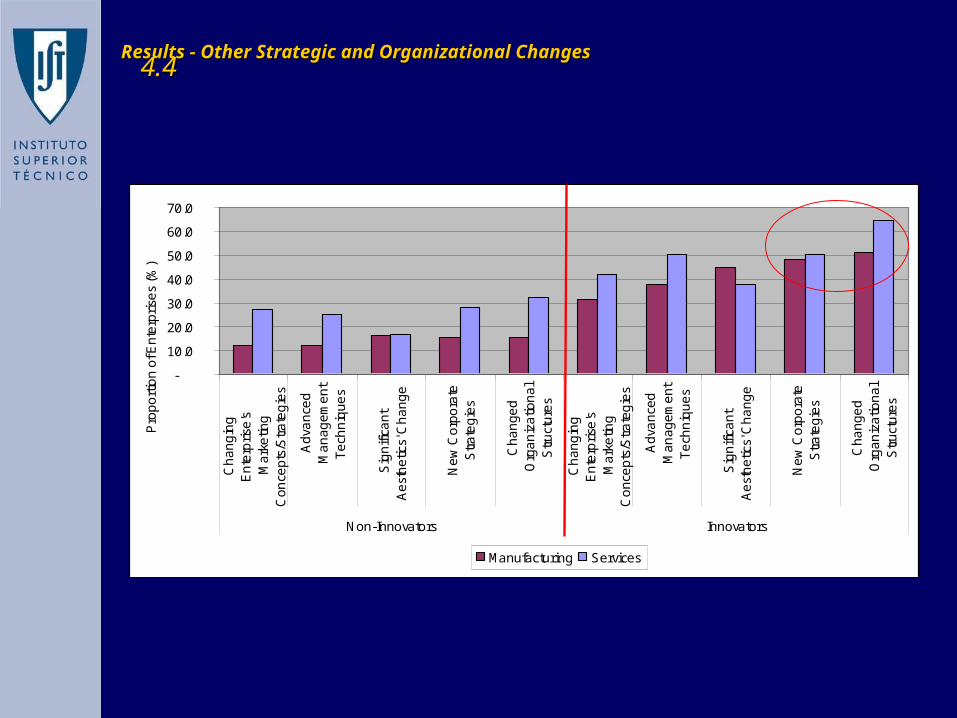
Results - Other Strategic and Organizational ChangesResults - Other Strategic and Organizational Changes
-
10.0
20.0
30.0
40.0
50.0
60.0
70.0
Ch
an
gin
gE
nte
rpri
se's
Ma
rke
ting
Co
nce
pts
/Str
ate
gie
s
Ad
van
ced
Ma
na
ge
me
nt
Te
chn
iqu
es
Sig
nifi
can
tA
est
he
tics'
Ch
an
ge
Ne
w C
orp
ora
teS
tra
teg
ies
Ch
an
ge
dO
rga
niz
atio
na
lS
tru
ctu
res
Ch
an
gin
gE
nte
rpri
se's
Ma
rke
ting
Co
nce
pts
/Str
ate
gie
s
Ad
van
ced
Ma
na
ge
me
nt
Te
chn
iqu
es
Sig
nifi
can
tA
est
he
tics'
Ch
an
ge
Ne
w C
orp
ora
teS
tra
teg
ies
Ch
an
ge
dO
rga
niz
atio
na
lS
tru
ctu
res
Non-Innovators Innovators
Pro
po
rtio
n o
f En
terp
rise
s (%
)
Manufacturing Services
4.44.4
0
5
10
15
20
25
30
35
40
45
50
With
in the E
nte
rprise
Clie
nts
Oth
er
Ente
rprises
with
in the E
nte
rprise
Gro
up
Fairs a
nd E
xhib
itions
Supplie
rs
Com
petit
ors
Pro
fessio
nal
Confe
rences,
meetin
gs a
nd jo
urn
als
Univ
ers
ities a
nd o
ther
Hugher
Educatio
nIn
stit
utio
ns
Govern
ment or
Private
non-p
rofit
instit
ute
s
Innovatin
g E
nte
rprises w
ith H
ighly
import
ant S
ourc
es (
%)
1995-1997 Europe Average 1995-1997 1998-2000
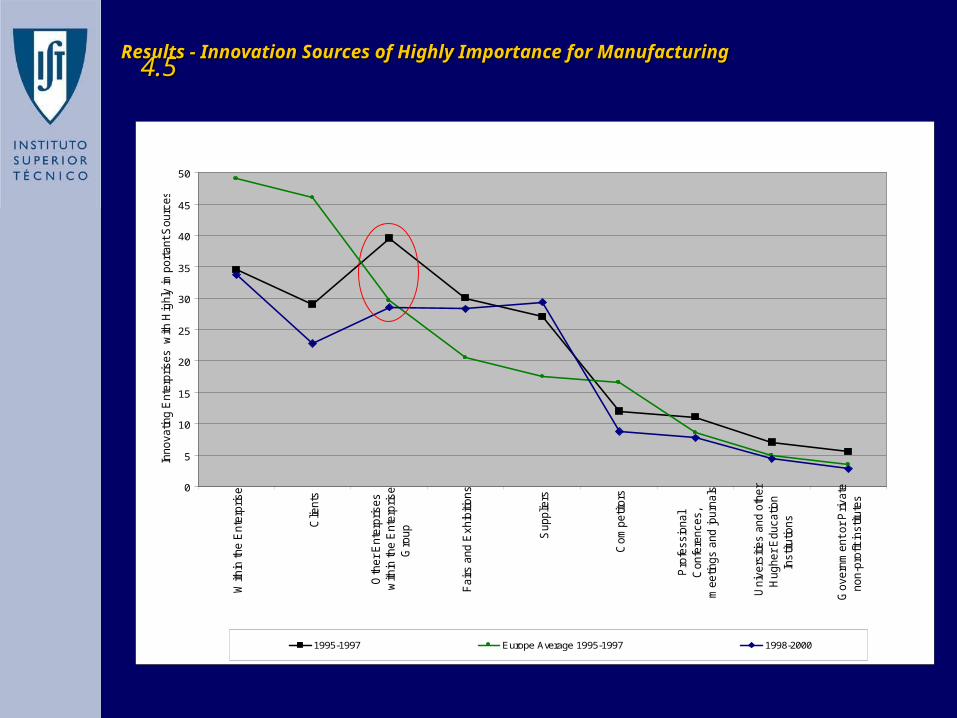
Results - Innovation Sources of Highly Importance for ManufacturingResults - Innovation Sources of Highly Importance for Manufacturing4.54.5
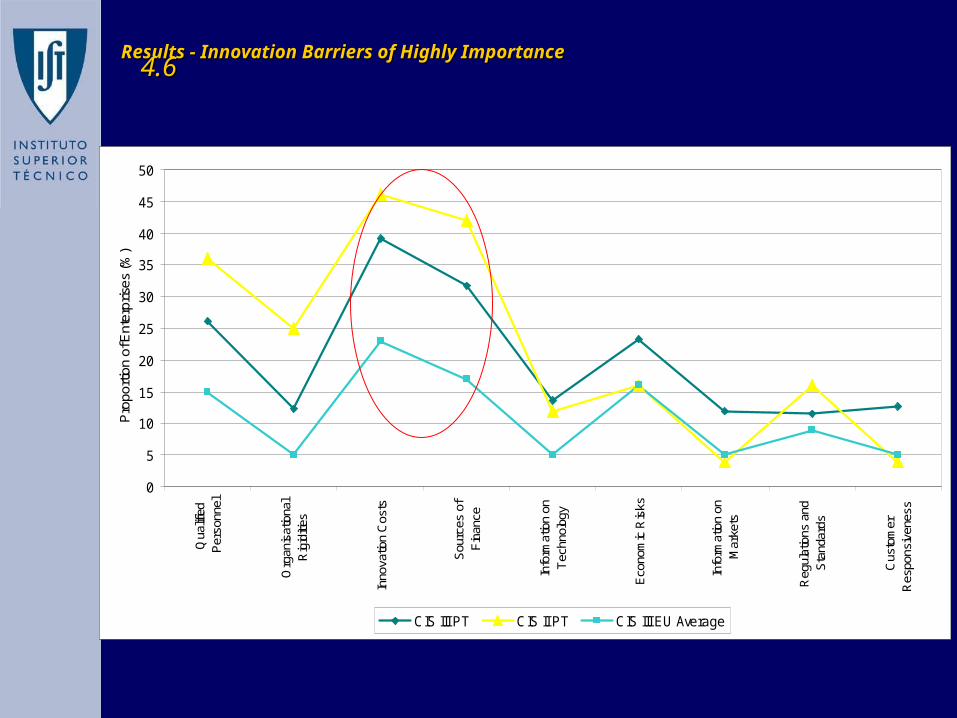
Results - Innovation Barriers of Highly ImportanceResults - Innovation Barriers of Highly Importance
0
5
10
15
20
25
30
35
40
45
50
Qua
lifie
dP
erso
nnel
Org
anis
atio
nal
Rig
iditi
es
Inno
vatio
n C
osts
Sou
rces
of
Fin
ance
Info
rmat
ion
onT
echn
olog
y
Eco
nom
ic R
isks
Info
rmat
ion
onM
arke
ts
Reg
ulat
ions
and
Sta
ndar
ds
Cus
tom
erR
espo
nsiv
enes
s
Pro
porti
on o
f Ent
erpr
ises
(%)
CIS III PT CIS II PT CIS III EU Average
4.64.6
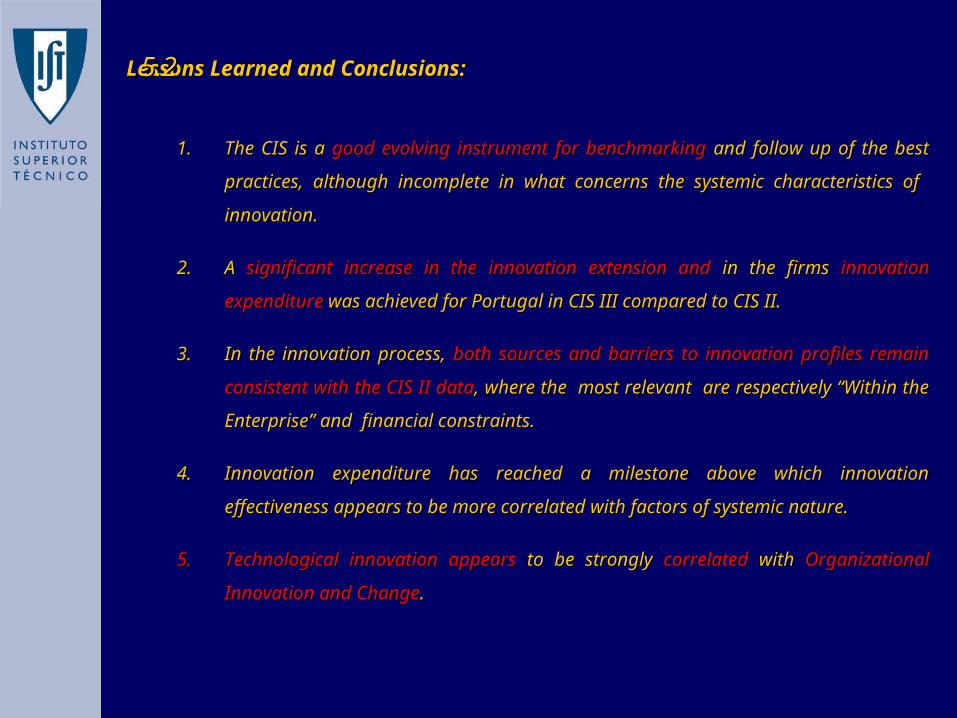
Lessons Learned and Conclusions:Lessons Learned and Conclusions:
1.1. The CIS is a The CIS is a good evolving instrument for benchmarkinggood evolving instrument for benchmarking and follow up of and follow up of
the best practices, although incomplete in what concerns the systemic the best practices, although incomplete in what concerns the systemic
characteristics of innovation.characteristics of innovation.
2.2. A A significant increase in the innovation extension andsignificant increase in the innovation extension and in the firms in the firms
innovation expenditureinnovation expenditure was achieved for Portugal in CIS III compared to was achieved for Portugal in CIS III compared to
CIS II.CIS II.
3.3. In the innovation process, In the innovation process, both sources and barriers to innovation profiles both sources and barriers to innovation profiles
remain consistent with the CIS II dataremain consistent with the CIS II data, where the most relevant are , where the most relevant are
respectively “Within the Enterprise” and financial constraints. respectively “Within the Enterprise” and financial constraints.
4.4. Innovation expenditure has reached a milestone above which innovation Innovation expenditure has reached a milestone above which innovation
effectiveness appears to be more correlated with factors of systemic effectiveness appears to be more correlated with factors of systemic
nature.nature.
5.5. Technological innovation appearsTechnological innovation appears to be strongly to be strongly correlatedcorrelated with with
Organizational Innovation and ChangeOrganizational Innovation and Change..
5.25.2

OutlineOutline
Part 2 - Innovation and Productivity: Part 2 - Innovation and Productivity: What can we learn from the CIS 3 Results for What can we learn from the CIS 3 Results for Portugal?Portugal?
1.1. Innovation and Productivity TheoryInnovation and Productivity Theory
2.2. A model for the analysis of innovation and productivity in the short A model for the analysis of innovation and productivity in the short runrun
3.3. Results with CIS 3 dataResults with CIS 3 data
4.4. Lessons Learned and ConclusionsLessons Learned and Conclusions
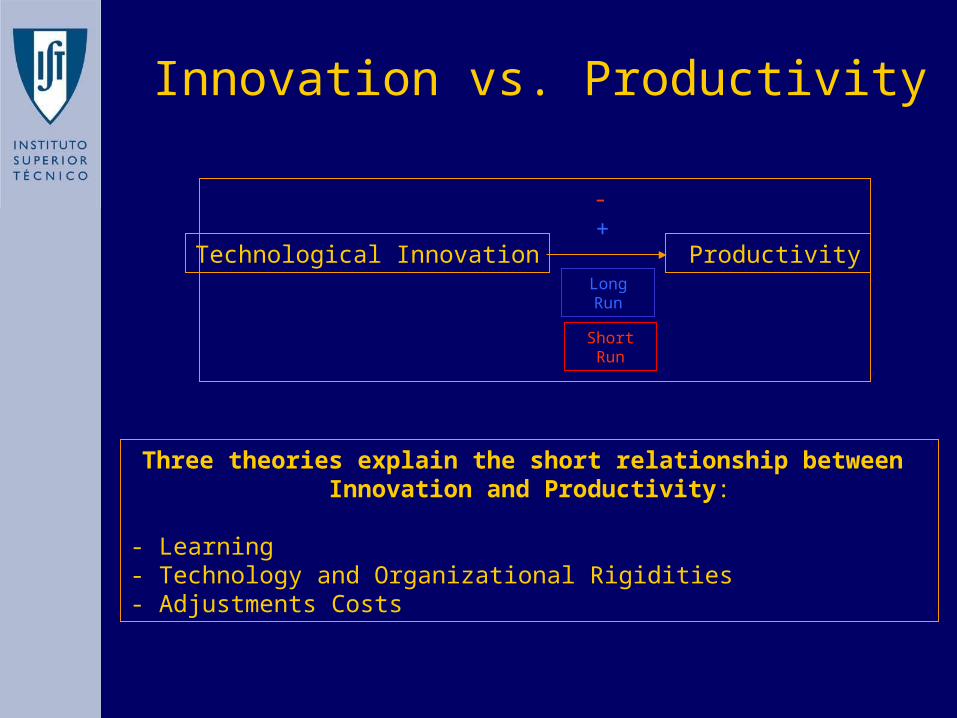
Three theories explain the short relationship between Innovation and Productivity:
- Learning- Technology and Organizational Rigidities- Adjustments Costs
Technological Innovation ProductivityLong Run
+
Short Run
-
Innovation vs. Productivity

Theoretical arguments that explain
the negative relationship between innovation and
productivity
Arguments Main References
Innovation - new skills - productivity decrease
New skills necessary to adopt correctly new technologies
Time and costs of the adoption process not neglegetable - learning cost
Innovation implies the execution of non-productivity activities - drop in productivity in the short run
More productive firms have difficulties to change technology
When technologies appear perform less effectively than the technologies already diffused
Technology transfer imply a change on management techniques in order to synchronize the firm
characteristics with the innovationMore productive firms may be reluctant to switch to
new technologies that would imply significant productivity losses
More productive firms are those that stick more closely to existing routines
Decision not to innovate - level of productivity and level of organizational rigidity
Periods of adoption of new technologies - adjustment costs and decrease of levels of output
May be a lag between the growth in investment and its benefits
Adjustment costs - costs related to setting up new equipment, training of employees (resources used to fully utilize the capital)
During the introduction of the innovation stage, innovative firms will have a lower rate of productivity
growth than non-inovative firmsMore productive firms are those that are more
capable to deal with adjustments costs and liquidity constrainspo
sitive
rela
tions
hip
betw
een
leve
ls of
pro
duct
ivity
an
d in
nova
tion
Adju
stm
ent C
osts
Bessen (2001) Bernstein et al. (1999)
Hall (2002) Leung (2004)
Jovanovic and Nyarko (1996) Ahn (1999, 2001)
Lear
ning
Theories
nega
tive
rela
tions
hip
betw
een
inno
vatio
n an
d le
vels
of p
rodu
ctivi
ty
Tech
nolo
gy a
nd O
rgan
izatio
nal R
igid
ities
Leonard-Barton (1988, 1992) Utterback (1994)
Christensen and Bower (1996) Christensen (1997) Young (1991, 1993)
Benner and Tushman (2002) Tripsas and Gavetti (2002)
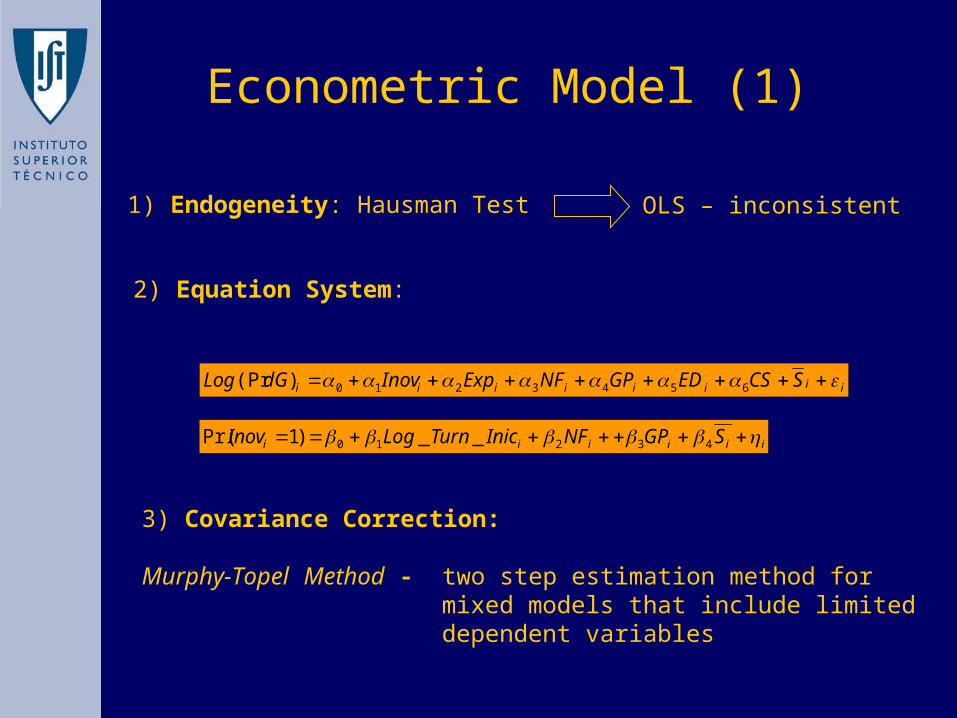
Econometric Model (1)
1) Endogeneity: Hausman Test OLS – inconsistent
2) Equation System:
3) Covariance Correction: Murphy-Topel Method - two step estimation method for mixed
models that include limited dependent variables
iiiiiiii SCSEDGPNFExpInovdGLog 6543210)(Pr
iiiiii SGPNFInicTurnLogInov 43210 __)1Pr(
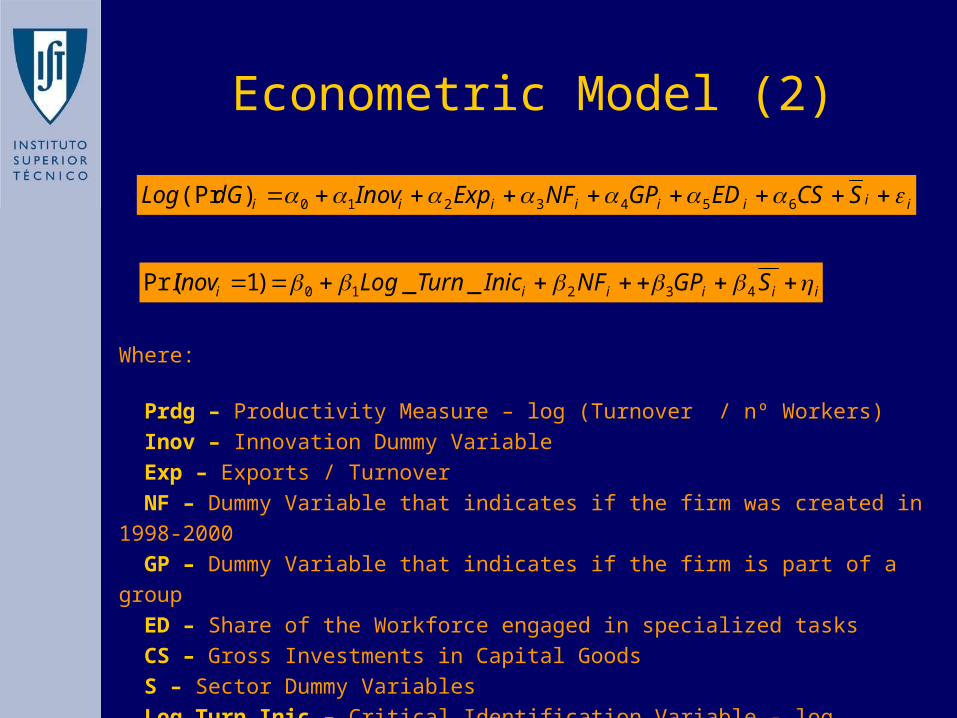
Econometric Model (2)
iiiiiiii SCSEDGPNFExpInovdGLog 6543210)(Pr
iiiiii SGPNFInicTurnLogInov 43210 __)1Pr(
Where:
Prdg – Productivity Measure – log (Turnover / nº Workers) Inov – Innovation Dummy Variable Exp – Exports / Turnover NF – Dummy Variable that indicates if the firm was created in 1998-2000 GP – Dummy Variable that indicates if the firm is part of a group ED – Share of the Workforce engaged in specialized tasks CS – Gross Investments in Capital Goods S – Sector Dummy Variables Log_Turn_Inic – Critical Identification Variable - log (Turnover 1998)
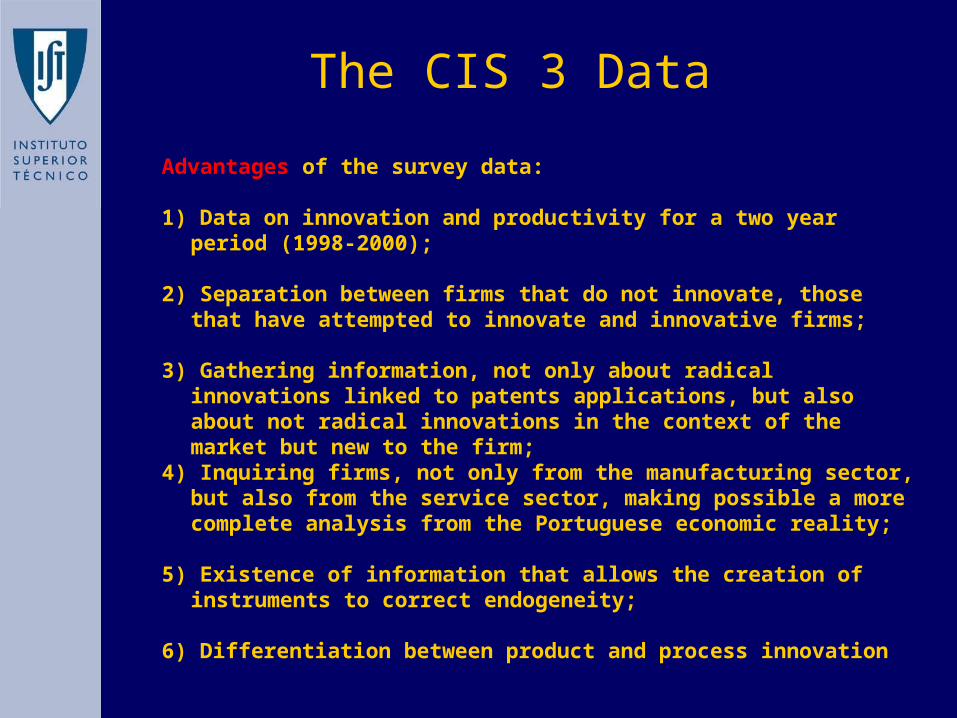
Advantages of the survey data:
1) Data on innovation and productivity for a two year period (1998-2000);
2) Separation between firms that do not innovate, those that have attempted to innovate and innovative firms;
3) Gathering information, not only about radical innovations linked to patents applications, but also about not radical innovations in the context of the market but new to the firm;
4) Inquiring firms, not only from the manufacturing sector, but also from the service sector, making possible a more complete analysis from the Portuguese economic reality;
5) Existence of information that allows the creation of instruments to correct endogeneity;
6) Differentiation between product and process innovation
The CIS 3 Data
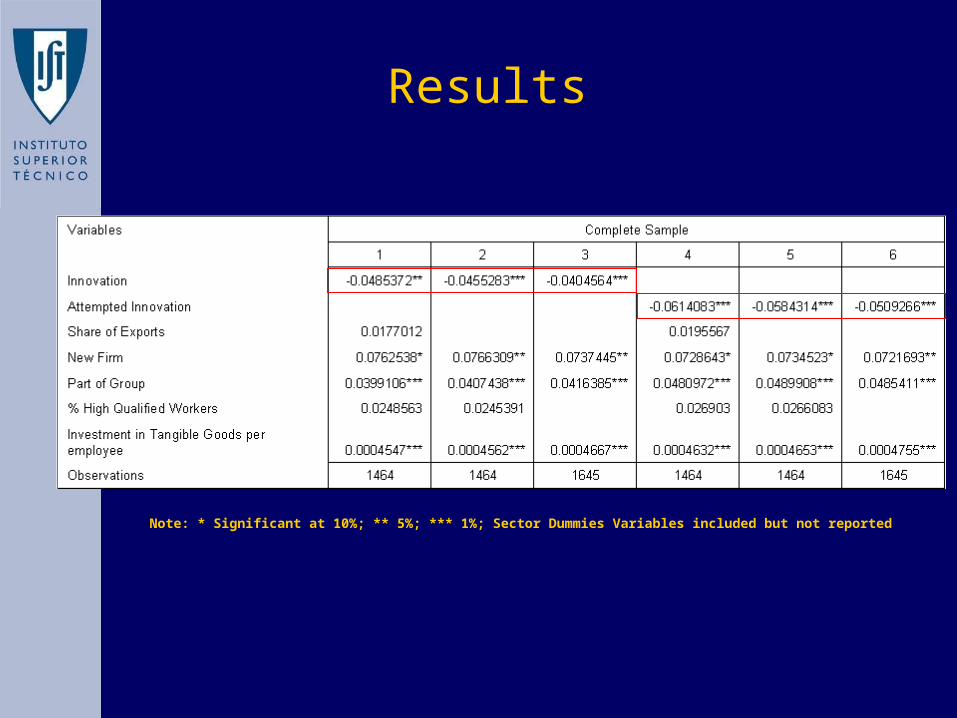
Note: * Significant at 10%; ** 5%; *** 1%; Sector Dummies Variables included but not reported
Results
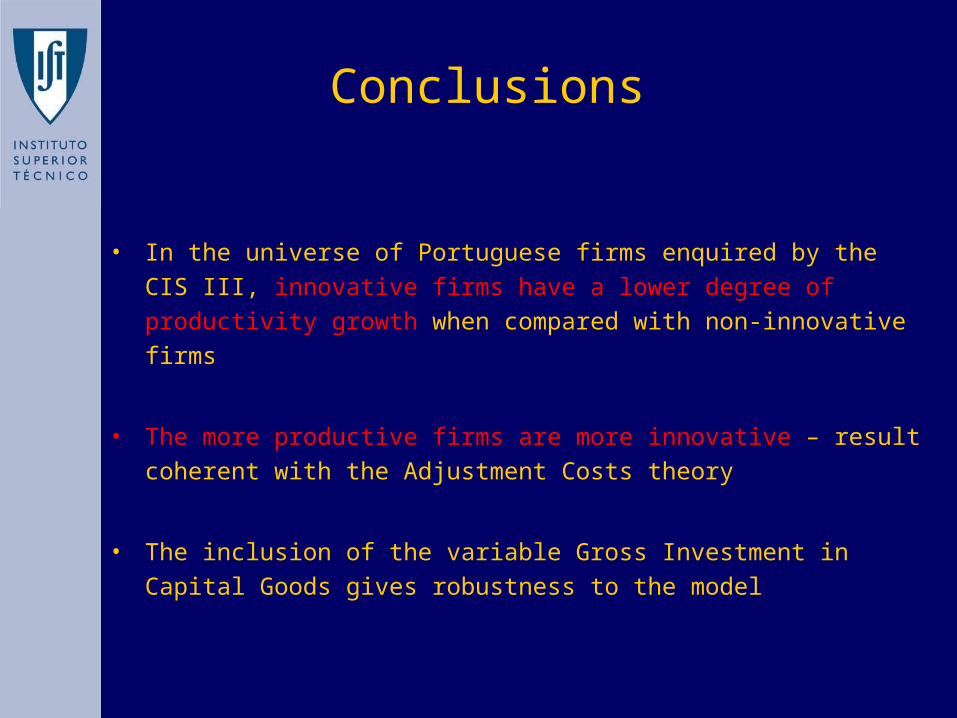
• In the universe of Portuguese firms enquired by the CIS III, innovative firms have a lower degree of productivity growth when compared with non-innovative firms
• The more productive firms are more innovative – result coherent with the Adjustment Costs theory
• The inclusion of the variable Gross Investment in Capital Goods gives robustness to the model
Conclusions

Additional SlidesAdditional Slides
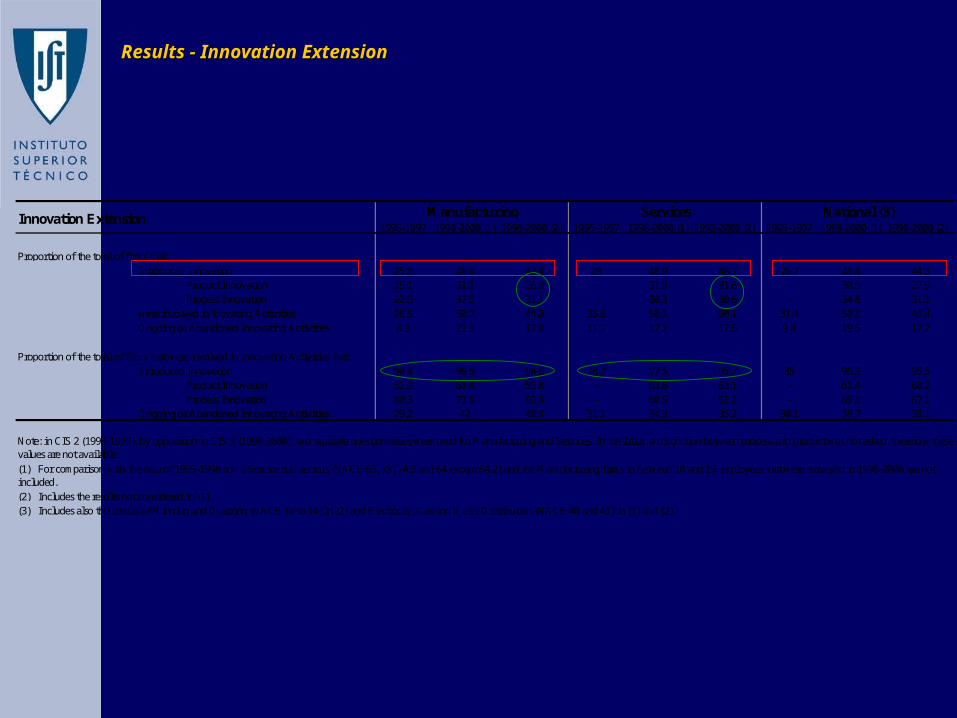
1995-1997 1998-2000 (1) 1998-2000 (2) 1995-1997 1998-2000 (1) 1998-2000 (2) 1995-1997 1998-2000 (1) 1998-2000 (2)
Introduced Innovation 25.8 48.4 42.4 28 48.9 48.7 26.7 48.4 44.3 Product Innovation 15.1 31.1 26.8 - 31.9 31.6 - 30.9 27.9
Process Innovation 22.9 37.5 31.1 - 30.3 30.6 - 34.8 31.1were involved in Inovating Activities 28.5 50.7 44.8 35.6 50.1 50.1 31.4 50.3 46.4
Ongoing or Abandoned Innovating Activities 8.3 21.3 17.8 11.1 17.2 17.6 9.4 19.5 17.7
Introduced Innovation 90.4 95.5 94.6 78.7 97.5 95.7 85 96.3 95.5 Product Innovation 52.9 61.4 59.8 - 63.6 63.1 - 61.4 60.2
Process Innovation 80.3 73.9 69.4 - 60.5 61.2 - 69.1 67.1Ongoing or Abandoned Innovating Activities 29.2 42 40.4 31.1 34.3 35.2 30.1 38.7 38.1
Manufacturing Services
(3) Includes also the results of Minning and Quarring (NACE 10 to 14) in (2) and Electricity, Gas and Water Distribution (NACE 40 and 41) in (1) and (2).
Note: in CIS 2 (1995-1997), by opposition to CIS 3 (1998-2000), two separate questionnaires were used for Manufacturing and Services. In the latter, a distinction between process and product was not asked, therefore these values are not available.
Proportion of the total of firms that were involved in Innovating Activities that:
Proportion of the total of firms that:
National (3)
(1) For comparison with the data of 1995-1998 some Service sub-sectors (NACE 63, 73, 74.3 and 64 except 64.2) and the Manufacturing firms in between 10 and 19 employees that were surveyed in 1998-2000 are not included.
Innovation Extension
(2) Includes the results not considered in (1).
Results - Innovation ExtensionResults - Innovation Extension
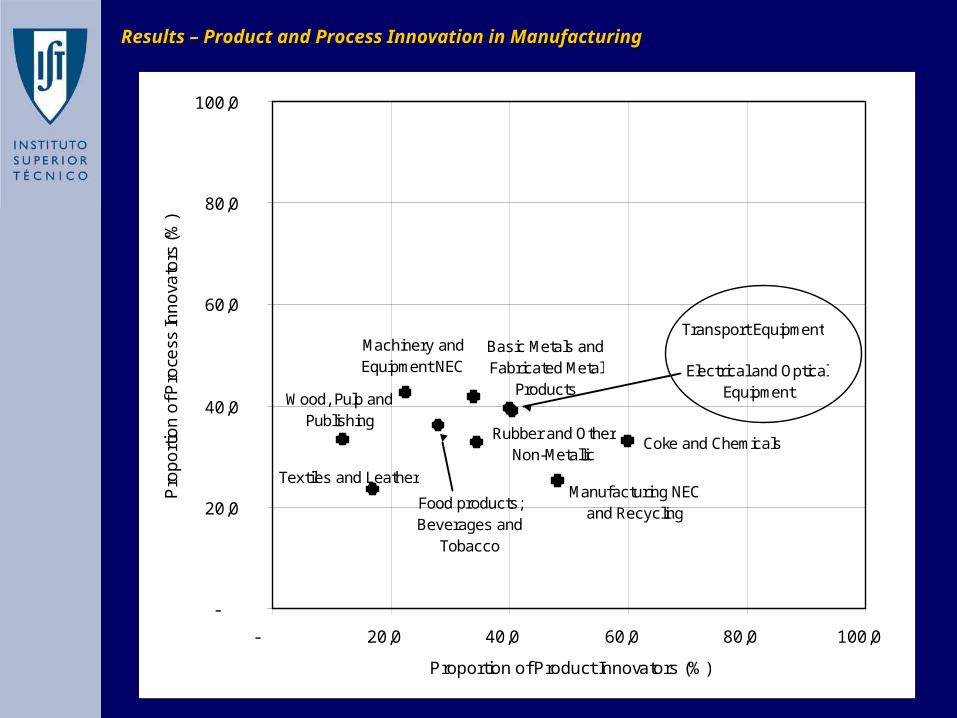
Results – Product and Process Innovation in ManufacturingResults – Product and Process Innovation in Manufacturing
Coke and ChemicalsRubber and Other
Non-Metallic
Food products; Beverages and
Tobacco
Textiles and Leather
Wood, Pulp and Publishing
Basic Metals and Fabricated Metal
Products
Machinery and Equipment NEC Electrical and Optical
Equipment
Transport Equipment
Manufacturing NEC and Recycling
-
20,0
40,0
60,0
80,0
100,0
- 20,0 40,0 60,0 80,0 100,0
Proportion of Product Innovators (%)
Pro
po
rtio
n o
f Pro
cess
Inn
ova
tors
(%
)
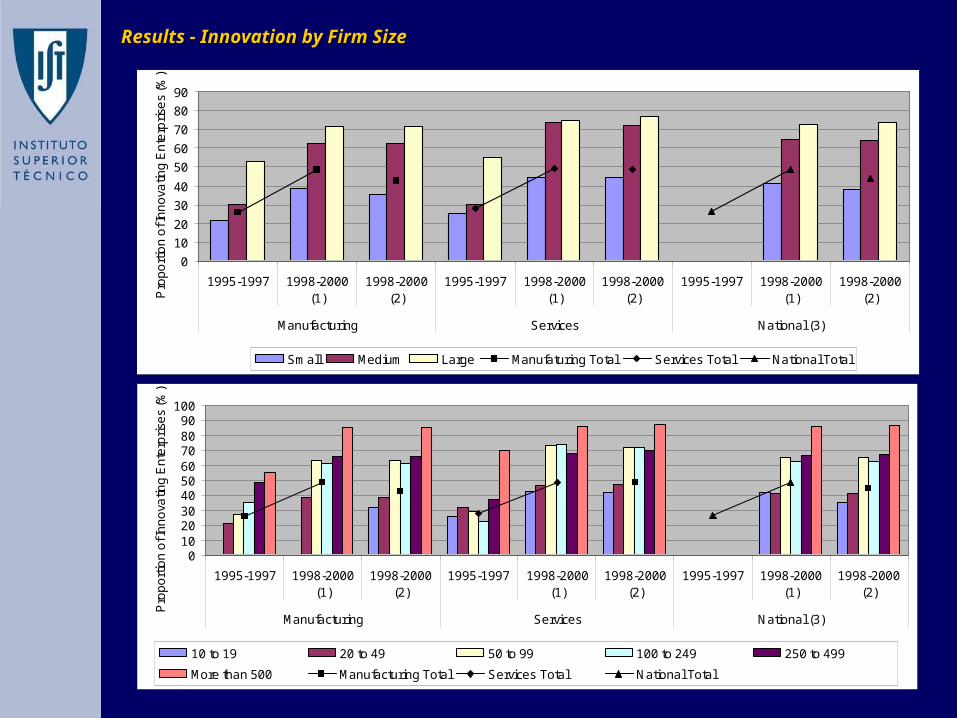
Results - Innovation by Firm SizeResults - Innovation by Firm Size
0
10
20
30
40
50
60
70
80
90
1995-1997 1998-2000(1)
1998-2000(2)
1995-1997 1998-2000(1)
1998-2000(2)
1995-1997 1998-2000(1)
1998-2000(2)
Manufacturing Services National (3)
Pro
po
rtio
n o
f In
no
vatin
g E
nte
rpri
ses
(%)
Small Medium Large Manufaturing Total Services Total National Total
0102030405060708090
100
1995-1997 1998-2000(1)
1998-2000(2)
1995-1997 1998-2000(1)
1998-2000(2)
1995-1997 1998-2000(1)
1998-2000(2)
Manufacturing Services National (3)
Pro
po
rtio
n o
f In
no
vatin
g E
nte
rpri
ses
(%)
10 to 19 20 to 49 50 to 99 100 to 249 250 to 499
More than 500 Manufacturing Total Services Total National Total
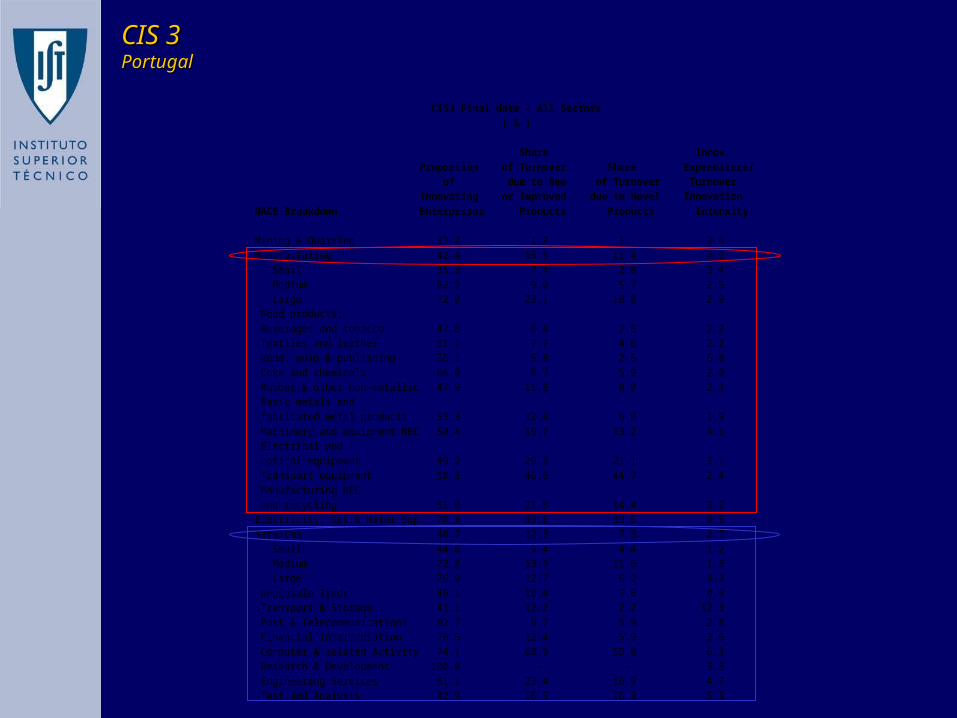
CIS3 Final data - All Sectors ( % ) Share Innov. Proportion of Turnover Share Expenditure/ of due to New of Turnover Turnover Innovating or Improved due to Novel Innovation NACE Breakdown Enterprises Products Products Intensity Mining & Quarring 37.2 1.2 1.1 2.6 Manufacturing 42.4 15.5 11.4 2.9 Small 35.3 7.4 2.8 3.4 Medium 62.2 9.0 5.7 2.5 Large 72.0 23.1 18.8 2.9 Food products; Beverages and tobacco 47.8 6.4 2.6 2.2 Textiles and leather 31.1 7.7 4.6 2.2 Wood, pulp & publishing 36.1 5.8 2.6 6.0 Coke and chemicals 66.0 8.7 5.9 2.0 Rubber & other non-metallic 47.9 11.8 8.0 2.3 Basic metals and fabricated metal products 53.3 12.4 6.0 1.9 Machinery and equipment NEC 50.4 19.7 13.2 4.5 Electrical and optical equipment 49.2 29.3 21.1 3.1 Transport equipment 50.3 46.6 44.7 2.4 Manufacturing NEC and recycling 51.0 21.8 14.4 3.2 Electricity, Gas & Water Sup. 70.3 39.6 39.5 0.5 Services 48.7 12.3 7.3 2.7 Small 44.0 9.4 4.4 1.2 Medium 72.2 13.9 11.6 1.3 Large 76.9 12.7 6.2 4.0 Wholesale Trade 46.1 10.4 7.6 0.9 Transport & Storage 41.1 12.2 2.2 12.3 Post & Telecommunications 92.7 9.7 5.9 2.8 Financial Intermediation 70.5 12.4 5.9 2.6 Computer & related Activity 74.1 60.9 59.0 6.3 Research & Development 100.0 - - 3.8 Engineering Services 61.1 23.4 16.9 4.7 Test and Analysis 42.9 16.5 16.3 5.3
CIS 3CIS 3PortugalPortugal
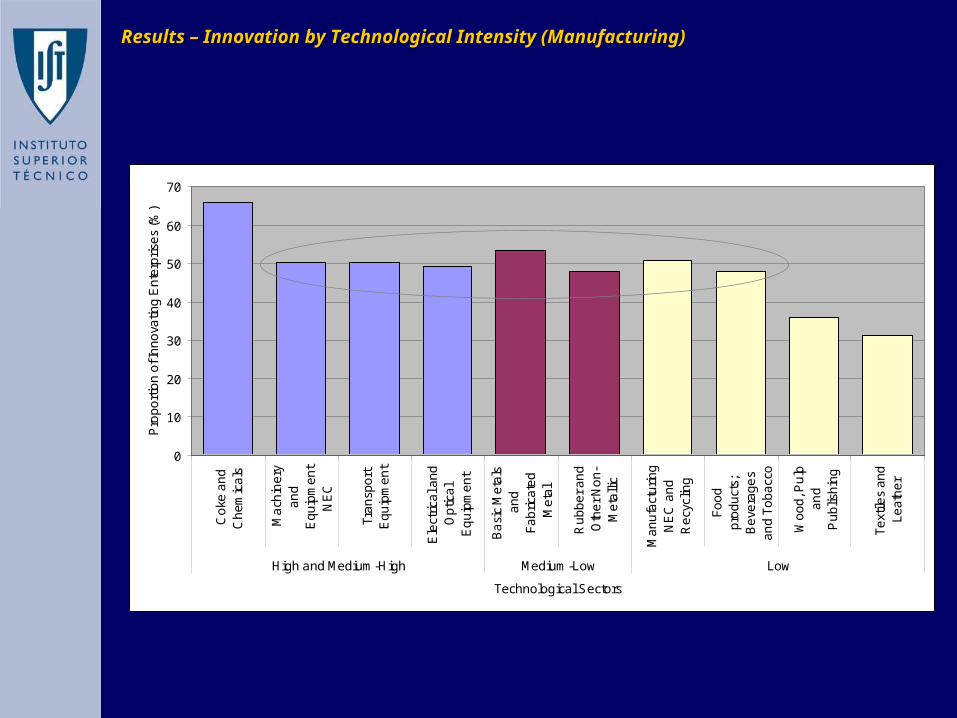
Results – Innovation by Technological Intensity (Manufacturing)Results – Innovation by Technological Intensity (Manufacturing)
0
10
20
30
40
50
60
70
Co
ke a
nd
Ch
em
ica
ls
Ma
chin
ery
an
dE
qu
ipm
en
tN
EC
Tra
nsp
ort
Eq
uip
me
nt
Ele
ctri
cal a
nd
Op
tica
lE
qu
ipm
en
t
Ba
sic
Me
tals
an
dF
ab
rica
ted
Me
tal
Ru
bb
er
an
dO
the
r N
on
-M
eta
llic
Ma
nu
fact
uri
ng
NE
C a
nd
Re
cycl
ing
Fo
od
pro
du
cts;
Be
vera
ge
sa
nd
To
ba
cco
Wo
od
, Pu
lpa
nd
Pu
blis
hin
g
Te
xtile
s a
nd
Le
ath
er
High and Medium-High Medium-Low Low
Technological Sectors
Pro
po
rtio
n o
f In
no
vatin
g E
nte
rpri
ses
(%)
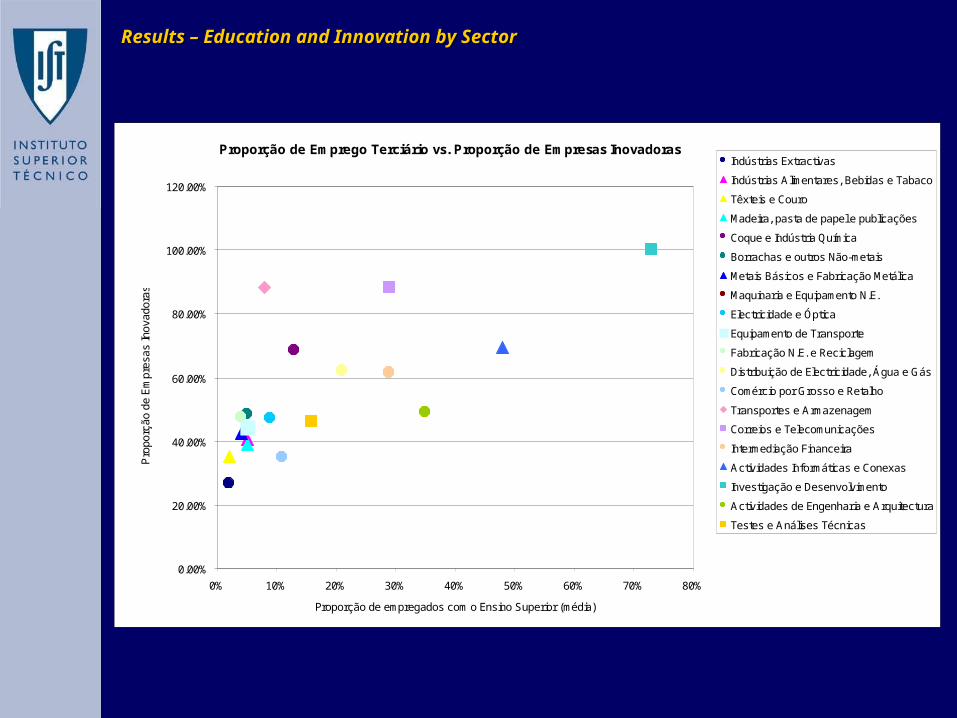
Results – Education and Innovation by SectorResults – Education and Innovation by Sector
Proporção de Emprego Terciário vs. Proporção de Empresas Inovadoras
0.00%
20.00%
40.00%
60.00%
80.00%
100.00%
120.00%
0% 10% 20% 30% 40% 50% 60% 70% 80%
Proporção de empregados com o Ensino Superior (média)
Pro
porç
ão d
e E
mpr
esas
Inov
ador
as
Indústrias Extractivas
Indústrias Alimentares, Bebidas e Tabaco
Têxteis e Couro
Madeira, pasta de papel e publicações
Coque e Indústria Química
Borrachas e outros Não-metais
Metais Básicos e Fabricação Metálica
Maquinaria e Equipamento N.E.
Electricidade e Óptica
Equipamento de Transporte
Fabricação N.E. e Reciclagem
Distribuição de Electricidade, Água e Gás
Comércio por Grosso e Retalho
Transportes e Armazenagem
Correios e Telecomunicações
Intermediação Financeira
Actividades Informáticas e Conexas
Investigação e Desenvolvimento
Actividades de Engenharia e Arquitectura
Testes e Análises Técnicas
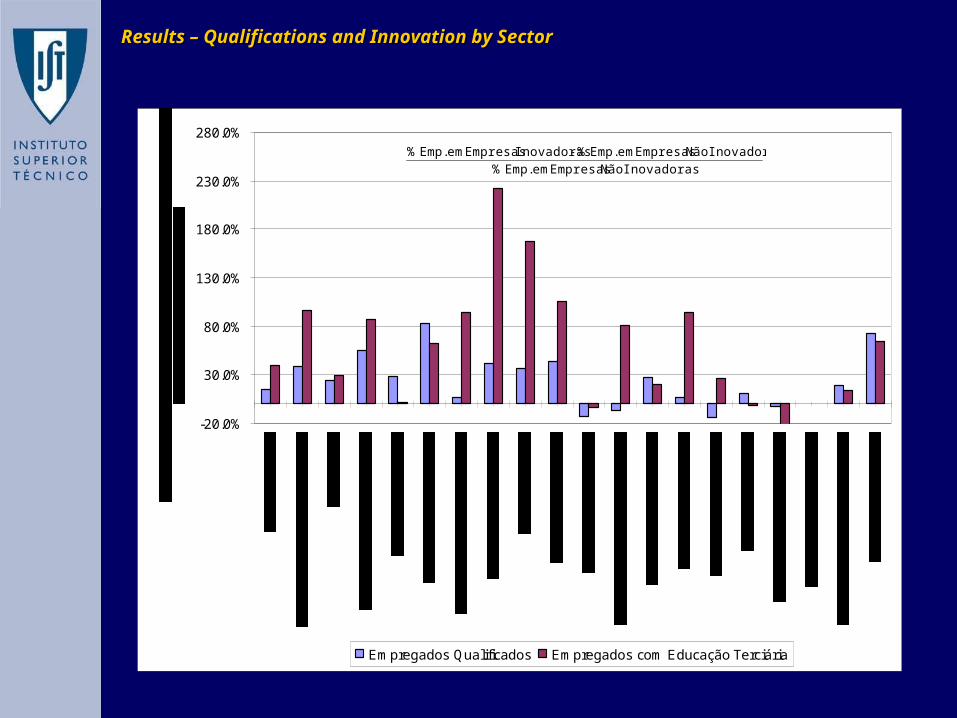
Results – Qualifications and Innovation by SectorResults – Qualifications and Innovation by Sector
-20.0%
30.0%
80.0%
130.0%
180.0%
230.0%
280.0%
Empregados Qualificados Empregados com Educação Terciária
Inovadoras Não Empresas em Emp. %
Inovadoras Não Empresas em Emp. % Inovadoras Empresas em Emp. % -
0
5
10
15
20
25
30
35
40
45
50
With
in th
eE
nter
pris
e
Clie
nts
Oth
erE
nter
pris
esw
ithin
the
Ent
erpr
ise
Gro
up
Sup
plie
rs
Com
petit
ors
Fai
rs a
ndE
xhib
ition
s
Pro
fess
iona
lC
onfe
renc
es,
mee
tings
and
jour
nals
Uni
vers
ities
and
othe
r Hug
her
Edu
catio
nIn
stitu
tions
Gov
ernm
ent o
rP
rivat
e no
n-pr
ofit
inst
itute
s
Inno
vatin
g E
nter
pris
es w
ith H
ighl
y im
porta
nt S
ourc
es (%
)
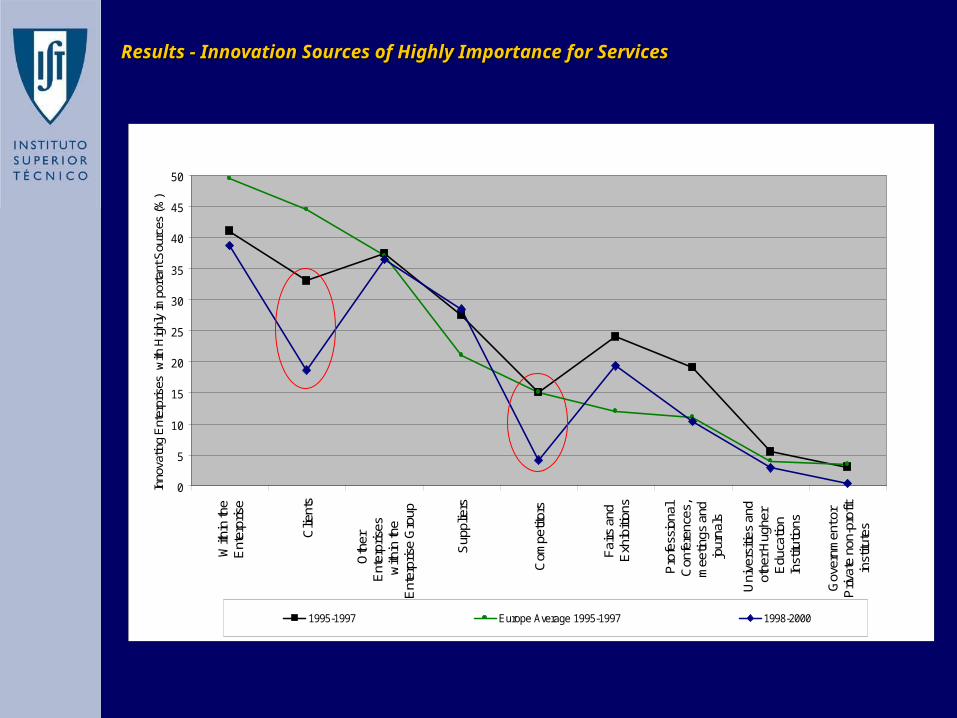
1995-1997 Europe Average 1995-1997 1998-2000
Results - Innovation Sources of Highly Importance for ServicesResults - Innovation Sources of Highly Importance for Services
5.3
7.5
3.6
5.7
1.92.9
9.9
4.2
0.0
2.0
4.0
6.0
8.0
10.0
12.0
Non-Innovators Innovators Non-Innovators Innovators
Manufacturing Services
Pro
po
rtio
n o
f E
nte
rpri
ses
(%)
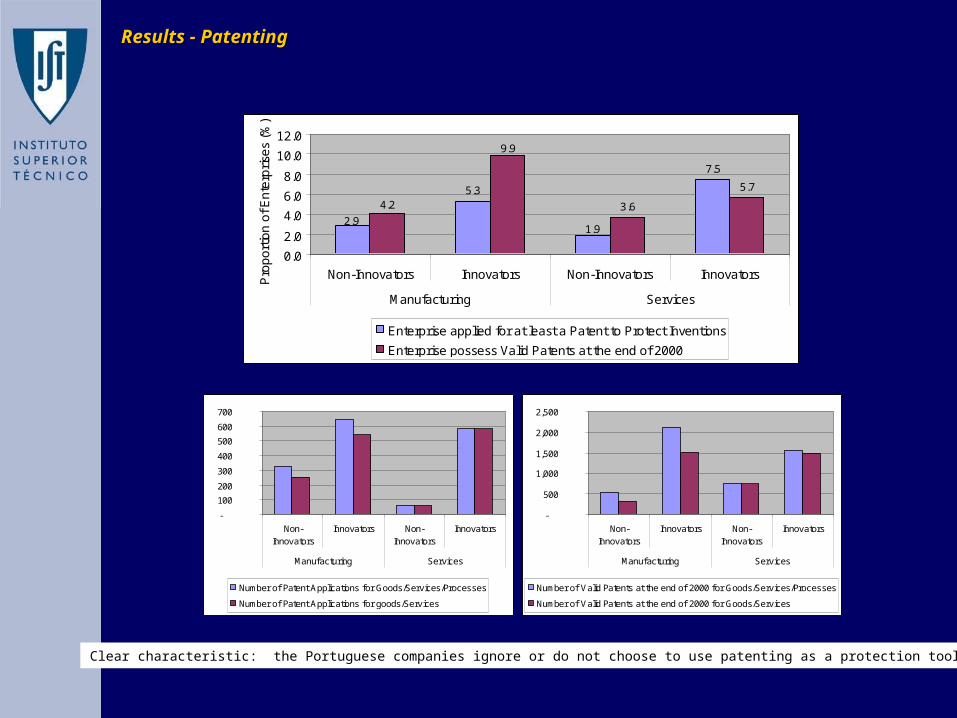
Enterprise applied for at least a Patent to Protect Inventions
Enterprise possess Valid Patents at the end of 2000
-
100
200
300
400
500
600
700
Non-Innovators
Innovators Non-Innovators
Innovators
Manufacturing Services
Number of Patent Applications for Goods/Services/Processes
Number of Patent Applications for goods/Services
-
500
1,000
1,500
2,000
2,500
Non-Innovators
Innovators Non-Innovators
Innovators
Manufacturing Services
Number of Valid Patents at the end of 2000 for Goods/Services/Processes
Number of Valid Patents at the end of 2000 for Goods/Services
Clear characteristic: the Portuguese companies ignore or do not choose to use patenting as a protection tool
Results - PatentingResults - Patenting
-
5.0
10.0
15.0
20.0
25.0
Non-Innovators
Innovators Non-Innovators
Innovators NonInnovators
Innovators
Manufacturing Services National
Pro
po
rtio
n o
f En
terp
rise
s P
rote
ctin
g
Inn
ova
tion
s (%
)
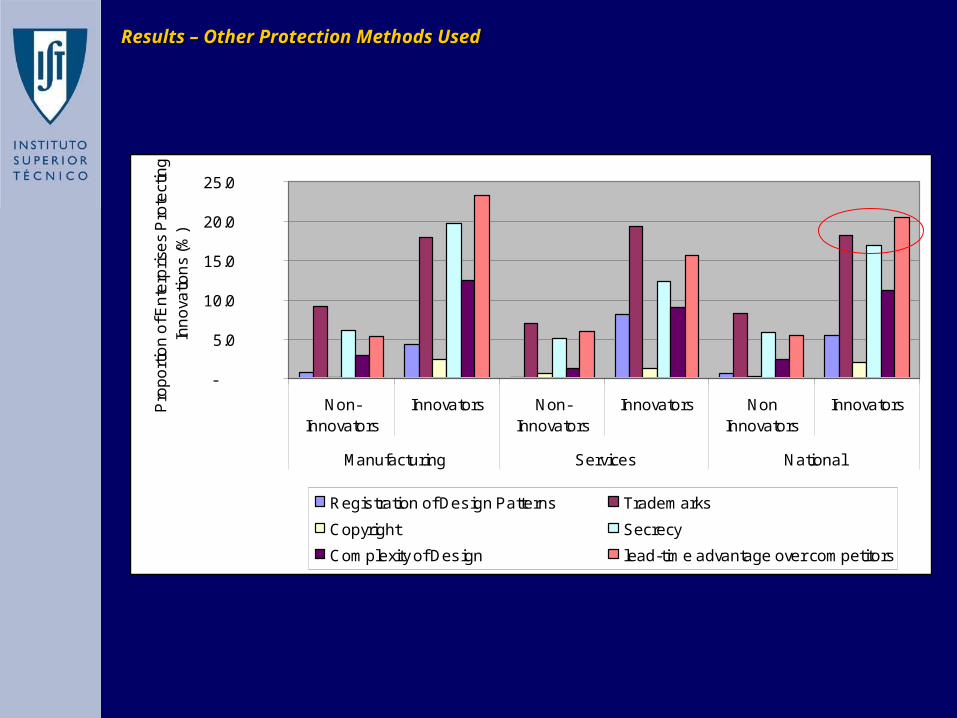
Registration of Design Patterns Trademarks
Copyright Secrecy
Complexity of Design lead-time advantage over competitors
Results – Other Protection Methods UsedResults – Other Protection Methods Used