The - iariajournals.org · António Manuel Duarte Nogueira, University of Aveiro / Institute of...
52
-
Upload
truongtuong -
Category
Documents
-
view
219 -
download
0
Transcript of The - iariajournals.org · António Manuel Duarte Nogueira, University of Aveiro / Institute of...


The International Journal on Advances in Telecommunications is published by IARIA.
ISSN: 1942-2601
journals site: http://www.iariajournals.org
contact: [email protected]
Responsibility for the contents rests upon the authors and not upon IARIA, nor on IARIA volunteers,
staff, or contractors.
IARIA is the owner of the publication and of editorial aspects. IARIA reserves the right to update the
content for quality improvements.
Abstracting is permitted with credit to the source. Libraries are permitted to photocopy or print,
providing the reference is mentioned and that the resulting material is made available at no cost.
Reference should mention:
International Journal on Advances in Telecommunications, issn 1942-2601
vol. 11, no. 3 & 4, year 2018, http://www.iariajournals.org/telecommunications/
The copyright for each included paper belongs to the authors. Republishing of same material, by authors
or persons or organizations, is not allowed. Reprint rights can be granted by IARIA or by the authors, and
must include proper reference.
Reference to an article in the journal is as follows:
<Author list>, “<Article title>”
International Journal on Advances in Telecommunications, issn 1942-2601
vol. 11, no. 3 & 4, year 2018, <start page>:<end page> , http://www.iariajournals.org/telecommunications/
IARIA journals are made available for free, proving the appropriate references are made when their
content is used.
Sponsored by IARIA
www.iaria.org
Copyright © 2018 IARIA

International Journal on Advances in Telecommunications
Volume 11, Number 3 & 4, 2018
Editors-in-Chief
Tulin Atmaca, Institut Mines-Telecom/ Telecom SudParis, France
Marko Jäntti, University of Eastern Finland, Finland
Editorial Advisory Board
Ioannis D. Moscholios, University of Peloponnese, Greece
Ilija Basicevic, University of Novi Sad, Serbia
Kevin Daimi, University of Detroit Mercy, USA
György Kálmán, Gjøvik University College, Norway
Michael Massoth, University of Applied Sciences - Darmstadt, Germany
Mariusz Glabowski, Poznan University of Technology, Poland
Dragana Krstic, Faculty of Electronic Engineering, University of Nis, Serbia
Wolfgang Leister, Norsk Regnesentral, Norway
Bernd E. Wolfinger, University of Hamburg, Germany
Przemyslaw Pochec, University of New Brunswick, Canada
Timothy Pham, Jet Propulsion Laboratory, California Institute of Technology, USA
Kamal Harb, KFUPM, Saudi Arabia
Eugen Borcoci, University "Politehnica" of Bucharest (UPB), Romania
Richard Li, Huawei Technologies, USA
Editorial Board
Fatma Abdelkefi, High School of Communications of Tunis - SUPCOM, Tunisia
Seyed Reza Abdollahi, Brunel University - London, UK
Habtamu Abie, Norwegian Computing Center/Norsk Regnesentral-Blindern, Norway
Rui L. Aguiar, Universidade de Aveiro, Portugal
Javier M. Aguiar Pérez, Universidad de Valladolid, Spain
Mahdi Aiash, Middlesex University, UK
Akbar Sheikh Akbari, Staffordshire University, UK
Ahmed Akl, Arab Academy for Science and Technology (AAST), Egypt
Hakiri Akram, LAAS-CNRS, Toulouse University, France
Anwer Al-Dulaimi, Brunel University, UK
Muhammad Ali Imran, University of Surrey, UK
Muayad Al-Janabi, University of Technology, Baghdad, Iraq
Jose M. Alcaraz Calero, Hewlett-Packard Research Laboratories, UK / University of Murcia, Spain
Erick Amador, Intel Mobile Communications, France
Ermeson Andrade, Universidade Federal de Pernambuco (UFPE), Brazil
Cristian Anghel, University Politehnica of Bucharest, Romania
Regina B. Araujo, Federal University of Sao Carlos - SP, Brazil
Pasquale Ardimento, University of Bari, Italy

Ezendu Ariwa, London Metropolitan University, UK
Miguel Arjona Ramirez, São Paulo University, Brasil
Radu Arsinte, Technical University of Cluj-Napoca, Romania
Tulin Atmaca, Institut Mines-Telecom/ Telecom SudParis, France
Mario Ezequiel Augusto, Santa Catarina State University, Brazil
Marco Aurelio Spohn, Federal University of Fronteira Sul (UFFS), Brazil
Philip L. Balcaen, University of British Columbia Okanagan - Kelowna, Canada
Marco Baldi, Università Politecnica delle Marche, Italy
Ilija Basicevic, University of Novi Sad, Serbia
Carlos Becker Westphall, Federal University of Santa Catarina, Brazil
Mark Bentum, University of Twente, The Netherlands
David Bernstein, Huawei Technologies, Ltd., USA
Eugen Borcoci, University "Politehnica"of Bucharest (UPB), Romania
Fernando Boronat Seguí, Universidad Politecnica de Valencia, Spain
Christos Bouras, University of Patras, Greece
Martin Brandl, Danube University Krems, Austria
Julien Broisin, IRIT, France
Dumitru Burdescu, University of Craiova, Romania
Andi Buzo, University "Politehnica" of Bucharest (UPB), Romania
Shkelzen Cakaj, Telecom of Kosovo / Prishtina University, Kosovo
Enzo Alberto Candreva, DEIS-University of Bologna, Italy
Rodrigo Capobianco Guido, São Paulo State University, Brazil
Hakima Chaouchi, Telecom SudParis, France
Silviu Ciochina, Universitatea Politehnica din Bucuresti, Romania
José Coimbra, Universidade do Algarve, Portugal
Hugo Coll Ferri, Polytechnic University of Valencia, Spain
Noel Crespi, Institut TELECOM SudParis-Evry, France
Leonardo Dagui de Oliveira, Escola Politécnica da Universidade de São Paulo, Brazil
Kevin Daimi, University of Detroit Mercy, USA
Gerard Damm, Alcatel-Lucent, USA
Francescantonio Della Rosa, Tampere University of Technology, Finland
Chérif Diallo, Consultant Sécurité des Systèmes d'Information, France
Klaus Drechsler, Fraunhofer Institute for Computer Graphics Research IGD, Germany
Jawad Drissi, Cameron University , USA
António Manuel Duarte Nogueira, University of Aveiro / Institute of Telecommunications, Portugal
Alban Duverdier, CNES (French Space Agency) Paris, France
Nicholas Evans, EURECOM, France
Fabrizio Falchi, ISTI - CNR, Italy
Mário F. S. Ferreira, University of Aveiro, Portugal
Bruno Filipe Marques, Polytechnic Institute of Viseu, Portugal
Robert Forster, Edgemount Solutions, USA
John-Austen Francisco, Rutgers, the State University of New Jersey, USA
Kaori Fujinami, Tokyo University of Agriculture and Technology, Japan
Shauneen Furlong , University of Ottawa, Canada / Liverpool John Moores University, UK
Ana-Belén García-Hernando, Universidad Politécnica de Madrid, Spain
Bezalel Gavish, Southern Methodist University, USA

Christos K. Georgiadis, University of Macedonia, Greece
Mariusz Glabowski, Poznan University of Technology, Poland
Katie Goeman, Hogeschool-Universiteit Brussel, Belgium
Hock Guan Goh, Universiti Tunku Abdul Rahman, Malaysia
Pedro Gonçalves, ESTGA - Universidade de Aveiro, Portugal
Valerie Gouet-Brunet, Conservatoire National des Arts et Métiers (CNAM), Paris
Christos Grecos, University of West of Scotland, UK
Stefanos Gritzalis, University of the Aegean, Greece
William I. Grosky, University of Michigan-Dearborn, USA
Vic Grout, Glyndwr University, UK
Xiang Gui, Massey University, New Zealand
Huaqun Guo, Institute for Infocomm Research, A*STAR, Singapore
Song Guo, University of Aizu, Japan
Kamal Harb, KFUPM, Saudi Arabia
Ching-Hsien (Robert) Hsu, Chung Hua University, Taiwan
Javier Ibanez-Guzman, Renault S.A., France
Lamiaa Fattouh Ibrahim, King Abdul Aziz University, Saudi Arabia
Theodoros Iliou, University of the Aegean, Greece
Mohsen Jahanshahi, Islamic Azad University, Iran
Antonio Jara, University of Murcia, Spain
Carlos Juiz, Universitat de les Illes Balears, Spain
Adrian Kacso, Universität Siegen, Germany
György Kálmán, Gjøvik University College, Norway
Eleni Kaplani, Technological Educational Institute of Patras, Greece
Behrouz Khoshnevis, University of Toronto, Canada
Ki Hong Kim, ETRI: Electronics and Telecommunications Research Institute, Korea
Atsushi Koike, Seikei University, Japan
Ousmane Kone, UPPA - University of Bordeaux, France
Dragana Krstic, University of Nis, Serbia
Archana Kumar, Delhi Institute of Technology & Management, Haryana, India
Romain Laborde, University Paul Sabatier (Toulouse III), France
Massimiliano Laddomada, Texas A&M University-Texarkana, USA
Wen-Hsing Lai, National Kaohsiung First University of Science and Technology, Taiwan
Zhihua Lai, Ranplan Wireless Network Design Ltd., UK
Jong-Hyouk Lee, INRIA, France
Wolfgang Leister, Norsk Regnesentral, Norway
Elizabeth I. Leonard, Naval Research Laboratory - Washington DC, USA
Richard Li, Huawei Technologies, USA
Jia-Chin Lin, National Central University, Taiwan
Chi (Harold) Liu, IBM Research - China, China
Diogo Lobato Acatauassu Nunes, Federal University of Pará, Brazil
Andreas Loeffler, Friedrich-Alexander-University of Erlangen-Nuremberg, Germany
Michael D. Logothetis, University of Patras, Greece
Renata Lopes Rosa, University of São Paulo, Brazil
Hongli Luo, Indiana University Purdue University Fort Wayne, USA
Christian Maciocco, Intel Corporation, USA

Dario Maggiorini, University of Milano, Italy
Maryam Tayefeh Mahmoudi, Research Institute for ICT, Iran
Krešimir Malarić, University of Zagreb, Croatia
Zoubir Mammeri, IRIT - Paul Sabatier University - Toulouse, France
Herwig Mannaert, University of Antwerp, Belgium
Michael Massoth, University of Applied Sciences - Darmstadt, Germany
Adrian Matei, Orange Romania S.A, part of France Telecom Group, Romania
Natarajan Meghanathan, Jackson State University, USA
Emmanouel T. Michailidis, University of Piraeus, Greece
Ioannis D. Moscholios, University of Peloponnese, Greece
Djafar Mynbaev, City University of New York, USA
Pubudu N. Pathirana, Deakin University, Australia
Christopher Nguyen, Intel Corp., USA
Lim Nguyen, University of Nebraska-Lincoln, USA
Brian Niehöfer, TU Dortmund University, Germany
Serban Georgica Obreja, University Politehnica Bucharest, Romania
Peter Orosz, University of Debrecen, Hungary
Patrik Österberg, Mid Sweden University, Sweden
Harald Øverby, ITEM/NTNU, Norway
Tudor Palade, Technical University of Cluj-Napoca, Romania
Constantin Paleologu, University Politehnica of Bucharest, Romania
Stelios Papaharalabos, National Observatory of Athens, Greece
Gerard Parr, University of Ulster Coleraine, UK
Ling Pei, Finnish Geodetic Institute, Finland
Jun Peng, University of Texas - Pan American, USA
Cathryn Peoples, University of Ulster, UK
Dionysia Petraki, National Technical University of Athens, Greece
Dennis Pfisterer, University of Luebeck, Germany
Timothy Pham, Jet Propulsion Laboratory, California Institute of Technology, USA
Roger Pierre Fabris Hoefel, Federal University of Rio Grande do Sul (UFRGS), Brazil
Przemyslaw Pochec, University of New Brunswick, Canada
Anastasios Politis, Technological & Educational Institute of Serres, Greece
Adrian Popescu, Blekinge Institute of Technology, Sweden
Neeli R. Prasad, Aalborg University, Denmark
Dušan Radović, TES Electronic Solutions, Stuttgart, Germany
Victor Ramos, UAM Iztapalapa, Mexico
Gianluca Reali, Università degli Studi di Perugia, Italy
Eric Renault, Telecom SudParis, France
Leon Reznik, Rochester Institute of Technology, USA
Joel Rodrigues, Instituto de Telecomunicações / University of Beira Interior, Portugal
David Sánchez Rodríguez, University of Las Palmas de Gran Canaria (ULPGC), Spain
Panagiotis Sarigiannidis, University of Western Macedonia, Greece
Michael Sauer, Corning Incorporated, USA
Marialisa Scatà, University of Catania, Italy
Zary Segall, Chair Professor, Royal Institute of Technology, Sweden
Sergei Semenov, Broadcom, Finland

Dimitrios Serpanos, University of Patras and ISI/RC Athena, Greece
Adão Silva, University of Aveiro / Institute of Telecommunications, Portugal
Pushpendra Bahadur Singh, MindTree Ltd, India
Mariusz Skrocki, Orange Labs Poland / Telekomunikacja Polska S.A., Poland
Leonel Sousa, INESC-ID/IST, TU-Lisbon, Portugal
Cristian Stanciu, University Politehnica of Bucharest, Romania
Liana Stanescu, University of Craiova, Romania
Cosmin Stoica Spahiu, University of Craiova, Romania
Young-Joo Suh, POSTECH (Pohang University of Science and Technology), Korea
Hailong Sun, Beihang University, China
Jani Suomalainen, VTT Technical Research Centre of Finland, Finland
Fatma Tansu, Eastern Mediterranean University, Cyprus
Ioan Toma, STI Innsbruck/University Innsbruck, Austria
Božo Tomas, HT Mostar, Bosnia and Herzegovina
Piotr Tyczka, ITTI Sp. z o.o., Poland
John Vardakas, University of Patras, Greece
Andreas Veglis, Aristotle University of Thessaloniki, Greece
Luís Veiga, Instituto Superior Técnico / INESC-ID Lisboa, Portugal
Calin Vladeanu, "Politehnica" University of Bucharest, Romania
Benno Volk, ETH Zurich, Switzerland
Krzysztof Walczak, Poznan University of Economics, Poland
Krzysztof Walkowiak, Wroclaw University of Technology, Poland
Yang Wang, Georgia State University, USA
Yean-Fu Wen, National Taipei University, Taiwan, R.O.C.
Bernd E. Wolfinger, University of Hamburg, Germany
Riaan Wolhuter, Universiteit Stellenbosch University, South Africa
Yulei Wu, Chinese Academy of Sciences, China
Mudasser F. Wyne, National University, USA
Gaoxi Xiao, Nanyang Technological University, Singapore
Bashir Yahya, University of Versailles, France
Abdulrahman Yarali, Murray State University, USA
Mehmet Erkan Yüksel, Istanbul University, Turkey
Pooneh Bagheri Zadeh, Staffordshire University, UK
Giannis Zaoudis, University of Patras, Greece
Liaoyuan Zeng, University of Electronic Science and Technology of China, China
Rong Zhao , Detecon International GmbH, Germany
Zhiwen Zhu, Communications Research Centre, Canada
Martin Zimmermann, University of Applied Sciences Offenburg, Germany
Piotr Zwierzykowski, Poznan University of Technology, Poland

International Journal on Advances in Telecommunications
Volume 11, Numbers 3 & 4, 2018
CONTENTS
pages: 101 - 114Data Analytics for 5G Networks: A Complete Framework for Network Access Selection and Traffic SteeringSokratis Barmpounakis, Department of Informatics and Telecommunications, National and Kapodistrian Universityof Athens, GreeceAlexandros Kaloxylos, Department of Informatics and Telecommunications, University of Peloponnese, GreecePanagiotis Spapis, Huawei German Research Center, Munich, GermanyPanagis Magdalinos, Department of Informatics and Telecommunications, National and Kapodistrian University ofAthens, GreeceNancy Alonistioti, Department of Informatics and Telecommunications, National and Kapodistrian University ofAthens, GreeceChan Zhou, Huawei German Research Center, Munich, Germany
pages: 115 - 124Performance Analysis of MIMO Radar with Widely and Closely Separated AntennasRaed Daraghma, Palestine Technical Universty, Palestine
pages: 125 - 134Design of On-Chip GaN Transmitter for Wireless CommunicationRajinikanth Yella, NCTU, TaiwanKrishna Pande, NCTU, TaiwanKe Horng Chen, NCTU, TaiwanEdward Chang, NCTU, Taiwan
pages: 135 - 143Impacts of System Clock Granularity on Performance of NDN Rate-based Congestion ControlToshihiko Kato, University of Electro-Communications, JapanKazuki Osada, University of Electro-Communications, JapanRyo Yamamoto, University of Electro-Communications, JapanSatoshi Ohzahata, University of Electro-Communications, Japan

101
International Journal on Advances in Telecommunications, vol 11 no 3 & 4, year 2018, http://www.iariajournals.org/telecommunications/
2018, © Copyright by authors, Published under agreement with IARIA - www.iaria.org
Data Analytics for 5G Networks: A Complete Framework for Network Access Selection and Traffic Steering
Sokratis Barmpounakis, Panagis Magdalinos,
Nancy Alonistioti Dept. of Informatics and
Telecommunications, National and Kapodistrian
University of Athens Athens, Greece
email: [email protected] [email protected] [email protected]
Alexandros Kaloxylos Dept. of Informatics and
Telecommunications University of Peloponnese
Tripoli, Greece email: [email protected]
Panagiotis Spapis, Chan Zhou Huawei German Research Center
Munich, Germany email: [email protected]
Abstract— Data analytics has been widely accepted as a key enabler for 5G cellular networks. They can be applied in order to improve the performance of several mechanisms ranging from network management and traffic engineering to radio access network selection and traffic steering. Towards this end, this paper presents three supplementary mechanisms and provides a mapping of the required new functional entities into the latest version of the 5G architecture as specified by 3GPP. Additionally, it evaluates the performance of one of the mechanisms that targets the minimization of the information collected and used by the data analytics engine. All in all, this paper provides a holistic framework based on the use of data analytics that addresses several key 5G-oriented, resource management and traffic steering challenges.
Keywords- 5G cellular networks; data analytics; traffic steering; mobility management.
I. INTRODUCTION Lately, the use of data analytics to support the operation
of 5G cellular networks has emerged as a hot research topic [1]. The application of data analytics covers a wide range of network operations such as network management and control as well as policy enforcement. Figure 1 illustrates how this is achieved. More specifically, data are collected from a number of network components and may include a variety of information fields such as the quality of the wireless channel, the network load, accounting information, configuration and fault indications, the profile of the subscribers, etc. This data is stored and updated regularly. When collected, it is pre-processed, and any necessary transformation, discretization, normalization, outlier detection and dimensionality reduction is applied. The result of this process is then provided to a data analysis procedure which builds a model that caters for knowledge extraction from the processed data. For example, the result of this process may be the identification of situations where the occurrence of some specific events (e.g., a significant increase of the number of high mobility users)
causes a given result (e.g., increase of the handover blocking probability). The knowledge model may also include some solutions for specific situations (e.g., force the network components to place high moving users to macro cells). The knowledge discovery results can then be communicated to either policy, management or control modules. These modules can employ this information in order to optimize the operation of the network and improve its performance. In this paper we provide a complete framework on how data analytics can be used to support Radio Access Technology (RAT) selection and traffic steering.
Figure 1. Big data analysis for cellular networks
To answer why data analytics are needed for RAT
selection and traffic steering one has to consider the following. One of the most promising family of use cases has been named by the 3rd Generation Partnership Project (3GPP) as enhanced Mobile BroadBand (eMBB) services. These are characterized by throughput demanding services, high data volumes and significant numbers of users in
102
International Journal on Advances in Telecommunications, vol 11 no 3 & 4, year 2018, http://www.iariajournals.org/telecommunications/
2018, © Copyright by authors, Published under agreement with IARIA - www.iaria.org
specific areas (e.g., stadiums, malls etc.). To support these services, the following architectural updates/ changes are required [2]:
• densified deployment of base stations • support of heterogeneous access networks (e.g.,
operating below and above 6GHz, WiFis etc.) • deployment of efficient integration mechanisms
among heterogeneous access networks • support of flexible and dynamic steering of users’
sessions through these access networks These design decisions create a complex heterogeneous
environment. Thus, the selection of the most appropriate RAT and base station to support a user’s session is no longer a simple task. Under a homogeneous network this selection is simply based on the evaluation of the signal quality as received by neighboring base stations. However, for 5G networks the number of choices is going to be considerably higher. The dense deployment of base stations will offer at any time a high number of candidate macro, micro and femto cells for a user equipment (UE). Also, different RATs have different characteristics such as the supported throughput, the tolerance to interference, the transmission power and the respective energy consumption, the tariffing policy of the operator for using an access network etc. Thus, a selection should consider, apart from the signal quality, parameters like the mobility of a UE, the Quality of Service (QoS) required by its active services, the battery status of the UE, the preferences of the users, the network access and the technologies supported by the UE.
This device/technology-wise heterogeneous environment calls for a novel and comprehensive framework, which will take into consideration the available information related to the values of the abovementioned characteristics. A plethora of approaches has been proposed in the past to address this issue [3]. These approaches are based on the dynamic collection and evaluation of contextual information. The evaluation is usually done either through the calculation of utility functions or using neural networks or fuzzy logic mechanisms to reach a decision.
However, these solutions assume that the contextual information is somehow already in place and they neglect to estimate the signaling overhead that is required for the collection of contextual information. Moreover, although they consider that the preferences of the users are known, there is up to now no automatic solution to acquire this information, apart from having the users to set their preferences manually. Finally, these approaches are reactive schemes that take decisions on the fly. However, the complexity of the 5G networks requires that when available, some decisions should be proactive, otherwise the UEs will constantly monitor the environment and switch rapidly from one base station to another. This will be an extra overhead for the UEs’ computational resources and their batteries.
To address these points the current paper builds upon our prior work presented in [4] and [5]. In these papers we have presented two independent solutions: a) a RAT selection scheme, named Compass (Context Aware RAT Selection), for 4G networks that achieves
significant performance gains while keeping the signaling overhead at a minimum and b) a data analytics scheme, named Context Extraction and Profiling Engine (CEPE), that improves the performance of 4G cellular control functions (i.e., handover, call admission control and cell camping). Also, it calculates the profile of any user by monitoring its past actions. Based on this profile, the system has essentially the users’ preferences and is able to predict their future behavior in terms of location, mobility and service activity. So, future decisions for serving the UEs’ sessions under the most appropriate RAT can be taken essentially proactively. These two schemes can be adapted to operate under the 5G cellular systems and can be designed to operate complementary.
Very recently, the significance of these types of schemes for future cellular systems has been acknowledged by 3GPP. A new network function, called NetWork Data Analytics Function (NWDAF) has been introduced in [6]. Currently, this function has limited functionality and is employed in order facilitate operators’ policy manipulation in real time. In the 5G architecture, the Policy Control Function (PCF) will be used to control the placement and service of UEs by the most appropriate cell and radio access technology. In future releases, it is expected that additional information will be provided from NWDAF to network control functions responsible to handle the mobility of active and idle UEs. Moreover, it is considered that the output of NWDAF will also feed new network functions related to Access Traffic Steering, Switching and Splitting schemes (ATSSS) [7]. This framework is currently under investigation by the 3GPP since it has been acknowledged that the traffic steering of user sessions through multiple RATs is of paramount importance for 5G networks.
This paper extends the work presented in [1]. The key contributions of our current paper are the following. At first, we illustrate the latest status of 3GPP concerning the support of data analytics and traffic steering in 5G networks. Then, we present in detail how our prior work can be adapted and mapped into 3GPP’s network functions. Moreover, we provide detailed examples on their integrated operation. Additionally, we introduce and evaluate a new mechanism, called Context Information Processing (CIP) that targets the minimization of the acquisition of contextual information, which will be used by the data analytics mechanism of CEPE.
The rest of the paper is structured as follows. In Section II we present the current status of 3GPP specifications in relation to the overall architecture and the support of NWDAF and ATSSS network functions. In Section III we discuss the state of the art of research proposals for the support of RAT selection and traffic steering. In section IV we briefly describe the key functionalities of CEPE and Compass and we introduce the CIP mechanism. We also illustrate how these mechanisms can be integrated and mapped directly to the 5G network architecture. In Section V we evaluate the performance of CIP. We conclude the paper and sketch future research directions in Section VI.

103
International Journal on Advances in Telecommunications, vol 11 no 3 & 4, year 2018, http://www.iariajournals.org/telecommunications/
2018, © Copyright by authors, Published under agreement with IARIA - www.iaria.org
II. THE 5G NETWORK ARCHITECTURE In [6], 3GPP introduces the 5G network core
architecture. Some key principles target to: • Modularize existing network functions to enable
their flexible placement into network components and potentially allow their alternate configuration for different use cases.
• Enable network functions to interact among them even directly if this is required. The architecture does not preclude the use of an intermediate function to help route control plane messages.
• Minimize dependencies between the Access Network (AN) and the Core Network (CN). The architecture is defined with a converged core network with a common AN - CN interface, which integrates different Access Types e.g., 3GPP access and non-3GPP access.
• Support "stateless" Network Functions (NFs), where the computational resources are decoupled from the storage resources.
• Support concurrent access to local and centralized services. To support low latency services and access to local data networks, user plane functions can be deployed close to the AN.
The reference 5G architecture is illustrated in Figure 2.
Figure 2. 5G system architecture
The key network functions in the core networks are: • Unified Data Management (UDM): supports the
Authentication Credential Repository and Processing Function (ARPF).
• Authentication Server Function (AUSF): supports the authentication of end users.
• Policy Control function (PCF): supports unified policy framework to govern network behaviour, provides policy rules to control plane functions.
• Core Access and Mobility Management Function (AMF): supports mobility management, access authentication and authorization, security anchor functions and context management.
• Session Management Function (SMF): supports session management, selection and control of User Plane (UP) functions, downlink data notification and roaming.
• User Plane Function (UPF): is the anchor point for inter/intra RAT mobility, supports packet routing and forwarding, QoS handling for user plane, packet inspection and policy rule enforcement.
• Network Exposure Function (NEF): provides a means to securely exchange information between services and 3GPP NFs.
• Network Function Repository Function (NRF): maintains the deployed NF Instance information when deploying/updating/removing NF instances.
• Radio Congestion Awareness Function (RCAF): Informs the PCF about potential congestion issues in the radio access network.
• Network Slice Selection Function (NSSF): supports the functionality to bind a UE with a specific slice (i.e., a logical network that is configured and tailor-cut for a specific use case).
One of the novel core network functions, which are introduced is NWDAF. According to the latest standardization activities, the NWDAF will provide load level information at a network slice level. NWDAF provides slice specific network data analytics to the PCF, as well as the NSSF over their newly specified interfaces (i.e., Nnwdaf, Nnssf and Npcf). PCF will be using the NWDAF input for optimizing the policies assigned to each UE and its respective on-going sessions and data flows. NSSF will utilize the NWDAF’s output to maintain the optimal UE/slice mapping for the diverse types of UEs and data flow characteristics. Note that multiple slices may be coexisting in certain areas. Besides PCF and NSSF, also TSSF (Traffic Steering Support Function) will essentially receive NWDAF’s output for optimizing traffic steering decisions.
As for the support of untrusted non-3GPP access systems (like WiFi) an interworking function, called Non-3GPP Inter Working Function (N3IWF), is introduced. It supports the establishment of Internet Protocol Security (IPsec) tunnels with the UE and relays the information needed to authenticate the UE and authorize its access to the 5G CN. Note here that since Release 14 [8], 3GPP is also pursuing the tight integration of WiFis with the cellular system at the radio access network level. One such solution is the LTE-WLAN Aggregation (LWA) that capitalizes the dual connectivity split-bearer architecture, introduced in Release 12, where the aggregation of data links takes place at the Packet Data Convergence Protocol (PDCP) level. Another example is the RAN-controlled LTE-WLAN Interworking (RCLWI) mechanism that enables an eNB/New Radio gNodeB (NR gNB) to trigger a steering command to the UE to offload its traffic to a WiFi.
NWDAF and the interworking functions create the framework to define policies and allow the flexible flow handling among heterogeneous access networks. For the actual control of these capabilities 3GPP is in the process to define a new network function, namely the ATSSS, which is
UE RANData
network
NRF PCF UDM
AUSF AMF SMF
CN
Control Plane Slice i
NEF
UDR
AF
Untrusted non-3GPP
Access
N3IWF
UPF
Service Provider
NSSF
NWDAF RCAF

104
International Journal on Advances in Telecommunications, vol 11 no 3 & 4, year 2018, http://www.iariajournals.org/telecommunications/
2018, © Copyright by authors, Published under agreement with IARIA - www.iaria.org
responsible for the management of the different UE flows over the available access technologies [6]. The three main operations supported by the ATSSS are:
• Access Traffic Steering: The procedure that selects an access network for a new data flow and transfers the traffic of this data flow over the selected access network.
• Access Traffic Switching: The procedure that moves all traffic of an ongoing data flow from one access network to another in a way that maintains the continuity of the data flow.
• Access Traffic Splitting: The procedure that splits the traffic of a data flow across multiple access networks. When traffic splitting is applied to a data flow, some traffic of the data flow is transferred via one access and some other traffic of the same data flow is transferred via another access system.
All the three operations are applicable between 3GPP and non- 3GPP access. The ATSSS is distributed over different network entities, such as the UE, the UDR, the SMF and the PCF as shown in Figure 2.
The ATSSS logical architecture consists of the following components:
• UDR-AT3SF: The User Data Repository for Access Traffic Steering Switching and Splitting Function holds UE’s subscription data.
• PC-AT3SF: The Policy Control Access Traffic Steering Switching and Splitting Function defines the ATSSS policies according to: a) the application-specific information provided by the AF, b) access information/notification provided by the AMF, c) UE subscription and user profiles provided by the UDR-AT3SF and d) network local policy. The PC-AT3SF may also take input from the NWDAF into consideration to generate or modify its policies.
• CP-AT3SF: The Control Plane Access Traffic Steering Switching and Splitting Function is the main control plane of the ATSSS architecture. It is responsible for ATSSS policy enforcement and session management of all data sessions.
• UP-AT3SF: The User Plane Access Traffic Steering Switching and Splitting Function is the user plane anchor point for all ATSSS traffic and presents a single IP address towards data networks. It is responsible for ATSSS policy rule enforcement in the user plane of the core network.
• UE-AT3SF: The UE Access Traffic Steering Switching and Splitting Function is the policy rule enforcement at the UE level for UE-initiated uplink traffic. It may also generate traffic reports to be sent to the CP-AT3SF.
From the above analysis, it becomes clear that ATSSS’s functional elements will be responsible to select the access technology per each active UE data flow. 3GPP is currently defining the context parameters, on which these decisions will be made, as well as the negotiation details between the UE and the network, as far as the mapping between the data
flows and the available access network resources are concerned.
Figure 3. The ATSSS architecture
As it will be shown in detail in Section IV, the novel
framework we describe in our paper is fully compatible with this latest architectural status of 3GPP.
III. STATE OF THE ART ANALYSIS In this section, we present a state-of-the-art analysis of
research proposals for a) data analytics and b) RAT selection and traffic steering in 5G networks.
A. Data analytics solutions for 5G networks Lately, several researchers are investigating how data
analytics can assist in improving the performance of 5G networks. The authors in [9] present a unified data model based on random matrix theory and machine learning. They also provide examples on how big data analytics can be used to estimate the location, select an appropriate waveform, discover coverage holes, characterize user plane traffic etc.
The work in [10] presents a generic extraction and correlation framework that reduces the collected data set through randomization and a coarse preservation of statistical relationship among data records. This scheme is very interesting but as the authors state, it remains an open issue how to filter out unrelated information so as to minimize the collection of huge amounts of data that is not really useful. We address this point with the CIP scheme that is presented in a later section.
The results of the SELFNET project are presented in [11]. The target of the authors was to provide an autonomic network management framework for 5G mobile networks. Thus, the focus lies on the analyzer module that infers data from a set of collected metrics. The paper presents in detail the operation of the analyzer, but it does not provide a detailed discussion on the information that needs to be collected to support specific 5G use cases.
Another proposal to use data analytics for network management is presented in [12]. The authors present a new framework, named Big Data SON (BSON). It takes into consideration data at a UE level (i.e., network related performance such as throughput, delay, blocking and drop

105
International Journal on Advances in Telecommunications, vol 11 no 3 & 4, year 2018, http://www.iariajournals.org/telecommunications/
2018, © Copyright by authors, Published under agreement with IARIA - www.iaria.org
rates etc.), cell related data (Reference Signal Received Power and/or Quality - RSRP/RSRQ, of serving and neighboring cells, number of active users etc.) and core network data (alarms, configuration, security data, Call data records etc.). By applying data mining schemes upon the collected information, it is possible to transform reactive network management mechanisms into proactive ones. The paper provides an exhaustive list of information that can potentially be used. However, it does not analyze the traffic volume that needs to be collected in order for the scheme to perform the desired results. Also, they provide operational details only for a simple scenario.
The authors of [13] present the user and mobile network data that can be potentially collected and processed by a data mining scheme. They also discuss how resource management, planning, interference coordination and cache server deployment is done nowadays. They suggest that these will be optimized if data analytics mechanisms are adopted by network operators. The paper discusses the main operation principles of their framework but there are no detailed examples.
The authors of [14] present a mechanism that analyzes past information related to the load of wireless network in order to optimize the allocation of radio resources in the future. Interestingly enough, the results are based on the analysis of data collected from a commercially deployed mobile network. Another interesting idea is presented in [15]. It is proposed to use data analytics to optimize the performance of specific protocols in the radio access network. For example, the authors suggest that it is possible to reduce, for example, the overhead in Radio Header Compression in PDCP, or minimize the required signaling during the execution of a handover.
In [16], the authors introduce a solution that analyzes application layer information to identify the exact model of an end device. The authors of [17] suggest that the examination of Call Detail Records (CDR), collected from the core network, can be used to estimate moving patterns of people inside a city.
Finally, the work in [18] discusses how data analytics can be used to understand the relationship between users and services. More specifically, this approach requires to obtain real-time information about the application the users are using, analyze the information and predict the users' preferences and expectations. Then, the network resources are managed accordingly to provide the required Quality of Experience (QoE) to the end users. Based on this solution, the UEs should collect a lot of information and transfer it regularly to the network for further processing. This requires a lot of processing power in the UEs and it may affect their battery level consumption. More importantly, the exchange of a significant amount of information over the wireless link, by a large number of UEs, may cause performance issues to the real data the UEs are exchanging. In the following sections, we will briefly present how CEPE has been designed to operate and create a dynamic profile for end users. Based on this profile several control functions can optimize their performance [5]. Also, we introduce CIP that minimizes the collection of information needed by the
CEPE framework. The key idea is that information is collected and transmitted to the CEPE engine only when the UE behavior deviates from the expected one as already captured by the user profile.
B. RAT selection and Traffic Steering solutions The challenge of optimizing traffic steering and RAT
selection in heterogeneous and multi-cell layer network environments has been studied thoroughly during the past years.
The work in [19] proposes a cognitive framework, which operates on the side of the UE and targets to create a knowledge base using clustering and reinforcement learning techniques in order to create effective policies for the different user/network states. The authors present specific benefits in terms of balanced cell load; however, the evaluation is based on only 2 Long Term Evolution (LTE) nodes and 3 client nodes, which makes the model a bit simplistic. In addition, the authors restrict their model only in the downlink, and assume that there is no interference.
In [20], the authors attempt to optimize the data flow – Air Interface Variants (AIVs) mapping via dynamic traffic steering on the PDCP layer. The traffic steering framework resides in the Radio Access Network (RAN) and translates the AIV-agnostic QoS metrics to AIV-specific ones based on real-time feedback from the AIVs. Although it presents a very advanced evaluation scenario using small cells and 1000 UEs, it does not describe in detail the context information and/or the algorithmic approach that has been followed.
In [21], the authors focus on the energy perspective and propose an energy-sustainable traffic steering framework, which adjusts dynamically the traffic load to match the base stations’ energy distributions in both the spatial and the temporal domains. Moreover, they identify several research challenges related to service capability with energy harvesting, low complexity operation, trade-off between system and user performance, etc. They present a comprehensive case study with realistic configurations and show a considerable optimization from the energy consumption perspective. However, no context information is analyzed and no network-related Key Performance Indicators (KPIs) are thoroughly discussed.
The work in [22] presents a context-aware framework, which uses a multi-attribute decision making scheme for optimal RAT selection in an ultra-dense network. The authors categorize the decision criteria between network- and user- oriented ones. The network-oriented criteria include the received signal strength and the communication data rate. The user-related criteria include the type of the application, jitter, packet loss and delay. In the performance evaluation of the proposed scheme, they target at the minimization of the number of handovers, while they also focus on the ranking abnormality, i.e., the condition to investigate the ranking order of the access network due to the inclusion or exclusion of a RAT. Nevertheless, the evaluation is carried out based on numerous assumptions (e.g., the results are analyzed at thirty pre-defined decision points), without deploying a realistic network environment.

106
International Journal on Advances in Telecommunications, vol 11 no 3 & 4, year 2018, http://www.iariajournals.org/telecommunications/
2018, © Copyright by authors, Published under agreement with IARIA - www.iaria.org
In [23] the authors attempt to identify the impact of different aspects of network models, including network topology and bandwidth allocation of the performance of several RAT selection algorithms. They carry out a detailed survey of different solutions, categorizing them in reinforcement learning-based algorithms, regret matching-based, RAT selection games-based, partially/fully distributed algorithms, etc. They conclude that the performance of adaptive RAT selection algorithms is most significantly affected by the number of base stations that a user can connect to. However, they do not use any realistic/simulated environment to carry out the evaluation, they provide no details in relation to the actual evaluation environment, while the comparison is based only on “numerical tests”.
Last but not least, in [24], the authors present a comprehensive survey of the main traffic steering and handover decision criteria in the literature. According to this work, some researchers focus on evaluating the RSRP/RSRQ, the user location or speed, the mobility patterns, the battery level, the mean UE transmit power and the UE power consumption, the load of the cell and the service type. Apart from the case of RSRP, typically researchers are using multiple criteria (e.g., battery lifetime, traffic type, cell load, speed) and are using different tools (e.g., cost-based functions, fuzzy logic, etc.) to reach a decision.
As it can be inferred from the above analysis, numerous efforts have attempted to provide a solution towards the heterogeneous RAT selection in dense network deployments. However, all of the reviewed papers make numerous assumptions, either on the design and architectural aspect of the solution (e.g., in relation to the available interfaces), or on the actual evaluation of the mechanism (e.g., by not implementing vital parts of the signaling procedures, simplistic network environment, etc.).
To the best of our knowledge, there is no previous work, which makes a comprehensive discussion on the specific context information to be acquired and processed and the burden this information imposes on the network. Furthermore, the work presented in the following sections combines complementary functionalities (i.e., data analytics with RAT selection schemes) and maps them into the latest 5G architecture focusing on how to acquire contextual information and minimize any related control signaling exchange.
IV. MAPPING THE PROPOSED FRAMEWORK INTO THE 5G ARCHITECTURE
In this section, we briefly describe the key points of CEPE and Compass presented in [4] and [5]. Furthermore, we present a novel mechanism, named CIP that aims to minimize the amount of contextual information that needs to be collected for CEPE’s operations. Also, we provide a detailed description about how these schemes can interoperate and map their functionality into the latest 5G architecture.
A. CEPE: A Context Extraction and Profiling Engine The work presented in [5], is able to automatically build
a user profile that can be used to predict the future behavior of a subscriber. This information is used to improve the performance of network control operations. More specifically, static and dynamic information is collected about:
1. User profile related information (static): gender, device type characteristics (e.g., cpu, memory, os, device type)
2. UE and device dynamic characteristics (dynamic): location, transmission power, amount of transmitted and received data, experienced delay, loss of packets, associated cells identifiers
3. Network related measurements (static and dynamic): type of cell (e.g., macro, femto, etc.), power transmission level, available resource blocks, amount of transmitted and received, data, delay, packet loss, number of connected devices
Based on these measurements, data analytics are used to build a knowledge model, the outcome of which is essentially a dynamic profile for end users. This profile predicts their future behavior based on their location, time and day, the battery level of their devices and their monetary charging status. This way the network can use this information to place users to the appropriate cells and radio access technologies during the execution of a handover or a new session establishment. Also, this information is used by the end devices to select the most suitable cell to camp on, when they are in an idle state. Extensive simulations demonstrate significant performance improvements both for the network operator as well the end users [5]. Note here that this is exactly the information (i.e., the dynamic profile of users that captures their future behavior in terms of mobility and service consumption), that the newly introduced NWDAF can report to the PCF and other network components to improve the performance of a 5G network. Thus, CEPE is essentially a potential future evolution of NWDAF. The introduction of NWDAF in the 5G architecture and its interfacing with the PCF (Figure 4) clearly indicates that in the future, its output will be used to select the most appropriate policies for UEs or types of UEs (e.g., high/low moving terminals, terminals involved in high/low data rate exchange, etc.).
Figure 4. Provision of information to NWDAF
107
International Journal on Advances in Telecommunications, vol 11 no 3 & 4, year 2018, http://www.iariajournals.org/telecommunications/
2018, © Copyright by authors, Published under agreement with IARIA - www.iaria.org
In the state of art research efforts (e.g., [17]), it has been identified that users tend to have the same behavior that is dependent on the terminal they use, their monetary charging status and preferences, the status of their battery and obviously their location (e.g., home office, on the road, etc.) during specific dates and hours. Their behavior also depends on the status of network components (e.g., the load of the network, the received signal strength, the experienced delay or packets losses). All this information is required for a data mining function like NWDAF/CEPE to create a realistic model and enable the selection of appropriate policies or fine tune network control functions. In Figure 3, the network components that have to feed information to the NDWAF/CEPE as well as the type of this information are illustrated. These 5G network components can potentially be UDR, PCF, RCAF and UE. Additional entities not included in Figure 1 are:
• Network Management System (NMS): reports performance indicators (e.g., bandwidth utilization, packet loss, latency, alerts, etc.).
• Access Network Discovery and Selection Function (ANDSF): reports the current policy rules shared with a UE to help it decide, to which available WiFi it may connect to.
• Offline Charging System (OFCS): passes information contained in CDRs, related to the resource usage of a UE.
• Online Charging System (OCS): informs about the current credit management status of a UE.
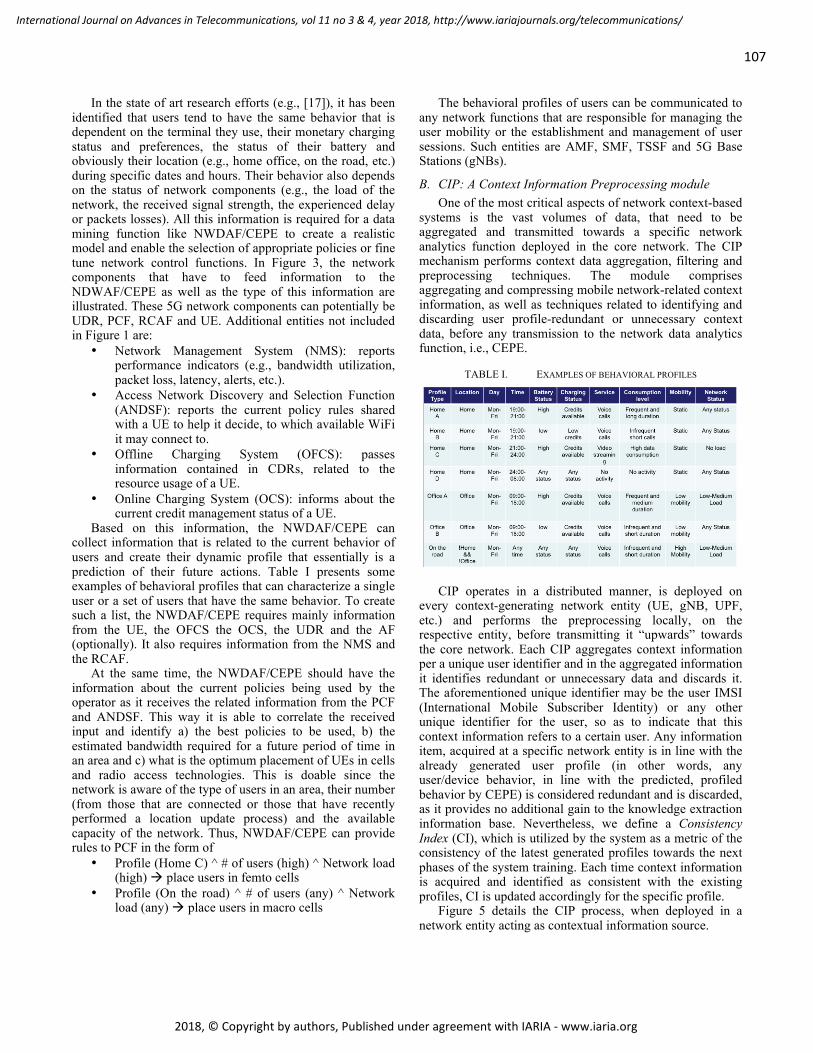
Based on this information, the NWDAF/CEPE can collect information that is related to the current behavior of users and create their dynamic profile that essentially is a prediction of their future actions. Table I presents some examples of behavioral profiles that can characterize a single user or a set of users that have the same behavior. To create such a list, the NWDAF/CEPE requires mainly information from the UE, the OFCS the OCS, the UDR and the AF (optionally). It also requires information from the NMS and the RCAF.
At the same time, the NWDAF/CEPE should have the information about the current policies being used by the operator as it receives the related information from the PCF and ANDSF. This way it is able to correlate the received input and identify a) the best policies to be used, b) the estimated bandwidth required for a future period of time in an area and c) what is the optimum placement of UEs in cells and radio access technologies. This is doable since the network is aware of the type of users in an area, their number (from those that are connected or those that have recently performed a location update process) and the available capacity of the network. Thus, NWDAF/CEPE can provide rules to PCF in the form of
• Profile (Home C) ^ # of users (high) ^ Network load (high) à place users in femto cells
• Profile (On the road) ^ # of users (any) ^ Network load (any) à place users in macro cells
The behavioral profiles of users can be communicated to any network functions that are responsible for managing the user mobility or the establishment and management of user sessions. Such entities are AMF, SMF, TSSF and 5G Base Stations (gNBs).
B. CIP: A Context Information Preprocessing module One of the most critical aspects of network context-based
systems is the vast volumes of data, that need to be aggregated and transmitted towards a specific network analytics function deployed in the core network. The CIP mechanism performs context data aggregation, filtering and preprocessing techniques. The module comprises aggregating and compressing mobile network-related context information, as well as techniques related to identifying and discarding user profile-redundant or unnecessary context data, before any transmission to the network data analytics function, i.e., CEPE.
TABLE I. EXAMPLES OF BEHAVIORAL PROFILES
CIP operates in a distributed manner, is deployed on every context-generating network entity (UE, gNB, UPF, etc.) and performs the preprocessing locally, on the respective entity, before transmitting it “upwards” towards the core network. Each CIP aggregates context information per a unique user identifier and in the aggregated information it identifies redundant or unnecessary data and discards it. The aforementioned unique identifier may be the user IMSI (International Mobile Subscriber Identity) or any other unique identifier for the user, so as to indicate that this context information refers to a certain user. Any information item, acquired at a specific network entity is in line with the already generated user profile (in other words, any user/device behavior, in line with the predicted, profiled behavior by CEPE) is considered redundant and is discarded, as it provides no additional gain to the knowledge extraction information base. Nevertheless, we define a Consistency Index (CI), which is utilized by the system as a metric of the consistency of the latest generated profiles towards the next phases of the system training. Each time context information is acquired and identified as consistent with the existing profiles, CI is updated accordingly for the specific profile.
Figure 5 details the CIP process, when deployed in a network entity acting as contextual information source.

108
International Journal on Advances in Telecommunications, vol 11 no 3 & 4, year 2018, http://www.iariajournals.org/telecommunications/
2018, © Copyright by authors, Published under agreement with IARIA - www.iaria.org
Figure 5. CIP operation
The steps it follows are:
1) Aggregation of profiles and context information: via the respective interfaces, context information is pulled/ pushed to CIP.
2) Linking of context information with the profiles provided by CEPE: for each connected IMSI, CIP makes an association with the respective profile that has already been acquired by CEPE and stored in CIP.
3) Context information comparison with the respective profile so as to identify any redundant information. If the information item that is evaluated is consistent with the respective profile, the item is identified as redundant.
4) Redundant information removal: Redundant information is discarded since it offers no additional insight to the CEPE data-mining phase.
5) Consistency Index update: every time an information item is identified as redundant, the CI is updated accordingly
6) Aggregation per unique identifier (e.g., IMSI): the filtered context information items are aggregated per identifier in order to be transmitted to CEPE.
Each user may have more than one behavioral profiles related to specific context information items (e.g., location, time periods, date, battery level, etc.); at the same time, each CIP entity may have more than one user profiles that refer to one or more users, the CIP when it has to provide context information to the CEPE (Step 1 – Figure 5), then it links the context information with the respective user behavioral profile (Step 2 – Figure 5) for the identification of the active behavioral profile. This implies that the CIP will map the context information to be transmitted with the predicted behavior of the user under certain preconditions that refer to the process that produced the context information. Then, by comparing the context information of the user, which is the actual behavior of the user with his predicted one (represented by the user behavioral profile), the CIP identifies the redundant information (Step 3 - Figure 5). Specifically, when a user complies with his predicted behavior, this information is considered redundant and may be discarded (Step 4 - Figure 5). When the user does not
comply with his predicted behavior, then this information is not redundant and has to be collected by the CEPE so as to be considered in the user behavioral profile extraction process from the “User Behavioral Profiles Extraction Function”. Each time redundant data is discarded, a consistency index (CI) is updated for the associated user identifier. Only not redundant data and the Consistency Index are transmitted to the CEPE either directly or through other CIPs (Step 5 & 6 – Figure 5).
As it will be shown in the Evaluation section, CIP’s operation becomes of utmost importance in large scale scenarios, with thousands of coexisting UEs and base stations. The context information escalates proportionally to the number of the users, while simultaneously, the RAT selection processing becomes even more complicated, as more UEs contend for the available attachment points.
C. Compass: A UE-oriented RAT selection scheme The third component of the proposed framework is
Compass, a light-weight RAT selection mechanism, which operates on the UE-side. Compass aggregates and processes context information in the vicinity of the UE using Fuzzy Logic. Compass’ objective is to construct a Suitability list of the available RAT and cell layer options.
Compass assesses the user preferences along with five different types of context information items (Figure 6), available in the network, i.e., the Received Signal Strength or RSRQ (for non-3GPP and 3GPP networks respectively), the base station’s load in terms of utilized capacity, as well as the respective load of the backhaul, the UE mobility type (static UE, low/high mobility, etc.), and finally the traffic flow characteristics (critical delay requirements, etc.). In order to avoid any signaling overhead to the network, the afore-mentioned information items have been carefully selected, as they are already available either in the UE or received from the network (e.g., in the form of broadcast messages). This approach considerably minimizes the signaling overhead of the proposed scheme.
Figure 6. Compass Fuzzy Inference System
Although initially designed as a standalone scheme,
Compass fits nicely with CEPE and CIP as it kicks in when
fuzz
ifier
BS/AP load
backhaul load
UE mobility
traffic flow type
RSRQ/RSS
Inference Engine
defu
zzifi
er
RAT suitability
list
rulesUE
Con
text
Man
ager

109
International Journal on Advances in Telecommunications, vol 11 no 3 & 4, year 2018, http://www.iariajournals.org/telecommunications/
2018, © Copyright by authors, Published under agreement with IARIA - www.iaria.org
the dynamic profile of user is not yet formed or when the expected behavior of a user deviates from what is already captured by the existing profile.
D. CEPE – CIP – Compass interworking This section highlights the complementary nature of the
network-operated CEPE with the UE-oriented Compass and discusses how the assets and shortcomings of each one can provide a holistic context-based traffic steering and RAT selection framework. CIP –on the other hand- operates -with both Compass and CEPE- in a distributed manner in all involved network entities independently, towards the preprocessing of the context information before its transmission; thus, in this section we will mainly focus on CEPE and Compass.
As already mentioned earlier, the core network-based CEPE with the UE-controlled Compass are able to operate independently –and with a different approach- with regard to the RAT selection and traffic steering policies. Compass operates on the UE side, and -based on a multi-criteria fuzzy logic based scheme- calculates the suitability of the available RATs and cells/APs for each one of its active sessions (applications/services/etc.) in almost real-time. On the other hand, CEPE operates as standalone Core Network function/entity, which builds upon historical context information and patterns in relation to the UEs, the network, the consumed applications and services, etc. and generates User Profiles, on which, prediction for future situations is based.
The two mechanisms target the same objective (applying optimized radio resource management and traffic steering) from divergent perspectives, which however, are complementary and can be combined. The complementarity of the two schemes is federated by the fact, that -as happens in the majority of context-based mechanisms-, the benefits have always to confront numerous shortcomings and limitations as well. Compass operation provides knowledge of the current situation of the network status – in the vicinity of the UE- and, based on the respective service requirements, it triggers a session setup (or a handover in case of an on-going session) to the most appropriate access technology and specific cell/AP; besides, Compass minimizes unnecessary execution of control functions based on the mobility of the user, the requirements of a particular service/application, as well as the load of the network.
Nevertheless, certain limitations refrain Compass from being capable of globally supporting the overall traffic steering and RAT selection operations in a holistic manner. The UE-assisted nature of the specific scheme, results in a solution, which on the one hand optimizes the resources provided for specific UEs, however, on the other hand, lacks any capability of an overall planning or overview of the status of the network, leading requests from the UE side impossible to address in very demanding situations, such as dense deployments. Novel traffic engineering approaches in forthcoming, challenging 5G environments will require solutions, which will act also partially from the UE side for
an efficient, real-time network probing, however, the final network-side decision making will be of utmost importance.
Furthermore, Compass acts in a reactive manner; the context acquired and processed by Compass refers to recent real-time behavior of the UE; this translates to slow convergence in cases of diverse UE behaviors in small time frames, consecutive calculations from the UE side every time the context is modified (such as mobility changes), etc. Last but not least, a context-based scheme on the UE side –no matter its efficiency- implies additional signaling information, -specifically for ultra-dense environments, where hundreds/thousands of UEs coexist among numerous base stations/Aps -, which makes the solution inefficient in terms of energy consumption – one of the most crucial aspects of UE-based solutions-, even if several energy-related optimizations have taken place in Compass design and implementation.
Contrary to Compass’ reactive nature, CEPE, on the other side, is a proactive Core Network based entity/function, which aggregates context information related both to the UEs (device characteristics, behavior profile, app usage, etc.), as well as the network status, and builds prediction models and user profiles, based on patterns, which are identified in this aggregated context over a certain amount of time. The network traffic demands prediction is directly linked to one of the strongest CEPE advantages: via the holistic picture of the network over long-time frames: this provides the network administrator a framework of utmost importance, facilitating traffic engineering operations, load balancing, etc.
As already highlighted, CEPE’s longer term context processing differs considerably from Compass’s, which applies real-time monitoring and decision-making. One the one hand, this provides the ability to predict user future behavior, in terms of both mobility, as well as service usage; on the other hand, however, this operation implies certain weaknesses for specific/examples: a new UE connects to the network, which CEPE is not trained for, or there is a deviation from the existing profile (a UE enters a new area, in which CEPE is still not trained or an event occurs (e.g., new type of application/service launched), which deviates considerably from the profile that CEPE has built for the particular UE, etc.). Another shortcoming identified relates to the limited ability of CEPE operation to perform micro monitoring in real-time and identify the specific cell/AP, which should be selected for a specific UE –in case of multiple options-. This information is however acquired by Compass, which scans when required the UE’s environment in real-time; thus, the two schemes may as well combine context information towards the optimal selection.
To sum up, certain capabilities and shortcomings of the operation of the two, primary context-based schemes (i.e. CEPE and Compass) prove that a solution, which combines their operation in a parallel and coordinated manner, would provide considerable gains (Figure 7).
• Compass operates as long as no valid user profile is currently available
• CEPΕ provides the main policies for UE to RAT mapping and traffic steering to the relevant network

110
International Journal on Advances in Telecommunications, vol 11 no 3 & 4, year 2018, http://www.iariajournals.org/telecommunications/
2018, © Copyright by authors, Published under agreement with IARIA - www.iaria.org
entities, which are responsible for forwarding them down to the UEs.
• Whenever, an event occurs, which shows that a UE behavior deviates from CEPE’s profiles (e.g., unexpected use of a service different mobility or location for a UE, etc.), Compass’ resumes its operation and the current profile is ignored. In this case CIP will update CEPE with new and detailed information.
• Last but not least, CEPE can be exploited to fine-tune the load information request rate of Compass to ANDSF, and/or other relevant context-aware components (not shown in the figure).
Figure 7. CEPE – Compass interworking MSC
E. The three mechanisms in 3GPP’s 5G architecture
As already mentioned in the first Section of this paper, the three mechanisms we present in this work are designed in such a way, to be fully compatible with the 3GPP 5G architecture. In Section II we presented in detail the latest status in 3GPP with regard to the 5G system architecture, along with the primary system components.
One of the novel core network functions, which are introduced in [6] is a dedicated data analytics function (NWDAF). CEPE, as a network data analytics and prediction engine is essentially a module, capable of supporting fully this functionality by serving as NWDAF instance in the forthcoming 5G architecture. Apparently, different data mining engines may be deployed by different operators, focusing on specific context information items or particular verticals/business scenarios. The diverse information items aggregated and processed by CEPE have been analyzed in the respective previous section. Mapping this information, with the afore- presented 5G architecture, several 5G network components, which generate valuable context information, will forward it to CEPE/NWDAF: Unified Data Repository, Access Network Discovery and Selection Function (ANDSF), PCF, RAN Congestion Awareness Function (RCAF), etc.
Moreover, the Radio Congestion Awareness Function (RCAF) is also a vital component for Compass context
information acquisition related to one of its five core context parameters, i.e. the real-time AP/cell load information. Compass will be receiving information related to the potential congestions related to specific APs/cells –besides the ANDSF, which has already been described in previous section- and will calculate the respective Suitability of each AP/cell.
With regard to the ATSSS, UDR-AT3SF holds UE ATSSS subscription data for operator service and user profiles. This functional element is directly linked with the output of NWDAF-CEPE profiles, which receives and provides them –as will be described below- to other ATSSS functional elements. UE-AT3SF implements ATSSS policy rule enforcement at the UE for UE-initiated traffic (UL). It may also generate traffic reports to be sent to the CP-AT3SF. The traffic usage reports from UE-AT3SF are directly linked to Compass operation and fine-tuning role, described in the previous section regarding the CEPE-Compass complementarity.
Thus, it becomes clear that ATSSS’ functional elements will be the responsible component/function, which will select the access technology per each active UE data flow. 3GPP is currently defining the context parameters, on which these decisions will be made, as well as the negotiation details between the UE and the network, as far as the mapping between the data flows and the available access network resources are concerned. Compass, as already described in the respective sections, could operate as an ATSSS instance for this UE flow – RAT mapping optimization, providing optimal selection with an energy- and signaling-efficient approach. CEPE-NWDAF and Compass are capable of providing this context information to the ATSSS elements. The following figure illustrates the proposed architecture, which integrates CEPE, Compass (and CIP) and maps them with the NWDA and ATSSS functionalities.
Figure 8. Logical interfaces of CEPE (as NWDAF instance) and Compass
(as UE-AT3SF instance) in the 5G architecture
To sum up, according to the above analysis, the Policy Control Access Traffic Steering Switching and Splitting Function (PC-AT3SF) defines ATSSS policies according to
COmpAsS AT3SF CIPUE
COmpAsS AT3SF CIPCP Function
PC and PC-AT3SF
NWDAF CEPE
COmpAsS operation –no profile is built yetInformation gathering/processing for CEPE
Information gathering/processing for CEPE
UE ProfileUE Profile
UE ProfilePause COmpAsS operation
Process new information –potentially update with anew profile
Resume COmpAsS operationTrigger CEPE update
Information gathering/processing for CEPEInformation gathering/processing for CEPE

111
International Journal on Advances in Telecommunications, vol 11 no 3 & 4, year 2018, http://www.iariajournals.org/telecommunications/
2018, © Copyright by authors, Published under agreement with IARIA - www.iaria.org
the application-specific information provided by the Application Function (AF), access information/notification provided by the Access and Mobility Function (AMF), and UE ATSSS subscription and user profiles provided by the User Data Repository ATSSS (UDR-AT3SF). In our proposed architecture (Figure 8) this information, –on which the ATSSS policies are generated- is federated by the NWDAF-CEPE function and is also linked to the NSSF, via the PC-AT3SF. Compass module is considered part of the UE-AT3SF instance- and is responsible for sending traffic usage and access technologies Suitability reports to UP-AT3SF, which relays them “upwards” via CP-AT3SF ultimately to NWDAF-CEPE for feedback-based fine-tuning of policies. A Compass instance is additionally deployed on the CP-AT3S function, in order to coordinate the scheme’s reporting with the Control Plane.
V. CIP EVALUATION AND OVERALL SYSTEM OVERHEAD QUANTIFICATION USING AN ANALYTICAL
APPROACH For the analysis of CIP, we consider an ultra-dense
network with a high number of base stations (macro, as well femto cells) and UEs within a geographically limited area. We are assuming a network area serving a million active UEs. We assume that the operator is performing profile-based data analytics using CEPE. Various parameters related to context information should be aggregated from numerous network entities, each of which is characterized by a different payload as well. For this reason, we provide Table II that shows the payload that we used in our evaluation schema; for each context item we also provide a reference, in which detailed insights are presented.
TABLE II. PAYLOAD PER CONTEXT INFORMATION PARAMETER
Parameter Payload Source Network Entity
Reference
IMSI 64 bits gNB, MME [25]
Cell ID (+MCC+ MNC) 32 bits gNB, MME [26]
Timestamp (TS) 32 bits All [27]
Mobility (Mobility State Estimation based on Handover counters as in LTE)
8 bits MME [28]
User Charging Data Record (CDR)
64 KB to 100 MB
OFCS (Offline Charging System) – CGF
[29]
Contract type (in SPR – Subscription Profile Repository)
4 bits PCRF – PGW [30]
Charging status (enough credit/no credit)
1 bit Online Charging System (OCS) – PGW
[31]
UE Battery Status (normal/low)
2 bits UE [32]
The signaling overhead estimation depends on the
network entities where CIP and CEPE are deployed as the
number of hops and the interface types between the source and destination of the context information transmission varies. In the evaluation example, the key assumption for CEPE and CIP is illustrated in the following figure (Figure 9).
Figure 9. CEPE and CIP deployment in the network during the evaluation
The particular example (Figure 9) shows that the CIPUE and the CIPgNB are one hop away in terms on direct, implemented network interfaces, the CIPUE and the CEPE two logical hops, etc. A similar scenario may of course be applied in the same way for N hops between the network entities, in case CEPE and CIP are deployed in different entities as well.
We compare the proposed approach against two mechanisms by quantifying the overhead induced to the basic daily signaling due to their application (Table III).
TABLE III. JUXTAPOSED SCHEMES
Proposed scheme Pre-processing Redundant information
identification/discard Standard None – all information
is aggregated to be transmitted
None
Semi-optimized Basic pre-filtering (pre-aggregation per IMSI
and location)
None
The format of the transmitted context information
comprises all the required information items, as discussed earlier and is described as follows:
(IMSI, location, TS), Mobility State Estimation (MSE) /
Bearer ID / contract type / charging status / battery status The IMSI-location-TS triplet comprises a key and is
always transmitted along with one or more of the remaining context parameters (e.g., MSE, bearer ID, etc.). We define equation (1) in order to calculate the overall signaling cost imposed by the transmission of the afore-described context information parameters.
O is the overall signaling overhead, N the number of
users connected to the system, M the number of the different profiles/behaviors that the UE exhibits, Pc the consistency percentage that describes the portion of the acquired context information, which is consistent with the existing user
O =N
∑i= 1
M
∑j= 1
[(1 − Pc)x (S(Im)x Fr (Im) + Scdr) + S(Istatic) + Scc] (1)

112
International Journal on Advances in Telecommunications, vol 11 no 3 & 4, year 2018, http://www.iariajournals.org/telecommunications/
2018, © Copyright by authors, Published under agreement with IARIA - www.iaria.org
profile, S(Im) the payload of each one of the mth context parameter TS / MSE / contract type / charging status / UE battery status, Fr(Im) the transmission frequency of each one of the mth parameter TS / MSE / CDR / contract type / charging status, Scdr the message of the varying CDR file sizes (1/10/100 MB), S(Istatic) the payload of the static tuple IMSI, location, which equals (64 + 32 bits = 96 bits) and Scc the size of the Consistency Counter.
Figure 10. System overhead with varying profile consistency
The evaluation that follows illustrates the system overhead imposed during the context data acquisition and for varying scenarios of UE profile consistency. We assume that the consistency percentage - Pc - varies from 10 up to 90%, as shown in the first chart (Figure 10). The second evaluation chart (Figure 11) illustrates the gain of the proposed scheme –CIP- against the two afore-mentioned standard mechanisms. As it can be seen on the X-axis of Figure 11, we attempt to assess the CIP’s gain for different cases, in terms of the CDR file sizes, which often may vary; in our evaluation we use varying sizes, from very small to considerably large: 1, 10 or 100 MB according to respective references [32]. For the evaluation, we consider some of the most challenging 5G use cases (Figure 12), which follow the METIS project specifications [33] and correspond to varying number of UEs in the network environment; traffic jam, shopping mall, stadium, open-air festival are some indicative examples. The results of the initial 3-fold evaluation that was described above are illustrated in the following charts.
As depicted in the graphs, the gains of applying CIP during the context information acquisition and transmission between the different network entities may vary from small to huge. The most important parameter that influences the extent of the signaling overhead minimization is the data consistency in terms of the already available user profiles.
In other words, as one would expect, the more consistent the context data is with the CEPE-produced user profiles, the more the overhead approaches zero when CIP is applied (Figure 10, Figure 11).
Figure 11. CIP’s gain over the two selected schemes
In all cases, the semi-optimized scheme performs better already than the standard scheme, which transmits all the information towards the Knowledge Extraction engine (CEPE), while both of these schemes our outperformed by CIP.
As already discussed earlier, the number of devices to be managed by the network is one of the most challenging 5G use cases. Figure 12 illustrates the great gain that results from the application of CIP, particularly in selected, established use cases, as these have been identified and thoroughly defined in one of the first 5G EU projects, i.e. FP7 METIS 2020 [33], such as an Open Air Festival, or a Dense Urban Information Society, where the numbers of users peak.
VI. CONCLUSIONS In this paper, a context based framework towards radio
resource management was introduced, comprised of three mechanisms: Compass, CEPE and CIP. Each one of the individual mechanisms performs a complementary operation towards optimizing the RAT selection and traffic steering and switching operations in 5G network environments. The core policy extraction component, CEPE, is based upon extensive data analytics on user- and network- related information in order to generate UE profiles, while it is federated by the real-time operated, UE-oriented Compass scheme; CIP performs context information pre-processing and filtering towards the reduction of the transmitted information among the network entities.
The second part of this work presented the latest 5G system architecture, as this has been described so far by 3GPP and performed a comprehensive mapping between the former and the proposed framework.
Future directions of this work will focus on –but will not be limited to- the real deployment and evaluation of the proposed system, using customized, open source software and components, based on the Open Air Interface [34] system, as well as custom Ettus Research-based Universal Software Radio Peripheral (USRP) [35] nodes for the hardware (access) part.

113
International Journal on Advances in Telecommunications, vol 11 no 3 & 4, year 2018, http://www.iariajournals.org/telecommunications/
2018, © Copyright by authors, Published under agreement with IARIA - www.iaria.org
Figure 12. Signaling overhead for different
5G use cases
REFERENCES [1] A. Kaloxylos, “Application of Data Mining in the 5G Network
Architecture”, the Thirteen International Conference on Digital Communications, ICDT 2018, Athens, Greece, March 2018.
[2] M. Gramaglia, A. Kaloxylos, P. Spapis, et. al, “E2E Architecture, in 5G System Design: Architectural and Functional Consideration and Long Term Research”, ISBN 978-1-119-42512-0, Wiley, pp. 81-112, June 2018.
[3] K.R. Rao, Z.S. Bojkovic, and B.M. Bakmaz, “Network Selection in heterogeneous environment: a step toward always best connected and served”, in Telsiks 2013, October 2013, pp. 83-92.
[4] S. Barmpounakis, A. Kaloxylos, P. Spapis., and N. Alonistioti, “Context-aware, user-driven, network-controlled RAT selection for 5G networks”, Computer Networks, Elsevier, Vol. 113, pp. 124-147, 2017.
[5] P. Magdalinos, S. Barmpounakis, P. Spapis, A. Kaloxylos, G. Kyprianidis, A. Kousaridas, et al., “A context extraction and profiling engine for 5G network resource mapping”, Computer Communications, Elsevier, Vol. 109, pp. 184-201, 2017.
[6] 3GPP TS 23.501, “System Architecture for the 5G System”, LTE Rel. 15, v 15.1.0, March 2018.
[7] 3GPP TS 23.793, “Study on Access Traffic Steering, Switching and Splitting support in the 5G system architecture”, Rel 16, v. 0.4, April 2018.
[8] 3GPP TS 23.402, “Architecture enhancements for non-3GPP accesses (Release 15)”, June 2017.
[9] Y. He, F. R. Yu, N. Zhao, H. Yin, H. Yao, and R. Qiu, “Big Data Analytics in Mobile Cellular Networks”, IEEE Access, Vol. 4, 2016.
[10] S. Robitsch, F. Zaman, S. van der Meer, J. Keeney, and G. Muntean, “Magnet: Real-Time Trace Stream Analytics Framework for 5G Operations Support”, IEEE Network Magazine September/October 2017.
[11] L. I. B. Lopez, J. M. Vidal, and L. J. G. Villalba, “An Approach to Data Analysis in 5G Networks”, Entropy Vol. 19, Issue 2, 2017.
[12] A. Imran, A. Zoha, and A. Abu-Dayya, “Challenges in 5G: How to Empower SON with Big Data for Enabling 5G”, IEEE Network Magazine, November/December 2014.
[13] K. Zheng, Z. Yang, K. Zhang, P. Chatzimisios, K. Yang, and W. Xiang, “Big Data-Driven Optimization for Mobile Networks toward 5G”, IEEE Network Magazine, January/February 2016.
[14] Z. Feng, X. Li, Q. Zhang, and W. Li, “Proactive Radio Resource Optimization with Margin Prediction: A Data Mining Approach”, IEEE Transactions on Vehicular Technology, Vol. 66, Issue 10, October 2017.
[15] S. Han, C. Lin, G. Li, S. Wang, and Q. Sun, “Big Data Enabled Mobile Network Design for 5G and Beyond”, IEEE Communications Magazine, Vol 55, Issue 9, July 2017.
[16] J. Liu, F. Liu, and N. Ansari, “Monitoring and Analyzing Big Traffic Data of a Large-Scale Cellular Network with Hadoop”, IEEE Network Magazine, July/August 2017.
[17] V. Kolar et. al., “People In Motion: Spatio-temporal Analytics on Call Detail Records“, Sixth International Conference on Communication Systems and Networks (COMSNETS), 2014.
[18] Y. Wang et. al., “A Data-Driven Architecture for Personalized QoE Management in 5G Wireless Networks”, IEEE Wireless Communications, Vol. 24, Issue 1, February 2017.
[19] J. S. Perez, S. K. Jayaweera, and S. Lane, “Machine learning aided cognitive RAT selection for 5G heterogeneous networks”, IEEE International Black Sea Conference on Communications and Networking, June 2017.
[20] A. Prasad, F. S. Moya, M. Ericson, R. Fantini, and O. Bulakci, “Enabling RAN moderation and dynamic traffic steering in 5G”, IEEE 84th Vehicular Technology Conference, September 2016.
[21] S. Zhang, N. Zhang, S. Zhou, J. Gong, Z. Niu, and Z. Shen, “Energy-sustainable traffic steering for 5G mobile networks”, IEEE Communications Magazine, Vol. 55, pp 54-60, November 2017.
[22] A. Habbal, S. I. Goudar, and S. Hassan, “Context-aware Radio Access Technology selection in 5G Ultra Dense Networks”, IEEE Access, Vol.5, April 2017.
[23] D. D. Nguyen, H. X. Nguyen, and L. B. White, “Performance of adaptive RAT selection algorithms in 5G heterogeneous wireless networks”, International Telecommunication Networks and Applications Conference (ITNAC), December 2016.
[24] D. Xenakis, N. Passas, L. Merakos, and C. Verikoukis, “Mobility Management for Femtocells in LTE-Advanced: Key Aspects and Survey of Handover Decision Algorithms”, Communications Surveys & Tutorials, IEEE, vol. 16, iss. 1, pp. 64-91,1st Quarter 2014.
[25] 3GPP “Current Capacity of IMSI, MDISDN and IPv6 Identifiers”, April 2010.
[26] 3GPP TS 23.003, “Numbering, addressing and identification”, v. 13.3.0, Rel.13, September 2013.
[27] http://www.unixtimestamp.com/, Epoch Unix Time Stamp Converter (accessed November 2018).
[28] 3GPP TS 36.331, “Evolved Universal Terrestrial Radio Access (E-UTRA); Radio Resource Control (RRC); Protocol specification”, v. 12.7.0, Rel.12, September 2015.
[29] “eLTE2.2”, Offline Charging Whitepaper, Huawei Technologies, February 2014.
[30] 3GPP TR 23.803, “Technical Specification Group Services and System Aspects: Evolution of policy control and charging”, v. 7.0.0, Rel. 7, October 2010.
[31] 3GPP TS 29.212, “Policy and Charging Control (PCC)”, v.11.6.0, Rel.11, October 2010.
[32] 3GPP TS 25.331, “Radio Resource Control (RRC); Protocol Specification”, v. 13.0.0, Rel.13, September 2015.
[33] The METIS 2020 Project – Laying the foundation of 5G, www.metis2020.com, (accessed November 2018).
[34] OpenAirInterface, 5G software alliance for democratising wireless innovation, http://www.openairinterface.org , (accessed November 2018).
[35] Ettus Research X310, https://www.ettus.com/product/category/USRP-X-Series (accessed November 2018).

114
International Journal on Advances in Telecommunications, vol 11 no 3 & 4, year 2018, http://www.iariajournals.org/telecommunications/
2018, © Copyright by authors, Published under agreement with IARIA - www.iaria.org
APPENDIX – LIST OF ABBREVIATIONS
5G 5th Generation of Cellular Mobile Communications 3GPP 3rd Generation Partnership Project (3GPP) RAT Radio Access Technology
eMBB Mobile BroadBand UE User Equipment QoS Quality of Service
CEPE Context Extraction and Profiling Engine NWDAF Network Data Analytics Function
PCF Policy Control Function ATSSS Access Traffic Steering, Switching and Splitting
CIP Context Information Processing AN/CN Access/Core Network
NF Network Function UDM Unified Data Management ARPF Authentication Credential Repository and Processing Function AUSF Authentication Server Function AMF Core Access and Mobility Management Function SMF Session Management Function UP User Plane
UPF User Plane Function NEF Network Exposure Function NRF Network Function Repository Function
RCAF Radio Congestion Awareness Function NSSF Network Slice Selection Function TSSF Traffic Steering Support Function
N3IWF Non-3GPP Inter Working Function IPsec Internet Protocol Security LWA LTE-WLAN Aggregation PDCP Packet Data Convergence Protocol
RCLWI LTE-WLAN Interworking NR New Radio
UDR-AT3SF User Data Repository for Access Traffic Steering Switching and Splitting Function PC-AT3SF Policy Control Access Traffic Steering Switching and Splitting Function CP-AT3SF Control Plane Access Traffic Steering Switching and Splitting Function UP-AT3SF User Plane Access Traffic Steering Switching and Splitting Function UE-AT3SF UE Access Traffic Steering Switching and Splitting Function
BSON Big Data SON RSRP/RSRQ Reference Signal Received Power/Quality
CDR Call Detail Records QoE Quality of Experience LTE Long Term Evolution AIV Air Interface Variants RAN Radio Access Network KPI Key Performance Indicator
NMS Network Management System ANDSF Access Network Discovery and Selection Function OFCS Offline Charging System OCS Online Charging System IMSI International Mobile Subscriber Identity
CI Consistency Index MSE Mobility State Estimation

115
International Journal on Advances in Telecommunications, vol 11 no 3 & 4, year 2018, http://www.iariajournals.org/telecommunications/
2018, © Copyright by authors, Published under agreement with IARIA - www.iaria.org
Performance Analysis of MIMO Radar with Widely and Closely Separated Antennas
Raed S. M. Daraghma
Department of Electrical and Electronics Engineering
Palestine Technical University, Palestine
Email: [email protected]
Abstract— In this paper, we address the problem of Direction of
Departure (DOD) and Direction of Arrival (DOA) estimation for
Multiple Input Multiple Output (MIMO) radar. The presented work
studies the effect of Radar Cross Section (RCS), Signal to Noise Ratio
(SNR) and speed of targets on the performance of the MIMO radar
with widely and closely separated antennas. Since the information
on the targets is obtained from the echoes of the transmitted signals,
it is straightforward that RCS and speed of targets play an important
role in system accuracy. Analysis can be used to find the direction
of multiple types of targets such as Capon, Multiple Signal
Classification (MUSIC) and parallel factor (PARAFAC). To
differentiate the meaning of targets, varying targets of different
types, such as bicycle, bird, man, ship and jet have been considered.
After defining suitable values for each type of target in 2D space, the
performance of each type is discussed by using the MATLAB
program. Finally, we present an experimental platform of MIMO
radar with Bistatic antennas which has been developed in order to
evaluate the performance of the above techniques under more
realistic conditions.
Keywords- MIMO Radar; Target Localization; Parallel Factor
(PARAFC); Direction of Arrival; Signal to Noise Ratio (SNR).
I. INTRODUCTION
Radar is an electronic device for detection and localization of
the target. It works by transmitting a special type of waveform,
and detects the echo signal. Radar can be designed to see through
conditions impervious to normal human vision, such as darkness,
haze, fog, rain, snow. In addition, radar has the advantage of being
able to measure target parameters like range and velocity.
Radar is used for a large range of civilian, military and
scientific applications like air surveillance, surface search,
tracking and guidance, weather radar, Earth observation.
In [1], the author selected a number of different moving
targets: simple and complex targets with different RCS and
speeds. From the existing work on the application of Capon,
MUSIC and PARAFAC to the localization of different targets, he
noticed the importance of the types of targets and the effect of
changing the speed of targets.
This paper focuses on comparing the performance criterion
for different types of targets as well as the impact of the number
of antennas on the performance of three different techniques
mentioned above.
The radar system can be classified into monostatic and bistatic.
The transmitter and receiver of the monostatic radar are located
in the same location, while the transmitter and receiver of the
biostatic radar are far apart relative to the wavelength used in the
radar. According to the characteristics of the transmitted signals
the radar system can be further classified into continuous wave
for radar and pulse radar. The continuous waveform radar
transmits a single continuous waveform while the pulse radar
transmits multiple short pulses. Most of the modern radars are
monostatic pulse radars [2]. Recently, a new field of radar
research called Multiple Input Multiple Output (MIMO) radar has
been developed, which can be thought as a generalization of the
multi-static radar concept. MIMO radar has multiple transmit and
multiple receive antennas as its name indicates [3].
In [4], the transmit and receive antennas may be in the form
of an array and the transmit and receive arrays can be co-located
or widely separated like phased array systems. Although some
types of MIMO radar systems look likes phased array systems,
there is a fundamental difference between MIMO radar and
phased array radar. The difference is that MIMO radar always
transmits multiple probing signals, via its transmit antennas, that
may be correlated or uncorrelated with each other, whereas
phased array radars transmit scaled versions of a single waveform
which are fully correlated. The multiple transmit and receive
antennas of a MIMO radar system may also be widely separated
as radar networks. The fundamental difference between a multi-
static radar network and MIMO radar is that independent radars
that form the network perform a significant amount of local
processing and there exists a central processing unit that fuses the
outcomes of central processing in a reasonable way. For example,
every radar makes detection decisions locally then the central
processing unit fuses the local detection decisions. Whereas
MIMO radar uses all of the available data and jointly processes
signals received at multiple receivers to make a single decision
about the existence of the target. The key ideas of MIMO radar
concept has been picked up from MIMO communications. MIMO
is a technique used in communications to increase data throughput
and link range without additional bandwidth or transmit power.
This is achieved by higher spectral efficiency and link reliability
or diversity. Using MIMO systems in communications made
significant improvements when there is serious fading in the
communication channel. Radar systems also suffer from fading
when there are complex and extended targets. Researchers took
the idea of using multiple transmit and receive antennas to reduce
the effects of fading from communications and applied it in the
field of radar to achieve performance enhancements. Some of the
most important radar applications are the detection performance
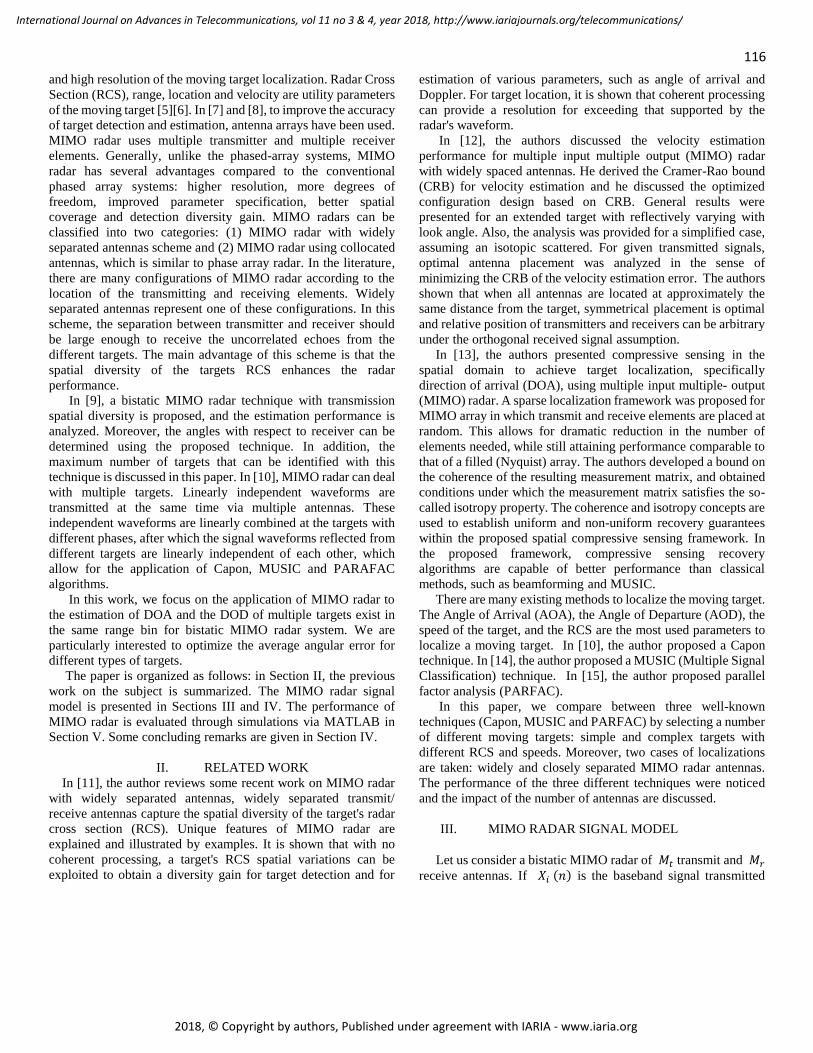
116
International Journal on Advances in Telecommunications, vol 11 no 3 & 4, year 2018, http://www.iariajournals.org/telecommunications/
2018, © Copyright by authors, Published under agreement with IARIA - www.iaria.org
and high resolution of the moving target localization. Radar Cross
Section (RCS), range, location and velocity are utility parameters
of the moving target [5][6]. In [7] and [8], to improve the accuracy
of target detection and estimation, antenna arrays have been used.
MIMO radar uses multiple transmitter and multiple receiver
elements. Generally, unlike the phased-array systems, MIMO
radar has several advantages compared to the conventional
phased array systems: higher resolution, more degrees of
freedom, improved parameter specification, better spatial
coverage and detection diversity gain. MIMO radars can be
classified into two categories: (1) MIMO radar with widely
separated antennas scheme and (2) MIMO radar using collocated
antennas, which is similar to phase array radar. In the literature,
there are many configurations of MIMO radar according to the
location of the transmitting and receiving elements. Widely
separated antennas represent one of these configurations. In this
scheme, the separation between transmitter and receiver should
be large enough to receive the uncorrelated echoes from the
different targets. The main advantage of this scheme is that the
spatial diversity of the targets RCS enhances the radar
performance.
In [9], a bistatic MIMO radar technique with transmission
spatial diversity is proposed, and the estimation performance is
analyzed. Moreover, the angles with respect to receiver can be
determined using the proposed technique. In addition, the
maximum number of targets that can be identified with this
technique is discussed in this paper. In [10], MIMO radar can deal
with multiple targets. Linearly independent waveforms are
transmitted at the same time via multiple antennas. These
independent waveforms are linearly combined at the targets with
different phases, after which the signal waveforms reflected from
different targets are linearly independent of each other, which
allow for the application of Capon, MUSIC and PARAFAC
algorithms.
In this work, we focus on the application of MIMO radar to
the estimation of DOA and the DOD of multiple targets exist in
the same range bin for bistatic MIMO radar system. We are
particularly interested to optimize the average angular error for
different types of targets.
The paper is organized as follows: in Section II, the previous
work on the subject is summarized. The MIMO radar signal
model is presented in Sections III and IV. The performance of
MIMO radar is evaluated through simulations via MATLAB in
Section V. Some concluding remarks are given in Section IV.
II. RELATED WORK
In [11], the author reviews some recent work on MIMO radar
with widely separated antennas, widely separated transmit/
receive antennas capture the spatial diversity of the target's radar
cross section (RCS). Unique features of MIMO radar are
explained and illustrated by examples. It is shown that with no
coherent processing, a target's RCS spatial variations can be
exploited to obtain a diversity gain for target detection and for
estimation of various parameters, such as angle of arrival and
Doppler. For target location, it is shown that coherent processing
can provide a resolution for exceeding that supported by the
radar's waveform.
In [12], the authors discussed the velocity estimation
performance for multiple input multiple output (MIMO) radar
with widely spaced antennas. He derived the Cramer-Rao bound
(CRB) for velocity estimation and he discussed the optimized
configuration design based on CRB. General results were
presented for an extended target with reflectively varying with
look angle. Also, the analysis was provided for a simplified case,
assuming an isotopic scattered. For given transmitted signals,
optimal antenna placement was analyzed in the sense of
minimizing the CRB of the velocity estimation error. The authors
shown that when all antennas are located at approximately the
same distance from the target, symmetrical placement is optimal
and relative position of transmitters and receivers can be arbitrary
under the orthogonal received signal assumption.
In [13], the authors presented compressive sensing in the
spatial domain to achieve target localization, specifically
direction of arrival (DOA), using multiple input multiple- output
(MIMO) radar. A sparse localization framework was proposed for
MIMO array in which transmit and receive elements are placed at
random. This allows for dramatic reduction in the number of
elements needed, while still attaining performance comparable to
that of a filled (Nyquist) array. The authors developed a bound on
the coherence of the resulting measurement matrix, and obtained
conditions under which the measurement matrix satisfies the so-
called isotropy property. The coherence and isotropy concepts are
used to establish uniform and non-uniform recovery guarantees
within the proposed spatial compressive sensing framework. In
the proposed framework, compressive sensing recovery
algorithms are capable of better performance than classical
methods, such as beamforming and MUSIC.
There are many existing methods to localize the moving target.
The Angle of Arrival (AOA), the Angle of Departure (AOD), the
speed of the target, and the RCS are the most used parameters to
localize a moving target. In [10], the author proposed a Capon
technique. In [14], the author proposed a MUSIC (Multiple Signal
Classification) technique. In [15], the author proposed parallel
factor analysis (PARFAC).
In this paper, we compare between three well-known
techniques (Capon, MUSIC and PARFAC) by selecting a number
of different moving targets: simple and complex targets with
different RCS and speeds. Moreover, two cases of localizations
are taken: widely and closely separated MIMO radar antennas.
The performance of the three different techniques were noticed
and the impact of the number of antennas are discussed.
III. MIMO RADAR SIGNAL MODEL
Let us consider a bistatic MIMO radar of 𝑀𝑡 transmit and 𝑀𝑟
receive antennas. If 𝑋𝑖 (𝑛) is the baseband signal transmitted

117
International Journal on Advances in Telecommunications, vol 11 no 3 & 4, year 2018, http://www.iariajournals.org/telecommunications/
2018, © Copyright by authors, Published under agreement with IARIA - www.iaria.org
λc/2
from antenna at frequency 𝑓𝑐 = 𝑐 λc⁄ , the signal received by a
target located at an angle 𝜃𝑡 in the far field is:
𝑅(𝑚, 𝜃𝑡) = 𝑎𝑇𝑡 ( 𝜃𝑡)𝑋(𝑛)
𝑛 = 1, 2, … … … . 𝑁 Where N denotes the total number of symbols transmitted from
each antenna, 𝑋(𝑛) is the vector of transmitted symbols at time
index n.
𝑋(𝑛) = [ 𝑋1(𝑛), 𝑋2(𝑛), … 𝑋𝑇(𝑛) ] (2)
and aT( θ ) is the transmit steering vector which take into account
the relative delay at each antenna
aT(θ) = [ej2π
λcT1(θ)
, ej2π
λc2(θ)
, … , ej2π
λcTn(θ)
] (3)
Using equation (1), the transmitted power at specific direction 𝜃
is defined as
P(θ) = EaTT(θ) x(n)xH(n)aT
∗ (θ) (4)
= aTT(θ) 𝑅 aT
∗ (θ)
R is the covariance matrix of the transmitted waveforms. If the
waveforms are orthogonal, i.e., 𝑅 = 𝐼𝑛𝑇, the power is equally
transmitted in all directions and adaptive detection techniques can
be applied without the need for scanning.
Uniform Linear Array
Figure 1. Diagram of a Uniform Linear Array Radar.
If a Uniform Linear Array (ULA) radar with half-wavelength
inter-element spacing is considered (see Fig. 1), the expression of
the excess distance 𝑑𝑖 (𝜃 ) traveled by the signal transmitted
from antenna 𝑖 becomes
di(θ) = ( 𝑖 − 1)𝜆𝑐
2sin (𝜃) (5)
and the expression of the steering vector 𝑎𝑇 becomes
aT ( 𝜃 ) = [1 𝑒𝑗 2𝜋 sin (𝜃) … 𝑒𝑗 (𝑛𝑟−1)𝜋 sin (𝜃)]
Assuming that the target has a reflection coefficient 𝛽𝑡 and moves
with a radial velocity 𝑉𝑟 , it produces a normalized Doppler shift
fdt such that
fdt = Vr
c fc
By defining the receive steering vector aR as
aR ( 𝜃 ) = [1 𝑒𝑗 2𝜋 sin (𝜃) … 𝑒𝑗 (𝑛𝑅−1)𝜋 sin (𝜃)]
the reflected echo from the target are denoted by
Yi (n) = β t ej2πnfdt aR
T(θ) x(n)
Moreover, let L be the number of static interferers located at the
angles 𝜃1 to 𝜃𝐿 and with reflection coefficients 𝛽1 to 𝛽𝐿. In
the presence of a centered white Gaussian noise w, the received
signals after matched filter can be expressed in a vector form as
Y(n) = β t ej2πnfdt aR
T(θ) x(n) + ∑ β taR(θi) aT T
𝐿
𝑖=1(θi) 𝑥(𝑛)
+ 𝑤(𝑛)2 (10)
𝑛 = 1, 2, … … … . 𝑁 To take advantage of the virtual array concept, the inter-
element spacing of the transmit antenna should be 𝑀𝑡 times
higher than the inter-element spacing at the receiver (see Fig. 2).
Figure 2. Radar with multiple receive antennas.
In this section, we consider that the Coherent Processing
Interval (CPI) consists of Q consecutive pulse periods. The
Swerlling II target model as in [16] was assumed, where RCS
X1 X2
2drsinϴ
Target
ϴ
(Mr-1)drsinϴ drsinϴ
dr
Target
ϴ
XMt X3

118
International Journal on Advances in Telecommunications, vol 11 no 3 & 4, year 2018, http://www.iariajournals.org/telecommunications/
2018, © Copyright by authors, Published under agreement with IARIA - www.iaria.org
coefficient is varying from pulse to pulse. The targets are located
in the far-field. The RCS coefficients are assumed to vary
independently from pulse to pulse, and the propagation medium
is non dispersive.
The baseband received signal at the output of the receive
array after synchronization can be written as:
Xq = B (∅) ∑ ATq (𝜃) 𝑆 + 𝑊𝑞 (11)
𝑞 = 1, 2, . . 𝑄
Xq ∈ RMr×Lcollects the L samples received by 𝑀𝑟 antennas for
the 𝑞𝑡ℎ pulse period.∑ 𝑑𝑖𝑎𝑔 (𝐶𝑞𝑞 ),with cq = [δ1q, … δkq] δkq =
αkq ej(q−1)x, i.e., 𝑥𝑞
is the Doppler frequency of the 𝑘𝑡ℎ
target [9]. The RCS coefficients δkq , k = 1, …K, are varying
independently from pulse to pulse, and Wq ∈ RMr×L is the noise
interference term. MIMO radar transmits mutually orthogonal
waveforms. We assume that 1 𝑆𝐿𝑆𝐻 = 𝐼𝑀⁄ . After right
multiplication of (11) by (1 𝐿) 𝑆 ∗ 𝑆𝐻⁄ , the matched filter output
is:
Yq = B (∅) ∑ ATq (𝜃) + 𝑍𝑞 (12)
𝑞 = 1, 2, . . 𝑄
Yq =1
LXSH ϵҪMr × Mt2Zq =
1
LWSH
Let us factorize (12):
Yq = (A(φ)ʘ B(θ) CqT + Zq (13)
Yq = vec (Yq)Zq = vec (Zq)
which can be written in the compact form:
Y = (A(φ)ʘ B(θ) CT + Z (14)
Y = [Yq, … , YQ]and Z = [Zq, … , ZQ] are of size
MtMr × 𝑄 and𝐶𝑇 = [𝐶1𝑇 , … , 𝐶𝑄
𝑇] is of size𝐾 × 𝑄
In [17], the Capon estimator can be written as:
P ( φ, θ ) = 1
a(φ)ʘb(θ)H 𝑅𝑌𝑌−1 (a(φ)ʘb(θ)
(15)
where Ryy = ( 1 Q ⁄ ) Y YH
The MUSIC estimator can be written as:
PMUSIC(φ, θ) = 1
a(φ)ʘ𝑏(𝜃) 𝐸𝑌𝐸𝑌𝐻 (a(φ)ʘb(θ)
(16)
𝐸𝑦 = 𝑀𝑡 𝑀𝑟 × (𝑀𝑡 𝑀𝑟 − 𝑘) is the matrix contains the noise
eigenvectors of Ryy . In [18], the third Estimator PARAFAC was
derived. PARAFAC implies the transmit and receive angles
relative to the same target are automatically paired.
IV. DATA MODEL
In this section, we consider the multiple pulses, multiple arrays
case. The MIMO radar system has the following parameters:
transmit array 𝑀𝑡 .
receive array 𝑀𝑟 .
K targets in a far field.
Q transmitted pulses, and the RCS is varying
independently from pulse to pulse.
δkq is the reflection coefficient of the kth target during
the qth pulse.
θk =1K , φk =1
K are the DODs and DOAs with respect
to transmit and receive array, respectively.
𝐴 (𝜃 ) = [𝑎(𝜃1), … , 𝑎(𝜃𝑘)] is the transmit steering
vector relative to K targets, 𝐵 (𝜑 ) =
[𝑏(𝜑1), … , 𝑏(𝜑𝑘)] is receiving steering, vector relative
to K targets.
V. SIMULATION RESULTS
In this section, MATLAB program simulation results are
presented to verify the above analysis and compare the
performance of the three techniques (Capon, MUSIC and
PARAFAC). Bistatic radar (see Fig. 3) and Localization of the
multiple targets for a Uniform Linear Array (ULA) configuration
at the transmitter and receiver can be achieved by the algorithms
[15].
Figure. 3. Schematic of a bistatic radar design
We generate the matrices S, A and B as explained in the
previous section [𝑆]𝑚 is generated by:
[S]m = (1 + 𝑗 2⁄ )[HN]m (17)
HN is the 𝑁 × 𝑁 Hadamard matrix, and N is fixed to 256.
The Signal to Noise Ratio (SNR) at the receiver is defined as:
SNR = 10 log(∑ |B ∑ AT Sq |F/|W|2Qq=1 F) (18)
Radar
Transmitter
Object
Radar
Receiver
TX
RX

119
International Journal on Advances in Telecommunications, vol 11 no 3 & 4, year 2018, http://www.iariajournals.org/telecommunications/
2018, © Copyright by authors, Published under agreement with IARIA - www.iaria.org
where Additive White Gaussian Noise (AWGN) is assumed, and
‖. ‖F is the Frobenis norm. We consider ULA transmit and receive
arrays with λ 2⁄ inter-element spacing for both arrays. For the
Swerlling II target model, each column of the matrix C ∈ RQ ×k
is generated from a complex Gaussian distribution with zero
mean and variance σδk2 .
The Doppler Xk is generated by:
Xk = 2π Vk Tp
λ (19)
𝑉𝑘 is the target velocity, 𝑇𝑝 = 5 × 10⁻⁶ is the pulse duration in
seconds, λ = 3 × 10⁸ fc⁄ with 𝑓𝑐 = 1 𝐺𝐻𝑧.
This subsection analyzes the impact of the number of targets
on the performance detection. The performance criterion is the
absolute value of the difference between the true angle and
estimated angle, averaged over transmit and receive angles and
over all targets.
In a first experiment (Fig. 4), we consider seven types of
targets. The variance and speed of each target was given in Table
I. We simulate the presence of two to six targets, starting from K
= 2 with DODs = [10°, 20°] and DOAs = [0°, 30°] until K = 6,
DODs = [10°, 20°, 30°, 40° , 50°, 60°] and DOAs =
[0°, 30°, 5° , 15°, 25°, 30°]. The number of pulses is Q = 100,
number of samples for each transmitted pulses is L = 512, SNR
=10 dB, and Swerlling II model is chosen. We plotted the
performance of the Capon method, and we compared the
performance of the different types of targets via Monte Carlo
simulation.
From Fig. 4, it is clear that a better angular resolution is
achieved when the target is "Man" and the worst angular
resolution is achieved when the target is "Car". From Fig. 4, we
observe that the global performance of all types of targets
seriously degrade when the number of targets is increased.
In Fig. 5, we simulate the presence of two to six targets. The
other parameters are the same as in Fig. 4, but, in this case we
have plotted the performance of the MUSIC technique. We
compare the performance of the different types of targets via
Monte Carlo simulation. From Fig. 5, it is clear that a better
angular resolution is achieved when the target is "Boat" and the
worst angular resolution is achieved when the target is "Fighter".
From Fig. 5, we observe that the global performance of all types
of targets seriously degrades when the number of targets is
increased. In Fig. 6, we simulate the presence of two to six targets.
The other parameters are the same as in Fig. 4, but, in this case,
we have plotted the performance of the parallel factor (PARAFC)
technique, and we compared the performance of the different
types of targets via Monte Carlo simulation.
From Fig. 6, it is clear that the best angular resolution is
achieved when the target is "Car" and the worst angular resolution
is achieved when the target is "Jet". From Fig. 6, we observe that
the global performance of all types of targets seriously degrades
when the number of targets is increased.
Table I. RCS AND SPEED FOR DIFFERENT TYPES OF TARGETS
Target Type Radar cross section
fot target (2m )
Speed of target
2/m s
Bicycle 2 10
Man 1 6.5
Car 100 100
Fighter 40 125
Boat 0.02 20
Jumbo Jet 100 40
Bird 0.01 150
Figure 4. Average angular error with number of targets (2-D Capon case)
This subsection analyzes the impact of signal to noise ratio on
the performance detection. In a second experiment, we simulate
the presence of three targets ( K = 3) characterized by DODs =
[10°, 20°, 30°] and DOAs = [−10°, −20°, 0°]. The number of
pulses Q = 100, the number of samples for each transmitted pulse

120
International Journal on Advances in Telecommunications, vol 11 no 3 & 4, year 2018, http://www.iariajournals.org/telecommunications/
2018, © Copyright by authors, Published under agreement with IARIA - www.iaria.org
L = 512, the number of transmit and receive sub arrays is fixed to
5, SNR ∈ (0, 2, 4, 6, 8, 10) dB, and the Swerling II model is
chosen. We plotted the performance of the Capon method, and we
compared the performance of the different types of targets via
Monte Carlo simulation.
Figure 5. Average angular error with number of targets(2-D MUSIC case)
Figure 6. Average angular error with number of targets (PARAFAC case)
From Fig. 7, it is clear that the best angular resolution is
achieved when the target is "Bird" and the worst angular
resolution is achieved when the target is "Bicycle". As expected,
from Fig. 7, we observe that the performance of all types of targets
improves when the signal to noise ratio increases. In Fig. 8, we
simulate the presence of three targets. The other parameters are
the same as in Fig. 4, but, in this case, we have plotted the
performance of the MUSIC technique, and we compared the
performance of the different types of targets via Monte Carlo
simulation. From Fig. 8, it is clear that a better angular resolution
is achieved when the target is "Bird" and the worst angular
resolution is achieved when the target is "Bicycle".
Figure 7. Average angular error with signal to noise ratio for each target (2-D
Capon case)
Figure 8. Average angular error with signal to noise ratio for each target (2-D
MUSIC case)
In Fig. 9, we simulate the presence of three targets. The other
parameters are the same as in Fig. 7, but, in this case, we have
plotted the performance of the parallel factor (PARAFAC)
technique and we compared the performance of the different types
of targets via Monte Carlo simulation. From Fig. 9, it is clear that
the best angular resolution is achieved when the target
is "Bird" and the worst angular resolution is achieved when the
target is "Jet".
Case 1: performance of the seven target for closed spaced, SNR
= 0 dB.
In Fig. 10, we plot the true angles for the seven targets ( K =
7) for closely spaced (θ, φ) Car = (−80, 70), bicycle =

121
International Journal on Advances in Telecommunications, vol 11 no 3 & 4, year 2018, http://www.iariajournals.org/telecommunications/
2018, © Copyright by authors, Published under agreement with IARIA - www.iaria.org
(−75, 65 ), man = (−40, 50), fighter = (−35, 45), boat =
(0, −10), jumbo jet = (5, −15), bird = (15, −5). The other
parameters are: the speeds and RCS for each target as shown in
Table I, the number of pulses Q = 100, the number of samples for
each transmitted pulse L = 512, the number of transmit and
receive sub arrays is fixed to 8, SNR = 0 dB, and the Swerlling II
model is chosen. In Figs. 11-13, we compare the performance of
different localization techniques via Monte Carlo simulations.
Figure 9. Average angular error with signal to noise ratio for each target
(PARAFAC case)
Figure 10. True angles for the targets
In Figs. 11- 13, we have plotted the 2-way Capon, 2-way music
and PARFAC. For the comparison between all methods to be fair,
the angular resolution of the two latter techniques is fixed to
0.0001 degree.
Case 2. performance of the seven target for closed spaced,
SNR = 30 dB
In Fig. 11, we can see from seven targets, 2-way Capon
technique can detect 3 targets which are: car, boat and bird
respectively, the average angular error is 57.1 degree.
From Fig. 12, we can also see that the 2-way music technique can
detect 3 targets from seven which are: car, man and bird
respectively, the average angular error is 57.2 degree.
Figure 11. Localization of the seven closely spaced targets by using 2-way Capon technique (SNR = 0 dB).
In Fig. 12, we can see that the PARAFC technique can detect
6 targets from seven which are all the targets except car target, the
average angular error is 5. 6 degrees. From these results we can
conclude that none of the above techniques can be detected all the
targets, because we need to change some parameters, i.e., the
angles of arrival and departure (widely spaced or closely spaced),
the other parameter is signal to noise ratio. The other conclusion
is the superiority of PARFAC among the other techniques.
We plot the true angles for the seven targets for closely spaced
(𝜃, 𝜑) Car = (−80, 70), bicycle = (−75, 65 ), man = (−40, 50),
fighter = (−35, 45), boat = (0, −10), jumbo jet = (5, −15), bird
= (15, −5). The other parameters are: the speeds and RCS for
each target as shown in table 1. The number of pulses Q = 100,
the number of samples for each transmitted pulse L = 512, the
number of transmit and receive sub arrays is fixed to 8, SNR = 30
dB, and the Swerlling II model is chosen.
From the comparison between Figs. 14 and 16, it is clear that a
better detection and angular resolution (regardless of the
technique used) is achieved when the signal to noise ratio
increases from 0 to 30 dB. For instance, six targets were detected
in 2-way Capon technique (car, man, jumbo jet, bird, fighter and
boat), five targets were detected in 2-way music technique (car,
man, boat, bird and jumbo jet), and all targets were detected in
PARAFAC technique.

122
International Journal on Advances in Telecommunications, vol 11 no 3 & 4, year 2018, http://www.iariajournals.org/telecommunications/
2018, © Copyright by authors, Published under agreement with IARIA - www.iaria.org
Figure 12. Localization of the seven closely spaced targets by
using 2-way Music technique (SNR = 0 dB).
Figure 13. Localization of the seven closely spaced targets by
using PARAFAC technique (SNR = 0 dB).
In this section, we illustrate the performance of estimator via
Monte Carlo simulation consisting of 100 runs for each value of
the SNR. Number of pulses is fixed to 100, 512 samples per pulse
and the number of targets to K = 4 for closely spaced (𝜃, 𝜑) = (−80, 70), (−75, 65 ), (−40, 50), (−35, 45). The RCS
coefficient of the car is (100 𝑚2), and the speed of target is
100 m s2⁄ . Fig. 17 shows the evolution of the error for the cases
𝑀𝑡 = 𝑀𝑟 , with either 3 to 7 antennas. Fig. 17 shows that
increasing the number of transmit and receive arrays from 3 to 7
improves the global performance. Fig. 15 shows the evolution of
the error for the cases 𝑀𝑡 = 𝑀𝑟 , with either 3 to 7 antennas. Fig.
18 shows that increasing the number of transmit and receive
arrays from 3 to 7 improves the global performance. From the
comparison between Figs. 17 and 18, it is clear that a better
angular resolution is achieved when the targets are widely spaced.
Figure 14. Localization of the seven closely spaced targets by
using 2-way Capon technique (SNR = 30 dB).
Figure 15. Localization of the seven closely spaced targets by
using 2-way Music technique (SNR = 30 dB).
In this section, we illustrate the performance of estimator via
Monte Carlo simulation consisting of 100 runs for each value of
the SNR. Number of pulses is fixed to 100, 512 samples per pulse
and the number of targets to K = 4 for widely spaced (𝜃, 𝜑) =
(−80, 70), (−40, 10 ), (0, 50), (40, −30). The RCS coefficient
of the car is (100 𝑚2), and the speed of target is 100 m s2⁄ .
In Fig. 19, we have plotted the two-way MUSIC spectrum, for
K = 5 targets with DODs = [40°, 35°, 30°, 40°, 65°] and DOAs
= [20°, 25°, 30°, 50°, −45°], i.e., for the three closely spaced
targets and two targets widely spaced from the others. The
number of pulses is Q = 100, number of samples for each
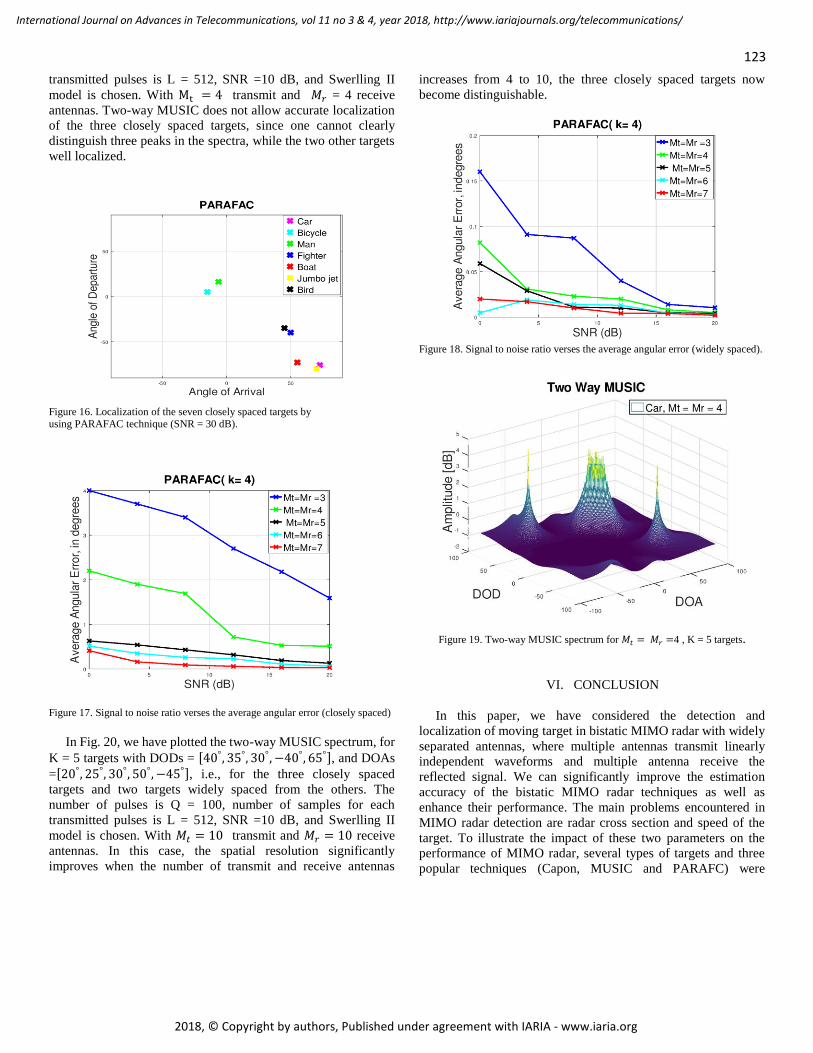
123
International Journal on Advances in Telecommunications, vol 11 no 3 & 4, year 2018, http://www.iariajournals.org/telecommunications/
2018, © Copyright by authors, Published under agreement with IARIA - www.iaria.org
transmitted pulses is L = 512, SNR =10 dB, and Swerlling II
model is chosen. With Mt = 4 transmit and 𝑀𝑟 = 4 receive
antennas. Two-way MUSIC does not allow accurate localization
of the three closely spaced targets, since one cannot clearly
distinguish three peaks in the spectra, while the two other targets
well localized.
Figure 16. Localization of the seven closely spaced targets by using PARAFAC technique (SNR = 30 dB).
Figure 17. Signal to noise ratio verses the average angular error (closely spaced)
In Fig. 20, we have plotted the two-way MUSIC spectrum, for
K = 5 targets with DODs = [40°, 35°, 30°, −40°, 65°], and DOAs
=[20°, 25°, 30°, 50°, −45°], i.e., for the three closely spaced
targets and two targets widely spaced from the others. The
number of pulses is Q = 100, number of samples for each
transmitted pulses is L = 512, SNR =10 dB, and Swerlling II
model is chosen. With 𝑀𝑡 = 10 transmit and 𝑀𝑟 = 10 receive
antennas. In this case, the spatial resolution significantly
improves when the number of transmit and receive antennas
increases from 4 to 10, the three closely spaced targets now
become distinguishable.
Figure 18. Signal to noise ratio verses the average angular error (widely spaced).
Figure 19. Two-way MUSIC spectrum for 𝑀𝑡 = 𝑀𝑟 =4 , K = 5 targets.
VI. CONCLUSION
In this paper, we have considered the detection and
localization of moving target in bistatic MIMO radar with widely
separated antennas, where multiple antennas transmit linearly
independent waveforms and multiple antenna receive the
reflected signal. We can significantly improve the estimation
accuracy of the bistatic MIMO radar techniques as well as
enhance their performance. The main problems encountered in
MIMO radar detection are radar cross section and speed of the
target. To illustrate the impact of these two parameters on the
performance of MIMO radar, several types of targets and three
popular techniques (Capon, MUSIC and PARAFC) were
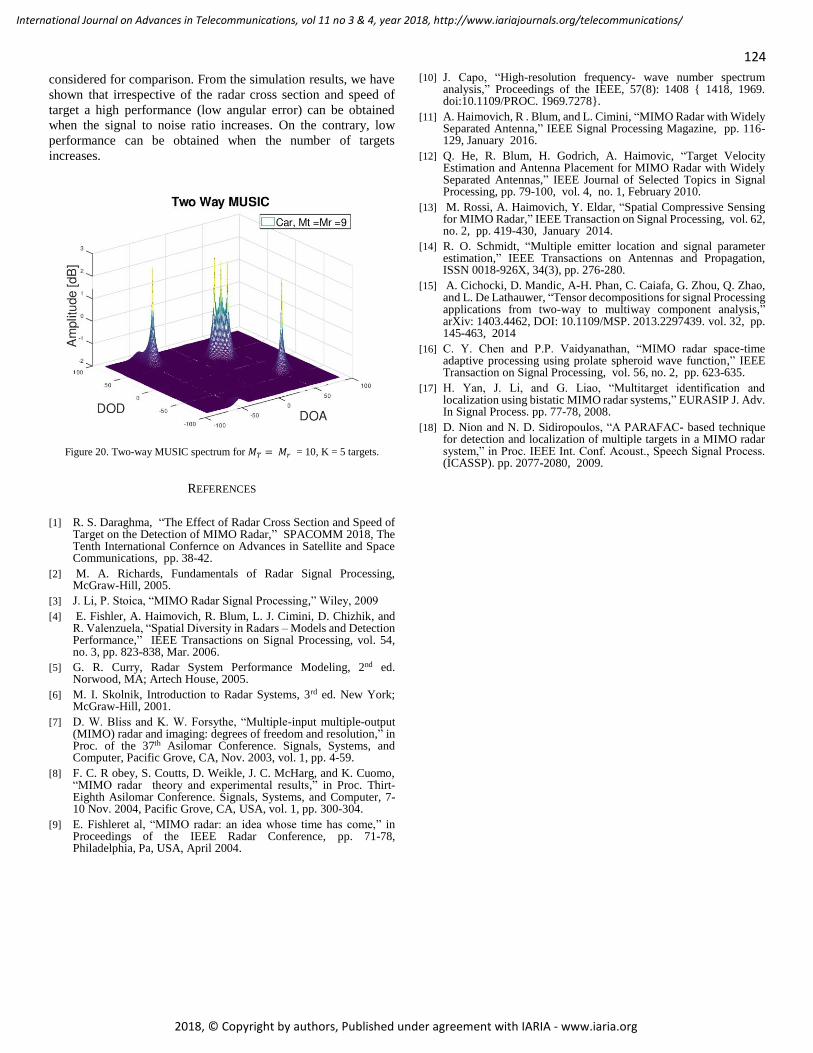
124
International Journal on Advances in Telecommunications, vol 11 no 3 & 4, year 2018, http://www.iariajournals.org/telecommunications/
2018, © Copyright by authors, Published under agreement with IARIA - www.iaria.org
considered for comparison. From the simulation results, we have
shown that irrespective of the radar cross section and speed of
target a high performance (low angular error) can be obtained
when the signal to noise ratio increases. On the contrary, low
performance can be obtained when the number of targets
increases.
Figure 20. Two-way MUSIC spectrum for 𝑀𝑇 = 𝑀𝑟 = 10, K = 5 targets.
REFERENCES
[1] R. S. Daraghma, “The Effect of Radar Cross Section and Speed of Target on the Detection of MIMO Radar,” SPACOMM 2018, The Tenth International Confernce on Advances in Satellite and Space Communications, pp. 38-42.
[2] M. A. Richards, Fundamentals of Radar Signal Processing, McGraw-Hill, 2005.
[3] J. Li, P. Stoica, “MIMO Radar Signal Processing,” Wiley, 2009
[4] E. Fishler, A. Haimovich, R. Blum, L. J. Cimini, D. Chizhik, and R. Valenzuela, “Spatial Diversity in Radars – Models and Detection Performance,” IEEE Transactions on Signal Processing, vol. 54, no. 3, pp. 823-838, Mar. 2006.
[5] G. R. Curry, Radar System Performance Modeling, 2nd ed. Norwood, MA; Artech House, 2005.
[6] M. I. Skolnik, Introduction to Radar Systems, 3rd ed. New York; McGraw-Hill, 2001.
[7] D. W. Bliss and K. W. Forsythe, “Multiple-input multiple-output (MIMO) radar and imaging: degrees of freedom and resolution,” in Proc. of the 37th Asilomar Conference. Signals, Systems, and Computer, Pacific Grove, CA, Nov. 2003, vol. 1, pp. 4-59.
[8] F. C. R obey, S. Coutts, D. Weikle, J. C. McHarg, and K. Cuomo, “MIMO radar theory and experimental results,” in Proc. Thirt-Eighth Asilomar Conference. Signals, Systems, and Computer, 7-10 Nov. 2004, Pacific Grove, CA, USA, vol. 1, pp. 300-304.
[9] E. Fishleret al, “MIMO radar: an idea whose time has come,” in Proceedings of the IEEE Radar Conference, pp. 71-78, Philadelphia, Pa, USA, April 2004.
[10] J. Capo, “High-resolution frequency- wave number spectrum analysis,” Proceedings of the IEEE, 57(8): 1408 1418, 1969. doi:10.1109/PROC. 1969.7278.
[11] A. Haimovich, R . Blum, and L. Cimini, “MIMO Radar with Widely Separated Antenna,” IEEE Signal Processing Magazine, pp. 116-129, January 2016.
[12] Q. He, R. Blum, H. Godrich, A. Haimovic, “Target Velocity Estimation and Antenna Placement for MIMO Radar with Widely Separated Antennas,” IEEE Journal of Selected Topics in Signal Processing, pp. 79-100, vol. 4, no. 1, February 2010.
[13] M. Rossi, A. Haimovich, Y. Eldar, “Spatial Compressive Sensing for MIMO Radar,” IEEE Transaction on Signal Processing, vol. 62, no. 2, pp. 419-430, January 2014.
[14] R. O. Schmidt, “Multiple emitter location and signal parameter estimation,” IEEE Transactions on Antennas and Propagation, ISSN 0018-926X, 34(3), pp. 276-280.
[15] A. Cichocki, D. Mandic, A-H. Phan, C. Caiafa, G. Zhou, Q. Zhao, and L. De Lathauwer, “Tensor decompositions for signal Processing applications from two-way to multiway component analysis,” arXiv: 1403.4462, DOI: 10.1109/MSP. 2013.2297439. vol. 32, pp. 145-463, 2014
[16] C. Y. Chen and P.P. Vaidyanathan, “MIMO radar space-time adaptive processing using prolate spheroid wave function,” IEEE Transaction on Signal Processing, vol. 56, no. 2, pp. 623-635.
[17] H. Yan, J. Li, and G. Liao, “Multitarget identification and localization using bistatic MIMO radar systems,” EURASIP J. Adv. In Signal Process. pp. 77-78, 2008.
[18] D. Nion and N. D. Sidiropoulos, “A PARAFAC- based technique for detection and localization of multiple targets in a MIMO radar system,” in Proc. IEEE Int. Conf. Acoust., Speech Signal Process. (ICASSP). pp. 2077-2080, 2009.

125
International Journal on Advances in Telecommunications, vol 11 no 3 & 4, year 2018, http://www.iariajournals.org/telecommunications/
2018, © Copyright by authors, Published under agreement with IARIA - www.iaria.org
Design of On-Chip GaN Transmitter for Wireless Communication
Rajinikanth Yella
Department of Electrical EngineeringNational Chiao Tung University
Daxue Road, Hsinchu City, TaiwanEmail: [email protected]
Krishna Pande and Ke Horng Chen
Department of Electrical EngineeringNational Chiao Tung University
Daxue Road, Hsinchu City, TaiwanEmail: [email protected]
Email: [email protected]
Edward Chang
International College ofSemiconductor Technology
National Chiao Tung UniversityDaxue Road, Hsinchu City, TaiwanEmail: [email protected]
Abstract— 5G standard is targeting much higher data ratesas compared to existing wireless technologies to accommodatethe ever-increasing demand for faster wireless applications. Atransmitter is required to implement a 5G system. In thispaper, we are presenting a 28 GHz novel monolithic transmitterarchitecture on GaN substrate that offers size, weight, area,power, and cost advantages. The transmitter contains a Yagiantenna, which consists of three directors, two drivers, a stripline feed, a substrate, and a ground plane. Optimization isobtained by modifying components design parameters. Accordingto simulation results, the designed Yagi antenna has a compactsize, and low loss at the selected frequency of 28 GHz. Atthis frequency, its return loss, gain, and beam width are -38 dB, 8.69 dB, and 57.2 degrees, respectively. The secondcomponent in the monolithic chain is a bandpass filter, whichoffers enhanced selectivity and stopband suppression on GaNsubstrate. The Bandpass filter has a minimum insertion loss of0.6 dB at 28 GHz. The rejection level is higher than 10 dB inthe stop band. Further, a collaborative simulation of 28 GHzmixer for upconversion with CLASS-E power amplifier with theintegrated octature structure to achieve robust load insensitivityis presented. In this paper, to design high-efficiency PA, weimplemented harmonic load pull at both the input and output ofthe active device to obtain optimum impedances at fundamentaland second-harmonic frequencies. After an iterative process, theoptimum input and output impedances are obtained. In addition,we also implemented a cascaded octature power cell structure.The proposed balanced PA achieves a saturated output power of13.5 dBm and a maximum Power Added Efficiency of 55 %. Itconsumes 210 mW power. Each power cell is based on class-E.The circuit is implemented using GaN HEMT transistor takingan advantage of its high frequency and high power performance.The presented transmitter configuration is designed at 28 GHzfor 5G Application on a GaN substrate with a thickness of 0.8mm, a permittivity of 9.7, and loss tangent of 0.025.
Keywords–Yagi antenna; Filter; Mixer; Power amplifier; 5G.
I. INTRODUCTION
Fifth generation wireless network (5G) has become re-search focus since it could support the explosive growthof data traffic, massively interconnected devices, and newapplications. It is expected that 5G will utilize spectrum atmillimeter wave (mmw) frequencies to satisfy the demand formassive bandwidth since the spectrum resources in the lowerfrequency bands are running out. mmw frequency is attractivebecause of the rich spectrum resources and advantages of size,weight, and power. Further, there are several motivations touse mmw frequencies in radio links such as availability of
wider bandwidth, relatively narrow beam widths, better spatialresolution and small wavelength allowing modest size antennasto have a small beam width. Resources have been invested todevelop prototype millimeter wave 5G mobile communicationsystems, especially for frequency band such as 28 GHz [1].Therefore, 27.5 to the 29.5 GHz band is a strong candidatefor the new 5G radio interface and much of the researchundertaken to date has considered this band. For example,Samsung Electronics has built a prototype system includingbeamforming antenna that works at 28 GHz [2][3]. However,to our knowledge single chip transmitter on gallium nitride(GaN) does not exist for the 5G application.
An overview of the architecture and components for ourtransmitter module on a GaN chip is shown in Fig. 1. TheIntegrated chip consists of a chain of various individualcomponents such as yagi antenna, power amplifier, bandpassfilter, upconverter, mixer and matching circuitry. The presentedtransmitter configuration is designed on a GaN substrate witha thickness of 0.8 mm, a permittivity (Er) of 9.7, and losstangent (TanD) of 0.025. The goal is to ultimately fabricatethe proposed transmitter module on GaN substrate.
The Yagi antenna is designed using High-Frequency Struc-ture Simulator (HFSS) simulation software. Rest of the blocksof the transmitter, bandpass filter (BPF), Mixer, Power am-plifier (PA), and matching network circuitry are designedusing Advanced Design System (ADS) simulation software.The proposed transmitter design and results are mentioned inSection II and concluded in Section III.
II. DESIGN AND RESULT & DISCUSSION OFTRANSMITTER MODULE ON GAN CHIP
Designing of the transmitter blocks are mentioned here.
A. Yagi Antenna
Yagi antenna was proposed by researchers from Japan[4][5] usually for radio application [6]. Such antenna wasdeveloped for X-band, Ku-band, and K-band, etc. Generally, adesign of Yagi antenna places a driver and director’s elementson one side of a printed circuit board (PCB) and places areflector on the reverse side. A driver is utilized for radiatingelectromagnetic wave whilst directors and a reflector is utilizedto focus the electromagnetic wave radiation from its driver.But, the design of Yagi antenna is more challenging if it isbeing designed at 28 GHz on GaN substrate instead of PCB.

126
International Journal on Advances in Telecommunications, vol 11 no 3 & 4, year 2018, http://www.iariajournals.org/telecommunications/
2018, © Copyright by authors, Published under agreement with IARIA - www.iaria.org
Figure 1. Transmitter architecture for 5G application
(a)
(b)
(c)
Figure 2. (a) 3D view of Antenna in HFSS (b) Dimensions of yagigudaantenna (c) Bottom view of yagiguda antenna
In this paper, we present the design of novel structure Yagiantenna, which shows good radiation efficiency and gain. The
design of the proposed Yagi antenna is shown in Fig. 2. It iscomposed of three directors, two drivers, a strip line for feedand a reflector. This antenna can be configured in multipleinput and multiple output (MIMO) formats if needed. Theantenna is made from gold with a thickness of 0.035 mm andelectric conductivity of 4.1 x 10⁷ Siemens/m considering GaNas substrate.
In order to match antenna impedance with another device,the impedance was optimized for 50 Ω. To fulfill such require-ment, its feed- width was set to be 1.8 mm. Details of theYagi antenna design parameters that showed best performanceis shown in Table I.
TABLE I. DIMENSIONS OF PROPOSED ANTENNA
L1 L2 L3 L4 L5 L6 L7 L8 L9 g1.8 0.9 2.5 1.2 2 0.8 0.5 0.3 2 0.1W1 W2 W3 W4 W5 W6 W7 W8 W91.5 0.7 0.5 1.5 0.5 1.5 1.8 2.5 0.3
Fig. 3a shows simulated return loss of -38 dB for 27.4GHz to 28.4 GHz with a center frequency of 28 GHz. Fig. 3bshows simulated radiation pattern, which is unidirectional withthe main lobe at 342 degrees. At its main lobe, the gain is 8.69dB. Its beam width is 57.2 degree, which its half power beamwidth occurring at -26.44 degree and 30.7 degrees. The frontto back ratio of the antenna is nearly 17.4 dB. The antenna 3Dradiation pattern and voltage standing wave ratio (VSWR) areshown in Fig. 3c and Fig. 3d, respectively. Usually for a goodantenna VSWR should be below 2. Our simulation shows thatduring the passband frequency antennas VSWR is below 1.8.The simulated results of the antenna are listed in Table II.
TABLE II. ANTENNA RESULTS
Content UnitsAntenna type Yagi gudaAntenna array size (L*W) mm*mm 8*12Peak Directivity dB 8.9Antenna bandwidth GHz 27.4-28.4Radiated power W 0.8Accepted power W 0.9Radiation Efficiency At 28 GHz % 96VSWR At 28 GHz <1GaN substrate detailsAssumed during simulation Thickness mm 0.8
Er 9.7Tan D 0
A comparison of performances of proposed work antennawith previously published works is highlighted in Table III.

127
International Journal on Advances in Telecommunications, vol 11 no 3 & 4, year 2018, http://www.iariajournals.org/telecommunications/
2018, © Copyright by authors, Published under agreement with IARIA - www.iaria.org
(a)
(b) (c)
(d)
Figure 3. (a) S11 response or return loss of antenna (b) Radiation pttern of antenna (c) 3D gain of antenn (d) VSWR of the antenna

128
International Journal on Advances in Telecommunications, vol 11 no 3 & 4, year 2018, http://www.iariajournals.org/telecommunications/
2018, © Copyright by authors, Published under agreement with IARIA - www.iaria.org
TABLE III. DESIGN SPECIFICATION COMPARISON OF PROPOSED WORK AND PREVIOUSLY PUBLISHED WORKS
Key Parameter Contents Units Proposed Published
Year 2018 [7]2017
[8]2017
[9]2018
Antenna
Bandwidth GHz 27.4-28.4 26.43 to 29.32 27.93 to 28.33 27.9 and 28.5S11 dB -40 -35 -14 -22Gain dB 8.69 12.5 2.03 4.5Efficiency % 96 68 73.4 50
TABLE IV. DESIGN SPECIFICATION COMPARISON OF PROPOSED WORK AND PREVIOUSLY PUBLISHED WORKS
Key parameter Contents Units Proposed Published
Band Pass Filter
Year 2018 [10]2016
[11]2015
[12]2015
Bandwidth GHz 27.6 to 29.2 58 to 62 38 to 42 21.4 to 38.9S11 dB -40 -20 -40 -30S21 dB 0.6 0.008 0.97 1
Return loss and efficiency of antenna are better than recentlypublished works.
B. Bandpass Filter Design
Filters are an essential part of wireless communicationssystems as they are required to suppress undesired signals inthe transceiver pass-band. The size, weight, cost, and loss ofsuch filters must be kept as low as possible. Currently, separatefilters (low pass, band pass, and high pass) are used to suppressunwanted signals depending upon system requirements andthey are designed and integrated separately. Hence, there is acritical need for a multifunction filter, which can be integratedon-chip to support multiband operation [13] of a transceiver.
Figure 4. Band pass filter structure with dimensions
In this paper, the design of a core circuit using a microstripline has been conceived and designed as shown in Fig. 4. Smallsize, low cost, and good performance multifunction filters arethe with high selectivity and good stopband performancesare extensively studied [14]. On the other hand, the GaNsubstrate has attractive characteristics, such as wide frequencyrange, static dielectric constant, low thermal expansion co-efficient and very low water absorption [15]. Moreover, thecombination of excellent electrical performance, multilayerintegration capabilities and low cost makes GaN extremelyattractive for designing radio frequency (RF) circuits withhigh integration [15]. In this paper, a bandpass filter based onbroadside coupling H-shape resonators and a half wavelength
resonators are implemented on two-layer GaN substrate, whichhas relatively small sizes and good selectivity.
The dimensions of the BPF filter are listed in Table V.
TABLE V. BPF DIMENSIONS
L1 L2 L3 L4 L5 L6 L7 L8 L9 g8.8 13.5 5 6 2 5 4 5 6.5 0.5W1 W2 W3 W4 W5 W6 W7 W8 W93 2.2 3.5 1.5 1 1 0.6 3.5 0.1
Fig. 5 shows the simulated results of the designed bandpassfilter. The 3 dB bandwidth is from 27.6 GHz to 29.2 GHz. Thisfilter has a minimum insertion loss of 0.6 dB at 28 GHz. Therejection level is higher than 10 dB in the stop band. The returnloss of bandpass filter is more than -40 dB at 28 GHz.
Figure 5. S11 response of antenna
A comparison of performances of proposed work BPF withpreviously published works is highlighted in Table IV. Returnloss is better than recently published works.
C. Impedance Matching NetworkAt 28 GHz frequency, the reflected power occurs when the
load impedance is not matched to the characteristic impedanceof source (mixer) and load (PA). Impedance matching using thepassive network is critical in the design of microwave circuitsto achieve maximum power transfer, minimum reflection, andadequate harmonic rejection. Traditionally spiral inductors are
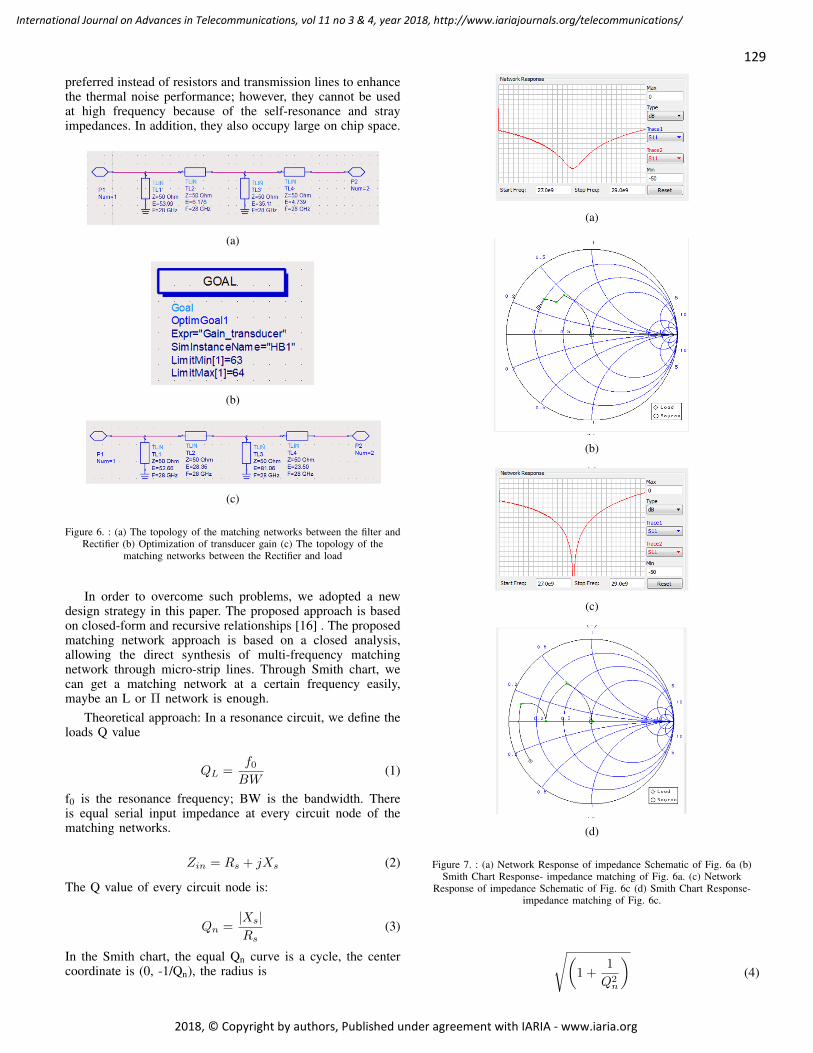
129
International Journal on Advances in Telecommunications, vol 11 no 3 & 4, year 2018, http://www.iariajournals.org/telecommunications/
2018, © Copyright by authors, Published under agreement with IARIA - www.iaria.org
preferred instead of resistors and transmission lines to enhancethe thermal noise performance; however, they cannot be usedat high frequency because of the self-resonance and strayimpedances. In addition, they also occupy large on chip space.
(a)
(b)
(c)
Figure 6. : (a) The topology of the matching networks between the filter andRectifier (b) Optimization of transducer gain (c) The topology of the
matching networks between the Rectifier and load
In order to overcome such problems, we adopted a newdesign strategy in this paper. The proposed approach is basedon closed-form and recursive relationships [16] . The proposedmatching network approach is based on a closed analysis,allowing the direct synthesis of multi-frequency matchingnetwork through micro-strip lines. Through Smith chart, wecan get a matching network at a certain frequency easily,maybe an L or Π network is enough.
Theoretical approach: In a resonance circuit, we define theloads Q value
QL =f0BW
(1)
f0 is the resonance frequency; BW is the bandwidth. Thereis equal serial input impedance at every circuit node of thematching networks.
Zin = Rs + jXs (2)
The Q value of every circuit node is:
Qn =|Xs|Rs
(3)
In the Smith chart, the equal Qn curve is a cycle, the centercoordinate is (0, -1/Qn), the radius is
(a)
(b)
(c)
(d)
Figure 7. : (a) Network Response of impedance Schematic of Fig. 6a (b)Smith Chart Response- impedance matching of Fig. 6a. (c) Network
Response of impedance Schematic of Fig. 6c (d) Smith Chart Response-impedance matching of Fig. 6c.
√(1 +
1
Q2n
)(4)

130
International Journal on Advances in Telecommunications, vol 11 no 3 & 4, year 2018, http://www.iariajournals.org/telecommunications/
2018, © Copyright by authors, Published under agreement with IARIA - www.iaria.org
The value of QL is decided by the value of Qn. Therefore, inorder to increase the bandwidth, we should reduce the valueof Qn. While the least Qn is the maximum of the source andload impedances Q value. When utilizing the Smith chart todesign matching networks at the center frequency, the the nextsteps should be followed:
1) Find out the output impedance Zout of the previousstage transistor and the input impedance Zin of nextstage transistor.
2) Find out the points of Zout, Zin in the Smith chart.3) Describe the maximum equal Q curve Qmax from the
points of Zou, Zin.4) In the extension of the Smith chart constructed by
Qmax, add appropriate micro strips and capacitancesto make Zout and Zin conjugate match.
Then consider the network composed of microstrips as theinitial matching network. We designed such matching networkusing ADS. This network is designed to operate at 28 GHzfrequency with the normalized impedance of 50 Ω. Where ZSis antenna output impedance, ZL is Filter input impedance.
We calculated the stub values mentioned in Fig. 6 usingADS. Fig. 6 shows the objective function to optimize the wholematching networks. During 27 GHz to 29 GHz, the maximumtransducer gain limit to 64 dB and the minimum transducergain is 63 dB. As a result, we can get a good transducer curve,whose flatness is less than 0.2 dB at the desired frequency of28 GHz.
Traditionally Network Response is calculated to check lossvalue of circuit. So, we plotted S11 to find the loss of thenetwork schematic, the S11 value at 28 GHz is lower than-10 dB. To investigate circuit stability and perfect match weplotted impedance (Fig. 7) on Smith chart as shown in Fig. 7.
D. Mixer DesignTransmit Signal coming from baseband is almost at direct
current (DC), hence it must be upconverted to high frequencyat which the antenna is working. In order to do that signalmust be up-converted using mmw mixer. Doubly-balancedMixers (DBM) are usually the desirable mixer because oftheir superior suppression of spurious mixing products andgood port-to-port isolation [2]. The mixers based on the ringor star configurations balun were used widely, but most ofthem are designed for narrow-band only. An ultra-widebandbalanced microstrip balun was reported [17][18], but this typeof balun was difficult to fabricate. A 28 GHz mixer based onthe Marchand balun was fabricated in 0.15m GaAs PHEMTtechnology, similar to our proposed design in GaN technology.
In this paper, a 28 GHz doubly-balance mixer based on the[19] Marchand balun in the 27 GHz to 30 GHz RF/LO rangeand DC to 5 GHz IF is presented. The collaborative simulationof HFSS and ADS has been adopted in mixer design, the balunin LO port and RF port are simulated by the full-wave theelectromagnetic simulator in HFSS, then the S parameter dataof the balun are exported to the mixer circuit in ADS. Themixer offers about 10 dB typical conversion loss, high gaincompression, higher than 20 dB LO-to-RF isolations and about10 dB return loss across 27 GHz to 30 GHz.
1) The Balun Design: The balun was simulated by usingAnsoft HFSS and Agilent ADS. The Marchand balun wascompensated by two open-circuited stubs at the output ports,
the coupled line model in the circuit initially was used topredict the performance, and then simulated by using the full-wave electromagnetic simulator to improve the accuracy ofthe simulation finally. The 3D structure of the balun used inthe mixer was drawn by HFSS and shown in Fig. 8, whichis designed for GaN substrate with thickness 0.8 mm anddielectric constant 9.7. 1 is the input port and 2 3 are outputports. Impedances of three ports are all set to be 50 Ω andthe microstrip line width is 0.25 mm, and l. w2 and w3 standfor the length the width and the gap width of the microstriplines, the hole is metallization and connected to ground. TheMarchand balun is simulated by optimizing w2 and w3.
Figure 8. Structure of mixers balun
Dimensions of mixers balun are mentioned in Table VI.
TABLE VI. DIMENSIONS OF MIXERS BALUN STRUCTURE
L1 L2 L3 L4 L5 L6 L7 L81.2 1.5 2.5 1.8 1.2 1.2 1.4 1.4W1 W2 W3 W41.2 0.2 0.5 0.3
2) The Mixer Design: Then the terminal S parameter dataof the balun in HFSS are exported to the mixer circuit in ADSin Fig. 9, the three ports network are set up to substitutethe balun. RF port and LO port is power source port, theIF port is load port, all the port is set to 50 Ω. Two goldlines are set to near the real condition, the line is set to 5mm length and the diameter is 0.1 mm.The capacitances areused in LO port to make the minimal frequency of the IFport extend to DC. C1=C2=0.5 pF. The simulated result of themixer circuit conversion gain was obtained using the harmonicbalance method in Fig. 10. The type conversion gain is about9.3 dB.
Figure 9. Double balanced mixer circuit in ADS
Fig.11 shows the results of the conversion loss and theisolation are obtained when the LO power is about 12 dBm

131
International Journal on Advances in Telecommunications, vol 11 no 3 & 4, year 2018, http://www.iariajournals.org/telecommunications/
2018, © Copyright by authors, Published under agreement with IARIA - www.iaria.org
TABLE VII. DESIGN SPECIFICATION COMPARISON OF PROPOSED WORK AND PREVIOUSLY PUBLISHED WORKS
Key Parameter Contents Units Proposed Published
MixerYear 2018 [20]
2013[21]2017
[22]2017
Frequency GHz 28 130 60 2.4Conversion Gain dB 9.3 3 4 10
and IF output is at 400 MHz across the bandwidth from 27GHz to 30 GHz.
Figure 10. Conversion Gain vs available source power
Figure 11. Conversion loss (dB)
A comparison of performances of proposed work Mixerwith previously published works is highlighted in Table VII.Conversion gain of the mixer is better than recently publishedworks.
E. Power Amplifier DesignFor wireless communication systems, power amplifiers
(PAs) with high efficiency is critical as they consume themajority of the power of the systems and closely relatedto the thermal problem. As a result, many categories ofhigh-efficiency PAs have been widely studied in recent years[23][24]. The Class-E amplifier is well known for its high effi-ciency and simple structure. However, the very high breakdownvoltage of three times the dc supply voltage of the transistoris required [25]. Moreover, the inherent output capacitor of atransistor deteriorates the performance of a Class-E amplifierat high frequency. To address the above problems, the Class-E amplifier was designed by modifying the device outputimpedances at odd and even harmonics, so as to shape theoutput voltage and current that minimize the overlap to achieve
high efficiency [26]. However, since the openshort impedanceis derived in the infinite harmonic condition, the matchingnetwork of a Class-E amplifier should be able to tune high-order (beyond third order [27]) harmonics, which make thecircuit implementation more complex.
In this paper, a simple method of designing high-efficiencyPA is presented. Compared with other works, this method iseasier to design harmonic tuned PA and thus achieves relativelyhigh efficiency with fewer harmonics to control. The simulatedresults indicate a high-efficiency Class-E PA is realized with55% PAE and 13.5 dBm output power at 28 GHz.
However, the challenge of the MMW PA design is todeliver maximum output power with a maximum Power AddedEfficiency (PAE) and high linearity [28][29]. For this pur-pose, to achieve high efficiency, we have implemented twotechniques. Technique one is harmonic load pull conductedat both the input and output of the active device to obtainoptimum impedances at fundamental and second-harmonicfrequencies. After an iterative process, the optimum input andoutput impedances are obtained. Technique two is cascadedoctature power cells structure is implemented. The presentedcircuit is implemented in GaN HEMT technology (as shown inFig. 12) taking, the advantage of high-frequency performanceand high power performance [15].
Figure 12. GaN HEMT transistor structure
1) Design Process: The design of each PA commencedwith the selection of the transistor size and bias. Increasingthe total gate width of the selected transistor also increasesthe available RF output power. However, the higher parasiticof the physically larger transistor results in a reduction inavailable gain. The proven design approach to address this is touse multiple power-combined transistors. To achieve the targetoutput power, a total of eight stages were power-combinedin the output stage. This output stage was driven by a pairof devices, and this, in turn, was driven by an input stagerealized using a single transistor. The transistor sizes in eachstage needed to be identical, and the basic power-combiningtopology needed to be similar.
The individual PA structure is shown in Fig. 13 is com-posed of three series transmission lines with one parallel open-circuit stub located between the first two lines are used asthe impedance matching circuit, which is a simplified methodof the distributed multi-frequency matching approach, as in-

132
International Journal on Advances in Telecommunications, vol 11 no 3 & 4, year 2018, http://www.iariajournals.org/telecommunications/
2018, © Copyright by authors, Published under agreement with IARIA - www.iaria.org
Figure 13. Single stage PA design
Figure 14. Octature structure PA design
troduced previously [30]. The single transmission line beforethe open stub is used to tune the impedance of the secondharmonic, while the two series transmission lines after the openstub are used to tune the impedance of the fundamental mode.Therefore, optimum impedance control at fundamental andsecond-harmonic frequencies can be realized simultaneously.
Figure 15. Transducer power gain of PA for single stage
Figure 16. Power added efficiency of PA
Fig. 15 shows the simulated power gain plots of the PA.The PA response is clearly evident at the 28 GHz band inblue. The amplifier shows good input and output return lossin each band and has a small signal gain of 13.5 dB. Thesimulated large-signal performance is plotted in Fig. 16 and 17.As with the small-signal case, the performance of the amplifieroperating in the 28 GHz band is plotted in red. Power addedefficiency is around 55 %. The balanced topology offers avery good VSWR robustness. DC power consumption of PAis plotted in Fig. 18; our PA consumes 210 milli watts at 28GHz.
Figure 17. input and output waveforms of PA
A comparison of performances of proposed work poweramplifier with previously published works is highlighted inTable VIII. Power efficiency of the power amplifier is better
Figure 18. DC Power consumption, milli-watts

133
International Journal on Advances in Telecommunications, vol 11 no 3 & 4, year 2018, http://www.iariajournals.org/telecommunications/
2018, © Copyright by authors, Published under agreement with IARIA - www.iaria.org
TABLE VIII. DESIGN SPECIFICATION COMPARISON OF PROPOSED WORK AND PREVIOUSLY PUBLISHED WORKS
Key Parameter Contents Units Proposed Published
Power Amplifieryear 2018 [31]
2018[32]2017
[33]2017
Frequency GHz 28 28 29-57 37-40Efficiency % 55 40 24.2 28
than recently published works.
F. End to End Module PerformanceTo investigate the loss of proposed the transmitter archi-
tecture, we have simulated S11 of transmitter module chain(with Yagi antenna, bandpass filter, mixer, matching networkand power amplifier) in ADS. The results are shown in Fig. 19.We plotted S11 to find the loss of the whole module and theS11 value at 28 GHz is lower than -30 dB, which is excellent.
Figure 19. Simulated transmitter architecture end to end S11 response
III. CONCLUSION
The design of a novel transmitter module on a single achip using GaN/Si as the substrate is presented in this paper.The transmitter module consists of Yagi antenna, bandpassfilter, impedance matching network, upconversion mixer, andpower amplifier. We investigated innovative designs for thetransmitter components with potential for integration on a GaNsubstrate. To validate our designs, we selected 28 GHz butmodule design can be easily scaled to higher millimeter wavefrequencies such as 60 GHz for the 5G system. Designedtransmitter module shows loss of less than -10 dB at 28 GHz,which can be further improved with design refinement. Toour knowledge, this is first reported the design of monolithictransmitter module on GaN chip. Our proposed module willoffer significant SWAP-C advantages.
ACKNOWLEDGMENT
We are thankful to our National Chiao Tung University,Taiwan for providing the facilities to carry out our research.The project work, described in this paper, is intended for thesisfor student Yella who is also grateful to colleagues in EE Dept.
REFERENCES
[1] R. Yella, K. Pande, K. H. Chen, and E. Chang, “28 GHzMonolithic Transmitter on GaN chip for 5G application,” inThe Tenth International Conference on Advances in Satellite andSpace Communications SPACOMM, Apr. 2018, pp. 17–22. [Online].Available: https://www.thinkmind.org/
[2] K. Taeyoung, P. Jeongho, S. J. Yun, J. Suryong, C.Jaeweon, and R. Wonil, “Tens of Gbps support with mmWavebeamforming systems for next-generation communications,” in2013 IEEE Global Communications Conference (GLOBECOM).IEEE, Dec. 2013, pp. 3685–3690. [Online]. Available:http://ieeexplore.ieee.org/document/6831646/
[3] Y. Azar, G. N. Wong, K. Wang, R. Mayzus, J. K. Schulz, H. Zhao,F. Gutierrez, D. Hwang, and T. S. Rappaport, “28 GHz propagationmeasurements for outdoor cellular communications using steerablebeam antennas in New York City,” in 2013 IEEE InternationalConference on Communications (ICC). IEEE, Jun. 2013, pp. 5143–5147. [Online]. Available: http://ieeexplore.ieee.org/document/6655399/
[4] S. Uda, “High Angle Radiation of Short Electric Waves,” Proceedingsof the IRE, vol. 15, no. 5, May. 1927, pp. 377–385. [Online].Available: http://ieeexplore.ieee.org/document/1669795/
[5] H. Yagi, “Beam Transmission of Ultra Short Waves,” Proceedings ofthe IRE, vol. 16, no. 6, Jun. 1928, pp. 715–740. [Online]. Available:http://ieeexplore.ieee.org/document/1670051/
[6] G. Sato, “A secret story about the Yagi antenna,” IEEE Antennas andPropagation Magazine, vol. 33, no. 3, Jun. 1991, pp. 7–18. [Online].Available: http://ieeexplore.ieee.org/document/88216/
[7] G. Guo, L. S. Wu, Y. P. Zhang, and J. F. Mao, “Stacked patcharray in LTCC for 28 GHz antenna-in-package applications,” in2017 IEEE Electrical Design of Advanced Packaging and SystemsSymposium (EDAPS). IEEE, Dec. 2017, pp. 1–3. [Online]. Available:http://ieeexplore.ieee.org/document/8277007/
[8] M. C. Tang, T. Shi, and R. W. Ziolkowski, “A 28-GHz, multi-layered,circularly polarized, electrically small, Huygens source antenna,”in 2017 IEEE 5th International Symposium on ElectromagneticCompatibility (EMC-Beijing), no. 2016. IEEE, Oct. 2017, pp. 1–3.[Online]. Available: http://ieeexplore.ieee.org/document/8260491/
[9] Y. Yashchyshyn, K. Derzakowski, G. Bogdan, K. Godziszewski,D. Nyzovets, C. H. Kim, and B. Park, “28 GHz Switched-Beam Antenna Based on S-PIN Diodes for 5G MobileCommunications,” IEEE Antennas and Wireless Propagation Letters,vol. 17, no. 2, Feb. 2018, pp. 225–228. [Online]. Available:http://ieeexplore.ieee.org/document/8171744/
[10] M. M. Harsoori and T. Z. A. Zulkifli, “60 GHz microstrip filter in0.13m RF CMOS technology,” in 2016 IEEE Student Conference onResearch and Development (SCOReD). IEEE, Dec. 2016, pp. 1–4.[Online]. Available: http://ieeexplore.ieee.org/document/7810065/
[11] S. W. Wong and R. Chen, “Millimeter-wave bandpassfilters technologies,” in IET International Radar Conference2015, vol. 1, no. c. An Institution of Engineering andTechnology, 2015, pp. 5 .–5 . [Online]. Available: http://digital-library.theiet.org/content/conferences/10.1049/cp.2015.1195
[12] F. Fan, Z. Yan, J. Wang, and X. Song, “Ka band-pass filterbased on the microstrip-groove gap waveguide technology,” in IETInternational Radar Conference 2015. An Institution of Engineeringand Technology, 2015, pp. 1–4. [Online]. Available: http://digital-library.theiet.org/content/conferences/10.1049/cp.2015.1247
[13] M. Jiang and W. Hong, “An approach for improving the transition-band characteristic of a stepped-impedance low-pass filter,” in2012 International Conference on Microwave and Millimeter WaveTechnology (ICMMT), vol. 2. IEEE, May. 2012, pp. 1–4. [Online].Available: http://ieeexplore.ieee.org/document/6230042/
[14] D. Liu, U. Pfeiffer, J. Grzyb, and B. Gaucher, Advanced Millimeter-wave Technologies. John Wiley and Sons, 2009.
[15] M. N. Ruiz, D. Vegas, J. R. Perez-Cisneros, and J. A. Garcia,“GaN HEMT class-E rectifier for DC+AC power recovery,”in 2017 IEEE MTT-S International Microwave Symposium

134
International Journal on Advances in Telecommunications, vol 11 no 3 & 4, year 2018, http://www.iariajournals.org/telecommunications/
2018, © Copyright by authors, Published under agreement with IARIA - www.iaria.org
(IMS). IEEE, Jun. 2017, pp. 318–321. [Online]. Available:http://ieeexplore.ieee.org/document/8059108/
[16] R. Giofre, P. Colantonio, F. Giannini, and L. Piazzon, “A new designstrategy for multi frequencies passive matching networks,” in 2007European Microwave Conference, no. October. IEEE, 2007, pp. 838–841. [Online]. Available: http://ieeexplore.ieee.org/document/4405323/
[17] K. Vinayagamoorthy, “Design and implementation of wideband balunsfor archimedean spiral antennnas,” Ph.D. dissertation, Queensland Uni-versiy of Technology, 2011.
[18] H. Wang, B. Yan, Z. Wang, and R. Xu, “A Broadband and MicrowaveGain Equalizer,” Progress In Electromagnetics Research Letters, vol. 33,2012, pp. 63–72.
[19] J. C. Jeong, I. B. Yom, and K. W. Yeom, “An Active IF Balun fora Doubly Balanced Resistive Mixer,” IEEE Microwave and WirelessComponents Letters, vol. 19, no. 4, Apr. 2009, pp. 224–226. [Online].Available: http://ieeexplore.ieee.org/document/4804638/
[20] D. Parveg, M. Varonen, M. Karkkainen, and K. A. I. Halonen, “Designof mixers for a 130-GHz transceiver in 28-nm CMOS,” in Proceedingsof the 2013 9th Conference on Ph.D. Research in Microelectronicsand Electronics (PRIME). IEEE, Jun. 2013, pp. 77–80. [Online].Available: http://ieeexplore.ieee.org/document/6603100/
[21] C. Xie, K. Ma, S. Mou, and F. Meng, “A 5062 GHz compactsubharmonic passive mixer MMIC with low conversion loss,” in 2017Progress in Electromagnetics Research Symposium - Fall (PIERS- FALL). IEEE, Nov. 2017, pp. 490–495. [Online]. Available:http://ieeexplore.ieee.org/document/8293188/
[22] P. N. Shasidharan, H. Ramiah, and J. Rajendran, “IntegratedClass C-VCO Mixer for 2.45 GHz transmitter in 180nmCMOS technology,” in 2017 IEEE Asia Pacific Conferenceon Postgraduate Research in Microelectronics and Electronics(PrimeAsia). IEEE, Oct. 2017, pp. 73–76. [Online]. Available:http://ieeexplore.ieee.org/document/8280367/
[23] M. R. Ghajar and S. Boumaiza, “High-efficiency GaN class E amplifierfor polar transmitter,” in 2009 3rd International Conference on Signals,Circuits and Systems (SCS). IEEE, Nov. 2009, pp. 1–4. [Online].Available: http://ieeexplore.ieee.org/document/5412570/
[24] A. Sarkar and B. Floyd, “A 28-GHz class-J Power Amplifier with18-dBm output power and 35% peak PAE in 120-nm SiGe BiCMOS,”in 2014 IEEE 14th Topical Meeting on Silicon Monolithic IntegratedCircuits in Rf Systems. IEEE, Jan. 2014, pp. 71–73. [Online].Available: http://ieeexplore.ieee.org/document/6828532/
[25] A. Chakrabarti and H. Krishnaswamy, “High power, high efficiencystacked mmWave Class-E-like power amplifiers in 45nm SOICMOS,” in Proceedings of the IEEE 2012 Custom IntegratedCircuits Conference. IEEE, Sep. 2012, pp. 1–4. [Online]. Available:http://ieeexplore.ieee.org/document/6330562/
[26] K. Chen and D. Peroulis, “A 3.1-GHz Class-F Power AmplifierWith 82% Power-Added-Efficiency,” IEEE Microwave and WirelessComponents Letters, vol. 23, no. 8, Aug. 2013, pp. 436–438. [Online].Available: http://ieeexplore.ieee.org/document/6560448/
[27] K. Kuroda, R. Ishikawa, and K. Honjo, “Parasitic CompensationDesign Technique for a C-Band GaN HEMT Class-F Amplifier,”IEEE Transactions on Microwave Theory and Techniques,vol. 58, no. 11, Nov. 2010, pp. 2741–2750. [Online]. Available:http://ieeexplore.ieee.org/document/5604338/
[28] S. Shakib, H. C. Park, J. Dunworth, V. Aparin, and K. Entesari, “20.6A 28GHz efficient linear power amplifier for 5G phased arrays in28nm bulk CMOS,” in 2016 IEEE International Solid-State CircuitsConference (ISSCC), vol. 59. IEEE, Jan. 2016, pp. 352–353. [Online].Available: http://ieeexplore.ieee.org/document/7418052/
[29] S. N. Ali, P. Agarwal, L. Renaud, R. Molavi, S. Mirabbasi, P.P. Pande, and D. Heo, “A 40% PAE Frequency-ReconfigurableCMOS Power Amplifier With Tunable GateDrain Neutralizationfor 28-GHz 5G Radios,” IEEE Transactions on MicrowaveTheory and Techniques, vol. 66, no. 5, May. 2018, pp. 2231–2245. [Online]. Available: http://ieeexplore.ieee.org/document/8294260/https://ieeexplore.ieee.org/document/8294260/
[30] P. Saad, P. Colantonio, L. Piazzon, F. Giannini, K. Andersson, and C.Fager, “Design of a Concurrent Dual-Band 1.82.4-GHz GaN-HEMTDoherty Power Amplifier,” IEEE Transactions on Microwave Theory
and Techniques, vol. 60, no. 6, Jun. 2012, pp. 1840–1849. [Online].Available: http://ieeexplore.ieee.org/document/6176279/
[31] S. N. Ali, P. Agarwal, L. Renaud, R. Molavi, S. Mirabbasi, P.P. Pande, and D. Heo, “A 40% PAE Frequency-ReconfigurableCMOS Power Amplifier With Tunable GateDrain Neutralizationfor 28-GHz 5G Radios,” IEEE Transactions on MicrowaveTheory and Techniques, vol. 66, no. 5, May. 2018, pp. 2231–2245. [Online]. Available: http://ieeexplore.ieee.org/document/8294260/https://ieeexplore.ieee.org/document/8294260/
[32] M. Vigilante and P. Reynaert, “A Wideband Class-AB Power Amplifier With 2957-GHz AMPM Compensationin 0.9-V 28-nm Bulk CMOS,” IEEE Journal of Solid-State Circuits, vol. 53, no. 5, May. 2018, pp. 1288–1301. [Online]. Available: http://ieeexplore.ieee.org/document/8227000/https://ieeexplore.ieee.org/document/8227000/
[33] J. H. Tsai, Y. C. Cheng, C. C. Hung, K. C. Chiang, andW. T. Li, “A 3740 GHz power amplifier for 5G phased arrayapplications using 0.1-µm GaAs pHEMT process,” in 2017 IEEE7th International Conference on Consumer Electronics - Berlin(ICCE-Berlin). IEEE, Sep. 2017, pp. 85–87. [Online]. Available:http://ieeexplore.ieee.org/document/8210597/

135
International Journal on Advances in Telecommunications, vol 11 no 3 & 4, year 2018, http://www.iariajournals.org/telecommunications/
2018, © Copyright by authors, Published under agreement with IARIA - www.iaria.org
Impacts of System Clock Granularity on Performance of
NDN Rate-based Congestion Control
Toshihiko Kato, Kazuki Osada, Ryo Yamamoto, and Satoshi Ohzahata
Graduate School of Informatics and Engineering
University of Electro-Communications
Tokyo, Japan
e-mail: [email protected], [email protected], [email protected], [email protected]
Abstract—Named Data Networking (NDN) is a widely adopted
future Internet architecture that focuses on large scale content
retrieval. The congestion control is one of the hot research
topics in NDN, and the rate-based congestion control method is
considered to be well suited. From the viewpoint of
implementation, however, the rate-based method has an issue
that it requires the fine-grained clock management, which is
hard to implement in off-the-shelf computers. We focused this
issue in our previous paper, and evaluated the performance in
the case that consumers use a coarse-grained clock system. In
this evaluation, we used the Stateful Forwarding as a target,
which is a rate-based method proposed by the group proposing
NDN. The simulation results showed that a coarse-grained
clock system increases congestion. We also proposed a smooth
Interest sending scheme under a coarse-grained clock system,
which relieves congestion. However, our previous paper
discussed only results with limited evaluation conditions, such
as one consumer/producer pair configuration and a relatively
low link speed. In this paper, we revisit the impact of system
clock granularity of the performance of NDN rate based
congestion control with practical evaluation conditions and with
detailed analysis.
Keywords- NDN; Congestion Control; Rate Control; Clock
Management.
I. INTRODUCTION
This paper is an extension of our previous paper [1], which is presented in an IARIA conference.
Resulting from a drastic increase in Internet traffic forecast [2], there are many studies on the future Internet architecture called Information Centric Network (ICN), which is well suited for large scale content retrieval. Named Data Networking (NDN) [3] is a widely adopted platform for the ICN researches. The fundamental concept adopted in NDN is the name of required content, not the address of hosts containing the content. NDN uses two types of packets in all communications: an Interest packet and a Data packet. A user called a consumer that requests a specific content sends an Interest packet containing the content name. A server called a producer that provides the corresponding content data returns a Data packet to the consumer. NDN routers transferring the Data packet cache the packet for future redistribution [4].
The congestion control is one of the hot research topics in NDN [5]. Although it has been a hot topic in TCP, the mechanisms in TCP congestion control are limited to the congestion window management at data senders [6] and the
simple explicit congestion notification at intermediate routers, which is recently introduced [7]. In contrast, various techniques can be introduced to the NDN congestion control. The receiver-driven window-based congestion control approach is similar to that in TCP. In this approach, congestion is detected by timeout [8][9] or the congestion notification [10], and the window for Interest packets are managed heuristically, e.g., through an Additive Increase and Multiplicative Decrease (AIMD) mechanism. In NDN, the rate-based congestion control approach is also studied actively. In this approach, a consumer and routers maintain a rate, in which Interest packets are transmitted contiguously. The rate is determined heuristically by use of congestion notification [11]-[13] or by the explicit rate reporting [14]-[16].
In NDN, the Round-Trip Time (RTT) between an Interest packet and the corresponding Data packet changes largely because of the Data packet caching at routers. The window-based congestion control approach needs to determine a window size corresponding to the delay and bandwidth product, but the delay changes in NDN. Therefore, it is pointed that the window-based approach is not suited to NDN and that the rate-based approach is more appropriate for NDN congestion control.
From the viewpoint of implementation, however, the rate-based congestion control approach has some problems. Since the transmission speed in recent data links becomes high, such as 1 Gbps, the fine-grained clock management is required in the rate-based congestion control. For example, if the Data packet size is 10,000 bits and the link speed is 1 Gbps, the interval of Interest packet transmission is 10 micro seconds (corresponding to 100 MHz) when Interest packets are transmitted in a line speed. If the rate is 0.5 Gbps or 0.3 Gbps, the Interest transmission interval will be 20 micro seconds (50 MHz) or 33.33 micro seconds (30 MHz), respectively. In order to handle these cases, it is supposed that higher precision clock with shorter tick, such as 1 micro second (1 GHz), will be required to control the Interest packet sending timing.
On the other hand, the fine-grained clock management is hard to implement in off-the-shelf computers. TCP implementation uses 200 msec and 500 msec clocks for the delayed acknowledgement and retransmission, respectively [17]. So, it is considered that implementing rate-based mechanism with micro second order clock is extremely hard.
We pointed out this issue and discussed how a coarse-grained clock system influences the NDN rate-based congestion control, in our previous paper [1]. We adopted the Stateful Forwarding [11] as a target system of evaluation,

136
International Journal on Advances in Telecommunications, vol 11 no 3 & 4, year 2018, http://www.iariajournals.org/telecommunications/
2018, © Copyright by authors, Published under agreement with IARIA - www.iaria.org
because it is implemented in ndnSIM [18], which is a widely used network simulator of NDN. Moreover, we proposed a method to send Interest packets more smoothly even in the coarse-grained clock environment.
Although our previous paper gave some level of steady discussions and proposals, it has some problems in terms of the details of performance evaluation. The performance evaluation in our previous paper used a simple network configuration where one pair of consumer and producer connected via two routers using 10 Mbps links. The coarse-grained clock system used 50 msec through 200 msec tick intervals. This means that our previous paper provides only a trivial performance evaluation. In this paper, we revisit the issue of the impact of system clock granularity on the performance of NDN rate-based congestion control, with practical evaluation conditions. We add some evaluations on the maximum depth of token bucket used for rate control [19] in the evaluation described in our previous paper. We also provide some results of performance evaluation using a dumbbell network configuration with 100 Mbps links. The tick interval is 1 msec through 10 msec. Those evaluation results also show that the coarse-grained system clock gives some performance degradation of the rate-based congestion control and the proposed smoothening method improves the performance.
The rest of this paper is organized as follows. Section II explains the related work on NDN congestion control and discusses the system clock management. Section III describes the simulator-based performance evaluation of the Stateful Forwarding over a coarse-grained clock system. Section IV gives our proposal of smooth Interest packet sending even if the coarse-grained clock management is used. Section V provides the performance evaluation results using a dumbbell network configuration. In the end, Section VI concludes this paper.
II. RELATED WORK
A. Related work on NDN congestion control
As described above, the congestion control methods in NDN are categorized as the window-based and the rate-based methods. The Interest Control Protocol (ICP) [8] and the Content Centric TCP (CCTCP) [9] are examples of the traditional TCP like window-based methods, where a consumer sends Interest packets with the limitation of window size, and the window size is changed according to the AIMD mechanism triggered by Data packet reception and congestion detected by timeout. The Chunk-switched Hop Pull Control Protocol (CHoPCoP) [10] is another window-based method. It introduces the explicit congestion notification with random early marking instead of the timeout-based congestion detection, and the Interest sending control is done at a consumer with the window size changing according to the AIMD mechanism. Although the window-based methods are simple, the window size itself may not be optimum when many Data packets are cached in different routers.
On the other hand, the rate-based methods are classified into the non-deterministic scheme, which uses the AIMD mechanism in determining the Interest sending rate, and the
explicit rate notification scheme, in which intermediate routers report the optimum Interest rate to a consumer. The Stateful Forwarding (SF) [11] is an example of the former scheme. SF introduces a negative acknowledgment (NACK) packet, which has a similar packet structure with Interest, as a response to an Interest packet. NACK packets are generated when a router detects congestion. A consumer and a router manage the Interest sending rate locally by AIMD, and it decreases the rate when a NACK packet is received. The Stateful Forwarding with NACK suppressing [12] is a modification of SF. It resolves a problem that SF suffers from excessive rate reduction invoked by continuous NACK packets generated within one congestion event. The Practical Congestion Control (PCON) scheme [13] uses the CoDel active queue management scheme [20], which watches out the delay of packets in sending queues, to detecting congestion. When congestion is detected, a router signals it to consumers and downstream routers by explicitly marking Data packets. In respond to this reporting, the alternative path forwarding or the rate reducing is performed by downstream routers or consumers, respectively.
In contrast with those non-deterministic methods, new methods have emerged that enable routers to report a maximum allowed Interest sending rate. In the Explicit Congestion Notification (ECN) based Interest sending rate control method proposed in [14], a consumer uses a minimum rate among the reported rates from all intermediate routers. In the Hop-By-Hop Interest Shaping (HoBHIS) [15], routers decide the maximum allowed Interest sending rate independently and accordingly shape Interest packet. The maximum allowed rate is also reported to a consumer and this allow a consumer to send Interest packets without invoking congestion. The Multipath-aware ICN Rate-based Congestion Control (MIRCC) [16] introduces a similar per-link Interest shaper at every router and rate reporting to consumer. It takes account of the case that a flow uses multipath transfer. In those methods, the maximum allowed rate is calculated from the parameters including link capacity and utilization, queue size, inflated Interest rate, and average RTT. They are able to control Interest transmission so as to suppress congestion, and as a result they can provide higher throughput compared with other rate-based methods.
B. Discussions on clock management
Although the rate-based congestion control methods are capable to provide better performance than the window-based method, they have implementation issues. In order to control the timing to send Interest packets, timers need to be implemented that expire when Interest packets are sent out. If the link speed is high and there are a lot of content retrieval flows, the timeout values of those timers become small and the timeout timing will be random. In order to implement those timers over off-the-shelf computers, the fine-grained clock mechanism and multiple timers realized by timer interrupt handler are required. However, they will introduce large processing overhead and reduce processing throughput drastically.
In order to avoid this problem, TCP protocol processing uses very rough clock mechanism, as described above. The

137
International Journal on Advances in Telecommunications, vol 11 no 3 & 4, year 2018, http://www.iariajournals.org/telecommunications/
2018, © Copyright by authors, Published under agreement with IARIA - www.iaria.org
Asynchronous Transfer Mode (ATM) [21], a legacy scheme standardized in the framework of broadband integrated services digital network, uses rate-based control for sending ATM cells. However, they do not use clock mechanism but adopt a way that null cells are inserted between user data cells in order to pace user data cell flows.
Yamamoto [22] tackled a similar issue for high speed TCP data transfer. He pointed out that the TCP over Gigabit link requires the rate control as well as the window control but the clock-based rate control provides large processing overhead for terminals. So, he introduced pause packets over Gigabit Ethernet, corresponding to null cells in ATM, that are used only between end nodes and switching hubs. This method can be adopted only over the dedicated link and cannot be applied to the shared media type link like high speed wireless LAN.
Kato and Bandai mentioned a similar issue on the processing overhead of fine-grained clock management for the rate-based congestion control, but they took a method that exploits a hop-by-hop window control [23].
III. FUNDAMENTAL PERFORMANCE EVALUATION WITH
COARSE-GRAINED CLOCK
Based on the discussions in Section II.B, we evaluate how the rate-based NDN congestion control works when the clock granularity is coarse. We adopt SF [11] as a target rate-base scheme because it is implemented by its proposer over ndnSIM version 1.0 [18], which uses C++ as a programming language. This section discusses the fundamental performance evaluation when the clock management becomes coarse-grained.
A. Software implementation
Currently, ndnSIM has several versions; 1.0, and 2.0 through 2.6. Although SF is proposed by the research group who is maintaining ndnSIM, we believe that SF is implemented only in ndnSIM 1.0. Moreover, there are some bugs and problems in ndnSIM 1.0. For evaluating the influence by coarse-grained clock system, we added the followings to the current ndnSIM software. Support of AIMD like rate control
SF mentions the rate control using AIMD as one possible candidate, but ndnSIM does not implement it. So, we implemented it in the module managing Interest and
Data packets (the ForwardingStrategy class) in the following way. The start value of Interest sending rate is given manually. When a router receives a Data packet, it increases the rate by one, under the limitation that it does not exceed the link speed at the outgoing interface. When receiving a NACK packet, it halves the current rate, under the limitation that the minimum value of Interest sending rate is 1 packet/s.
It should be noted that the intermediate routers do not provide a shaping function that transmits Interest packets in a fixed rate. Instead, it provides a policing function that checks whether the Interest sending rate exceeds the limit or not. In order to handle a variable sending rate, the policing is performed by use of a token bucket as described above.
Use of constant bit rate (CBR) type consumer ndnSIM 1.0 provides three types of consumers: rate-
based (the ConsumerCbr class), window-based (the
ConsumerWindow class) and batch-type (the
ConsumerBatches class). We decided to use the
ConsumerCbr class and added the AIMD like rate control on it. This class uses a protected static variable
m_frequency as the Interest sending rate. We changed the variable in the same way described above in the
OnData() and OnNack()methods, which are the methods called when a Data packet and a NACK packet is received, respectively.
Emulation of coarse-grained clock system In NDN, the rate control is implemented in the classes
Consumer and ConsumerCbr; the Consumer class is
the superclass of ConsumerCbr. The sending of Interest
packets with a specific rate is implemented in the
ScheduleNextPacket() method of the
ConsumerCbr class. In this method, the
SendPacket() method of the Consumer class is
invoked periodically, every 1.0/m_frequency seconds.
The SendPacket() method sends one Interest packet actually. We emulated a course-grained clock system in the
Consumer class in the following way (see Figure 1). A clock system with longer tick, such as 100 msec,
is implemented in the Consumer class. It calls itself
periodically with the Schedule() method of the
Simulator class. We also introduced a queue storing Interest packets
temporarily. This queue is implemented using the
list class.
In the SendPacket() method, Interest packets are stored in the queue, instead of being sent actually.
When the longer clock tick is invoked, all the queued Interest packets are transmitted actually.
Specifying bucket maximum depth explicitly In ndnSIM 1.0, a token bucket is implemented in the
LimitsRate class. We introduce a constant which manages the maximum depth of the bucket.
time
1/m_frequency sec
queuing Interest packets
long term clock
sending queued Interest packets
sending queued Interest packets
Figure 1. Implementation scheme of coarse-grained clock system.

138
International Journal on Advances in Telecommunications, vol 11 no 3 & 4, year 2018, http://www.iariajournals.org/telecommunications/
2018, © Copyright by authors, Published under agreement with IARIA - www.iaria.org
B. Performace evaluation with simple network
As a fundamental performance evaluation, we conducted the evaluation described in this section.
(1) Experimental setting The network configuration used in this evaluation is
shown in Figure 2, which is a linear configuration where one consumer (C), two routers (R1 and R2), and one producer (P) are connected via 10 Mbps link with 50 msec propagation delay. The length of a Data packet is 1250 bytes, and the link speed corresponds 1,000 packets/sec. As described above, a consumer and routers maintain a token bucket for policing the Interest packet flow. The arriving Interest packet is thrown into the token bucket conceptually, and, if the depth of the bucket becomes larger than the maximum value, a NACK packet is replied for the Interest packet. In our experiment, the maximum depth is set to 50 packets.
Under these conditions, we evaluated the cases that the coarse-grained clock has 50 msec, 100 msec, and 200 msec tick intervals. In all the evaluation runs, the consumer starts from 200 packets/sec as the Interest sending rate. Each evaluation run takes 10 sec.
Figure 3 shows the time variation of the sequence number contained in the name of requested content. It corresponds to the number of content request in a content retrieval flow. Each value is plotted when the corresponding Interest packet is sent. Figure 4 shows the time variation of the Interest sending rate at the consumer. In this figure, each value is plotted when the consumer receives a Data or NACK packet and it changes the value of Interest sending rate.
The orange lines in Figures 3 and 4 show the results of the original SF implementation. The sequence number is increasing steadily. The Interest sending rate starts from 200 packets/sec and goes to 1,000 packets/sec, the maximum value corresponding to the link speed. These results show that the rate-based congestion control works well.
The gray line in Figures 3 and 4 show the results when the coarse-grained clock system is used and the tick interval is 50 msec. The sequence number is also increasing steadily, but there are several drops in the Interest sending rate. The rate starts from 200 packets/sec and goes to 1,000 packets/sec, but it drops to 500 packets/sec at 3.2 sec. This is triggered by a NACK packet generated locally inside the consumer. That is, the consumer also maintains the token bucket for policing the Interest packet flow. When the Interest sending rate is 1,000 packets/sec and the tick interval is 50 msec, fifty Interest packets are generated in one moment by the application, and rush into the bucket. Since the maximum depth of the bucket is 50 packets, all of them are stored in the bucket and leaked in 1,000 packets/sec (actually they are transmitted to R1 in a line speed). But in some timing, fifty Interest packets are
generated in the situation that there are some packets remaining in the bucket. Then, a NACK packet is generated.
The yellow lines and the black lines in Figures 3 and 4 show the results when the tick interval is 100 msec and 200 msec, respectively. In these cases, the increase of the sequence number is suppressed, and the Interest sending rate is limited up to 600 and 300 packets/sec, respectively. This is because the number of Interest packets transmitted back to back is increasing. These results show that, when the tick interval becomes large in the coarse-grained clock system, the rate-based congestion control does not work correctly.
Table I gives a summary of the results. The Data packet throughput is the total content size transferred during an evaluation run divided by ten seconds. In the case of the fine-grained clock (Original in the table), the throughput is 8.75 Mbps and there are no NACK packets transferred. In the case of the coarse-grained clock with 50 msec tick, the Data packet throughput decreases slightly, because the rate goes to 1,000 packets/sec and there are no contiguous NACK receiving. However, the cases with 100 msec tick and 200 msec tick, the
TABLE I. SUMMARY OF RESULTS WITH COARSE-GRAINED
CLOCK.
Data packet throughput (Mbps)
Number of NACK packets
Original Tick = 50 msec
Tick = 100 msec
Tick = 200 msec
8.75 7.72 3.12 1.50
0 7 20 27
C R1 R2 P
speed: 10Mbpsdelay:
50 msec
10Mbps
50 msec10Mbps
50 msec
Data packet: 1250 Bytes --- 10Mbps => 1000 packets/sec Max. depth of token bucket = 50 packets
Figure 2. Network configuration and conditions in fundamental evaluation.
Figure 3. Time variation of Interest sequence number.
Figure 4. Time variation of Interest sending rate.
0
1000
2000
3000
4000
5000
6000
7000
8000
9000
10000
0 2 4 6 8 10
seq
uen
ce n
um
ber
time (sec)
Fine-grained clock
tick: 50 msec
tick: 100 msec
tick: 200 msec
0
200
400
600
800
1000
1200
0 2 4 6 8 10
Inte
rest
sen
din
g ra
te
(pac
kets
/se
c)
time (sec)
Fine-grained clock Tick: 50 msec
Tick: 100 msec Tick: 200 msec
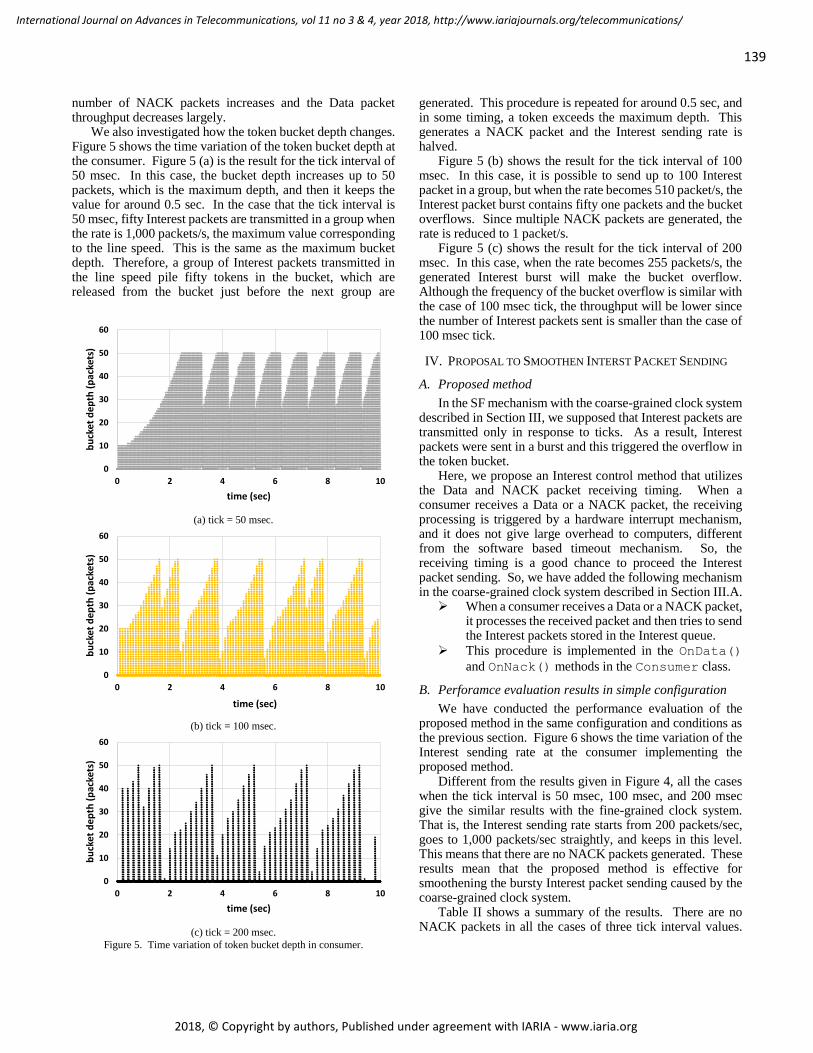
139
International Journal on Advances in Telecommunications, vol 11 no 3 & 4, year 2018, http://www.iariajournals.org/telecommunications/
2018, © Copyright by authors, Published under agreement with IARIA - www.iaria.org
number of NACK packets increases and the Data packet throughput decreases largely.
We also investigated how the token bucket depth changes. Figure 5 shows the time variation of the token bucket depth at the consumer. Figure 5 (a) is the result for the tick interval of 50 msec. In this case, the bucket depth increases up to 50 packets, which is the maximum depth, and then it keeps the value for around 0.5 sec. In the case that the tick interval is 50 msec, fifty Interest packets are transmitted in a group when the rate is 1,000 packets/s, the maximum value corresponding to the line speed. This is the same as the maximum bucket depth. Therefore, a group of Interest packets transmitted in the line speed pile fifty tokens in the bucket, which are released from the bucket just before the next group are
generated. This procedure is repeated for around 0.5 sec, and in some timing, a token exceeds the maximum depth. This generates a NACK packet and the Interest sending rate is halved.
Figure 5 (b) shows the result for the tick interval of 100 msec. In this case, it is possible to send up to 100 Interest packet in a group, but when the rate becomes 510 packet/s, the Interest packet burst contains fifty one packets and the bucket overflows. Since multiple NACK packets are generated, the rate is reduced to 1 packet/s.
Figure 5 (c) shows the result for the tick interval of 200 msec. In this case, when the rate becomes 255 packets/s, the generated Interest burst will make the bucket overflow. Although the frequency of the bucket overflow is similar with the case of 100 msec tick, the throughput will be lower since the number of Interest packets sent is smaller than the case of 100 msec tick.
IV. PROPOSAL TO SMOOTHEN INTERST PACKET SENDING
A. Proposed method
In the SF mechanism with the coarse-grained clock system described in Section III, we supposed that Interest packets are transmitted only in response to ticks. As a result, Interest packets were sent in a burst and this triggered the overflow in the token bucket.
Here, we propose an Interest control method that utilizes the Data and NACK packet receiving timing. When a consumer receives a Data or a NACK packet, the receiving processing is triggered by a hardware interrupt mechanism, and it does not give large overhead to computers, different from the software based timeout mechanism. So, the receiving timing is a good chance to proceed the Interest packet sending. So, we have added the following mechanism in the coarse-grained clock system described in Section III.A.
When a consumer receives a Data or a NACK packet, it processes the received packet and then tries to send the Interest packets stored in the Interest queue.
This procedure is implemented in the OnData()
and OnNack() methods in the Consumer class.
B. Perforamce evaluation results in simple configuration
We have conducted the performance evaluation of the proposed method in the same configuration and conditions as the previous section. Figure 6 shows the time variation of the Interest sending rate at the consumer implementing the proposed method.
Different from the results given in Figure 4, all the cases when the tick interval is 50 msec, 100 msec, and 200 msec give the similar results with the fine-grained clock system. That is, the Interest sending rate starts from 200 packets/sec, goes to 1,000 packets/sec straightly, and keeps in this level. This means that there are no NACK packets generated. These results mean that the proposed method is effective for smoothening the bursty Interest packet sending caused by the coarse-grained clock system.
Table II shows a summary of the results. There are no NACK packets in all the cases of three tick interval values.
(a) tick = 50 msec.
(b) tick = 100 msec.
(c) tick = 200 msec.
Figure 5. Time variation of token bucket depth in consumer.
0
10
20
30
40
50
60
0 2 4 6 8 10
bu
cket
de
pth
(p
acke
ts)
time (sec)
0
10
20
30
40
50
60
0 2 4 6 8 10
bu
cket
de
pth
(p
acke
ts)
time (sec)
0
10
20
30
40
50
60
0 2 4 6 8 10
bu
cket
de
pth
(p
acke
ts)
time (sec)

140
International Journal on Advances in Telecommunications, vol 11 no 3 & 4, year 2018, http://www.iariajournals.org/telecommunications/
2018, © Copyright by authors, Published under agreement with IARIA - www.iaria.org
The Data throughput are also similar for three cases, and the value is close to that of the fine-grained clock based SF.
V. PERFORMANCE EVALUATION WITH REALISTIC
ENVIRONMENTS
The performance evaluation conditions described in Sections III and IV are too simple because of linear network configuration, relatively low link speed and relatively long tick intervals. In this section, we provide the results of performance evaluation in more practical conditions.
A. Evaluation conditions
Figure 7 shows the network configuration used by the performance evaluation described in this section. It is a dumbbell network. Ten consumers (C1 through C10) are connected to router R1, which is connected to another router R2. Ten producers (R1 through R10) are connected to router R2. All the links have the link speed of 100 Mbps and the one way transmission delay of 50 msec. The size of a Data packet is 1,250 bytes, i.e. 1Kbit. The line speed corresponds to 10
Kpackets/sec in terms of Data packets. The detailed evaluation conditions are as follows.
One consumer is supposed to retrieve a dedicated content from the corresponding producer, e.g., C1 from R1. This means that no Data packet caching is used.
In the evaluation, we changed the number of consumer/producer pairs from 1 to 10. In the case of the number of pairs is one, it is a linear network configuration. In this case, the token bucket in the consumer will overflow, as in the evaluation described in Section III. When it is more than one, the link between R1 and R2 becomes the bottleneck link and the token bucket in router R1 will overflow.
The initial value of Interest sending rate is set to the maximum rate (10 Kpackets/sec) divided by the number of consumer/producer pairs. For example, when the number of pairs is two, the initial Interest sending rate is 5 Kpackets/sec for two consumers.
The sending of Interest packets will start at the same time among the consumers. That is, the Interest sending will be synchronized at least in the beginning of the evaluation runs. This is a very heavy condition, but, since the token buckets are prepared for individual consumer/producer pairs, the overflow will occur independently and at different timings for different pairs. So, the impact of this condition seems to be not large.
The maximum value of token bucket depth is set to 50 packets, 100 packets, or 500 packets. Since the congestion is invoked by the overflow at the token bucket, we tested for different maximum values.
The tick interval vales are selected from 1 msec, 5 msec, and 10 msec. We believe that these values are reasonably small to be implemented in off-the-shelf computers.
In the case of the evaluations in Sections III and IV, there was only one Interest packet flow. So, we used the Interest sending rate limit assigned for individual outgoing interface.
This is called PerOutFaceLimits implemented in the
LimitsRate class in ndnSIM 1.0. In the case of this evaluation, however, the rate limit needs to be prepared for individual Interest flow as well as for outgoing interface. This
is realized by PerFibLimits implemented in the same class. It should be mentioned that there is a bug for
PerFibLimits in ndnSIM 1.0. In the method
NotifyNewAggregate() in the LimitsRate class, which is called just after the instance is created, the
LeakBucket () method needs to be scheduled in order to start the periodical token release. However, this is done only
for PerOutFaceLimits, and not for
PerOutFaceLimits. So, we modified this part of program in ndnSIM 1.0.
B. Performance evaluation results of SF under coarse-
grained clock
We conducted performance evaluation of SF under the conditions described above. The execution time of one
Figure 6. Time variation of Interest sending rate in proposed method.
TABLE II. SUMMARY OF RESULTS WITH PROPOSED METHOD.
Data packet throughput (Mbps)
Number of NACK packets
Tick = 50 msec
Tick = 100 msec
Tick = 200 msec
8.73 8.70 8.69
0 0 0
0
200
400
600
800
1000
1200
0 2 4 6 8 10
Inte
rest
se
nd
ing
rate
(p
acke
ts/s
ec)
time (sec)
Tick: 50 msec
Tick: 100 msec
Tick: 200 msec
C1
R1 R2
P1speed: 100Mbps
delay:50 msec 100Mbps
50 msec
100Mbps
50 msec
Data packet: 1250 Bytes --- 100Mbps => 10 Kpackets/sec Max. depth of token bucket = 50 packets, 100 packets, 500 packets Tick interval = 1 msec, 5 msec, 10 msec
C10 P10
Figure 7. Network configuration and conditions in practical evaluation.

141
International Journal on Advances in Telecommunications, vol 11 no 3 & 4, year 2018, http://www.iariajournals.org/telecommunications/
2018, © Copyright by authors, Published under agreement with IARIA - www.iaria.org
evaluation run is 10 sec similarly with the evaluation described in Sections III and IV. Figure 8 shows the results of Data packet throughput. The graph indicates the sum of Data packet throughput of individual consumer/producer pairs. So, the limit is 100 Mbps. The horizontal axis of the graph is the number of consumer/producer pairs; 1, 2, 5, and 10. The figure shows the three cases with different maximum values of token bucket depth; 50 packets, 100 packets, and 500 packets. Figure 9 shows the total number of NACK packets generated in individual consumer/producer pairs. We can discuss the following from those results.
Figure 8 shows that, when there are multiple Interest/ Data packet flows, the total Data packet throughput decreases. This is because SF itself has some
performance problem in the case of multiple flows [12]. In the dumbbell network, the Interest sending rate of individual flow increases to the maximum value corresponding to the line speed between a consumer and the bottleneck router. This triggers network congestion at the bottleneck router, and generates a number of NACK packets. So, the Data throughput degradation and the increase of NACK packets in the case of multiple flows come from factors other than the coarse-grained system clock.
In the case of a single Interest/Data flow between one pair of consumer/producer, the coarse-grained clock degrades the Data throughput. When the maximum bucket depth is 50 packets (Figure 8 (a)), the tick
(a) max. bucket depth = 50 packets. (a) max. bucket depth = 50 packets.
(b) max. bucket depth = 100 packets. (b) max. bucket depth = 100 packets.
(c) max. bucket depth = 500 packets. (c) max. bucket depth = 500 packets.
Figure 8. Data throughput under practical evaluation conditions. Figure 9. Number of NACK packets under practical evaluation conditions.
0
10
20
30
40
50
60
70
80
90
100
1 2 5 10
tota
l Dat
a th
rou
ghp
ut
(Mb
ps)
# of consumer/producer pairs
fine 1msec 5msec 10msec
0
100
200
300
400
500
600
700
800
900
1000
1 2 5 10
tola
l # o
f N
acks
(p
acke
ts)
# of consumer/producer pairs
fine 1msec 5msec 10msec
0
10
20
30
40
50
60
70
80
90
100
1 2 5 10
tota
l Dat
a th
rpu
ogh
pu
t (M
bp
s)
# of consumer/producer pairs
fine 1msec 5msec 10msec
0
200
400
600
800
1000
1200
1 2 5 10
tota
l # o
f N
acks
(p
acke
ts)
# of consumer/producer pairs
fine 1msec 5msec 10msec
0
10
20
30
40
50
60
70
80
90
100
1 2 5 10
tota
l Dat
a th
rou
ghp
ut
(Mb
ps)
# of consumer/producer pairs
fine 1msec 5msec 10msec
0
200
400
600
800
1000
1200
1400
1600
1800
2000
1 2 5 10
tota
l # o
f N
acks
(p
acke
ts)
# of consumer/producer pairs
fine 1msec 5msec 10msec

142
International Journal on Advances in Telecommunications, vol 11 no 3 & 4, year 2018, http://www.iariajournals.org/telecommunications/
2018, © Copyright by authors, Published under agreement with IARIA - www.iaria.org
interval of 5 msec degrades the throughput slightly, and the tick interval 10 msec induces a heavy throughput degradation. When the maximum bucket depth is 100 packets, a slight throughput degradation is observed for the tick interval of 10 msec. There are no throughput degradations for a single flow when the maximum bucket depth is 500 packets.
When there are multiple Interest/Data flows, the affects by the coarse-grained clock is clearly given in the case that the maximum bucket depth is 50 packets (Figure 8 (a)). According to the tick interval’s increasing, the total Data packet throughput is decreasing. In the case that the maximum bucket depth is 100 packets or 500 packets (Figure 8 (b) or 8 (c)), the Data throughput of SF with fine-grained clock is higher than that under coarse-grained clock, except the case of tick interval = 10 msec and maximum bucket depth = 100 packets.
As for the fairness among multiple Interest/Data flows, Figure 10 shows the Data packet throughput of individual flows in the case of tick interval = 1 msec and maximum bucket depth = 50 packets. For individual cases of consumer/producer pairs, the Data throughput of individual flow is similar with each other.
C. Performance evaluation results of SF with smoothening
Inerest packet sending under coarse-grained clock
Figure 11 shows the evaluation results when the proposed smoothening Interest sending rate method is used under the coarse-grained clock. In this case, the results are different for the case of single Interest/Data flow and for the case of multiple flows.
When there is only a single flow, the total Data packet throughput is improved by the proposed method. For example, in the case of tick interval = 5 msec and maximum bucket depth = 50 packets, the total Data throughput increased to 91 Mbps from 74 Mbps. In the case of tick interval = 10 msec and maximum bucket depth = 50 packets, the throughput becomes 30 Mbps, which was 16 Mbps without the smoothening method. In the case of tick interval = 10 msec and maximum bucket depth = 100 packets, the throughput increased to 91 Mbps from 75 Mbps. That is, it can be
concluded that in the single Interest/Data flow case, the proposed smoothening method is effective to increase Data throughput when a coarse-grained clock is adopted.
However, when there are multiple Interest/Data flows, the proposed method does not improve the total Data packet throughput. The throughput in Figure 11 is similar with the corresponding results in Figure 8. The reason for this result will be that SF has other performance problems, such as the excessive rate reduction by continuously transmitted NACK packets [12], and they cancel the effects of the Interest sending smoothening.
Figure 10. Individual Data packet throughput at tick interval = 1 msec and
max. bucket depth = 50 packets.
0
10
20
30
40
50
60
70
80
90
100
1 2 5 10
ind
ivid
ual
Dat
a th
rou
ghp
ut
(Mb
ps)
# of consumer/producer pairs
(a) max. bucket depth = 50 packets.
(b) max. bucket depth = 100 packets.
(c) max. bucket depth = 500 packets.
Figure 11. Data throughput with Interest sending smoothening.
0
10
20
30
40
50
60
70
80
90
100
1 2 5 10
tota
l Dat
a th
rou
ghp
ut
(Mb
ps)
# of consumer/producer pairs
1msec 5msec 10msec
0
10
20
30
40
50
60
70
80
90
100
1 2 5 10
tota
l Dat
a th
rou
ghp
ut
(Mb
ps)
# of consumer/producer pairs
1msec 5msec 10msec
0
10
20
30
40
50
60
70
80
90
100
1 2 5 10
tota
l Dat
a th
rou
ghp
ut
(Mb
ps)
# of consumer/producer pairs
1msec 5msec 10msec

143
International Journal on Advances in Telecommunications, vol 11 no 3 & 4, year 2018, http://www.iariajournals.org/telecommunications/
2018, © Copyright by authors, Published under agreement with IARIA - www.iaria.org
VI. CONCLUSIONS
This paper revisited an issue on how the coarse-grained clock system influences the NDN rate-based congestion control, which was pointed out in our previous paper [1]. Currently, the rate-based congestion control is considered to be effective in NDN. However, the rate-based control over high speed links requires highly precious clock management and this gives a serious processing overhead to off-the-shelf computers. So, we think that commodity based consumers need to use a coarse-grained clock system.
In the fundamental performance evaluation using Stateful Forwarding as a target system, we showed the following. Even if the network does not cause any congestion, the tick intervals such as 50 msec, 100 msec, and 200 msec generate some NACK packets. Especially, in the cases of 100 msec and 200 msec ticks, the Data throughput decreases largely. These results mean the NDN rate-based congestion control has some problems when it is used with a coarse-grained clock system.
This paper also proposed a scheme to smoothen Interest sending, which allows a queued Interest packets for sending to be transmitted when any Data or NACK packets are received. As the result of fundamental simulation evaluation, the proposed method did not generate any NACK packets even if 50 msec, 100 msec, and 200 msec are used as tick intervals.
This paper also showed the evaluation results using more practical network configuration, with higher link speed, multiple Interest/Data flows, and shorter tick intervals such as 1msec through 10 msec. In this evaluation, the results were a little different in a single flow case and a multiple flow case. When there is only one Interest/Data flow, the coarse-grained clock induced the Data packet throughput, even the tick interval is 1 msec. The proposed smoothening method also recovered the Data throughput, as in the fundamental evaluation.
However, when there are multiple Interest/Data flows, the situation changed. In this case, the link between intermediate routers in a dumbbell network becomes the bottleneck. Stateful Forwarding itself degrades the Data throughput in this case. Although the coarse-grained clock degrade the throughput in some conditions, the issue of Stateful Forwarding has a larger impact. The proposed smoothening method did not increase the throughput, either.
Recently, several rate control methods with explicit rate reporting are proposed. They will resolve the non-deterministic rate selection which Stateful Forwarding relies on. It is considered that we need to apply our methodology to those new types of rate-based congestion control methods in the future.
REFERENCES
[1] T. Kato, K. Osada, R. Yamamoto, and S. Ohzahata, “A Study on How Coarse-grained Clock System Influences NDN Rate-based Congestion Control,” Proc. of IARIA ICN 2018, pp. 35-40, Apr. 2018.
[2] Cisco public, “Cisco Visual Networking Index: Forecast and Methodology, 2016-2021,” Jun. 2017 [retrieved: Sep. 2018].
[3] V. Jacobson et al., “Networking Named Content,” Proc. of CoNEXT ’09, pp. 1-12, Dec. 2009.
[4] N. Minh, R. Yamamoto, S. Ohzahata, and T. Kato, “A Routing Protocol Proposal for NDN Based Ad Hoc Networks Combining Proactive and Reactive Routing Mechanism,” Proc. of IARIA AICT 2017, pp. 80-86, Jun. 2017.
[5] Y. Ren, J. Li, S. Shi, L. Li, G. Wang, and B. Zhang, “Congestion control in named data networking - A survey,” Computer Communications, vol. 86, pp. 1-11, Jul. 2016.
[6] A. Afanasyev, et al., “Host-to-Host Congestion Control for TCP,” IEEE Commun. Surveys & Tutorials, vol. 12, no. 3, pp. 304-342, 2010.
[7] K. Ramakrishnan, S. Floyd, and D. Black, “The Addition of Explicit Congestion Notification (ECN) to IP,” IETF RFC 3168, Sep. 2001.
[8] G. Carofiglio, M. Gallo, and L. Muscariello, “ICP: Design and Evaluation of an Interest Control Protocol for Content-Centric Networking,” Proc. of IEEE INFOCOM 2012, pp. 304-309, Mar. 2012.
[9] L. Saino, C. Cocora, and G. Pavlou, “CCTCP: A Scalable Receiver-driven Congestion Control Protocol for Content Centric Networking,” Proc. of IEEE ICC 2013, pp. 3775-3780, Jun. 2013.
[10] F. Zhang, Y. Zhang, A. Reznik, H. Liu, C. Qian, and C. Xu, “A Transport Protocol for Content-Centric Networking with Explicit Congestion Control,” Proc. of IEEE ICCCN 2014, pp. 1-8, Aug. 2014.
[11] Y. Cheng, A. Afanasyev, I. Moiseenko, B. Zhang, L. Wang, and L. Zhang, “A case for stateful forwarding plane,” Computer Communications, vol. 36, no. 7, pp. 779-791, Apr. 2013.
[12] T. Kato and M. Bandai, “Congestion Control Avoiding Excessive Rate Reduction in Named Data Network,” Proc. of IEEE CCNC, pp. 1-6, Jan. 2017.
[13] K. Schneider, C. Yi, B. Zhang, and L. Zhang, “A Practical Congestion Control Scheme for Named Data Networking,” Proc. of ACM ICN 2016, pp. 21-30, Sep. 2016.
[14] J. Zhang, Q. Wu, Z. Li, M. A. Kaafar, and G. Xie, “A Proactive Transport Mechanism with Explicit Congestion Notification for NDN,” Proc. of IEEE ICC 2015, pp. 5242-5247, Jun. 2015.
[15] N. Rozhnova and S. Fdida, “An extended Hop-by-Hop Interest shaping mechanism for Content-Centric Networking,” Proc. of IEEE GLOBECOM 2014, pp. 1-7, Dec. 2014.
[16] M. Mahdian, S. Arianfar, J. Gibson, and D. Oran, “Multipath-aware ICN Rate-based Congestion Control,” Proc. of ACM ICN 2016, pp. 1-10, Sep. 2016.
[17] K. Fall and W. Stevens, “TCP/IP Illustrated, Volume1; The Protocols, Second Edition,” Addison-Wesley,
[18] A. Afanasyev, I. Moiseenko, and L. Zhang, “ndnSIM: NDN simulator for NS-3,” NDN, Technical Report NDN-0005, 2012, Oct. 2012.
[19] “Overall ndnSIM documentation; Forwarding Strategies,” http://ndnsim.net/1.0/fw.html [retrieved: Sep. 2018].
[20] K. Nichols and V. Jacobson, “Controlling Queue Delay,” ACM Magazine Queue, vol. 10, issue 5, pp. 1-15, May 2012.
[21] ITU-T, “B-ISDN asynchronous transfer mode functional characteristics,” Series I: Integrated Services Digital Nework, Recommendation I.150, Feb. 1999.
[22] Y. Yamamoto, “Estimation of the advanced TCP/IP algorithms for long sistance collaboration,” Fusion Engineering and Design, vol. 83, issue 2-3, pp. 516-519, Apr. 2008.
[23] T. Kato and M. Bandai, “A Congestion Control Method for NDN Using Hop-by-hop Window Management,” Proc. of IEEE CCNC 2018, pp. 1-6, Jan. 2018.

www.iariajournals.org
International Journal On Advances in Intelligent Systems
issn: 1942-2679
International Journal On Advances in Internet Technology
issn: 1942-2652
International Journal On Advances in Life Sciences
issn: 1942-2660
International Journal On Advances in Networks and Services
issn: 1942-2644
International Journal On Advances in Security
issn: 1942-2636
International Journal On Advances in Software
issn: 1942-2628
International Journal On Advances in Systems and Measurements
issn: 1942-261x
International Journal On Advances in Telecommunications
issn: 1942-2601