The Alpha/Beta Allocator - lyxoretf.ch Alpha Beta Allocator CH... · In Q3, global bond and IG...
8
Informed Investor: Alpha/Beta Allocator Q3 2018 1. Look back at how active managers have performed YTD FOR QUALIFIED INVESTORS ONLY Despite some improvements, Q3 results reinforce the view that active managers have found their ability to generate alpha persistently constrained by widespread economic and political risk. Fixed income Equity Average By Marlène Hassine Konqui, Head of ETF Research, Jean-Baptiste Berthon, Cross Asset Strategist and Kristo Durbaku, ETF Research Analyst Fixed income Equity Average The Alpha/Beta Allocator 6 steps to a better portfolio 48 % 41 % 43 % 39 % 47 % 44 % 36 % 28 % 31 % 51 % 31 % 38 % 2018 to date Q3 2018 2017 10Y 5Y FOR QUALIFIED INVESTORS ONLY – This document is reserved and must be given in Switzerland exclusively to Qualified Investors as defined by the Swiss Collective Investment Scheme Act of 23 June 2006 (as amended from time to time, CISA Contact us www.lyxoretf.com Source: Morningstar & Bloomberg, data from 30/09/2008 to 28/09/2018. Past performance is no guide to future returns. 27 % 33 % 31 % of fixed income managers outperformed. Emerging market debt managers were again the main laggards, but US high yield managers weren’t far behind of equity active managers outperformed as their Q2 improvement tailed off. European managers did best – albeit mainly those with a more specific focus of all active managers have outperformed YTD. 2018 has been far more disappointing than 2017
Transcript of The Alpha/Beta Allocator - lyxoretf.ch Alpha Beta Allocator CH... · In Q3, global bond and IG...
Informed Investor: Alpha/Beta Allocator Q3 2018
1. Look back at how active managers have performed YTD
FOR QUALIFIED INVESTORS ONLY
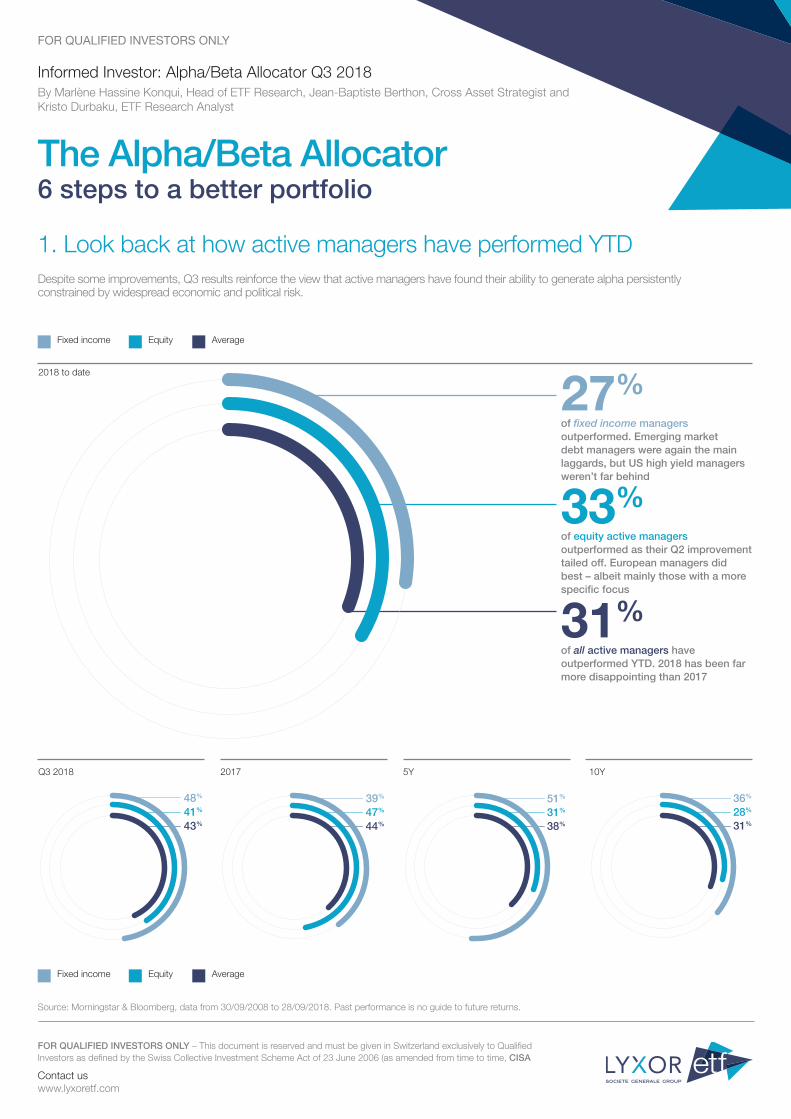
Despite some improvements, Q3 results reinforce the view that active managers have found their ability to generate alpha persistently constrained by widespread economic and political risk.
Fixed income Equity Average
By Marlène Hassine Konqui, Head of ETF Research, Jean-Baptiste Berthon, Cross Asset Strategist and Kristo Durbaku, ETF Research Analyst
Fixed income Equity Average
The Alpha/Beta Allocator6 steps to a better portfolio
48%
41%
43%
39%
47%
44%
36%
28%
31%
51%
31%
38%
2018 to date
Q3 2018 2017 10Y5Y
FOR QUALIFIED INVESTORS ONLY – This document is reserved and must be given in Switzerland exclusively to Qualified Investors as defined by the Swiss Collective Investment Scheme Act of 23 June 2006 (as amended from time to time, CISA
Contact uswww.lyxoretf.com
Source: Morningstar & Bloomberg, data from 30/09/2008 to 28/09/2018. Past performance is no guide to future returns.
27%
33%
31%
of fixed income managers outperformed. Emerging market debt managers were again the main laggards, but US high yield managers weren’t far behind
of equity active managers outperformed as their Q2 improvement tailed off. European managers did best – albeit mainly those with a more specific focus
of all active managers have outperformed YTD. 2018 has been far more disappointing than 2017
FOR QUALIFIED INVESTORS ONLY – This document is reserved and must be given in Switzerland exclusively to Qualified Investors as defined by the Swiss Collective Investment Scheme Act of 23 June 2006 (as amended from time to time, CISA
Contact uswww.lyxoretf.com
FOR QUALIFIED INVESTORS ONLY
2. Explore the equity and fixed income highlights YTD
Informed Investor: Alpha/Beta Allocator Q3 2018 2
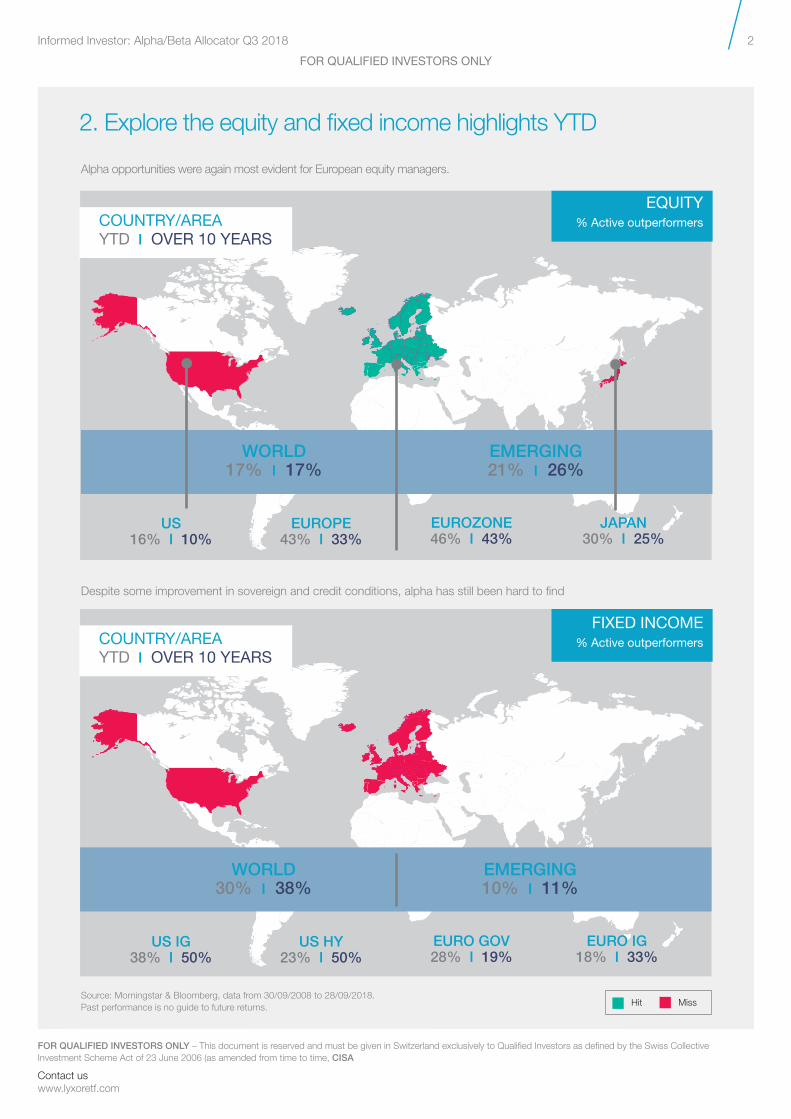
EMERGING 21% I 26%
US 16% I 10%
EUROPE 43% I 33%
EUROZONE 46% I 43%
JAPAN 30% I 25%
COUNTRY/AREAYTD I OVER 10 YEARS
Alpha opportunities were again most evident for European equity managers.
US IG 38% I 50%
US HY 23% I 50%
EURO GOV 28% I 19%
EURO IG 18% I 33%
COUNTRY/AREAYTD I OVER 10 YEARS
Despite some improvement in sovereign and credit conditions, alpha has still been hard to find
EQUITY% Active outperformers
FIXED INCOME% Active outperformers
EMERGING 10% I 11%
WORLD17% I 17%
WORLD30% I 38%
Hit MissSource: Morningstar & Bloomberg, data from 30/09/2008 to 28/09/2018. Past performance is no guide to future returns.
FOR QUALIFIED INVESTORS ONLY – This document is reserved and must be given in Switzerland exclusively to Qualified Investors as defined by the Swiss Collective Investment Scheme Act of 23 June 2006 (as amended from time to time, CISA
Contact uswww.lyxoretf.com
FOR QUALIFIED INVESTORS ONLY
3. Q3 Analyse the full results
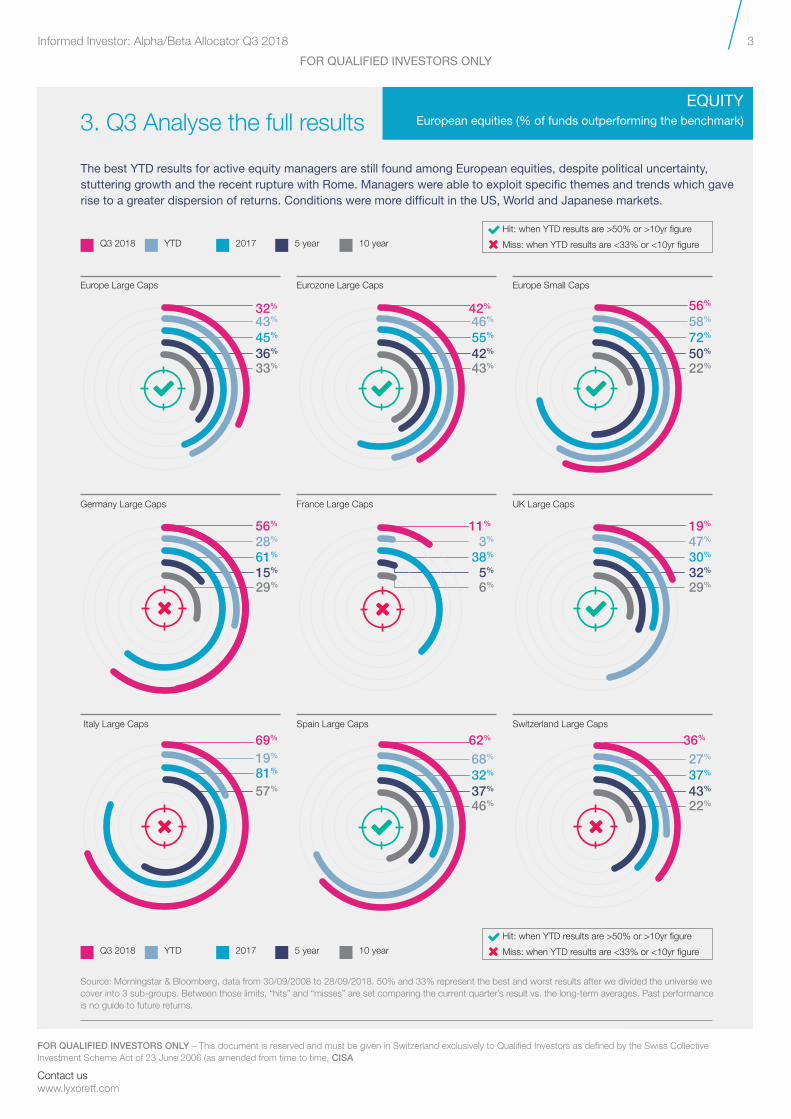
Europe Large Caps Eurozone Large Caps Europe Small Caps
Germany Large Caps France Large Caps UK Large Caps
Italy Large Caps Spain Large Caps Switzerland Large Caps
Source: Morningstar & Bloomberg, data from 30/09/2008 to 28/09/2018. 50% and 33% represent the best and worst results after we divided the universe we cover into 3 sub-groups. Between those limits, “hits” and “misses” are set comparing the current quarter’s result vs. the long-term averages. Past performance is no guide to future returns.
Informed Investor: Alpha/Beta Allocator Q3 2018 3
EQUITYEuropean equities (% of funds outperforming the benchmark)
The best YTD results for active equity managers are still found among European equities, despite political uncertainty, stuttering growth and the recent rupture with Rome. Managers were able to exploit specific themes and trends which gave rise to a greater dispersion of returns. Conditions were more difficult in the US, World and Japanese markets.
YTD 2017 5 year 10 yearQ3 2018
YTD 2017 5 year 10 yearQ3 2018
32%
43%
45%
36%
33%
56%
28%
61%
15%
29%
69%
19%
81%
57%
42%
46%
55%
42%
43%
11%
3%
38%
5%
6%
62%
68%
32%
37%
46%
56%
58%
72%
50%
22%
19%
47%
30%
32%
29%
36%
27%
37%
43%
22%
Hit: when YTD results are >50% or >10yr figure
Miss: when YTD results are <33% or <10yr figure
Hit: when YTD results are >50% or >10yr figure
Miss: when YTD results are <33% or <10yr figure
FOR QUALIFIED INVESTORS ONLY – This document is reserved and must be given in Switzerland exclusively to Qualified Investors as defined by the Swiss Collective Investment Scheme Act of 23 June 2006 (as amended from time to time, CISA
Contact uswww.lyxoretf.com
FOR QUALIFIED INVESTORS ONLY
3. Q3 Analyse the full results (continued)
Informed Investor: Alpha/Beta Allocator Q3 2018 4
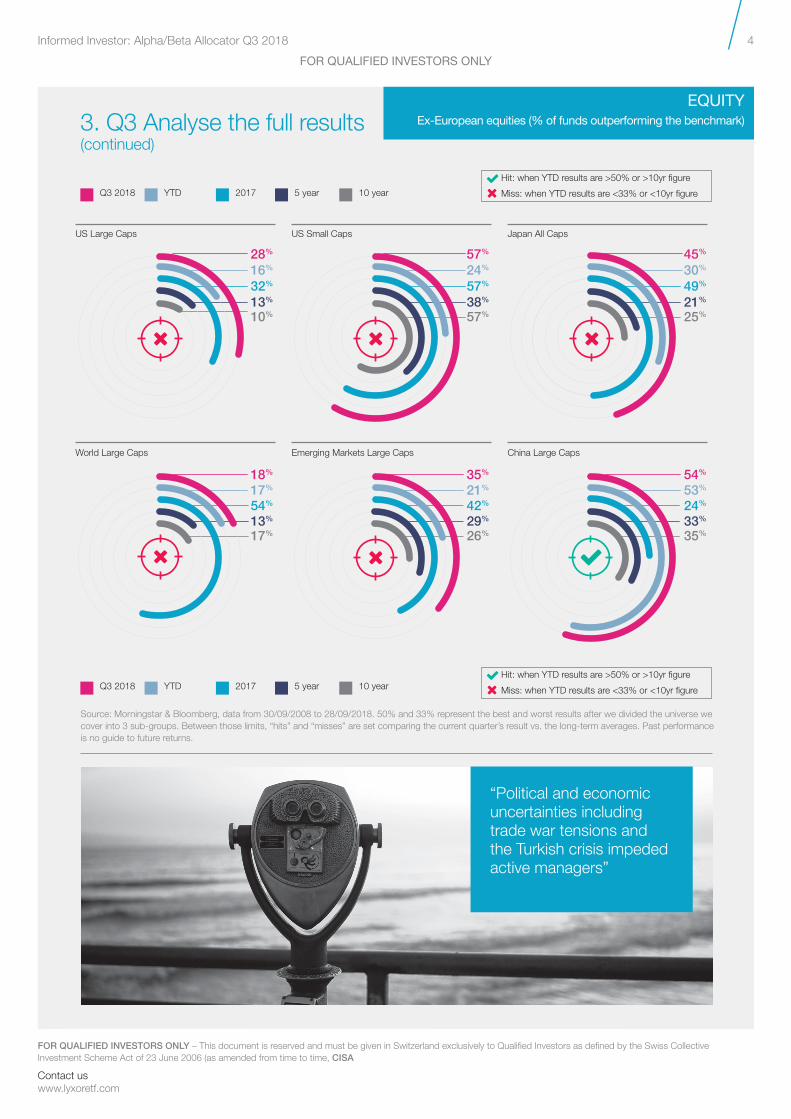
EQUITYEx-European equities (% of funds outperforming the benchmark)
“Political and economic uncertainties including trade war tensions and the Turkish crisis impeded active managers”
Source: Morningstar & Bloomberg, data from 30/09/2008 to 28/09/2018. 50% and 33% represent the best and worst results after we divided the universe we cover into 3 sub-groups. Between those limits, “hits” and “misses” are set comparing the current quarter’s result vs. the long-term averages. Past performance is no guide to future returns.
YTD 2017 5 year 10 yearQ3 2018
YTD 2017 5 year 10 yearQ3 2018
US Large Caps US Small Caps Japan All Caps
World Large Caps Emerging Markets Large Caps China Large Caps
28%
16%
32%
13%
10%
18%
17%
54%
13%
17%
57%
24%
57%
38%
57%
35%
21%
42%
29%
26%
45%
30%
49%
21%
25%
54%
53%
24%
33%
35%
Hit: when YTD results are >50% or >10yr figure
Miss: when YTD results are <33% or <10yr figure
Hit: when YTD results are >50% or >10yr figure
Miss: when YTD results are <33% or <10yr figure
FOR QUALIFIED INVESTORS ONLY – This document is reserved and must be given in Switzerland exclusively to Qualified Investors as defined by the Swiss Collective Investment Scheme Act of 23 June 2006 (as amended from time to time, CISA
Contact uswww.lyxoretf.com
FOR QUALIFIED INVESTORS ONLY
Informed Investor: Alpha/Beta Allocator Q3 2018 5
3. Q3 Analyse the full results (continued)
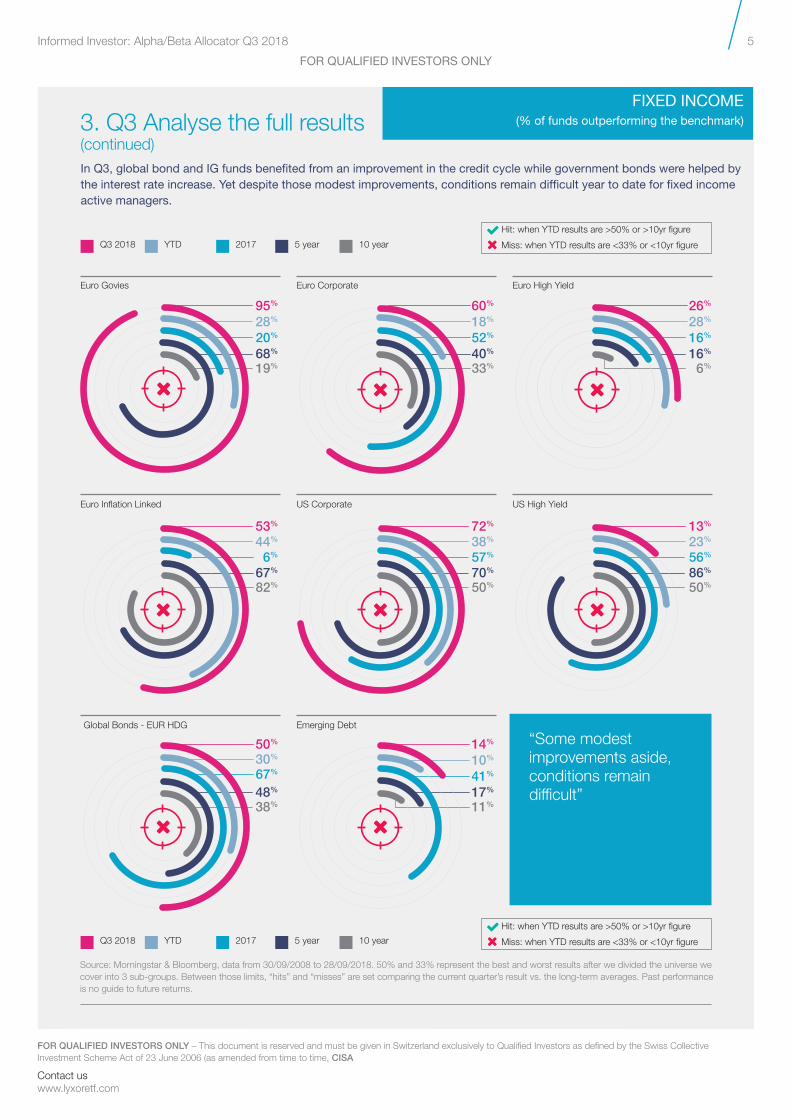
FIXED INCOME(% of funds outperforming the benchmark)
50%
30%
67%
48%
38%
14%
10%
41%
17%
11%
“Some modest improvements aside, conditions remain difficult”
Source: Morningstar & Bloomberg, data from 30/09/2008 to 28/09/2018. 50% and 33% represent the best and worst results after we divided the universe we cover into 3 sub-groups. Between those limits, “hits” and “misses” are set comparing the current quarter’s result vs. the long-term averages. Past performance is no guide to future returns.
Global Bonds - EUR HDG Emerging Debt
YTD 2017 5 year 10 yearQ3 2018
YTD 2017 5 year 10 yearQ3 2018
Hit: when YTD results are >50% or >10yr figure
Miss: when YTD results are <33% or <10yr figure
53%
44%
6%
67%
82%
72%
38%
57%
70%
50%
13%
23%
56%
86%
50%
Euro Inflation Linked US Corporate US High Yield
Euro Govies Euro Corporate Euro High Yield
95%
28%
20%
68%
19%
60%
18%
52%
40%
33%
26%
28%
16%
16%
6%
Hit: when YTD results are >50% or >10yr figure
Miss: when YTD results are <33% or <10yr figure
In Q3, global bond and IG funds benefited from an improvement in the credit cycle while government bonds were helped by the interest rate increase. Yet despite those modest improvements, conditions remain difficult year to date for fixed income active managers.

FOR QUALIFIED INVESTORS ONLY – This document is reserved and must be given in Switzerland exclusively to Qualified Investors as defined by the Swiss Collective Investment Scheme Act of 23 June 2006 (as amended from time to time, CISA
Contact uswww.lyxoretf.com
FOR QUALIFIED INVESTORS ONLY
Informed Investor: Alpha/Beta Allocator Q3 2018 6
4. Read our views on where to find alpha over the next few months
Emerging MarketsActive unexpectedly lost out to passive in Q3 after external factors like dollar strength or trade tensions drove stocks to re-correlate and investors to disregard idiosyncrasies. Not much will change in Q4. Key elections are behind us, but political uncertainties will again be to the fore. The backdrop for broader equities is adverse, but passive looks a good bet at the country level provided you look for those less dependent on oil prices. Some active managers may enjoy the greater differentiation between countries as supply chains are revamped in Asia and Latin America’s new leaders take the reins.
MISS – Hard to call given unfavourable conditions for both styles but passive just edges ahead - particularly at the country level.
USWhen the economic and market trends were clear, there was no need to look beyond passive. However, the outlook is far from certain, so there should be less outperformance vs. other countries and more differentiation between stocks. Policy tightening, the fading of the fiscal push and trade-related margin pressures should also lead to a more rational market. Stock pickers focusing on specific styles or segments could soon become more attractive, but passive should still be a hit once the sell-off dust has settled.
Verdict: MISS – Long-term disappointments among broad equity managers leave us wary for now, but it could soon be time to use more focused active or alternatives funds.
JapanBoth styles were boosted by hints of BoJ normalisation and PM Abe’s retention of power, and both styles have suffered during the recent sell-off. We still lean towards passive, but the tide may turn as next October’s 2% VAT hike looms into view. We suspect the authorities will launch some form of fiscal stimulus to try to ease the blow, but it may not be enough. Themes including China and trade, oil price movements and EM supply chains may create opportunities for stock pickers, but high correlations and a low dispersion of returns keep us wary.
Verdict: MISS – We favour passive for now given the market’s direction of travel, but will be reviewing our stance early next year.
EuropeActive fared better than passive in most European markets given the lack of any obviously positive economic or market trends. That may still be the case in Q4, with political issues in Italy and Germany likely to prove disruptive. But it’s hard to be too positive – most sectors lack the structure managers need, most stocks lack the momentum and the first ECB rate hike is probably still a year away. Brexit, ironically enough, may be a bright spot. As the finer details of a deal emerge, so should idiosyncratic opportunities to go long or short.
Verdict: HIT – Both styles will be constrained by political uncertainties but the lack of clear trends means we have a slight preference for active. The case is clearest in the UK.
Source: Source: Lyxor ETF & Cross Asset Research teams. All views & opinions as at 18 October 2018.
Over the summer, most of our Q3 calls held up well. Passive worked best in the US and Japan, but active succeeded in Europe. Active EM equity managers didn’t however repay our faith. So what’s next? Lyxor’s ETF Research and Cross Asset Strategy teams explain their view.
FOR QUALIFIED INVESTORS ONLY
Informed Investor: Alpha/Beta Allocator Q3 2018 7
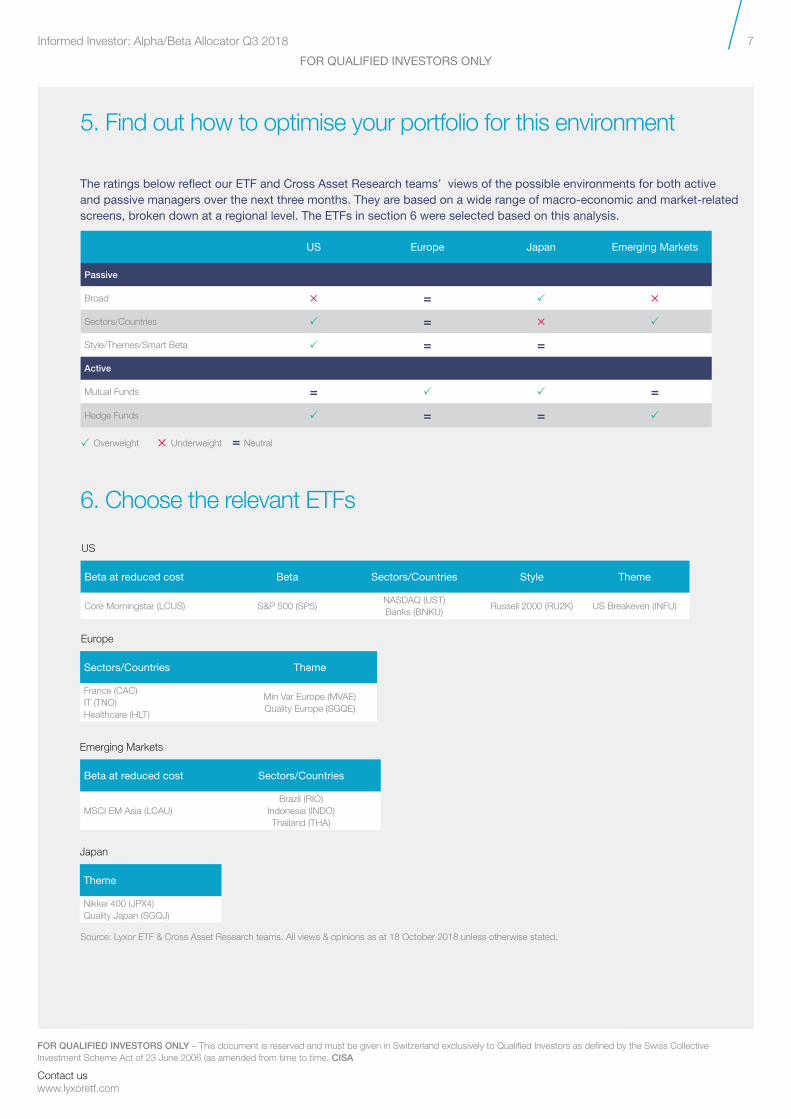
5. Find out how to optimise your portfolio for this environment
US Europe Japan Emerging Markets
Passive
Broad Î = P Î
Sectors/Countries P = Î P
Style/Themes/Smart Beta P = =
Active
Mutual Funds = P P =
Hedge Funds P = = P
P Overweight Î Underweight = Neutral
Beta at reduced cost Beta Sectors/Countries Style Theme
Core Morningstar (LCUS) S&P 500 (SP5)NASDAQ (UST)Banks (BNKU)
Russell 2000 (RU2K) US Breakeven (INFU)
6. Choose the relevant ETFs
Theme
Nikkei 400 (JPX4)Quality Japan (SGQJ)
US
Japan
FOR QUALIFIED INVESTORS ONLY – This document is reserved and must be given in Switzerland exclusively to Qualified Investors as defined by the Swiss Collective Investment Scheme Act of 23 June 2006 (as amended from time to time, CISA
Contact uswww.lyxoretf.com
Sectors/Countries Theme
France (CAC)IT (TNO)Healthcare (HLT)
Min Var Europe (MVAE)Quality Europe (SGQE)
Europe
Source: Lyxor ETF & Cross Asset Research teams. All views & opinions as at 18 October 2018 unless otherwise stated.
The ratings below reflect our ETF and Cross Asset Research teams’ views of the possible environments for both active and passive managers over the next three months. They are based on a wide range of macro-economic and market-related screens, broken down at a regional level. The ETFs in section 6 were selected based on this analysis.
Beta at reduced cost Sectors/Countries
MSCI EM Asia (LCAU)Brazil (RIO)
Indonesia (INDO)Thailand (THA)
Emerging Markets
Contact uswww.lyxoretf.com
FOR QUALIFIED INVESTORS ONLY
Informed Investor: Alpha/Beta Allocator Q3 2018 8
FOR QUALIFIED INVESTORS ONLY – This document is reserved and must be given in Switzerland exclusively to Qualified Investors as defined by the Swiss Collective Investment Scheme Act of 23 June 2006 (as amended from time to time, CISA
Knowing your risk
It is important for potential investors to evaluate the general risks described below and in the fund prospectus on our website www.lyxoretf.com
Capital at risk
ETFs are tracking instruments: Their risk profile is similar to a direct investment in the Underlying index. Investors’ capital is fully at risk and investors may not get back the amount originally invested.
Replication risk
The fund objectives might not be reached due to unexpected events on the underlying markets which will impact the index calculation and the efficient fund replication.
Counterparty risk
With synthetic ETFs, investors are exposed to risks resulting from the use of an OTC swap with Société Générale. In-line with UCITS guidelines, the exposure to Société Générale cannot exceed 10% of the total fund assets. Physically replicated ETFs may have counterparty risk if they use a securities lending programme.
Concentration risk
Smart Beta ETFs select stocks or bonds for their portfolio from the original benchmark index. Where selection rules are extensive, it can lead to a more concentrated portfolio where risk is spread over fewer stocks than the original benchmark.
Important information
This document has been provided by Lyxor International Asset
Management that is solely responsible for its content.
This document is not to be deemed distribution of funds in Switzerland according
to the Swiss collective investment schemes act of 23 June 2006 (as amended
from time to time, CISA) or any other applicable Swiss laws or regulations.
This document is reserved and must be given in Switzerland exclusively
to Qualified Investors as defined by the Swiss Collective Investment
Scheme Act of 23 June 2006 (as amended from time to time, CISA).
Financial intermediaries (including particularly, representatives of private banks or
independent asset managers, Intermediaries) are hereby reminded on the strict
regulatory requirements applicable under the CISA to any distribution of foreign
collective investment schemes in Switzerland. It is each Intermediary’s sole
responsibility to ensure that (i) all these requirements are put in place prior to any
Intermediary distributing any of the Funds presented in this document and (ii) that
otherwise, it does not take any action that could constitute distribution of collective
investment schemes in Switzerland as defined in article 3 CISA and related regulation.
Any information in this document is given only as of the date of this
document and is not updated as of any date thereafter.
This document is for information purposes only and does not constitute an
offer, an invitation to make an offer, a solicitation or recommendation to invest
in collective investment schemes. This document is not a prospectus as per
article 652a or 1156 of the Swiss Code of Obligations, a listing prospectus
according to the listing rules of the SIX Swiss Exchange or any other trading
venue as defined by the Swiss Financial Market Infrastructure Act of 19 June
2015 (as amended from time to time, FMIA), a simplified prospectus, a key
investor information document or a prospectus as defined in the CISA.
Underlying risk
The Underlying index of a Lyxor ETF may be complex and volatile. For example, when investing in commodities, the Underlying index is calculated with reference to commodity futures contracts exposing the investor to a liquidity risk linked to costs such as cost of carry and transportation. ETFs exposed to Emerging Markets carry a greater risk of potential loss than investment in Developed Markets as they are exposed to a wide range of unpredictable Emerging Market risks.
Currency risk
ETFs may be exposed to currency risk if the ETF is denominated in a currency different to that of the Underlying index they are tracking. This means that exchange rate fluctuations could have a negative or positive effect on returns.
Liquidity risk
Liquidity is provided by registered market-makers on the respective stock exchange where the ETF is listed, including Société Générale. On exchange, liquidity may be limited as a result of a suspension in the underlying market represented by the Underlying index tracked by the ETF; a failure in the systems of one of the relevant stock exchanges, or other market-maker systems; or an abnormal trading situation or event.
Conflicts of interestThis research contains the views, opinions and recommendations of Lyxor International Asset Management (“LIAM”) Cross Asset and ETF research analysts and/or strategists. To the extent that this research contains trade ideas based on macro views of economic market conditions or relative value, it may differ from the fundamental Cross Asset and ETF Research opinions and recommendations contained in Cross Asset and ETF Research sector or company research reports and from the views and opinions of other departments of LIAM and its affiliates. Lyxor Cross Asset and ETF research analysts and/or strategists routinely consult with LIAM sales and portfolio management personnel regarding market information including, but not limited to, pricing, spread levels and trading activity of ETFs
tracking equity, fixed income and commodity indices. Trading desks may trade, or have traded, as principal on the basis of the research analyst(s) views and reports. Lyxor has mandatory research policies and procedures that are reasonably designed to (i) ensure that purported facts in research reports are based on reliable information and (ii) to prevent improper selective or tiered dissemination of research reports. In addition, research analysts receive compensation based, in part, on the quality and accuracy of their analysis, client feedback, competitive factors and LIAM’s total revenues including revenues from management fees and investment advisory fees and distribution fees.
An investment in collective investment schemes involves significant risks that are
described in each prospectus or offering memorandum. Each potential investor
should read the entire prospectus or offering memorandum and should carefully
consider the risk warnings and disclosures before making an investment decision.
Any benchmarks/indices cited in this document are
provided for information purposes only.
DTP
1242
64