The ALMA-PILS survey: First detections of ethylene oxide ...
38
Astronomy & Astrophysics manuscript no. final˙version c ESO 2018 September 3, 2018 The ALMA-PILS survey: First detections of ethylene oxide, acetone and propanal toward the low-mass protostar IRAS 16293-2422 J. M. Lykke 1 , A. Coutens 2 , J. K. Jørgensen 1 , M. H. D. van der Wiel 1 , R. T. Garrod 3 , H. S. P. M¨ uller 4 , P. Bjerkeli 1,5 , T. L. Bourke 6 , H. Calcutt 1 , M. N. Drozdovskaya 7 , C. Favre 8,9 , E. C. Fayolle 10 , S. K. Jacobsen 1 , K. I. ¨ Oberg 10 , M. V. Persson 7 , E. F. van Dishoeck 7,11 , and S. F. Wampfler 12 1 Centre for Star and Planet Formation, Niels Bohr Institute & Natural History Museum of Denmark, University of Copenhagen, Øster Voldgade 5–7, DK-1350 Copenhagen K., Denmark 2 Department of Physics and Astronomy, University College London, Gower St., London, WC1E 6BT, UK 3 Departments of Chemistry and Astronomy, University of Virginia, Charlottesville, VA 22904, USA 4 I. Physikalisches Institut, Universit¨ at zu K ¨ oln, Z ¨ ulpicher Str. 77, 50937 K¨ oln, Germany 5 Department of Earth and Space Sciences, Chalmers University of Technology, Onsala Space Observatory, 439 92 Onsala, Sweden 6 SKA Organization, Jodrell Bank Observatory, Lower Withington, Macclesfield, Cheshire SK11 9DL, UK 7 Leiden Observatory, Leiden University, PO Box 9513, NL-2300 RA Leiden, The Netherlands 8 Universit´ e Grenoble Alpes, IPAG, F-38000 Grenoble, France 9 CNRS, IPAG, F-38000 Grenoble, France 10 Harvard-Smithsonian Center for Astrophysics, 60 Garden Street, Cambridge, MA 02138, USA 11 Max-Planck Institut f ¨ ur Extraterrestrische Physik (MPE), Giessenbachstr. 1, 85748 Garching, Germany 12 Center for Space and Habitability (CSH), University of Bern, Sidlerstrasse 5, CH-3012 Bern, Switzerland ABSTRACT Context. One of the open questions in astrochemistry is how complex organic and prebiotic molecules are formed. The unsurpassed sensitivity of the Atacama Large Millimeter/submillimeter Array (ALMA) takes the quest for discovering molecules in the warm and dense gas surrounding young stars to the next level. Aims. Our aim is to start the process of compiling an inventory of oxygen-bearing complex organic molecules toward the solar-type Class 0 protostellar binary IRAS 16293-2422 from an unbiased spectral survey with ALMA, Protostellar Interferometric Line Survey (PILS). Here we focus on the new detections of ethylene oxide (c-C 2 H 4 O), acetone (CH 3 COCH 3 ), and propanal (C 2 H 5 CHO). Methods. With ALMA, we surveyed the spectral range from 329 to 363 GHz at 0.5 00 (60 AU diameter) resolution. Using a simple model for the molecular emission in local thermodynamical equilibrium, the excitation temperatures and column densities of each species were constrained. Results. We successfully detect propanal (44 lines), ethylene oxide (20 lines) and acetone (186 lines) toward one component of the protostellar binary, IRAS16293B. The high resolution maps demonstrate that the emission for all investigated species originates from the compact central region close to the protostar. This, along with a derived common excitation temperature of T ex ≈ 125 K, is consistent with a coexistence of these molecules in the same gas. Conclusions. The observations mark the first detections of acetone, propanal and ethylene oxide toward a low-mass protostar. The relative abundance ratios of the two sets of isomers, a CH 3 COCH 3 /C 2 H 5 CHO ratio of 8 and a CH 3 CHO/c-C 2 H 4 O ratio of 12, are comparable to previous observations toward high-mass protostars. The majority of observed abundance ratios from these results as well as those measured toward high-mass protostars are up to an order of magnitude above the predictions from chemical models. This may reflect either missing reactions or uncertain rates in the chemical networks. The physical conditions, such as temperatures or densities, used in the models, may not be applicable to solar-type protostars either. Key words. astrochemistry – ISM: molecules – ISM: abundances – ISM: individual object: IRAS 16293-2422 line: identification – astrobiology 1. Introduction An important task of modern-day astrochemistry is to under- stand how complex organics and possible pre-biotic molecules form near young stars. The high sensitivity and angular and spec- tral resolution of the Atacama Large Millimeter/submillimeter Array (ALMA) enables detection of molecular species with faint emission lines in otherwise confused regions. The capa- bilities of ALMA were demonstrated early on by the first detec- tion of the prebiotic molecule glycolaldehyde toward the low- Send offprint requests to: J. M. Lykke, e-mail: [email protected] mass protostar, IRAS 16293-2422 (Jørgensen et al. 2012). This detection illustrates the potential for imaging emission from the simplest building blocks for biologically relevant molecules during the earliest stages of the Solar System on the scales where protoplanetary disks emerge, and for understanding how these molecules are formed and in what abundances. This paper presents the first detections of three such species, ethylene ox- ide (c-C 2 H 4 O), propanal (C 2 H 5 CHO) and acetone (CH 3 COCH 3 ) toward IRAS 16293-2422 from an unbiased spectral survey with ALMA (Protostellar Interferometric Line Survey or PILS; Jørgensen et al. 2016). Traditionally, detections of complex organic molecules have mostly been associated with the hot cores around high-mass pro- 1 arXiv:1611.07314v1 [astro-ph.SR] 22 Nov 2016
Transcript of The ALMA-PILS survey: First detections of ethylene oxide ...

Astronomy & Astrophysics manuscript no. final˙version c© ESO 2018September 3, 2018
The ALMA-PILS survey: First detections of ethylene oxide, acetoneand propanal toward the low-mass protostar IRAS 16293-2422
J. M. Lykke1, A. Coutens2, J. K. Jørgensen1, M. H. D. van der Wiel1, R. T. Garrod3, H. S. P. Muller4, P. Bjerkeli1,5,T. L. Bourke6, H. Calcutt1, M. N. Drozdovskaya7, C. Favre8,9, E. C. Fayolle10, S. K. Jacobsen1, K. I. Oberg10,
M. V. Persson7, E. F. van Dishoeck7,11, and S. F. Wampfler12
1 Centre for Star and Planet Formation, Niels Bohr Institute & Natural History Museum of Denmark, University of Copenhagen,Øster Voldgade 5–7, DK-1350 Copenhagen K., Denmark
2 Department of Physics and Astronomy, University College London, Gower St., London, WC1E 6BT, UK3 Departments of Chemistry and Astronomy, University of Virginia, Charlottesville, VA 22904, USA4 I. Physikalisches Institut, Universitat zu Koln, Zulpicher Str. 77, 50937 Koln, Germany5 Department of Earth and Space Sciences, Chalmers University of Technology, Onsala Space Observatory, 439 92 Onsala, Sweden6 SKA Organization, Jodrell Bank Observatory, Lower Withington, Macclesfield, Cheshire SK11 9DL, UK7 Leiden Observatory, Leiden University, PO Box 9513, NL-2300 RA Leiden, The Netherlands8 Universite Grenoble Alpes, IPAG, F-38000 Grenoble, France9 CNRS, IPAG, F-38000 Grenoble, France
10 Harvard-Smithsonian Center for Astrophysics, 60 Garden Street, Cambridge, MA 02138, USA11 Max-Planck Institut fur Extraterrestrische Physik (MPE), Giessenbachstr. 1, 85748 Garching, Germany12 Center for Space and Habitability (CSH), University of Bern, Sidlerstrasse 5, CH-3012 Bern, Switzerland
ABSTRACT
Context. One of the open questions in astrochemistry is how complex organic and prebiotic molecules are formed. The unsurpassedsensitivity of the Atacama Large Millimeter/submillimeter Array (ALMA) takes the quest for discovering molecules in the warm anddense gas surrounding young stars to the next level.Aims. Our aim is to start the process of compiling an inventory of oxygen-bearing complex organic molecules toward the solar-typeClass 0 protostellar binary IRAS 16293-2422 from an unbiased spectral survey with ALMA, Protostellar Interferometric Line Survey(PILS). Here we focus on the new detections of ethylene oxide (c-C2H4O), acetone (CH3COCH3), and propanal (C2H5CHO).Methods. With ALMA, we surveyed the spectral range from 329 to 363 GHz at 0.5′′ (60 AU diameter) resolution. Using a simplemodel for the molecular emission in local thermodynamical equilibrium, the excitation temperatures and column densities of eachspecies were constrained.Results. We successfully detect propanal (44 lines), ethylene oxide (20 lines) and acetone (186 lines) toward one component ofthe protostellar binary, IRAS16293B. The high resolution maps demonstrate that the emission for all investigated species originatesfrom the compact central region close to the protostar. This, along with a derived common excitation temperature of Tex ≈ 125 K, isconsistent with a coexistence of these molecules in the same gas.Conclusions. The observations mark the first detections of acetone, propanal and ethylene oxide toward a low-mass protostar. Therelative abundance ratios of the two sets of isomers, a CH3COCH3/C2H5CHO ratio of 8 and a CH3CHO/c-C2H4O ratio of 12, arecomparable to previous observations toward high-mass protostars. The majority of observed abundance ratios from these results aswell as those measured toward high-mass protostars are up to an order of magnitude above the predictions from chemical models.This may reflect either missing reactions or uncertain rates in the chemical networks. The physical conditions, such as temperaturesor densities, used in the models, may not be applicable to solar-type protostars either.
Key words. astrochemistry – ISM: molecules – ISM: abundances – ISM: individual object: IRAS 16293-2422line: identification – astrobiology
1. Introduction
An important task of modern-day astrochemistry is to under-stand how complex organics and possible pre-biotic moleculesform near young stars. The high sensitivity and angular and spec-tral resolution of the Atacama Large Millimeter/submillimeterArray (ALMA) enables detection of molecular species withfaint emission lines in otherwise confused regions. The capa-bilities of ALMA were demonstrated early on by the first detec-tion of the prebiotic molecule glycolaldehyde toward the low-
Send offprint requests to: J. M. Lykke, e-mail:[email protected]
mass protostar, IRAS 16293-2422 (Jørgensen et al. 2012). Thisdetection illustrates the potential for imaging emission fromthe simplest building blocks for biologically relevant moleculesduring the earliest stages of the Solar System on the scaleswhere protoplanetary disks emerge, and for understanding howthese molecules are formed and in what abundances. This paperpresents the first detections of three such species, ethylene ox-ide (c-C2H4O), propanal (C2H5CHO) and acetone (CH3COCH3)toward IRAS 16293-2422 from an unbiased spectral surveywith ALMA (Protostellar Interferometric Line Survey or PILS;Jørgensen et al. 2016).
Traditionally, detections of complex organic molecules havemostly been associated with the hot cores around high-mass pro-
1
arX
iv:1
611.
0731
4v1
[as
tro-
ph.S
R]
22
Nov
201
6

Lykke et al.: The ALMA-PILS survey: First detections of ethylene oxide, acetone and propanal toward IRAS 16293-2422
tostars toward the warm and dense central regions around suchluminuous sources where the molecules sublimate from the icymantles of dust grains. Some low-mass protostars show similarcharacteristics on small scales; the so-called hot corinos (vanDishoeck & Blake 1998; Bottinelli et al. 2004; Ceccarelli 2004).A prime example of this is IRAS 16293-2422 (IRAS16293 here-after), a protostellar Class 0 binary system, located at a dis-tance of 120 pc (Loinard et al. 2008). IRAS16293 is perhapsthe best low-mass protostellar testbed for astrochemical studies(see, e.g., Blake et al. 1994; van Dishoeck et al. 1995; Ceccarelliet al. 2000; Schoier et al. 2002). It has the brightest lines byfar of all well-studied low-mass protostars and shows detectionsof a wealth of complex organic molecules (Cazaux et al. 2003;Caux et al. 2011). These complex organics arise in the densegas around each of its two binary components that each showdistinct chemical signatures in the warm gas on small scales re-solved by (sub)millimeter wavelength aperture synthesis obser-vations (Bottinelli et al. 2004; Kuan et al. 2004; Bisschop et al.2008; Jørgensen et al. 2011).
To understand how these complex organic molecules form,combinations of systematic studies establishing large invento-ries of similar organic molecules are needed. For this purpose,structural isomers are particularly interesting since they usu-ally share some formation and destruction pathways. The rela-tive abundance of two such isomers may therefore provide im-portant constraints on astrochemical models. Examples of suchinteresting isotope pairs are ethylene oxide and acetaldehydeas well as acetone and propanal. Ethylene oxide was first de-tected toward the galactic center source Sagittarius B2(N) (SgrB2(N)) by Dickens et al. (1997; confirmed by Belloche et al.2013), and has since been observed in several massive star-forming regions (Nummelin et al. 1998; Ikeda et al. 2001) but sofar not toward any low-mass protostar. Acetone (CH3COCH3),also called propanone, was the first molecule with ten atomsto be observed in the ISM. The molecule was first detected inthe hot molecular core Sgr B2 (Combes et al. 1987; Snyderet al. 2002) and later in the Orion-KL star-forming region(Friedel et al. 2005; Friedel & Snyder 2008; Peng et al. 2013).It was also detected toward other massive star-forming regions(Isokoski et al. 2013) as well as toward an intermediate-massprotostar (Fuente et al. 2014). Several lines of the SMA sur-vey of IRAS16293 were also assigned to acetone by Jørgensenet al. (2011), but it has never been properly identified in thissource. More recently, it was found in material from the comet67P/Churyumov-Gerasimenko by the COmetary Sampling AndComposition (COSAC) experiment on Rosetta’s lander Philae(Goesmann et al. 2015). Propanal (C2H5CHO) has previouslybeen detected in Sgr B2(N) by Hollis et al. (2004), where it co-exists with propynal and propenal. It was also detected towardstwo Galactic center molecular clouds by Requena-Torres et al.(2008). Like acetone, propanal was found to be present in thecomet 67P/Churyumov-Gerasimenko (Goesmann et al. 2015).
This paper presents detections of ethylene oxide, acetone andpropanal toward IRAS16293 utilising a large ALMA survey at(sub)millimeter wavelength. These are all first time detections inIRAS16293 and in low-mass protostars in general. In Sect. 2, webriefly describe the observations. The identification and analysisof the data are presented in Sect. 3. Finally, we discuss the resultsin Sect. 4 and conclude in Sect. 5.
2. Observations
IRAS16293 was observed as part of the PILS program (PI: JesK. Jørgensen): the survey consists of an unbiased spectral survey
covering a significant part of ALMA’s Band 7 (wavelengths ofapproximately 0.8 mm) as well as selected windows in ALMA’sBands 3 (at approximately 100 GHz; 3 mm) and 6 ( at approx-imately 230 GHz; 1.3 mm). In this paper we only utilise datafrom the Band 7 part of the survey (project-id: 2013.1.00278.S).An observing log, a description of the data reduction and a firstoverview of the data are presented in Jørgensen et al. (2016) andhere we only summarize a number of the key features of theBand 7 observations.
The Band 7 part of the survey covers the frequency rangefrom 329.15 GHz to 362.90 GHz in full. Data were obtainedfrom both the array of 12 m dishes (typically 35–40 antenna inthe array at the time of observations) and the Atacama CompactArray (ACA), or “Morita Array”, of 7 m dishes (typically 9–10 antenna in use). The pointing center was in both cases setto be a location in-between the two components of the binarysystem at αJ2000 = 16h32m22.72s; δJ2000 = −24◦28′34.′′3. Intotal 18 spectral settings were observed: each setting covers abandwidth of 1875 MHz (over four different spectral windowsof 468.75 MHz wide). To limit the data-rate, the data weredownsampled by a factor two to the native spectral resolutionof the ALMA correlator, resulting in a spectral resolution of0.244 MHz (≈ 0.2 km s−1) over 1920 channels for each spectralwindow. Each setting was observed with approximately 13 min-utes integration on source (execution blocks of approximately40 minutes including calibrations) for the 12 m array and doublethat for the ACA.
The data for each setting were calibrated and a first imag-ing of the continuum was performed. Thereafter, a phase-onlyself-calibration was performed on the continuum images andapplied to the full datacubes before combining the 12 m arrayand ACA data and performing the final cleaning and imaging.The resulting spectral line datacubes have an root mean square(RMS) noise for the combined datasets of approximately 6–8 mJy beam−1 channel−1, which translates into a uniform sen-sitivity better than 5 mJy beam−1 km s−1 with beam sizes rang-ing from ≈0.4–0.7′′ depending on the exact configuration at thedate of observation. The data used in this paper were producedwith a circular restoring beam of 0.5′′ to facilitate the analy-sis across the different spectral windows. The conversion fromRayleigh-Jeans temperature Tb[K] to flux density S ν[Jy/beam]follows the standard formulation and Tb/S ν ranges from 37.2 to45.2 K Jy−1 depending on the frequency. The resulting imagecubes are strongly line-confused toward the locations of the twoprimary protostars. A subtraction of the continuum was there-fore done statistically for each spectral window (for continuummaps and more details see Jørgensen et al. 2016). The contin-uum baseline for each window is found to be robust to withintwice the RMS in each channel.
3. Analysis and results
Interferometric emission maps of two representive lines each forpropanal, acetone, ethylene oxide, and acetaldehyde are shownin Fig. 1. The maps show emission toward both protostellarsources. Generally the lines toward IRAS16293A are approx-imately a factor five broader than toward IRAS16293B (e.g.,Bottinelli et al. 2004; Jørgensen et al. 2011), which makesidentification of individual species challenging. ConsequentlyIRAS16293B is therefore better for separation of blended linesand identification of new species and in this paper we focuson that source. A comparison of the maps for the differentmolecules shows that the emission is marginally resolved towardIRAS16293B, consistent with a deconvolved extent of ≈ 0.5′′
2

Lykke et al.: The ALMA-PILS survey: First detections of ethylene oxide, acetone and propanal toward IRAS 16293-2422
Fig. 1: Integrated intensity maps of the line emission for ac-etaldehyde, ethylene oxide, acetone, and propanal. Left andright columns show maps for transitions with lower and higherEup, respectively. The locations of IRAS16293A (southeast) andIRAS16293B (northwest) are marked by the red plus-signs. Theblue contours represent 4, 8, 12 and 16 σ while the red contoursshow 24, 30, 36 σ, where σ is 5 mJy beam−1 km s−1 for the in-tegrated intensity. A representative beam of 0.5′′ is shown in thelower right-hand corner of each panel.
toward the location of the protostar for all species. We can there-fore assume that these particular molecules coexist and trace thesame gas. Extracting a spectrum from the pixel located on thepeak position will give the highest emission signal, but since thecontinuum is optically thick and very bright there are also veryprominent absorption lines in the spectrum. To reduce the in-fluence of absorption while still retaining as much intensity inthe emission lines as possible, we extracted a spectrum from aposition at αJ2000 = 16h32m22.58s; δJ2000 = −24◦28′32.′′8, corre-sponding to an offset of (−0.45′′ ; −0.30′′) in the southwesterndirection relative to the continuum peak of IRAS16293B. Thisspectrum, corrected for the LSR velocity (VLSR = 2.7 km s−1), isused throughout this paper. Figure 2 shows the observed spectrafor each of the transitions from Fig. 1.
The heavy blending of emission lines at the sensitivity ofALMA complicates the identification and analysis of individualmolecular species. For this purpose we therefore calculate syn-thetic spectra for our target molecules and their physical param-eters are derived by fitting synthetic spectra to the data. For the
342.915 342.9350.0
0.1
0.2 C2H5CHO (94 K; 342.927 GHz)
350.420 350.4400.0
0.1
0.2 C2H5CHO (326 K; 350.431 GHz)
347.835 347.8550.0
0.5
1.0c-C2H4O (111 K; 347.843 GHz)
341.720 341.7400.0
0.4
0.8 c-C2H4O (63 K; 341.730 GHz)
330.755 330.7750.0
0.2
0.4CH3COCH3 (138 K; 330.765 GHz)
352.060 352.0800.0
0.2
0.4CH3COCH3 (300 K; 352.070 GHz)
351.565 351.5850.0
0.5
1.0 CH3CHO (93 K; 351.574 GHz)
348.080 348.1000.0
0.5
1.0 CH3CHO (443 K; 348.088 GHz)
0.0 0.2 0.4 0.6 0.8 1.0
Frequency [GHz]
0.0
0.2
0.4
0.6
0.8
1.0
Inte
nsity
[Jy/
beam
]
Fig. 2: Observed and synthetic spectra of the representative tran-sitions shown in Fig. 1. The observed spectra are extracted at aposition (−0.45′′ ; −0.30′′) southwest of the continuum peak ofIRAS16293B.
purpose of excluding blended lines from the analysis, we createa reference model containing the synthetic spectrum of emis-sion lines of previously detected complex organic moleculesthat are expected to be present in the warm gas toward the twosources (Bisschop et al. 2008; Jørgensen et al. 2011, 2012, 2016;Coutens et al. 2016). Superimposing the reference model spec-trum onto the observed spectrum reveals if a line of interest isblended with any of these species. For our analysis we excludelines that are severely blended, that is, where the peaks of theemission lines overlap. In addition, we have also checked thelines of interest against other species in the CDMS1 and JPL2
databases (Muller et al. 2001, 2005; Pickett et al. 1998) with theCASSIS3 software and do not find any clear overlap with anyother potential interstellar species.
The synthetic spectra are computed following the approachdescribed in Goldsmith & Langer (1999). We assume thatthe molecular excitation obeys local thermodynamic equilib-rium (LTE), which is reasonable at the densities and scales ofthe ALMA observations toward IRAS16293B (Jørgensen et al.2016), and calculate a synthetic spectrum of all transitions froma molecule given a line width, column density, rotational tem-perature, and source size, assuming Gaussian line profiles. Thespectroscopic data for propanal (Butcher & Wilson jr. 1964;Hardy et al. 1982; Demaison et al. 1987) and ethylene oxide(Cunningham Jr. et al. 1951; Creswell & Schwendemann 1974;Hirose 1974; Pan et al. 1998; Medcraft et al. 2012) are availablefrom the CDMS database, while the spectroscopic data for ace-tone (Groner et al. 2002) and acetaldehyde (Kleiner et al. 1996)are available from the JPL database.
1 http://www.astro.uni-koeln.de/cdms2 http://spec.jpl.nasa.gov/3 http://cassis.irap.omp.eu/
3

Lykke et al.: The ALMA-PILS survey: First detections of ethylene oxide, acetone and propanal toward IRAS 16293-2422
For the analysis we started by identifying the brightest po-tential lines of each of the relevant species adopting a full widthhalf maximum (FWHM) line width and the source size remainedfixed at 1.0 km s−1 and 0.5′′, respectively. We then generateda synthetic spectrum by adjusting the temperature and columndensity (Ntot) until a good fit for those lines was obtained. Fromthis a priori spectrum, we identified approximately ten reason-ably non-blended and optically thin (τ ≤ 0.1) lines for eachspecies, which we use to minimize the reduced chi-squaredstatistic:
χ2red. =
1N
N∑i=1
(Iobs, i − Isyn, i
)σi
2
, (1)
where Iobs and Isyn are the intensities of the observed and syn-thetic emission lines, respectively, N is the number of lines ana-lyzed andσ the RMS error. In the analysis, we varied the columndensity from 1.0×1014 cm−2 – 1.0×1018 cm−2 with small incre-ments and the temperature from 100 K – 400 K with incrementsof 25 K, generating a new synthetic spectrum at each incrementto evaluate against the observed spectrum at the locations of thechosen lines. Since the emission lines are blended, the reducedχ2 is only calculated for the average value of the channels at thevery peak of the lines (corresponding to the predicted frequencyof the peak ± 0.25 MHz), instead of over the entire Gaussian bellcurve.
From the reduced χ2 analysis, acetaldehyde and ethylene ox-ide show the best fit at Tex ≈ 125 K, while it is difficult to con-strain the excitation temperature for propanal and acetone. Ouranalysis shows that the column densities do not vary greatlywith temperature for all species, except for acetone, where aTex=400 K results in a column density a factor of ten higherthan for Tex=100 K. A comparison between the synthetic andobserved spectrum for acetone reveals that an excitation temper-ature of approximately 200 K could still be in agreement withthe observations, but that a Tex of 300 K overproduces some ofthe lines. Since it appears that the molecules are spatially coex-isting and trace the same gas, we therefore assume Tex = 125 Kfor all molecules. The resulting column densities are summa-rized in Table 1 and the relative abundance ratios of the differentisomers are listed in Table 2. The uncertainties of Tex and Ntotare dominated by the assumptions that go into the analysis, thatis, LTE and Gaussian line profiles, instead of the statistical error.Therefore, the uncertainties are estimated to ∼ 50% and 25 K onthe column density and the emission temperature, respectively.
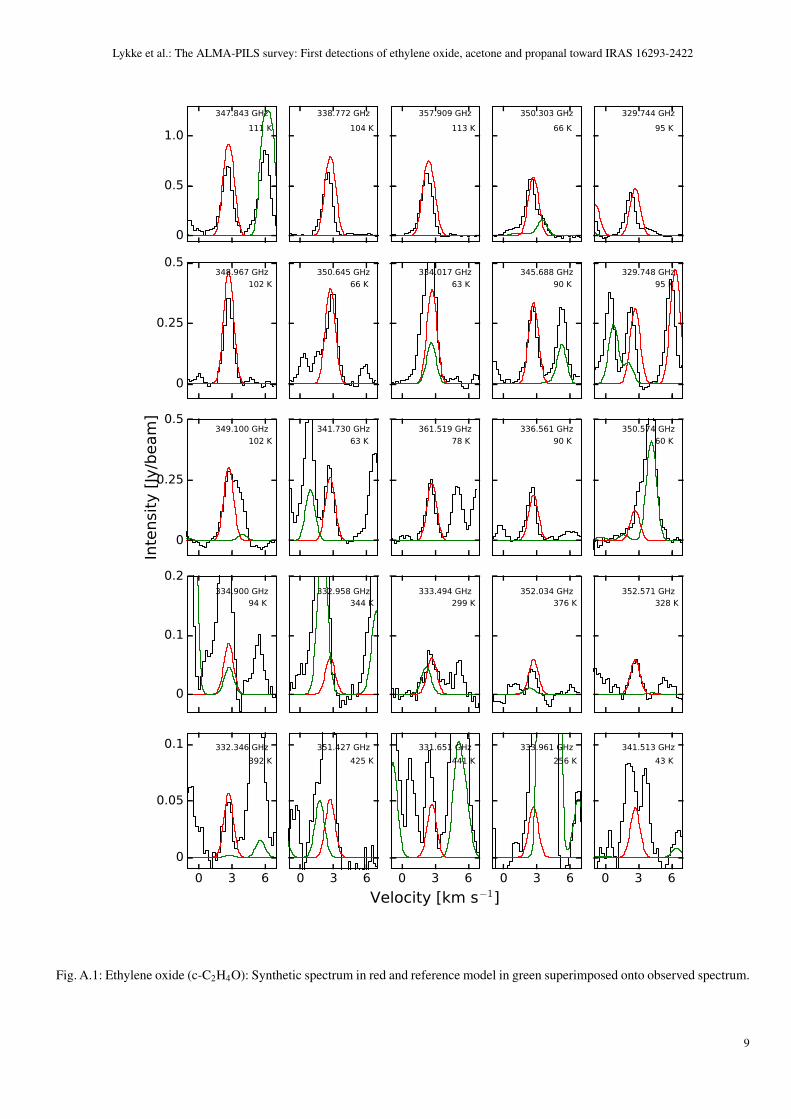
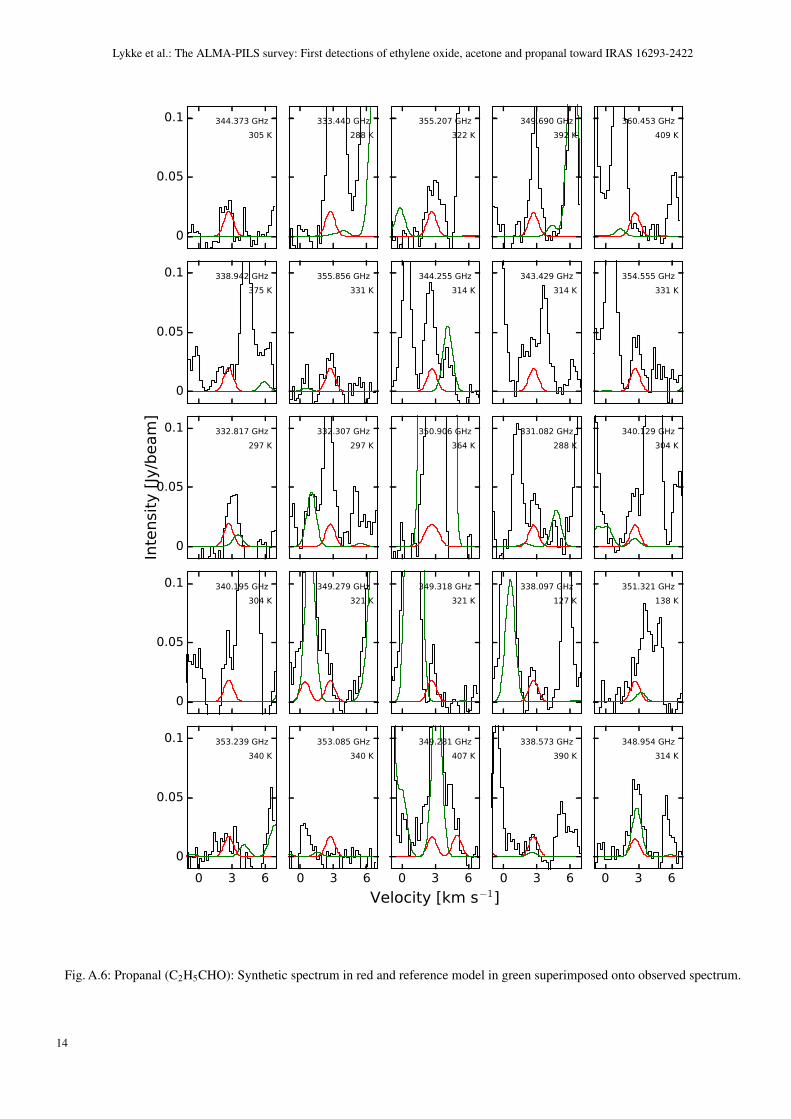
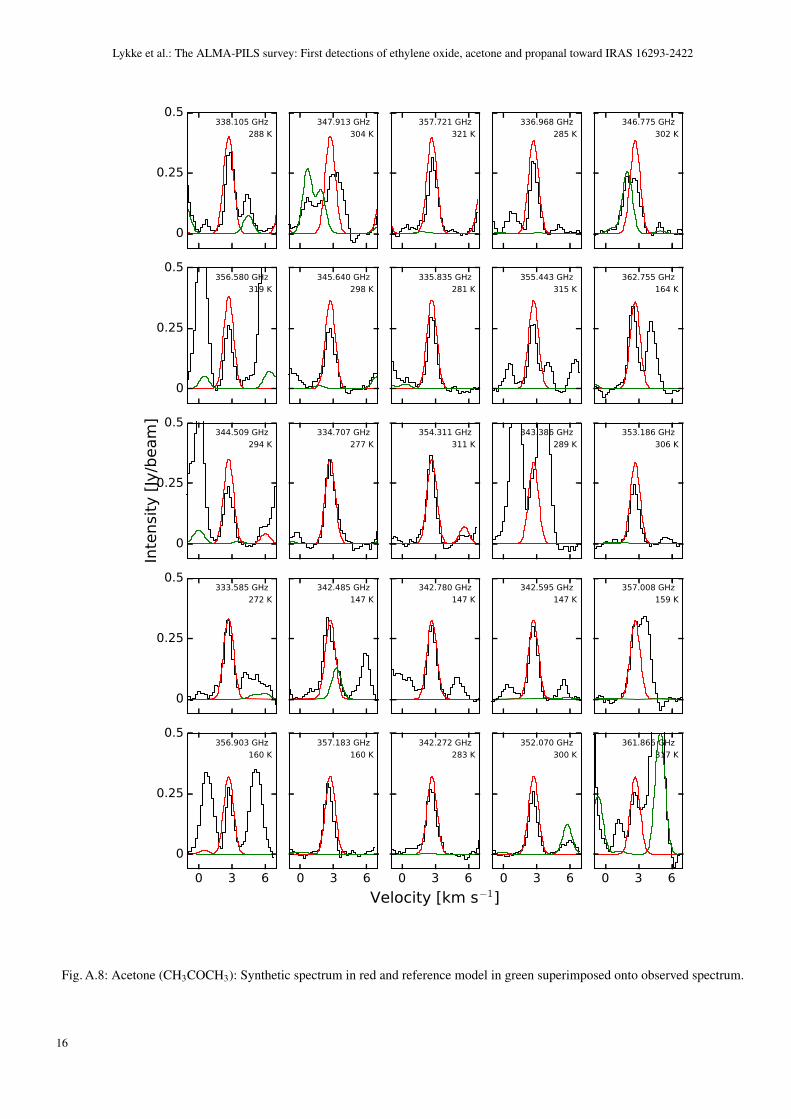
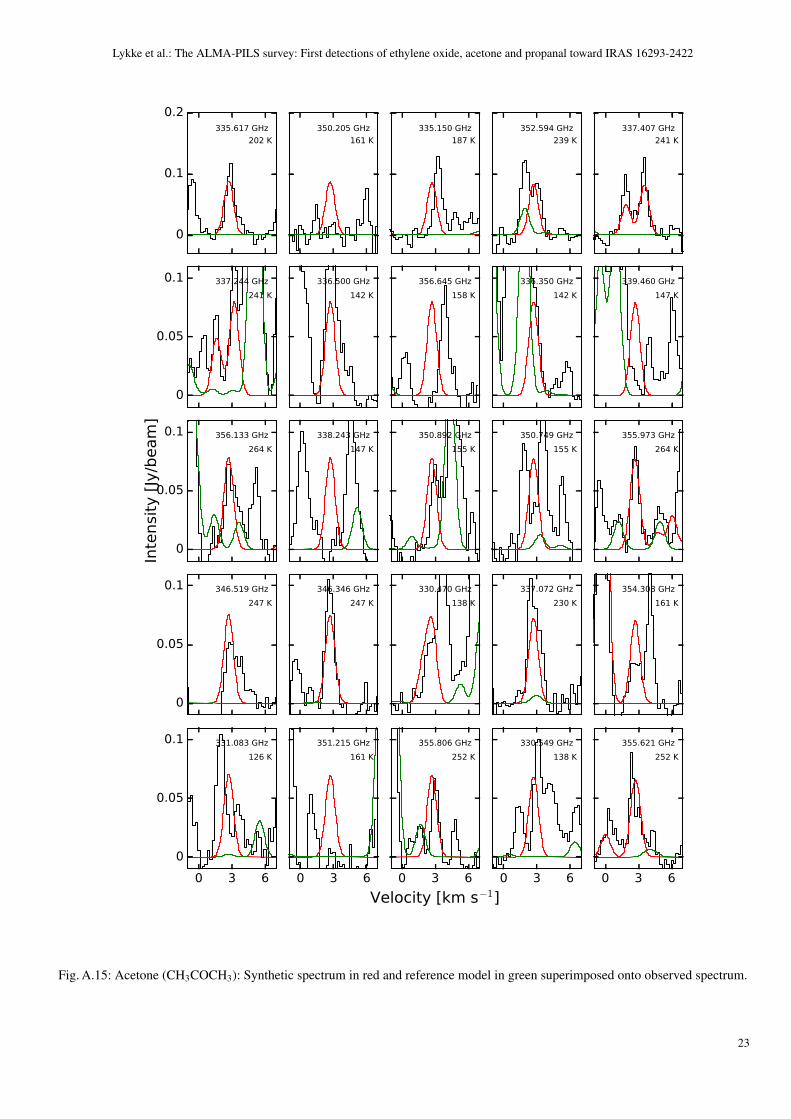
Figs. A.1–A.19 in the Appendix show the synthetic spectraof ethylene oxide, propanal, and acetone, respectively, as wellas the reference model superimposed on the observed spectrumfor all lines where the synthetic spectrum predicts a peak lineintensity equal to or above twice the RMS noise of the spec-trum. The lines are sorted into descending intensity. We checkeach line in the synthetic spectra against the observed spectrumfor each molecule, and the majority of them provide a reason-able match, within the estimated uncertainty. We claim a detec-tion for lines i) that are reasonably well separated from otherspecies in the reference model and ii) where the integrated linestrength over FWHM is larger than three times the statistical un-certainty (
√nchan×RMS) of the line and iii) where there is a rea-
sonably good fit between the synthetic and the observed spec-trum. Table B.1 in the appendix lists the spectroscopic catalogvalues, the integrated intensity over the FWHM for the observedspectrum, and the detection level for the detected lines of ethy-lene oxide, propanal, and acetone. The transitions are listed with
Table 1: Best fit column densities
Molecule Ntot [cm−2]Acetone CH3COCH3 1.7 × 10¹⁶
Propanal C2H5CHO 2.2 × 10¹⁵
Acetaldehyde CH3CHO 7.0 × 10¹⁶
Ethylene oxide c-C2H4O 6.1 × 10¹⁵
Notes. The results are derived assuming θsource = 0.5′′, Tex = 125 K andFWHM = 1.0 km s−1. The column density of propanal was corrected bya factor of 1.489 to take into account the vibrational and conformationalcontribution at T = 125 K.
increasing frequency and it should be noted that many of the de-tected lines are a blend of several internal rotation components.
For ethylene oxide, propanal, and acetone, we detected 20,44, and 186 lines, respectively. Some of the acetone lines pre-dicted by the models appear to be either slightly shifted or miss-ing. In some cases, this can be explained by the presence of ab-sorption at the same frequency as the predicted lines, but in mostcases these lines correspond to transitions with both high Ka andlow Kc quantum numbers (see Table C.1). None of the missingor shifted lines with high Ka and low Kc numbers were used forthe determination of the spectroscopic parameters. It was admit-ted by Groner et al. (2002) that these lines do not fit very well.It could be due to perturbations from interactions between the(high Ka, low Kc) levels and the levels from the lowest torsionalexcited states (Groner et al. 2002).
We also search for vinyl alcohol (Saito 1976), another iso-mer of acetaldehyde and ethylene oxide, but no detection can beclaimed so far. With a conservative upper limit of 2× 1015 cm−2
for the syn form (the lowest energy form of vinyl alcohol), thisisomer is less abundant than acetaldehyde and ethylene oxide,similarly to what was found in Sgr B2 by Belloche et al. (2013).
4. Discussion
As described in the introduction, the relative abundances of thedifferent isomers are important constraints on chemical modelsand provide insight into the formation of the complex species.Table 2 lists the different abundance ratios and Fig. 3 gives aschematic overview of the entries from the table. A number ofdifferent formation pathways have been proposed for the studiedspecies.
For acetone, the ion-molecule radiative association reaction
CH+3 + CH3CHO→ (CH3)2CHO+ + hν, (2)
followed by
(CH3)2CHO+ + e− → CH3COCH3 + H, (3)
proposed by Combes et al. (1987) has been shown not to be effi-cient enough to produce the observed values (Herbst et al. 1990).In the model presented by Garrod et al. (2008), acetone is formedon grains by the addition of CH3 to CH3CO.
Hollis et al. (2004) proposed the formation of propanal tooccur through simple successive hydrogenation:
HC2CHO + 2H→ CH2CHCHO + 2H→ C2H5CHO. (4)
However, Garrod (2013) proposed a different formation routethrough the addition of HCO and C2H5 radicals on grains.Garrod (2013) found the formation to be most rapid at 30 K,when sublimation of grain-surface methane (CH4) is most effi-cient.
4

Lykke et al.: The ALMA-PILS survey: First detections of ethylene oxide, acetone and propanal toward IRAS 16293-2422
Table 2: Relative abundances in different sources
Source CH3COCH3 / C2H5CHO CH3CHO / c-C2H4O ReferencesIRAS16293-2422 8 12 this studySgr B2(N) ≥ 3.6 − 14.5(a) 3.7 − 7.4(b) Belloche et al. (2013)Survey of massive SF regions – 1.2 − 13.2 Ikeda et al. (2001)Chemical model: peak gas-phase 0.22: 0.83: 0.07(c) – Garrod (2013)Chemical model: peak grain-surface 0.37: 2.3: 0.39(c) – Garrod (2013)Chemical model of hot cores – 1(d) Occhiogrosso et al. (2014)
Notes. (a) Range reflects span for rotational states in the Voff = 0 km s−1 and the Voff = 10 km s−1 components of Sgr B2(N). Propanal is notdetected, therefore the upper limit is used after correction for a similar beam filling factor. (b) Range reflects span for the rotational and firsttorsionally (3t=1) excited states of acetaldehyde in the Voff = -1 km s−1 component of Sgr B2(N).(c) Chemical model of hot cores for a slow,medium, and fast model, respectively.(d) The MONACO code (at 200 K and 1.2 × 10⁶ yrs).
Laboratory experiments were conducted by Bennett et al.(2005a,b) to study the synthesis of acetaldehyde, ethylene ox-ide, and vinyl alcohol in interstellar and cometary ices after irra-diation with energetic electrons. Acetaldehyde appeared to beformed in both CO–CH4 and CO2–C2H4 ice mixtures, whileethylene oxide and vinyl alcohol are only detected in CO2–C2H4ice mixtures (Bennett et al. 2005a,b). While CO, CO2, and CH4have been observed in interstellar ices, C2H4 is formed as a sec-ondary product by charged particle irradiation and photolysis ofCH4 ices and it is therefore likely only present in small con-centrations (Bennett et al. 2005b) although it may be formedthrough gas-phase mechanisms under cold, dense conditions.Thus, assuming the relative production rates of acetaldehyde,ethylene oxide and vinyl alcohol are similar, the fractional abun-dance of acetaldehyde is expected to be higher than that of ethy-lene oxide and vinyl alcohol (Bennett et al. 2005b).
4.1. Propanal and acetone
We have compared our results to predictions from thethree-phase (mantle/surface/gas) astrochemical kinetics model,MAGICKAL (Model for Astrophysical Gas and Ice ChemicalKinetics And Layering), as presented in Garrod (2013). By ap-plying a chemical network to hot-core conditions, the model fol-lows the physico-chemical evolution of a parcel of material fromthe core from the free-fall collapse of the cloud to the subsequentwarm-up phase of the dense core from 8 to 400 K (Garrod 2013).MAGICKAL employs a (modified) rate-equation approach tosolve the coupled ice mantle, ice-surface, and gas-phase chem-istry allowing radicals on the grains to meet via thermal diffusionat intermediate temperatures and form more complex moleculesprior to the complete sublimation of the dust-grain ice at highertemperatures. Garrod (2013) uses three different warm-up mod-els: fast, medium and slow. Here we compare our results to allthree models, but note that the fast warm-up model should, inprinciple, be the best match to the observations because the timefor this model to reach 200 K is 5 × 10⁴ yr which is compara-ble to the dynamical age of ∼ 1–3 × 10⁴ yr for IRAS16293 asderived by Schoier et al. (2002).
Garrod (2013) finds relative peak gas-phase abundances ofCH3COCH3/ C2H5CHO of 0.22, 0.83, and 0.07 for the fast,medium and slow model, respectively. All three models predict ahigher abundance of propanal compared to acetone, which is theopposite trend of our ratio of eight. Also, the upper limit towardSgr B2(N) reported by Belloche et al. (2013) translates into alower limit for CH3COCH3/C2H5CHO of 3.6, which is consis-tent with our findings. One explanation may be that the modelof Garrod (2013) uses a relatively low binding energy for ace-tone (3500 K), producing a desorption temperature of approx-
imately 70 K. As discussed by Garrod et al. (2008), this low-temperature desorption results in rapid destruction of acetonein the gas-phase. Our observational fit to the excitation temper-ature of 125 K suggests that acetone is more likely desorbedfrom grains at the higher temperatures more commonly associ-ated with complex organics, which would allow the majority ofgrain-surface formed acetone to survive for a significant periodin the gas phase.
If we compare the peak grain-surface abundances of acetoneand propanal produced in the Garrod (2013) chemical modelwhich would be more representative of this situation, ratios of0.37, 2.3, and 0.39 are obtained, respectively. The quantities ofacetone and propanal produced on grains in the model are, inthe case of the intermediate warm-up timescale, only a factorof a few below the observed ratio. However, it should be bornein mind that the efficient production of acetone depends, in thismodel, on the rate at which the CH3CO radical may be producedon the grains. This may be achieved either through direct pho-todissociation of CH3CHO or by the abstraction of a H-atomfrom this molecule by OH or NH2. The rates of each of theseprocesses are not well defined by experiment, and these uncer-tainties could easily induce a variation in acetone productionof a few factors. It is also likely that the physical conditions,which in the Garrod (2013) model are generic, representativehot-core conditions, may not be accurate for the specific case ofIRAS16293.
4.2. Ethylene oxide and acetaldehyde
Ikeda et al. (2001) searched for acetaldehyde and ethylene ox-ide in several massive star-forming regions. They detect bothmolecules in ten sources and find CH3CHO/c-C2H4O spanninga range from 1.2 in Sgr B2(N) to 13.2 in W51e1/e2. Bellocheet al. (2013) also observed these molecules towards Sgr B2(N)and found a slightly higher value than Ikeda et al. (2001) of 3.7–7.4. It thus seems that our observed value of 12 in a low-massYSO is toward the high end of the range observed in these high-mass regions, but that source-to-source variations may be largerthan between the different groups of sources.
Occhiogrosso et al. (2014) used a two-stage (grain/gas)model, MONACO, to predict the gaseous acetaldehyde and ethy-lene oxide abundances during the cooling-down and subsequentwarm-up phase of a hot core. At 200 K and 1.2 × 10⁶ yrs,the fractional abundance of ethylene oxide and acetaldehydewith respect to total H is 2 × 10⁻⁹ for both molecules, whichmeans that the relative abundance between the two species isunity. As previously mentioned, based on their laboratory exper-iments, Bennett et al. (2005a,b) expect the relative abundanceof CH3CHO / c-C2H4O to be larger than unity. Again, it seems
5

Lykke et al.: The ALMA-PILS survey: First detections of ethylene oxide, acetone and propanal toward IRAS 16293-2422
Fig. 3: Bar plot of the relative abundances of CH3COCH3/ C2H5CHO and CH3CHO/ c-C2H4O from Table 1. The observations areindicated by color bars, while the chemical predictions are shown by white bars with different circle sizes. The two lower limitsderived by Belloche et al. (2013) for CH3COCH3/C2H5CHO are illustrated by upward arrows. The range of CH3CHO/ c-C2H4Oratios determined in ten sources by Ikeda et al. (2001) is indicated by the hatched area. For the CH3CHO/ c-C2H4O ratio fromBelloche et al. (2013), we used the average value of the column densities of the rotational and first torsionally (vt = 1) excited statesof acetaldehyde.
that there are some variations in the observed acetaldehyde–to–ethylene oxide ratios, and that the model results of Occhiogrossoet al. (2014) best reproduce the lower end in that range, whileour measurements are at the opposite end, more than an order ofmagnitude above. Nevertheless, given the variations seen in themodels for acetone and propanal, whether the specific physicalstructures of the sources can be part of the explanation remainsto be explored.
5. Conclusion
We have carried out the first investigation of the oxygen bearingspecies in the ALMA PILS survey of the protostellar binary sys-tem IRAS16293. Our main findings are summarized as follows:
1. We have detected the molecules ethylene oxide (c-C2H4O),acetone (CH3COCH3), and propanal (C2H5CHO) for thefirst time toward a solar-type protostar. We have verifiedthat the emission of these species, along with acetalde-hyde (CH3CHO), originates from the compact central regionof the protostar, which confirms our assumption that thesemolecules spatially coexist. We determined a common exci-tation temperature, Tex ≈ 125 K for all four molecules anduse this to determine column densities for each species.
2. Compared to previous observations, our results for the rel-ative abundance ratio of CH3COCH3/C2H5CHO are consis-tent with the lower limit found by Belloche et al. (2013) of
SgrB2(N). The ratio for CH3CHO/c-C2H4O is comparableto the largest value in the span of observed values of high-mass sources from Ikeda et al. (2001) (variation between thesources in that sample of approximately an order of mag-nitude). This suggests that the chemistry in the most centralpart of IRAS16293 (the hot corino region) is not significantlydifferent from those of the high-mass hot cores, but that theremay still be measurable source-to-source variations.
3. Contrary to our result, the models in Garrod (2013) pre-dict propanal to be more abundant than acetone, except forthe peak grain-surface abundances in the medium warm-up model, where the prediction is only few factors differ-ent from our result. Occhiogrosso et al. (2014) find the ratioof CH3CHO/c-C2H4O to be unity which is consistent withthe lowest observed value of a high-mass star forming re-gion (Ikeda et al. (2001)). All of the models investigatedhere return low relative abundances compared to our results,but they are however in reasonable agreement with the low-est value in the ranges reported by Ikeda et al. (2001) andBelloche et al. (2013).
The results from this paper imply that although the chemicalmodels can reproduce the observations for some high-mass pro-tostars reasonably well, they need to be modified to reflect theobserved range of values for high-mass sources as well as ourlow-mass source. As discussed, the models would improve withbetter-defined reaction rates while including more species in thechemical networks could also improve model predictions. More
6

Lykke et al.: The ALMA-PILS survey: First detections of ethylene oxide, acetone and propanal toward IRAS 16293-2422
observations, in particular toward low-mass sources, are neededfor comparison with models to further constrain the formationpathways.
The detections also demonstrate the great potential of spec-tral surveys such as PILS for identifying new species that haveso far gone undetected toward solar-type stars. New detectionsof complex organic molecules and the determination of their rel-ative abundances for the first time in a solar-type protostar isimportant because it substantiates the chemical complexity ofIRAS16293 and can be used to constrain astrochemical mod-els. The relative abundances reveal information of the formationpathway of the molecules and enable comparisons with modelsand laboratory experiments. In addition, the comparison of theratios found in high-mass sources and low-mass protostars is vi-tal to understanding the environmental effects on the formationof different molecular species.
Acknowledgements. This research was made possible through a LundbeckFoundation Group Leader Fellowship as well as the European Research Council(ERC) under the European Union Horizon 2020 research and innovation pro-gramme (grant agreement No 646908) through ERC Consolidator Grant “S4F”to JKJ. Research at Centre for Star and Planet Formation is funded by the DanishNational Research Foundation. The work of A.C. was funded by the STFCgrant ST/M001334/1. A.C. thanks the COST action CM1401 Our AstrochemicalHistory for additional financial support. RTG acknowledges the support of theNASA APRA program, though grant NNX15AG07G. Astrochemistry in Leidenis supported by the European Union A-ERC grant 291141 CHEMPLAN, by theNetherlands Research School for Astronomy (NOVA), by a Royal NetherlandsAcademy of Arts and Sciences (KNAW) professor prize. The research leadingto these results has received funding from the European Commission SeventhFramework Programme (FP/2007-2013) under grant agreement No 283393(RadioNet3).
This paper makes use of the following ALMA data:ADS/JAO.ALMA#2013.1.00278.S. ALMA is a partnership of ESO (rep-resenting its member states), NSF (USA) and NINS (Japan), together with NRC(Canada) and NSC and ASIAA (Taiwan), in cooperation with the Republicof Chile. The Joint ALMA Observatory is operated by ESO, AUI/NRAO andNAOJ.
ReferencesBelloche, A., Muller, H. S. P., Menten, K. M., Schilke, P., & Comito, C. 2013,
A&A, 559, A47Bennett, C. J., Jamieson, C. S., Osamura, Y., & Kaiser, R. I. 2005a, ApJ, 624,
1097Bennett, C. J., Osamura, Y., Lebar, M. D., & Kaiser, R. I. 2005b, ApJ, 634, 698Bisschop, S. E., Jørgensen, J. K., Bourke, T. L., Bottinelli, S., & van Dishoeck,
E. F. 2008, A&A, 488, 959Blake, G. A., van Dishoeck, E. F., Jansen, D. J., Groesbeck, T. D., & Mundy,
L. G. 1994, ApJ, 428, 680Bottinelli, S., Ceccarelli, C., Neri, R., et al. 2004, ApJ, 617, L69Butcher, S. S. & Wilson jr., E. B. 1964, J. Chem. Phys., 40, 1671Caux, E., Kahane, C., Castets, A., et al. 2011, A&A, 532, A23Cazaux, S., Tielens, A. G. G. M., Ceccarelli, C., et al. 2003, ApJ, 593, L51Ceccarelli, C. 2004, in Astronomical Society of the Pacific Conference Series,
Vol. 323, Star Formation in the Interstellar Medium: In Honor of DavidHollenbach, ed. D. Johnstone, F. C. Adams, D. N. C. Lin, D. A. Neufeld,& E. C. Ostriker, 195
Ceccarelli, C., Castets, A., Caux, E., et al. 2000, A&A, 355, 1129Combes, F., Gerin, M., Wootten, A., et al. 1987, A&A, 180, L13Coutens, A., Jørgensen, J. K., van der Wiel, M. H. D., et al. 2016, A&A, 590, L6Creswell, R. A. & Schwendemann, R. H. 1974, Chem. Phys. Lett, 27, 521Cunningham Jr., G. L., Boyd, A. W., Mayers, R. J., Gwinn, W. D., & Le Van,
W. I. 1951, J. Chem. Phys., 19, 676Demaison, J., Maes, H., van Eijck, B. P., Wlodarczak, G., & Lasne, M. C. 1987,
J. Mol. Spectrosc., 125, 214Dickens, J. E., Irvine, W. M., Ohishi, M., et al. 1997, ApJ, 489, 753Friedel, D. N. & Snyder, L. E. 2008, ApJ, 672, 962Friedel, D. N., Snyder, L. E., Remijan, A. J., & Turner, B. E. 2005, ApJ, 632,
L95Fuente, A., Cernicharo, J., Caselli, P., et al. 2014, A&A, 568, A65Garrod, R. T. 2013, ApJ, 765, 60Garrod, R. T., Weaver, S. L. W., & Herbst, E. 2008, ApJ, 682, 283
Goesmann, F., Rosenbauer, H., Bredehoft, J. H., et al. 2015, Science, 349,020689
Goldsmith, P. F. & Langer, W. D. 1999, ApJ, 517, 209Groner, P., Albert, S., Herbst, E., et al. 2002, ApJS, 142, 145Hardy, J. A., Cox, A. P., Fliege, E., & Dreizler, H. 1982, Z. Naturforsch, 37,
1035Herbst, E., Giles, K., & Smith, D. 1990, ApJ, 358, 468Hirose, C. 1974, ApJ, 189, L145Hollis, J. M., Jewell, P. R., Lovas, F. J., Remijan, A., & Møllendal, H. 2004, ApJ,
610, L21Ikeda, M., Ohishi, M., Nummelin, A., et al. 2001, ApJ, 560, 792Isokoski, K., Bottinelli, S., & van Dishoeck, E. F. 2013, A&A, 554, A100Jørgensen, J. K., Bourke, T. L., Nguyen Luong, Q., & Takakuwa, S. 2011, A&A,
534, A100Jørgensen, J. K., Favre, C., Bisschop, S. E., et al. 2012, ApJ, 757, L4Jørgensen, J. K., van der Wiel, M. H. D., Coutens, A., et al. 2016, A&A, in pressKleiner, I., Lovas, F. J., & Godefroid, M. 1996, Journal of Physical and Chemical
Reference Data, 25, 1113Kuan, Y., Huang, H., Charnley, S. B., et al. 2004, ApJ, 616, L27Loinard, L., Torres, R. M., Mioduszewski, A. J., & Rodrıguez, L. F. 2008, ApJ,
675, L29Medcraft, C., Thompson, C. D., Robertson, E. G., Appadoo, D. R. T., &
McNaughton, D. 2012, ApJ, 753, 18Muller, H. S. P., Schloder, F., Stutzki, J., & Winnewisser, G. 2005, Journal of
Molecular Structure, 742, 215Muller, H. S. P., Thorwirth, S., Roth, D. A., & Winnewisser, G. 2001, A&A, 370,
L49Nummelin, A., Dickens, J. E., Bergman, P., et al. 1998, A&A, 337, 275Occhiogrosso, A., Vasyunin, A., Herbst, E., et al. 2014, A&A, 564, A123Pan, J., Albert, S., Sastry, K. V. L. N., Herbst, E., & De Lucia, F. C. 1998, ApJ,
499, 517Peng, T.-C., Despois, D., Brouillet, N., et al. 2013, A&A, 554, A78Pickett, H. M., Poynter, I. R. L., Cohen, E. A., et al. 1998, Journal of Quantitative
Spectroscopy and Radiative Transfer, 60, 883Requena-Torres, M. A., Martın-Pintado, J., Martın, S., & Morris, M. R. 2008,
ApJ, 672, 352Saito, S. 1976, Chemical Physics Letters, 42, 399Schoier, F. L., Jørgensen, J. K., van Dishoeck, E. F., & Blake, G. A. 2002, A&A,
390, 1001Snyder, L. E., Lovas, F. J., Mehringer, D. M., et al. 2002, ApJ, 578, 245van Dishoeck, E. F. & Blake, G. A. 1998, ARA&A, 36, 317van Dishoeck, E. F., Blake, G. A., Jansen, D. J., & Groesbeck, T. D. 1995, ApJ,
447, 760
7

Lykke et al.: The ALMA-PILS survey: First detections of ethylene oxide, acetone and propanal toward IRAS 16293-2422
Appendix A: Observed and synthetic spectra
8
Lykke et al.: The ALMA-PILS survey: First detections of ethylene oxide, acetone and propanal toward IRAS 16293-2422
Fig. A.1: Ethylene oxide (c-C2H4O): Synthetic spectrum in red and reference model in green superimposed onto observed spectrum.
9

Lykke et al.: The ALMA-PILS survey: First detections of ethylene oxide, acetone and propanal toward IRAS 16293-2422
Fig. A.2: Ethylene oxide (c-C2H4O): Synthetic spectrum in red and reference model in green superimposed onto observed spectrum.
10

Lykke et al.: The ALMA-PILS survey: First detections of ethylene oxide, acetone and propanal toward IRAS 16293-2422
Fig. A.3: Propanal (C2H5CHO): Synthetic spectrum in red and reference model in green superimposed onto observed spectrum.
11

Lykke et al.: The ALMA-PILS survey: First detections of ethylene oxide, acetone and propanal toward IRAS 16293-2422
Fig. A.4: Propanal (C2H5CHO): Synthetic spectrum in red and reference model in green superimposed onto observed spectrum.
12

Lykke et al.: The ALMA-PILS survey: First detections of ethylene oxide, acetone and propanal toward IRAS 16293-2422
Fig. A.5: Propanal (C2H5CHO): Synthetic spectrum in red and reference model in green superimposed onto observed spectrum.
13
Lykke et al.: The ALMA-PILS survey: First detections of ethylene oxide, acetone and propanal toward IRAS 16293-2422
Fig. A.6: Propanal (C2H5CHO): Synthetic spectrum in red and reference model in green superimposed onto observed spectrum.
14

Lykke et al.: The ALMA-PILS survey: First detections of ethylene oxide, acetone and propanal toward IRAS 16293-2422
Fig. A.7: Propanal (C2H5CHO): Synthetic spectrum in red and reference model in green superimposed onto observed spectrum.
15
Lykke et al.: The ALMA-PILS survey: First detections of ethylene oxide, acetone and propanal toward IRAS 16293-2422
Fig. A.8: Acetone (CH3COCH3): Synthetic spectrum in red and reference model in green superimposed onto observed spectrum.
16

Lykke et al.: The ALMA-PILS survey: First detections of ethylene oxide, acetone and propanal toward IRAS 16293-2422
Fig. A.9: Acetone (CH3COCH3): Synthetic spectrum in red and reference model in green superimposed onto observed spectrum.
17

Lykke et al.: The ALMA-PILS survey: First detections of ethylene oxide, acetone and propanal toward IRAS 16293-2422
Fig. A.10: Acetone (CH3COCH3): Synthetic spectrum in red and reference model in green superimposed onto observed spectrum.
18

Lykke et al.: The ALMA-PILS survey: First detections of ethylene oxide, acetone and propanal toward IRAS 16293-2422
Fig. A.11: Acetone (CH3COCH3): Synthetic spectrum in red and reference model in green superimposed onto observed spectrum.
19

Lykke et al.: The ALMA-PILS survey: First detections of ethylene oxide, acetone and propanal toward IRAS 16293-2422
Fig. A.12: Acetone (CH3COCH3): Synthetic spectrum in red and reference model in green superimposed onto observed spectrum.
20

Lykke et al.: The ALMA-PILS survey: First detections of ethylene oxide, acetone and propanal toward IRAS 16293-2422
Fig. A.13: Acetone (CH3COCH3): Synthetic spectrum in red and reference model in green superimposed onto observed spectrum.
21

Lykke et al.: The ALMA-PILS survey: First detections of ethylene oxide, acetone and propanal toward IRAS 16293-2422
Fig. A.14: Acetone (CH3COCH3): Synthetic spectrum in red and reference model in green superimposed onto observed spectrum.
22
Lykke et al.: The ALMA-PILS survey: First detections of ethylene oxide, acetone and propanal toward IRAS 16293-2422
Fig. A.15: Acetone (CH3COCH3): Synthetic spectrum in red and reference model in green superimposed onto observed spectrum.
23

Lykke et al.: The ALMA-PILS survey: First detections of ethylene oxide, acetone and propanal toward IRAS 16293-2422
Fig. A.16: Acetone (CH3COCH3): Synthetic spectrum in red and reference model in green superimposed onto observed spectrum.
24

Lykke et al.: The ALMA-PILS survey: First detections of ethylene oxide, acetone and propanal toward IRAS 16293-2422
Fig. A.17: Acetone (CH3COCH3): Synthetic spectrum in red and reference model in green superimposed onto observed spectrum.
25

Lykke et al.: The ALMA-PILS survey: First detections of ethylene oxide, acetone and propanal toward IRAS 16293-2422
Fig. A.18: Acetone (CH3COCH3): Synthetic spectrum in red and reference model in green superimposed onto observed spectrum.
26

Lykke et al.: The ALMA-PILS survey: First detections of ethylene oxide, acetone and propanal toward IRAS 16293-2422
Fig. A.19: Acetone (CH3COCH3): Synthetic spectrum in red and reference model in green superimposed onto observed spectrum.
27

Lykke et al.: The ALMA-PILS survey: First detections of ethylene oxide, acetone and propanal toward IRAS 16293-2422
Appendix B: Detected lines
Table B.1: Catalog values for the detected propanal, ethylene oxide and acetone transitions and the integrated line strength of thesynthetic spectrum. Due to line contamination, the integrated line strength is given for the FWHM of the Gaussian function.
Transition Frequency Eup log10(Aul) τ∫
FWHM I δ3 Detection level[MHz] [K] [s−1] [J beam−1 km s−1]
Ethylene oxide (c-C2H4O)102,8 − 93,7 329744.34 95 -3.3018 5.33e-01 0.248 69103,8 − 92,7 329748.33 95 -3.3019 3.20e-01 0.147 41225,17 − 224,18 331651.32 441 -3.7416 2.58e-02 0.064 18226,17 − 225,18 331651.32 441 -3.7416 1.55e-02 0.064 18214,17 − 213,18 332345.92 392 -3.8096 1.87e-02 0.034 10215,17 − 214,18 332345.92 392 -3.8097 3.12e-02 0.034 1094,5 − 85,4 336561.39 90 -3.5297 1.71e-01 0.156 44117,5 − 108,2 338295.96 138 -4.5667 2.15e-02 0.027 8111,10 − 102,9 338771.98 104 -3.1922 4.00e-01 0.428 120112,10 − 101,9 338771.98 104 -3.1921 6.66e-01 0.428 12076,1 − 65,2 341730.22 63 -3.3675 2.38e-01 0.229 6495,5 − 84,4 345688.32 90 -3.4727 3.09e-01 0.249 70120,12 − 111,11 347843.06 111 -3.1026 7.99e-01 0.542 151121,12 − 110,11 347843.10 111 -3.1027 4.79e-01 0.542 151103,7 − 94,6 348966.62 102 -3.3039 4.50e-01 0.273 76104,7 − 93,6 349099.82 102 -3.3033 2.70e-01 0.246 69246,18 − 245,19 349972.85 532 -3.6332 1.57e-02 0.034 10247,18 − 246,19 349972.85 532 -3.6333 9.45e-03 0.034 1077,1 − 66,0 350303.48 66 -3.1488 6.08e-01 0.404 11377,0 − 66,1 350644.59 66 -3.1479 3.65e-01 0.291 81235,18 − 234,19 350741.95 477 -3.6859 1.23e-02 0.026 7236,18 − 235,19 350741.95 477 -3.6859 2.06e-02 0.026 7213,18 − 212,19 352033.68 376 -3.8513 1.73e-02 0.031 9214,18 − 213,19 352033.68 376 -3.8513 2.88e-02 0.031 9202,18 − 201,19 352570.56 328 -3.9971 2.87e-02 0.046 13203,18 − 202,19 352570.56 328 -3.9971 1.72e-02 0.046 13112,9 − 103,8 357909.16 113 -3.1776 3.47e-01 0.371 104113,9 − 102,8 357909.70 113 -3.1776 5.78e-01 0.531 14986,3 − 75,2 361519.42 78 -3.4205 1.90e-01 0.194 54
Propanal (C2H5CHO)325,28 − 315,27 330033.48 281 -3.2366 2.04e-02 0.013 4324,28 − 314,27 330572.90 281 -3.2344 2.04e-02 0.022 6139,5 − 128,4 330651.76 90 -3.3400 3.05e-02 0.042 12139,4 − 128,5 330651.76 90 -3.3400 3.05e-02 0.042 12317,25 − 307,24 332598.70 281 -3.2339 1.96e-02 0.012 3315,26 − 305,25 332939.34 273 -3.2271 2.12e-02 0.019 5351,34 − 342,33 333358.91 297 -3.2007 2.08e-02 0.089 25352,34 − 342,33 333358.92 297 -3.2123 2.03e-02 0.089 25351,34 − 341,33 333358.93 297 -3.2123 2.03e-02 0.089 25352,34 − 341,33 333358.95 297 -3.2007 2.08e-02 0.089 25326,27 − 316,26 337650.97 289 -3.2096 1.94e-02 0.015 4206,14 − 195,15 338096.89 127 -3.6845 1.50e-02 0.020 53215,17 − 3115,16 338572.87 390 -3.2943 7.07e-03 0.013 43215,18 − 3115,17 338572.87 390 -3.2943 7.07e-03 0.013 4335,29 − 325,28 339194.57 297 -3.2004 1.90e-02 0.020 6334,29 − 324,28 339547.63 297 -3.1990 1.90e-02 0.017 5335,29 − 324,28 340164.32 297 -3.3742 1.27e-02 0.020 6149,6 − 138,5 341151.22 97 -3.3271 3.00e-02 0.052 15149,5 − 138,6 341151.23 97 -3.3271 3.00e-02 0.052 15352,33 − 343,32 341277.32 309 -3.2188 1.73e-02 0.084 23353,33 − 343,32 341277.92 309 -3.1853 1.87e-02 0.084 23352,33 − 342,32 341278.36 309 -3.1853 1.87e-02 0.084 23353,33 − 342,32 341278.96 309 -3.2188 1.73e-02 0.084 23
Continued on next page
28

Lykke et al.: The ALMA-PILS survey: First detections of ethylene oxide, acetone and propanal toward IRAS 16293-2422
Table B.1 – continued from previous page
Transition Frequency Eup log10(Aul) τ∫
FWHM I δ3 Detection level[MHz] [K] [s−1] [J beam−1 km s−1]
205,15 − 194,16 341279.21 122 -3.9480 8.36e-03 0.029 8361,35 − 352,34 342518.47 314 -3.1633 1.94e-02 0.057 16362,35 − 352,34 342518.47 314 -3.1767 1.88e-02 0.057 16361,35 − 351,34 342518.48 314 -3.1767 1.88e-02 0.057 16362,35 − 351,34 342518.49 314 -3.1633 1.94e-02 0.057 161210,2 − 119,3 342926.51 94 -3.2160 3.40e-02 0.072 201210,3 − 119,2 342926.51 94 -3.2160 3.40e-02 0.072 20316,25 − 306,24 343589.54 278 -3.1841 2.11e-02 0.027 8317,24 − 307,23 343711.33 283 -3.1880 2.01e-02 0.014 4370,37 − 361,36 343805.93 317 -3.1164 2.15e-02 0.072 20371,37 − 361,36 343805.93 317 -3.1679 1.91e-02 0.072 20370,37 − 360,36 343805.93 317 -3.1679 1.91e-02 0.072 20371,37 − 360,36 343805.93 317 -3.1164 2.15e-02 0.072 20328,25 − 318,24 344372.65 305 -3.1927 1.71e-02 0.024 7344,30 − 335,29 347948.63 314 -3.3326 1.20e-02 0.011 3345,30 − 335,29 348337.20 314 -3.1652 1.76e-02 0.017 5354,32 − 344,31 349293.49 321 -3.1583 1.74e-02 0.023 6354,32 − 343,31 349318.44 321 -3.2457 1.42e-02 0.021 6362,34 − 353,33 350430.33 326 -3.1805 1.61e-02 0.111 31363,34 − 353,33 350430.67 326 -3.1504 1.73e-02 0.111 31362,34 − 352,33 350430.92 326 -3.1504 1.73e-02 0.111 31363,34 − 352,33 350431.26 326 -3.1805 1.61e-02 0.111 31371,36 − 362,35 351676.10 331 -3.1270 1.80e-02 0.050 14372,36 − 362,35 351676.11 331 -3.1420 1.74e-02 0.050 14371,36 − 361,35 351676.11 331 -3.1420 1.74e-02 0.050 14372,36 − 361,35 351676.11 331 -3.1270 1.80e-02 0.050 14380,38 − 371,37 352965.05 334 -3.0815 1.98e-02 0.047 13381,38 − 371,37 352965.05 334 -3.1334 1.76e-02 0.047 13380,38 − 370,37 352965.05 334 -3.1334 1.76e-02 0.047 13381,38 − 370,37 352965.05 334 -3.0815 1.98e-02 0.047 13326,26 − 316,25 353148.80 295 -3.1484 1.95e-02 0.029 81310,3 − 129,4 353450.35 101 -3.2084 3.34e-02 0.060 17339,25 − 329,24 354555.43 331 -3.1598 1.47e-02 0.037 101111,0 − 1010,1 355162.35 100 -3.0902 3.74e-02 0.083 231111,1 − 1010,0 355162.35 100 -3.0902 3.74e-02 0.083 23339,24 − 329,23 355856.08 331 -3.1550 1.47e-02 0.023 7346,29 − 336,28 356384.80 323 -3.1379 1.67e-02 0.016 5207,13 − 196,14 357000.67 134 -3.5090 1.92e-02 0.032 9355,31 − 345,30 357467.93 331 -3.1310 1.63e-02 0.012 3354,31 − 344,30 357613.69 331 -3.1304 1.63e-02 0.016 5345,29 − 335,28 358305.47 323 -3.1306 1.68e-02 0.037 10363,33 − 353,32 358438.34 338 -3.1242 1.60e-02 0.015 4372,35 − 363,34 359581.63 343 -3.1434 1.50e-02 0.060 17373,35 − 363,34 359581.82 343 -3.1164 1.59e-02 0.060 17372,35 − 362,34 359581.97 343 -3.1164 1.59e-02 0.060 17373,35 − 362,34 359582.16 343 -3.1434 1.50e-02 0.060 17188,10 − 177,11 359812.79 122 -3.3969 2.43e-02 0.030 8381,37 − 372,36 360831.75 348 -3.0917 1.66e-02 0.059 16382,37 − 372,36 360831.75 348 -3.1082 1.60e-02 0.059 16381,37 − 371,36 360831.75 348 -3.1082 1.60e-02 0.059 16382,37 − 371,36 360831.75 348 -3.0917 1.66e-02 0.059 163413,22 − 3313,21 361033.21 394 -3.1711 8.54e-03 0.028 83413,21 − 3313,20 361033.31 394 -3.1711 8.54e-03 0.028 8390,39 − 381,38 362122.12 351 -3.0475 1.82e-02 0.067 19390,39 − 380,38 362122.12 351 -3.0999 1.61e-02 0.067 19391,39 − 380,38 362122.12 351 -3.0475 1.82e-02 0.067 19391,39 − 381,38 362122.12 351 -3.0999 1.61e-02 0.067 19336,27 − 326,26 362196.30 313 -3.1159 1.80e-02 0.019 5
Continued on next page
29

Lykke et al.: The ALMA-PILS survey: First detections of ethylene oxide, acetone and propanal toward IRAS 16293-2422
Table B.1 – continued from previous page
Transition Frequency Eup log10(Aul) τ∫
FWHM I δ3 Detection level[MHz] [K] [s−1] [J beam−1 km s−1]
Acetone (CH3COCH3)268,18 − 259,17 EA 329228.06 244 -2.9657 3.38e-02 0.130 36269,18 − 258,17 EA 329228.06 244 -2.9657 3.38e-02 0.130 36268,18 − 259,17 AE 329228.14 244 -2.9657 1.69e-02 0.130 36269,18 − 258,17 AE 329228.14 244 -2.9657 5.07e-02 0.130 36268,18 − 259,17 EE 329298.16 244 -2.9656 1.35e-01 0.178 50269,18 − 258,17 EE 329298.16 244 -2.9656 1.35e-01 0.178 50147,8 − 134,9 AA 329367.94 80 -4.0975 1.27e-02 0.118 33268,18 − 259,17 AA 329368.09 244 -2.9654 5.07e-02 0.117 33269,18 − 258,17 AA 329368.10 244 -2.9654 8.45e-02 0.117 33277,20 − 268,19 EA 330250.07 252 -2.9233 3.60e-02 0.114 32278,20 − 267,19 EA 330250.07 252 -2.9233 3.60e-02 0.114 32277,20 − 268,19 AE 330250.13 252 -2.9233 5.40e-02 0.114 32278,20 − 267,19 AE 330250.13 252 -2.9232 1.80e-02 0.114 325113,38 − 5113,39 EE 330250.15 875 -3.5999 2.36e-04 0.114 325114,38 − 5113,39 EE 330250.15 875 -3.2461 5.32e-04 0.114 325113,38 − 5112,39 EE 330250.15 875 -3.2461 5.32e-04 0.114 325114,38 − 5112,39 EE 330250.15 875 -3.5999 2.36e-04 0.114 32277,20 − 268,19 EE 330314.39 252 -2.9231 1.44e-01 0.198 55278,20 − 267,19 EE 330314.39 252 -2.9231 1.44e-01 0.198 55277,20 − 268,19 AA 330378.56 252 -2.9230 9.00e-02 0.122 34278,20 − 267,19 AA 330378.56 252 -2.9230 5.40e-02 0.122 341715,3 − 1614,2 AE 330506.31 138 -2.8918 3.06e-02 0.035 101715,2 − 1614,3 AE 330512.29 138 -2.8918 9.19e-02 0.038 111715,3 − 1614,3 EA 330549.33 138 -2.8919 6.13e-02 0.057 161715,2 − 1614,2 EE 330725.88 138 -2.8905 2.45e-01 0.207 581715,3 − 1614,3 EE 330765.02 138 -2.8906 2.45e-01 0.153 43133,10 − 122,11 EE 331129.66 60 -4.7227 5.19e-03 0.015 4134,10 − 121,11 EE 331129.71 60 -4.7227 5.19e-03 0.015 4286,22 − 277,21 EA 331321.41 260 -2.8862 3.80e-02 0.148 41287,22 − 276,21 EA 331321.41 260 -2.8862 3.80e-02 0.148 41286,22 − 277,21 AE 331321.46 260 -2.8863 1.90e-02 0.148 41287,22 − 276,21 AE 331321.46 260 -2.8863 5.70e-02 0.148 41287,22 − 277,21 EE 331380.50 260 -3.0073 1.15e-01 0.191 53286,22 − 277,21 EE 331380.50 260 -3.4997 3.70e-02 0.191 53286,22 − 276,21 EE 331380.50 260 -3.0094 1.15e-01 0.191 53287,22 − 276,21 EE 331380.50 260 -3.4932 3.76e-02 0.191 53295,24 − 285,23 EA 332420.74 266 -2.8535 4.00e-02 0.116 33296,24 − 286,23 EA 332420.74 266 -2.8535 4.00e-02 0.116 33295,24 − 285,23 AE 332420.79 266 -2.8535 2.00e-02 0.116 33296,24 − 286,23 AE 332420.79 266 -2.8535 6.00e-02 0.116 33295,24 − 285,23 EE 332474.57 266 -3.4029 4.52e-02 0.185 52295,24 − 286,23 EE 332474.57 266 -2.9972 1.15e-01 0.185 52296,24 − 286,23 EE 332474.57 266 -3.4029 4.52e-02 0.185 52296,24 − 285,23 EE 332474.57 266 -2.9972 1.15e-01 0.185 52296,24 − 286,23 AA 332528.32 266 -2.8532 1.00e-01 0.125 35295,24 − 285,23 AA 332528.32 266 -2.8532 6.00e-02 0.125 35304,26 − 295,25 EA 333537.35 272 -2.8239 4.20e-02 0.139 39305,26 − 294,25 EA 333537.35 272 -2.8239 4.20e-02 0.139 39305,26 − 295,25 AE 333537.39 272 -2.8240 2.10e-02 0.139 39304,26 − 294,25 AE 333537.39 272 -2.8240 6.30e-02 0.139 39304,26 − 294,25 EE 333585.34 272 -4.7355 2.06e-03 0.235 66305,26 − 294,25 EE 333585.34 272 -2.8291 1.66e-01 0.235 66304,26 − 295,25 EE 333585.34 272 -2.8291 1.66e-01 0.235 66305,26 − 295,25 EE 333585.34 272 -4.7355 2.06e-03 0.235 66304,26 − 295,25 AA 333633.28 272 -2.8236 6.30e-02 0.170 48305,26 − 294,25 AA 333633.28 272 -2.8237 1.05e-01 0.170 481913,7 − 1812,6 AE 334691.41 157 -3.2379 1.29e-02 0.018 5313,28 − 303,27 EE 334706.67 277 -3.2332 6.39e-02 0.255 71
Continued on next page
30

Lykke et al.: The ALMA-PILS survey: First detections of ethylene oxide, acetone and propanal toward IRAS 16293-2422
Table B.1 – continued from previous page
Transition Frequency Eup log10(Aul) τ∫
FWHM I δ3 Detection level[MHz] [K] [s−1] [J beam−1 km s−1]
313,28 − 304,27 EE 334706.67 277 -2.9889 1.12e-01 0.255 71314,28 − 304,27 EE 334706.67 277 -3.2332 6.39e-02 0.255 71314,28 − 303,27 EE 334706.67 277 -2.9889 1.12e-01 0.255 71313,28 − 304,27 AA 334747.64 277 -2.7968 1.10e-01 0.149 42313,28 − 304,27 AA 334747.64 277 -2.7968 1.10e-01 0.160 45314,28 − 303,27 AA 334747.64 277 -2.7969 6.60e-02 0.149 42314,28 − 303,27 AA 334747.64 277 -2.7969 6.60e-02 0.160 452113,9 − 2012,8 EE 335150.46 187 -3.3155 7.48e-02 0.059 162312,11 − 2213,10 AE 335336.65 219 -3.2138 3.00e-02 0.033 92312,11 − 2213,10 EE 335427.63 219 -3.2142 8.00e-02 0.087 242213,10 − 2112,9 EE 335617.32 202 -3.2655 7.73e-02 0.075 21322,30 − 313,29 EA 335802.89 281 -2.7724 4.61e-02 0.167 47323,30 − 312,29 EA 335802.89 281 -2.7724 4.61e-02 0.167 47322,30 − 312,29 AE 335802.91 281 -2.7724 6.92e-02 0.167 47323,30 − 313,29 AE 335802.91 281 -2.7724 2.31e-02 0.167 47322,30 − 313,29 EE 335835.06 281 -3.1155 8.05e-02 0.219 61322,30 − 312,29 EE 335835.06 281 -3.0035 1.04e-01 0.219 61323,30 − 313,29 EE 335835.06 281 -3.0035 1.04e-01 0.219 61323,30 − 312,29 EE 335835.06 281 -3.1155 8.05e-02 0.219 61323,30 − 313,29 AA 335867.22 281 -2.7722 6.93e-02 0.156 44322,30 − 312,29 AA 335867.22 281 -2.7722 1.15e-01 0.156 44159,7 − 146,8 EE 335913.15 96 -3.8800 3.03e-02 0.049 142013,8 − 1912,7 AE 335925.12 172 -3.3067 3.07e-02 0.013 41716,2 − 1615,1 AE 336425.06 142 -2.8089 3.46e-02 0.137 381716,1 − 1615,2 AE 336425.21 142 -2.8089 1.04e-01 0.137 381716,2 − 1615,2 EA 336499.84 142 -2.8087 6.93e-02 0.116 322313,10 − 2214,9 EE 336595.46 222 -3.3730 5.35e-02 0.043 121716,1 − 1615,1 EE 336627.03 142 -2.8079 2.77e-01 0.267 752013,8 − 1912,7 AA 336659.82 172 -3.3026 5.14e-02 0.019 51716,2 − 1615,2 EE 336700.98 142 -2.8077 2.77e-01 0.220 612411,13 − 2312,12 EE 336848.82 230 -3.0930 9.95e-02 0.105 292412,13 − 2311,12 EA 336881.18 230 -3.0924 2.49e-02 0.036 102412,13 − 2311,12 AE 336882.02 230 -3.0924 3.73e-02 0.036 101716,2 − 1615,1 AA 336902.73 142 -2.8067 1.04e-01 0.224 621716,1 − 1615,2 AA 336902.88 142 -2.8067 1.74e-01 0.224 622411,13 − 2312,12 AA 336942.18 230 -3.0931 3.73e-02 0.053 15331,32 − 322,31 EA 336947.69 285 -2.7496 4.84e-02 0.158 44332,32 − 321,31 EA 336947.69 285 -2.7496 4.84e-02 0.158 44332,32 − 322,31 AE 336947.69 285 -2.7496 7.26e-02 0.158 44331,32 − 321,31 AE 336947.69 285 -2.7496 2.42e-02 0.158 44331,32 − 322,31 EE 336968.39 285 -2.8961 1.29e-01 0.221 62332,32 − 322,31 EE 336968.39 285 -3.1937 6.50e-02 0.221 62331,32 − 321,31 EE 336968.39 285 -3.1937 6.50e-02 0.221 62332,32 − 321,31 EE 336968.39 285 -2.8961 1.29e-01 0.221 622412,13 − 2311,12 EE 336976.82 230 -3.0925 9.95e-02 0.129 36331,32 − 322,31 AA 336989.07 285 -2.7495 1.21e-01 0.187 52332,32 − 321,31 AA 336989.07 285 -2.7495 7.27e-02 0.187 522412,13 − 2311,12 AA 337071.78 230 -3.0924 6.22e-02 0.084 232510,15 − 2411,14 EA 337243.77 241 -3.0202 2.80e-02 0.059 162510,15 − 2411,14 AE 337243.93 241 -3.0202 4.20e-02 0.087 242511,15 − 2410,14 EA 337245.60 241 -3.0202 2.80e-02 0.045 122511,15 − 2410,14 AE 337245.77 241 -3.0203 1.40e-02 0.045 122510,15 − 2411,14 EE 337325.28 241 -3.0202 1.12e-01 0.060 172511,15 − 2410,14 EE 337327.12 241 -3.0202 1.12e-01 0.060 172510,15 − 2411,14 AA 337406.52 241 -3.0201 7.00e-02 0.038 112511,15 − 2410,14 AA 337408.37 241 -3.0201 4.20e-02 0.038 11269,17 − 2510,16 EA 338044.46 251 -2.9640 3.05e-02 0.168 472610,17 − 259,16 EA 338044.48 251 -2.9640 3.05e-02 0.168 47269,17 − 2510,16 AE 338044.57 251 -2.9640 1.52e-02 0.168 47
Continued on next page
31

Lykke et al.: The ALMA-PILS survey: First detections of ethylene oxide, acetone and propanal toward IRAS 16293-2422
Table B.1 – continued from previous page
Transition Frequency Eup log10(Aul) τ∫
FWHM I δ3 Detection level[MHz] [K] [s−1] [J beam−1 km s−1]
2610,17 − 259,16 AE 338044.58 251 -2.9640 4.57e-02 0.168 47340,34 − 331,33 EE 338105.31 288 -3.4554 3.46e-02 0.243 68341,34 − 331,33 EE 338105.31 288 -2.7657 1.69e-01 0.243 68340,34 − 330,33 EE 338105.31 288 -2.7657 1.69e-01 0.243 68341,34 − 330,33 EE 338105.31 288 -3.4554 3.46e-02 0.243 68340,34 − 330,33 AA 338110.81 287 -2.7284 1.27e-01 0.197 55341,34 − 331,33 AA 338110.81 287 -2.7283 7.65e-02 0.197 55269,17 − 2510,16 EE 338117.64 251 -2.9640 1.22e-01 0.210 592610,17 − 259,16 EE 338117.66 251 -2.9640 1.22e-01 0.210 59269,17 − 2510,16 AA 338190.61 251 -2.9638 4.57e-02 0.114 322610,17 − 259,16 AA 338190.62 251 -2.9638 7.61e-02 0.114 321814,5 − 1713,5 EA 338648.66 147 -3.0058 4.43e-02 0.030 81814,4 − 1713,4 EE 338833.86 147 -3.0148 1.73e-01 0.148 411814,4 − 1713,5 AE 339030.13 147 -2.9994 2.24e-02 0.018 5278,19 − 269,18 EE 339069.60 260 -2.9174 1.30e-01 0.173 48279,19 − 268,18 EE 339069.60 260 -2.9174 1.30e-01 0.173 48278,19 − 269,18 AA 339136.45 260 -2.9173 8.13e-02 0.119 33279,19 − 268,18 AA 339136.45 260 -2.9172 4.88e-02 0.119 33145,9 − 134,10 EE 339242.67 76 -4.2327 1.44e-02 0.032 92313,11 − 2212,10 EE 339955.49 219 -3.1917 8.21e-02 0.078 22287,21 − 278,20 EA 340038.58 269 -2.8776 3.44e-02 0.136 38288,21 − 277,20 EA 340038.58 269 -2.8776 3.44e-02 0.136 38287,21 − 278,20 AE 340038.65 269 -2.8777 1.72e-02 0.136 38288,21 − 277,20 AE 340038.65 269 -2.8776 5.16e-02 0.136 38287,21 − 278,20 EE 340100.55 269 -2.8776 1.37e-01 0.187 52288,21 − 277,20 EE 340100.55 269 -2.8776 1.37e-01 0.187 52287,21 − 278,20 AA 340162.36 269 -2.8774 5.16e-02 0.112 31288,21 − 277,20 AA 340162.36 269 -2.8774 8.59e-02 0.112 31297,23 − 287,22 EA 341116.83 276 -2.8426 3.61e-02 0.132 37296,23 − 286,22 EA 341116.83 276 -2.8426 3.61e-02 0.132 37296,23 − 286,22 AE 341116.89 276 -2.8426 1.81e-02 0.132 37297,23 − 287,22 AE 341116.89 276 -2.8426 5.42e-02 0.132 37297,23 − 287,22 EE 341174.15 276 -6.0035 9.97e-05 0.200 56296,23 − 287,22 EE 341174.15 276 -2.8428 1.44e-01 0.200 56296,23 − 286,22 EE 341174.15 276 -6.0035 9.97e-05 0.200 56297,23 − 286,22 EE 341174.15 276 -2.8428 1.44e-01 0.200 56296,23 − 287,22 AA 341231.36 276 -2.8423 9.03e-02 0.132 37297,23 − 286,22 AA 341231.36 276 -2.8424 5.42e-02 0.132 37445,39 − 445,40 EE 341950.48 562 -3.5251 3.21e-03 0.013 4446,39 − 445,40 EE 341950.48 562 -4.1489 7.62e-04 0.013 4445,39 − 444,40 EE 341950.48 562 -4.1489 7.62e-04 0.013 4446,39 − 444,40 EE 341950.48 562 -3.5251 3.21e-03 0.013 4306,25 − 296,24 EA 342219.92 283 -2.8113 3.78e-02 0.124 35305,25 − 295,24 EA 342219.92 283 -2.8113 3.78e-02 0.124 35305,25 − 295,24 AE 342219.97 283 -2.8113 5.67e-02 0.124 35306,25 − 296,24 AE 342219.97 283 -2.8113 1.89e-02 0.124 35305,25 − 296,24 EE 342272.48 283 -3.8339 1.43e-02 0.208 58306,25 − 296,24 EE 342272.48 283 -2.8544 1.37e-01 0.208 58305,25 − 295,24 EE 342272.48 283 -2.8544 1.37e-01 0.208 58306,25 − 295,24 EE 342272.48 283 -3.8339 1.43e-02 0.208 581717,1 − 1616,0 AE 342300.57 147 -2.7347 3.83e-02 0.142 401717,0 − 1616,1 AE 342300.57 147 -2.7346 1.15e-01 0.142 40305,25 − 296,24 AA 342324.94 283 -2.8110 5.67e-02 0.130 36306,25 − 295,24 AA 342324.94 283 -2.8111 9.45e-02 0.130 361717,1 − 1616,1 EA 342410.64 147 -2.7343 7.67e-02 0.095 261717,0 − 1616,0 EE 342485.23 147 -2.7339 3.06e-01 0.269 751717,1 − 1616,1 EE 342594.89 147 -2.7335 3.07e-01 0.229 641717,1 − 1616,0 AA 342780.03 147 -2.7327 1.15e-01 0.227 631717,0 − 1616,1 AA 342780.04 147 -2.7328 1.92e-01 0.227 63
Continued on next page
32

Lykke et al.: The ALMA-PILS survey: First detections of ethylene oxide, acetone and propanal toward IRAS 16293-2422
Table B.1 – continued from previous page
Transition Frequency Eup log10(Aul) τ∫
FWHM I δ3 Detection level[MHz] [K] [s−1] [J beam−1 km s−1]
314,27 − 305,26 EA 343338.88 289 -2.7830 3.95e-02 0.142 40315,27 − 304,26 EA 343338.88 289 -2.7830 3.95e-02 0.142 40314,27 − 304,26 AE 343338.92 289 -2.7830 1.97e-02 0.142 40315,27 − 305,26 AE 343338.92 289 -2.7830 5.92e-02 0.142 40314,27 − 305,26 AA 343433.08 289 -2.7828 9.87e-02 0.172 48315,27 − 304,26 AA 343433.08 289 -2.7828 5.92e-02 0.172 48323,29 − 314,28 EA 344468.95 294 -2.7572 4.12e-02 0.114 32324,29 − 313,28 EA 344468.95 294 -2.7572 4.12e-02 0.114 32324,29 − 314,28 AE 344468.98 294 -2.7572 2.06e-02 0.114 32323,29 − 313,28 AE 344468.98 294 -2.7572 6.19e-02 0.114 32323,29 − 313,28 EE 344509.42 294 -3.7739 1.52e-02 0.182 51323,29 − 314,28 EE 344509.42 294 -2.7817 1.50e-01 0.182 51324,29 − 313,28 EE 344509.42 294 -2.7817 1.50e-01 0.182 51324,29 − 314,28 EE 344509.42 294 -3.7739 1.52e-02 0.182 51323,29 − 314,28 AA 344549.87 294 -2.7569 6.19e-02 0.181 51324,29 − 313,28 AA 344549.87 294 -2.7570 1.03e-01 0.181 511815,3 − 1714,3 EE 345037.50 151 -2.8914 2.16e-01 0.142 401815,4 − 1714,4 EE 345073.72 151 -2.8917 2.15e-01 0.210 59333,31 − 323,30 EA 345607.71 298 -2.7333 4.31e-02 0.183 51332,31 − 322,30 EA 345607.71 298 -2.7333 4.31e-02 0.183 51333,31 − 323,30 AE 345607.74 298 -2.7334 6.46e-02 0.183 51332,31 − 322,30 AE 345607.74 298 -2.7334 2.15e-02 0.183 51332,31 − 323,30 EE 345639.62 298 -3.5454 2.48e-02 0.200 56332,31 − 322,30 EE 345639.62 298 -2.7700 1.48e-01 0.200 56333,31 − 323,30 EE 345639.62 298 -2.7700 1.48e-01 0.200 56333,31 − 322,30 EE 345639.62 298 -3.5454 2.48e-02 0.200 56332,31 − 322,30 AA 345671.52 298 -2.7332 6.47e-02 0.140 39333,31 − 323,30 AA 345671.52 298 -2.7332 1.08e-01 0.140 392511,14 − 2412,13 EA 346346.12 247 -3.0311 2.48e-02 0.078 222511,14 − 2412,13 AE 346346.31 247 -3.0310 3.72e-02 0.078 222512,14 − 2411,13 EA 346374.84 247 -3.0309 2.48e-02 0.042 122512,14 − 2411,13 AE 346375.23 247 -3.0310 1.24e-02 0.042 122511,14 − 2412,13 EE 346432.88 247 -3.0311 9.90e-02 0.091 252512,14 − 2411,13 EE 346461.91 247 -3.0310 9.90e-02 0.068 192511,14 − 2412,13 AA 346519.31 247 -3.0311 6.19e-02 0.042 122512,14 − 2411,13 AA 346548.56 247 -3.0309 3.71e-02 0.067 19341,33 − 332,32 AA 346795.27 301 -2.7111 6.78e-02 0.097 27342,33 − 331,32 AA 346795.27 301 -2.7112 1.13e-01 0.097 272610,16 − 2511,15 EA 346941.16 258 -2.9664 2.73e-02 0.081 232610,16 − 2511,15 AE 346941.30 258 -2.9664 1.37e-02 0.081 232611,16 − 2510,15 EA 346941.51 258 -2.9664 2.73e-02 0.081 232611,16 − 2510,15 AE 346941.65 258 -2.9664 4.09e-02 0.081 232610,16 − 2511,15 EE 347017.52 258 -2.9663 1.09e-01 0.142 402611,16 − 2510,15 EE 347017.87 258 -2.9663 1.09e-01 0.142 402610,16 − 2511,15 AA 347093.62 258 -2.9662 4.09e-02 0.101 282611,16 − 2510,15 AA 347093.97 258 -2.9663 6.82e-02 0.101 282413,12 − 2312,11 EE 347309.14 235 -3.1182 8.51e-02 0.099 28279,18 − 2610,17 EA 347797.75 268 -2.9148 2.93e-02 0.138 392710,18 − 269,17 EA 347797.75 268 -2.9148 2.93e-02 0.138 39279,18 − 2610,17 AE 347797.85 268 -2.9148 4.40e-02 0.138 392710,18 − 269,17 AE 347797.85 268 -2.9148 1.47e-02 0.138 39279,18 − 2610,17 EE 347867.07 268 -2.9147 1.17e-01 0.186 522710,18 − 269,17 EE 347867.08 268 -2.9147 1.17e-01 0.186 52350,35 − 341,34 AE 347907.80 304 -2.6907 7.10e-02 0.130 36351,35 − 340,34 AE 347907.80 304 -2.6907 2.37e-02 0.130 36350,35 − 341,34 EA 347907.85 304 -2.6907 4.73e-02 0.130 36351,35 − 340,34 EA 347907.85 304 -2.6907 4.73e-02 0.130 36350,35 − 341,34 AA 347918.78 304 -2.6907 1.18e-01 0.133 37351,35 − 340,34 AA 347918.78 304 -2.6907 7.11e-02 0.133 37
Continued on next page
33

Lykke et al.: The ALMA-PILS survey: First detections of ethylene oxide, acetone and propanal toward IRAS 16293-2422
Table B.1 – continued from previous page
Transition Frequency Eup log10(Aul) τ∫
FWHM I δ3 Detection level[MHz] [K] [s−1] [J beam−1 km s−1]
279,18 − 2610,17 AA 347936.19 268 -2.9146 7.33e-02 0.085 242710,18 − 269,17 AA 347936.20 268 -2.9145 4.40e-02 0.085 24288,20 − 279,19 EA 348780.22 277 -2.8714 3.10e-02 0.092 26289,20 − 278,19 EA 348780.22 277 -2.8714 3.10e-02 0.092 26288,20 − 279,19 AE 348780.29 277 -2.8713 1.55e-02 0.092 26289,20 − 278,19 AE 348780.29 277 -2.8714 4.65e-02 0.092 26288,20 − 279,19 EE 348844.27 277 -2.8712 1.24e-01 0.144 40289,20 − 278,19 EE 348844.27 277 -2.8712 1.24e-01 0.144 40288,20 − 279,19 AA 348908.15 277 -2.8711 4.65e-02 0.097 27289,20 − 278,19 AA 348908.15 277 -2.8711 7.76e-02 0.097 27144,10 − 133,11 EE 348964.09 72 -4.4168 9.23e-03 0.014 4145,10 − 132,11 EE 348964.42 72 -4.4168 9.23e-03 0.014 4297,22 − 288,21 EA 349827.76 285 -2.8337 3.26e-02 0.120 34298,22 − 287,21 EA 349827.76 285 -2.8337 3.26e-02 0.120 34297,22 − 288,21 AE 349827.82 285 -2.8338 4.89e-02 0.120 34298,22 − 287,21 AE 349827.82 285 -2.8338 1.63e-02 0.120 34298,22 − 288,21 EE 349887.43 285 -2.8633 1.22e-01 0.150 42297,22 − 288,21 EE 349887.43 285 -4.0142 8.60e-03 0.150 42297,22 − 287,21 EE 349887.43 285 -2.8631 1.22e-01 0.150 42298,22 − 287,21 EE 349887.43 285 -4.0172 8.54e-03 0.150 42297,22 − 288,21 AA 349946.96 285 -2.8335 8.14e-02 0.100 28298,22 − 287,21 AA 349946.96 285 -2.8334 4.89e-02 0.100 281816,3 − 1715,2 AE 350819.12 155 -2.8044 9.25e-02 0.070 191816,2 − 1715,3 AE 350821.27 155 -2.8044 3.08e-02 0.015 41816,3 − 1715,3 EA 350891.89 155 -2.8043 6.17e-02 0.047 13306,24 − 296,23 EA 350911.96 293 -2.8004 3.40e-02 0.118 33307,24 − 297,23 EA 350911.96 293 -2.8004 3.40e-02 0.118 33306,24 − 296,23 AE 350912.01 293 -2.8004 5.10e-02 0.118 33307,24 − 297,23 AE 350912.01 293 -2.8004 1.70e-02 0.118 33306,24 − 296,23 EE 350967.54 293 -3.4934 2.76e-02 0.187 52306,24 − 297,23 EE 350967.54 293 -2.8987 1.09e-01 0.187 52307,24 − 297,23 EE 350967.54 293 -3.2594 4.73e-02 0.187 52307,24 − 296,23 EE 350967.54 293 -2.9856 8.88e-02 0.187 521816,2 − 1715,2 EE 351012.48 155 -2.8033 2.47e-01 0.214 60307,24 − 297,23 AA 351023.02 293 -2.8002 5.10e-02 0.111 31306,24 − 296,23 AA 351023.02 293 -2.8002 8.51e-02 0.111 311816,3 − 1715,3 EE 351083.30 155 -2.8032 2.47e-01 0.182 511816,3 − 1715,2 AA 351274.14 155 -2.8021 1.55e-01 0.115 32315,26 − 305,25 EA 352018.43 300 -2.7706 3.55e-02 0.135 38316,26 − 306,25 EA 352018.43 300 -2.7706 3.55e-02 0.135 38315,26 − 306,25 AE 352018.48 300 -2.7706 5.32e-02 0.135 38316,26 − 305,25 AE 352018.48 300 -2.7705 1.77e-02 0.135 38315,26 − 306,25 EE 352069.73 300 -5.6440 1.88e-04 0.187 52315,26 − 305,25 EE 352069.73 300 -2.7671 1.42e-01 0.187 52316,26 − 306,25 EE 352069.73 300 -2.7671 1.42e-01 0.187 52316,26 − 305,25 EE 352069.73 300 -5.6440 1.88e-04 0.187 52315,26 − 305,25 AA 352120.94 300 -2.7703 5.32e-02 0.136 38316,26 − 306,25 AA 352120.94 300 -2.7703 8.87e-02 0.136 382413,11 − 2314,10 EE 352593.82 239 -3.2028 6.58e-02 0.080 221914,6 − 1813,6 EA 352777.63 161 -3.1271 2.93e-02 0.033 91611,6 − 158,7 EE 352842.59 113 -3.8606 2.68e-02 0.035 101611,6 − 158,7 EE 352842.59 113 -3.8606 2.68e-02 0.029 8324,28 − 315,27 EA 353139.60 306 -2.7434 3.69e-02 0.116 32325,28 − 314,27 EA 353139.60 306 -2.7434 3.69e-02 0.116 32324,28 − 314,27 AE 353139.65 306 -2.7434 5.54e-02 0.116 32325,28 − 315,27 AE 353139.65 306 -2.7433 1.85e-02 0.116 32324,28 − 314,27 EE 353185.88 306 -2.7258 1.48e-01 0.185 52325,28 − 315,27 EE 353185.88 306 -2.7258 1.48e-01 0.185 52324,28 − 315,27 AA 353232.11 306 -2.7431 5.54e-02 0.114 32
Continued on next page
34

Lykke et al.: The ALMA-PILS survey: First detections of ethylene oxide, acetone and propanal toward IRAS 16293-2422
Table B.1 – continued from previous page
Transition Frequency Eup log10(Aul) τ∫
FWHM I δ3 Detection level[MHz] [K] [s−1] [J beam−1 km s−1]
325,28 − 314,27 AA 353232.11 306 -2.7432 9.23e-02 0.114 321610,7 − 157,8 EE 353644.50 110 -3.7796 3.29e-02 0.061 171610,7 − 157,8 AA 353896.48 110 -3.7790 2.06e-02 0.033 9333,30 − 324,29 EA 354271.40 311 -2.7185 3.84e-02 0.171 48334,30 − 323,29 EA 354271.40 311 -2.7185 3.84e-02 0.171 48333,30 − 323,29 AE 354271.44 311 -2.7185 1.92e-02 0.171 48334,30 − 324,29 AE 354271.44 311 -2.7185 5.76e-02 0.171 481914,5 − 1813,6 AE 354307.91 161 -3.0237 5.52e-02 0.033 9333,30 − 324,29 EE 354311.36 311 -3.6682 1.61e-02 0.269 75333,30 − 323,29 EE 354311.36 311 -2.7358 1.38e-01 0.269 75334,30 − 324,29 EE 354311.36 311 -2.7358 1.38e-01 0.269 75334,30 − 323,29 EE 354311.36 311 -3.6682 1.61e-02 0.269 75333,30 − 324,29 AA 354351.30 311 -2.7183 9.61e-02 0.176 49334,30 − 323,29 AA 354351.30 311 -2.7183 5.77e-02 0.176 49342,32 − 333,31 EA 355411.74 315 -2.6955 4.00e-02 0.129 36343,32 − 332,31 EA 355411.74 315 -2.6955 4.00e-02 0.129 36342,32 − 332,31 AE 355411.77 315 -2.6955 6.00e-02 0.129 36343,32 − 333,31 AE 355411.77 315 -2.6955 2.00e-02 0.129 36343,32 − 333,31 EE 355443.39 315 -2.6521 1.60e-01 0.201 56342,32 − 332,31 EE 355443.39 315 -2.6521 1.60e-01 0.201 56343,32 − 333,31 AA 355475.05 315 -2.6953 6.01e-02 0.239 67342,32 − 332,31 AA 355475.05 315 -2.6953 1.00e-01 0.239 672512,13 − 2413,12 AE 355620.72 252 -3.0519 3.23e-02 0.053 152512,13 − 2413,12 EA 355621.08 252 -3.0519 2.15e-02 0.053 152512,13 − 2413,12 EE 355713.67 252 -3.0520 8.60e-02 0.092 262512,13 − 2413,12 AA 355806.17 252 -3.0520 5.37e-02 0.040 112612,15 − 2511,14 EA 355972.75 264 -2.9740 2.43e-02 0.064 182612,15 − 2511,14 AE 355972.99 264 -2.9740 3.64e-02 0.064 182611,15 − 2512,14 EE 356046.79 264 -2.9739 9.71e-02 0.110 312612,15 − 2511,14 EE 356052.97 264 -2.9739 9.71e-02 0.107 302513,13 − 2412,12 EE 356066.12 252 -3.0504 8.61e-02 0.124 352612,15 − 2511,14 AA 356132.86 264 -2.9739 6.07e-02 0.057 16351,34 − 341,33 EA 356559.73 319 -2.6741 4.18e-02 0.127 35352,34 − 342,33 EA 356559.73 319 -2.6741 4.18e-02 0.127 35351,34 − 341,33 AE 356559.73 319 -2.6741 2.09e-02 0.127 35352,34 − 342,33 AE 356559.73 319 -2.6740 6.27e-02 0.127 35351,34 − 342,33 EE 356580.23 319 -2.6206 1.66e-01 0.196 55352,34 − 342,33 EE 356580.23 319 -4.8932 8.88e-04 0.196 55351,34 − 341,33 EE 356580.23 319 -4.8932 8.88e-04 0.196 55352,34 − 341,33 EE 356580.23 319 -2.6206 1.66e-01 0.196 55351,34 − 342,33 AA 356600.73 319 -2.6740 1.05e-01 0.128 36352,34 − 341,33 AA 356600.73 319 -2.6740 6.28e-02 0.128 361817,1 − 1716,1 EA 356621.39 160 -2.7275 6.88e-02 0.065 182710,17 − 2611,16 EA 356658.41 275 -2.9156 2.63e-02 0.112 312711,17 − 2610,16 EA 356658.48 275 -2.9156 2.63e-02 0.112 312710,17 − 2611,16 AE 356658.54 275 -2.9156 3.95e-02 0.112 312711,17 − 2610,16 AE 356658.60 275 -2.9156 1.32e-02 0.112 311817,2 − 1716,1 AE 356727.49 159 -2.7272 1.03e-01 0.070 201817,1 − 1716,2 AE 356727.54 159 -2.7272 3.44e-02 0.070 202710,17 − 2611,16 AA 356801.31 275 -2.9153 6.58e-02 0.097 272711,17 − 2610,16 AA 356801.37 275 -2.9154 3.95e-02 0.097 271817,2 − 1716,2 EA 356833.46 159 -2.7269 6.89e-02 0.078 221817,1 − 1716,1 EE 356902.77 160 -2.7263 2.75e-01 0.193 541817,2 − 1716,2 EE 357008.08 159 -2.7261 2.76e-01 0.289 811817,2 − 1716,1 AA 357183.43 160 -2.7252 1.72e-01 0.225 631817,1 − 1716,2 AA 357183.48 160 -2.7253 1.03e-01 0.225 63289,19 − 2710,18 EA 357558.00 285 -2.8678 2.80e-02 0.106 302810,19 − 279,18 EA 357558.01 285 -2.8678 2.80e-02 0.106 30289,19 − 2710,18 AE 357558.09 285 -2.8678 1.40e-02 0.106 30
Continued on next page
35

Lykke et al.: The ALMA-PILS survey: First detections of ethylene oxide, acetone and propanal toward IRAS 16293-2422
Table B.1 – continued from previous page
Transition Frequency Eup log10(Aul) τ∫
FWHM I δ3 Detection level[MHz] [K] [s−1] [J beam−1 km s−1]
2810,19 − 279,18 AE 357558.09 285 -2.8678 4.20e-02 0.106 30289,19 − 2710,18 EE 357623.66 285 -2.8677 1.12e-01 0.182 512810,19 − 279,18 EE 357623.66 285 -2.8677 1.12e-01 0.182 51289,19 − 2710,18 AA 357689.11 285 -2.8675 4.20e-02 0.127 352810,19 − 279,18 AA 357689.11 285 -2.8676 6.99e-02 0.127 35360,36 − 350,35 AE 357715.22 322 -2.6541 6.56e-02 0.154 43361,36 − 351,35 AE 357715.22 322 -2.6541 2.19e-02 0.154 43360,36 − 351,35 EA 357715.27 322 -2.6541 4.37e-02 0.154 43361,36 − 350,35 EA 357715.27 322 -2.6541 4.37e-02 0.154 43360,36 − 351,35 EE 357720.70 321 -2.5866 1.75e-01 0.235 66361,36 − 351,35 EE 357720.70 321 -5.6153 1.64e-04 0.235 66361,36 − 350,35 EE 357720.70 321 -2.5866 1.75e-01 0.235 66360,36 − 350,35 EE 357720.70 321 -5.6153 1.64e-04 0.235 66360,36 − 351,35 AA 357726.06 321 -2.6541 6.57e-02 0.155 43361,36 − 350,35 AA 357726.06 321 -2.6541 1.09e-01 0.155 43298,21 − 289,20 EA 358560.03 294 -2.8271 2.94e-02 0.126 35299,21 − 288,20 EA 358560.03 294 -2.8271 2.94e-02 0.126 35298,21 − 289,20 AE 358560.10 294 -2.8271 4.41e-02 0.126 35299,21 − 288,20 AE 358560.10 294 -2.8270 1.47e-02 0.126 35298,21 − 289,20 EE 358621.21 294 -2.8269 1.18e-01 0.195 55299,21 − 288,20 EE 358621.21 294 -2.8269 1.18e-01 0.195 55298,21 − 289,20 AA 358682.23 294 -2.8268 7.34e-02 0.118 33299,21 − 288,20 AA 358682.23 294 -2.8268 4.41e-02 0.118 331915,5 − 1814,5 EA 359063.67 164 -2.9024 4.61e-02 0.052 151915,4 − 1814,4 EE 359225.22 164 -2.9025 1.84e-01 0.159 441915,5 − 1814,5 EE 359266.93 164 -2.9031 1.84e-01 0.142 40308,23 − 298,22 EA 359617.24 303 -2.7914 3.07e-02 0.119 33307,23 − 297,22 EA 359617.24 303 -2.7914 3.07e-02 0.119 33307,23 − 298,22 AE 359617.31 303 -2.7914 1.53e-02 0.119 33308,23 − 297,22 AE 359617.31 303 -2.7914 4.60e-02 0.119 33307,23 − 298,22 EE 359674.69 303 -4.9449 8.61e-04 0.163 45308,23 − 298,22 EE 359674.69 303 -2.7943 1.22e-01 0.163 45308,23 − 297,22 EE 359674.69 303 -4.9449 8.61e-04 0.163 45307,23 − 297,22 EE 359674.69 303 -2.7943 1.22e-01 0.163 45308,23 − 298,22 AA 359731.98 303 -2.7912 4.60e-02 0.100 28308,23 − 298,22 AA 359731.98 303 -2.7912 4.60e-02 0.102 28307,23 − 297,22 AA 359731.98 303 -2.7911 7.67e-02 0.100 28307,23 − 297,22 AA 359731.98 303 -2.7911 7.67e-02 0.102 28316,25 − 307,24 EA 360706.63 310 -2.7597 3.19e-02 0.152 42317,25 − 306,24 EA 360706.63 310 -2.7597 3.19e-02 0.152 42316,25 − 307,24 AE 360706.68 310 -2.7597 4.78e-02 0.152 42317,25 − 306,24 AE 360706.68 310 -2.7597 1.59e-02 0.152 42317,25 − 307,24 EE 360760.53 310 -2.7647 1.25e-01 0.175 49316,25 − 307,24 EE 360760.53 310 -4.4450 2.61e-03 0.175 49316,25 − 306,24 EE 360760.53 310 -2.7559 1.27e-01 0.175 49317,25 − 306,24 EE 360760.53 310 -6.1629 4.99e-05 0.175 49316,25 − 306,24 AA 360814.30 310 -2.7595 4.78e-02 0.097 27317,25 − 307,24 AA 360814.30 310 -2.7594 7.97e-02 0.097 272314,10 − 2213,9 EE 360915.54 223 -3.2141 6.73e-02 0.088 25326,27 − 316,26 EA 361816.20 317 -2.7310 3.31e-02 0.155 43325,27 − 315,26 EA 361816.20 317 -2.7310 3.31e-02 0.155 43325,27 − 315,26 AE 361816.25 317 -2.7310 4.96e-02 0.155 43326,27 − 316,26 AE 361816.25 317 -2.7311 1.65e-02 0.155 43325,27 − 316,26 EE 361866.27 317 -2.7219 1.30e-01 0.204 57326,27 − 316,26 EE 361866.27 317 -4.4333 2.52e-03 0.204 57325,27 − 315,26 EE 361866.27 317 -4.4333 2.52e-03 0.204 57326,27 − 315,26 EE 361866.27 317 -2.7219 1.30e-01 0.204 57325,27 − 316,26 AA 361916.24 317 -2.7308 4.96e-02 0.133 37326,27 − 315,26 AA 361916.24 317 -2.7308 8.27e-02 0.133 37
Continued on next page
36

Lykke et al.: The ALMA-PILS survey: First detections of ethylene oxide, acetone and propanal toward IRAS 16293-2422
Table B.1 – continued from previous page
Transition Frequency Eup log10(Aul) τ∫
FWHM I δ3 Detection level[MHz] [K] [s−1] [J beam−1 km s−1]
2414,11 − 2313,10 EE 362230.43 240 -3.1534 6.99e-02 0.063 181818,0 − 1717,0 EA 362458.25 164 -2.6580 7.52e-02 0.061 171818,1 − 1717,0 AE 362600.03 164 -2.6576 1.13e-01 0.154 431818,0 − 1717,1 AE 362600.03 164 -2.6576 3.76e-02 0.154 431818,1 − 1717,1 362741.13 164 -2.6571 7.54e-02 0.173 481818,0 − 1717,0 EE 362755.32 164 -2.6569 3.01e-01 0.239 67169,8 − 156,9 EA 362811.49 107 -3.8228 7.25e-03 0.019 5
37

Lykke et al.: The ALMA-PILS survey: First detections of ethylene oxide, acetone and propanal toward IRAS 16293-2422
Table C.1: Acetone lines with high Ka and low Kc quantum numbers
Transition Predicted frequency [MHz]1913,7 - 1812,6 EE 334948.011813,5 - 1712,6 EE 336133.791814,5 - 1713,4 AE 338242.611814,4 - 1713,4 EA 338625.871814,4 - 1713,5 AA 339459.741812,6 - 1711,7 EE 342896.391815,3 - 1714,3 EA 344793.571914,6 - 1813,5 EE 350205.271914,6 - 1813,5 AA 351215.211914,6 - 1813,6 EE 353155.671914,5 - 1813,6 AA 354673.021914,5 - 1813,6 EE 355248.541913,6 - 1812,7 AA 356644.961913,6 - 1812,7 EE 356675.201915,4 - 1814,5 AE 359197.901915,5 - 1814,4 AA 359301.102014,7 - 1913,6 EE 359843.802014,7 - 1913,6 AA 360338.51
Notes. These acetone lines appear missing or shifted when comparing the synthetic spectrum with the observed spectrum. This could be due toperturbations by interactions between the (high Ka, low Kc) levels and the levels from the lowest torsional excited states (Groner et al. 2002).
Appendix C: Acetone lines with high Ka and low Kc quantum numbers
38