THE AIRPORT · THE AIRPORT 3.1 Airport Site Adelaide Airport is located approximately six...
13
5 3 THE AIRPORT 29
Transcript of THE AIRPORT · THE AIRPORT 3.1 Airport Site Adelaide Airport is located approximately six...
5 3THE AIRPORT
29
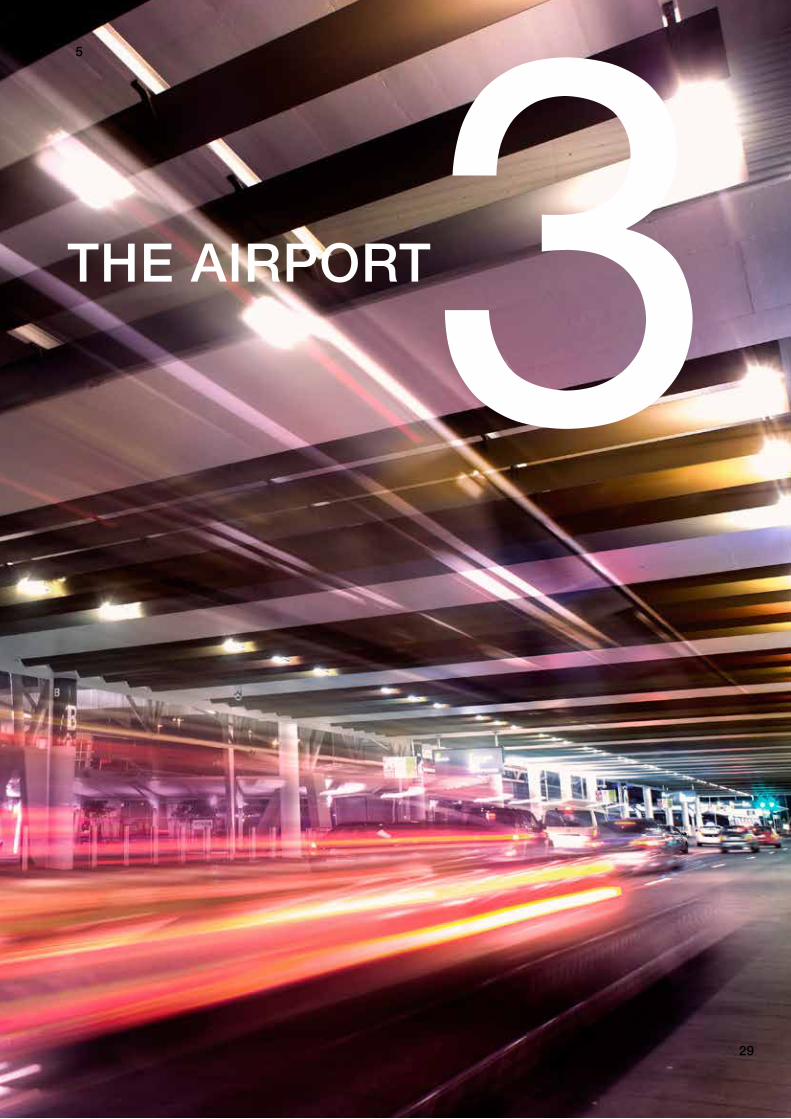
THE AIRPORT
3.1 Airport SiteAdelaide Airport is located approximately six kilometres west of Adelaide’s CBD with its western boundary one kilometre from the shores of Gulf St Vincent. The airport occupies a site of approximately 785 hectares and is well-connected to the City of Adelaide, surrounding suburbs and other major locations in the State through road links.
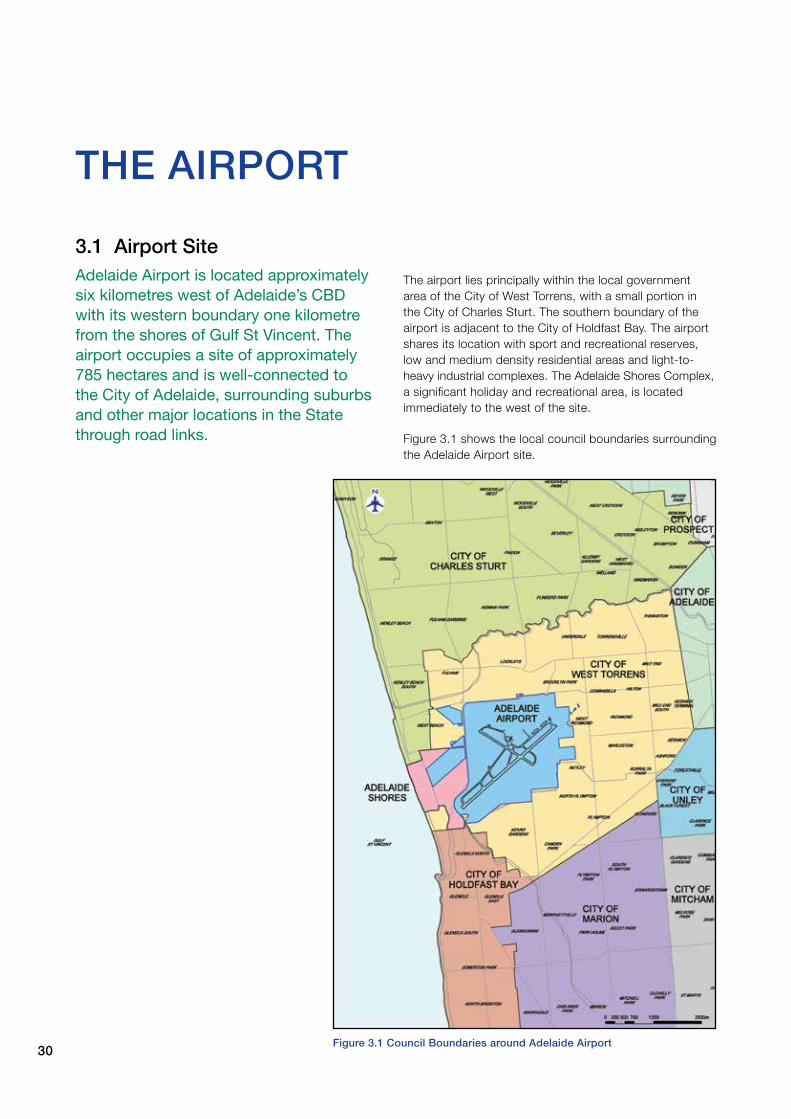
The airport lies principally within the local government area of the City of West Torrens, with a small portion in the City of Charles Sturt. The southern boundary of the airport is adjacent to the City of Holdfast Bay. The airport shares its location with sport and recreational reserves, low and medium density residential areas and light-to-heavy industrial complexes. The Adelaide Shores Complex, asignificantholidayandrecreationalarea,islocatedimmediately to the west of the site.
Figure 3.1 shows the local council boundaries surrounding the Adelaide Airport site.
Figure 3.1 Council Boundaries around Adelaide Airport30
3.2 Airport HistoryAir travel in South Australia commenced during the early part of the 1900s with airfieldsatvariousplacesthroughouttheState,includingNorthfieldandwhatisnow the location of the suburb of St Clair (formerly Cheltenham racecourse).
However, it was not until immediately following World WarIthatAdelaidesawitsfirstofficialoperationalairport.Known as Captain Butler’s Aerodrome, it was located at what is now the suburb of Hendon, nine kilometres north-west of the city, and was used as a base for an Adelaide to Sydney airmail service.
Adelaide’s aviation needs continued to grow and in 1927theexistingParafieldAirportsitewasacquired.By1941 it became evident that the location of this site was operationally unsuitable for the expanded future aviation needs of Adelaide, and investigations for an alternate site for the city’s major airport commenced.
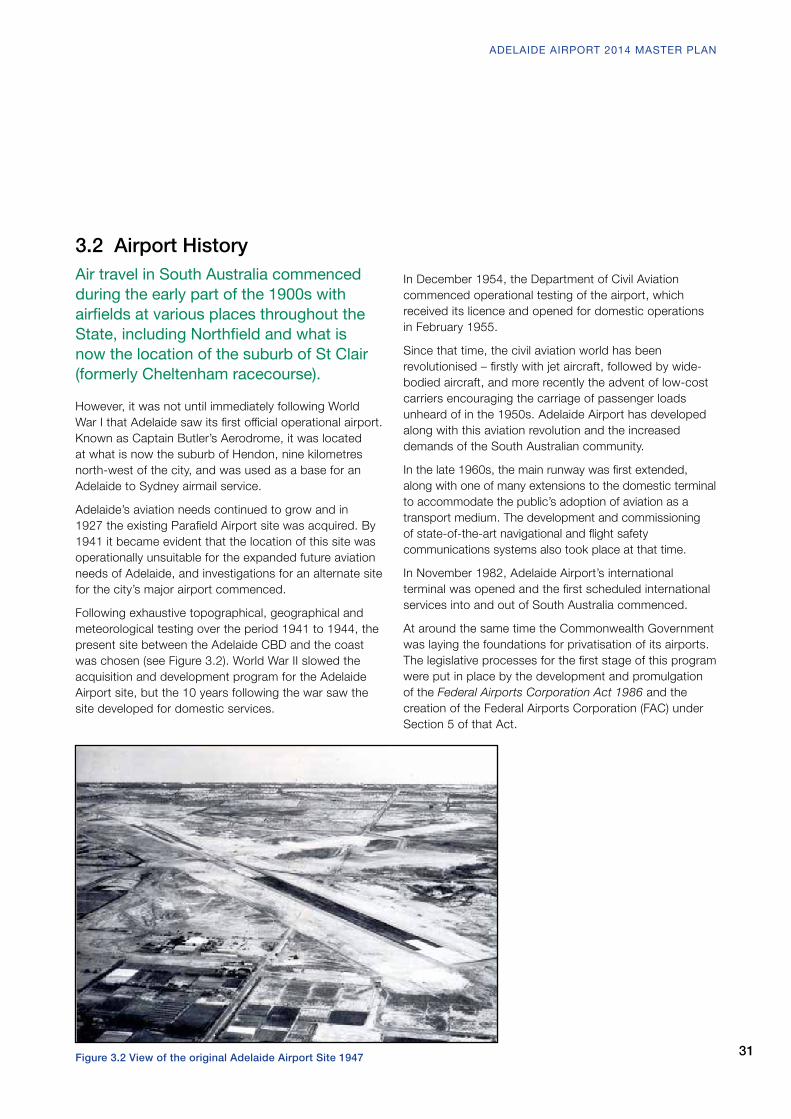
Following exhaustive topographical, geographical and meteorological testing over the period 1941 to 1944, the present site between the Adelaide CBD and the coast was chosen (see Figure 3.2). World War II slowed the acquisition and development program for the Adelaide Airport site, but the 10 years following the war saw the site developed for domestic services.
In December 1954, the Department of Civil Aviation commenced operational testing of the airport, which received its licence and opened for domestic operations in February 1955.
Since that time, the civil aviation world has been revolutionised–firstlywithjetaircraft,followedbywide-bodied aircraft, and more recently the advent of low-cost carriers encouraging the carriage of passenger loads unheard of in the 1950s. Adelaide Airport has developed along with this aviation revolution and the increased demands of the South Australian community.
Inthelate1960s,themainrunwaywasfirstextended,along with one of many extensions to the domestic terminal to accommodate the public’s adoption of aviation as a transport medium. The development and commissioning ofstate-of-the-artnavigationalandflightsafetycommunications systems also took place at that time.
In November 1982, Adelaide Airport’s international terminalwasopenedandthefirstscheduledinternationalservices into and out of South Australia commenced.
At around the same time the Commonwealth Government was laying the foundations for privatisation of its airports. Thelegislativeprocessesforthefirststageofthisprogramwere put in place by the development and promulgation of the Federal Airports Corporation Act 1986 and the creation of the Federal Airports Corporation (FAC) under Section 5 of that Act.
Figure 3.2 View of the original Adelaide Airport Site 1947 31
ADELAIDE AIRPORT 2014 MASTER PLAN
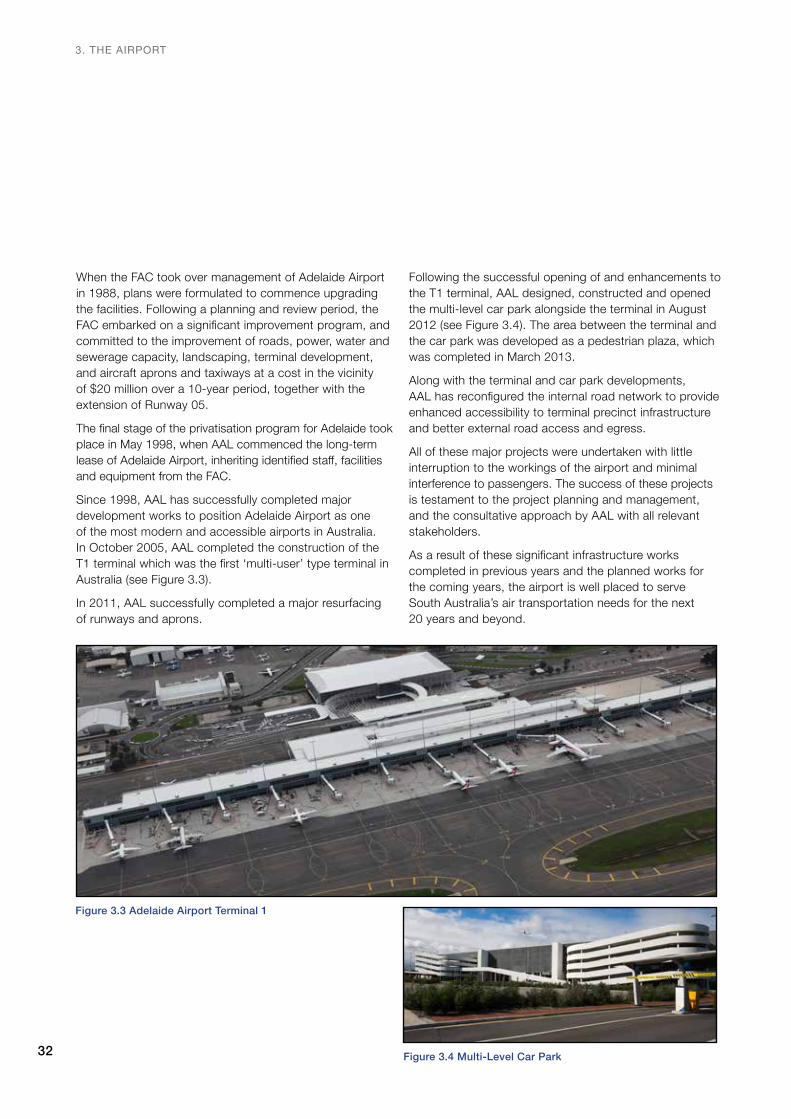
Figure 3.3 Adelaide Airport Terminal 1
Figure 3.4 Multi-Level Car Park
When the FAC took over management of Adelaide Airport in 1988, plans were formulated to commence upgrading the facilities. Following a planning and review period, the FACembarkedonasignificantimprovementprogram,andcommitted to the improvement of roads, power, water and sewerage capacity, landscaping, terminal development, and aircraft aprons and taxiways at a cost in the vicinity of $20 million over a 10-year period, together with the extension of Runway 05.
ThefinalstageoftheprivatisationprogramforAdelaidetookplace in May 1998, when AAL commenced the long-term leaseofAdelaideAirport,inheritingidentifiedstaff,facilitiesand equipment from the FAC.
Since 1998, AAL has successfully completed major development works to position Adelaide Airport as one of the most modern and accessible airports in Australia. In October 2005, AAL completed the construction of the T1terminalwhichwasthefirst‘multi-user’typeterminalinAustralia (see Figure 3.3).
In 2011, AAL successfully completed a major resurfacing of runways and aprons.
Following the successful opening of and enhancements to the T1 terminal, AAL designed, constructed and opened the multi-level car park alongside the terminal in August 2012 (see Figure 3.4). The area between the terminal and the car park was developed as a pedestrian plaza, which was completed in March 2013.
Along with the terminal and car park developments, AALhasreconfiguredtheinternalroadnetworktoprovideenhanced accessibility to terminal precinct infrastructure and better external road access and egress.
All of these major projects were undertaken with little interruption to the workings of the airport and minimal interference to passengers. The success of these projects is testament to the project planning and management, and the consultative approach by AAL with all relevant stakeholders.
Asaresultofthesesignificantinfrastructureworkscompleted in previous years and the planned works for the coming years, the airport is well placed to serve South Australia’s air transportation needs for the next 20 years and beyond.
32
3. THE AIRPORT
Figu
re 3
.5 L
ayou
t of E
xist
ing
Faci
litie
s at
Ade
laid
e Ai
rpor
t
33
ADELAIDE AIRPORT 2014 MASTER PLAN
3.3 FacilitiesAdelaideAirportisaCertifiedAirport(ascertifiedbyCASA) and has facilities to provide for international, domestic and regional passenger airlines, freight services, general aviation, charters and helicopter operations. It also has dedicated facilities for the handling of freight including perishable and other time-sensitive products.
The principal aviation-related facilities at Adelaide Airport include:• a two-runway system comprising the main 05/23 runway
(3100 metres) and a secondary 12/30 runway (1652 metres) together with associated taxiways and apron;
• a multi-user integrated terminal serving international, domesticandregionalcustomersinanefficientandeconomical manner;
• on-airportcarparkingfacilitiesofferingbothshort-and-long-stay car parking, and disabled car parking choices;
• taxi, hire car and bus parking;• rental vehicle parking;• air freight facilities including a six-metre pallet loader and
cold storage facilities;• aircraft maintenance hangars and associated facilities;• in-flightcateringfacilities;• general aviation facilities (including terminals) and helicopter
facilities;• rescueandfire-fightingfacilities;• airtrafficcontrolfacilities;• public transport access;• meteorological facilities; and• aviation fuel facilities.
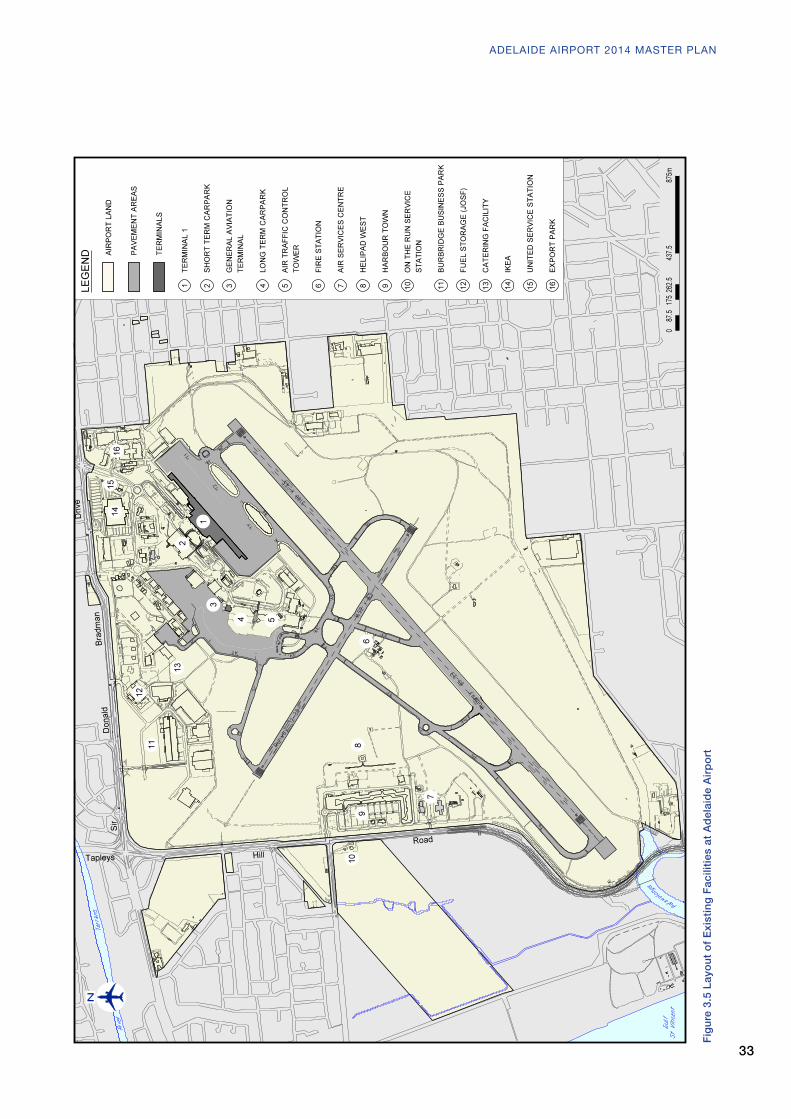
The layout of the facilities at Adelaide Airport is illustrated in Figure 3.5 on the previous page.
The terminal (T1) and associated infrastructure provides 14 aerobridges and the capacity to handle 3,000 passengersperhour;offeringstate-of-the-artamenitiesfor passenger comfort, quality processing and leisure.
3.4 Relationship to Other AirportsAdelaide Airport is the hub airport for the major regional centres of South Australia and has direct services to all mainland capitalcitiesandsignificanttourismicons.Figures 3.6 and 3.7 demonstrate the current and possible domestic and regional locations that have or might be serviced by flightsfromAdelaideAirportonaweeklybasis, and included at Table 3.1. Adelaide Airport’s main runway length of 3,100 metres is more than adequate to meet the demands of interstate andintrastateoperations.Itisalsoofsufficientlength for the departure requirements, in all seasons, of critical long-haul international routes.
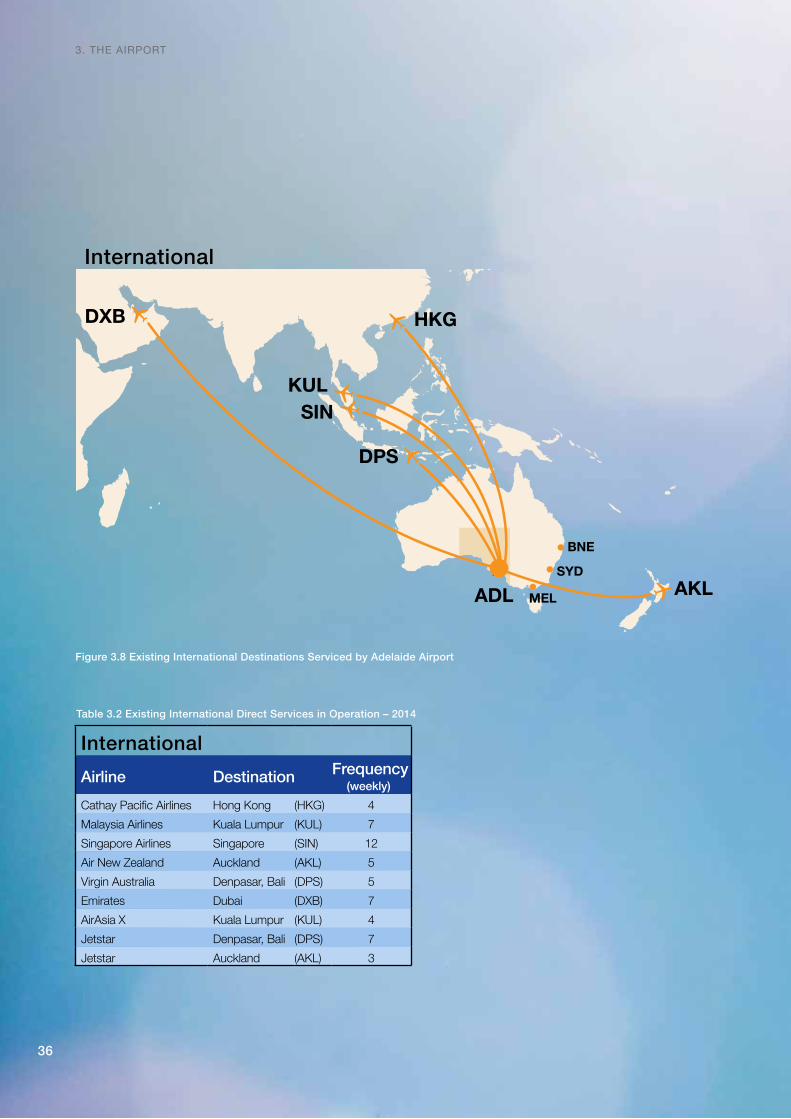
Current international direct services are provided to the cities of Dubai, Hong Kong, Singapore, Kuala Lumpur, Denpasar and Auckland, with additional one-stop links to the rest of the world. The international routes are shown in Figure 3.8, and outlined in Table 3.2 that follows.
The airport operates on a 24-hour basis that, under a curfew, restricts the operation of passenger-carrying jet aircraft between 11.00pm and 6.00am due to the surrounding residential areas. Shoulder periods of one hour exist at each end of the curfew timeframe for international regular public transport services, with a maximum extent of eight arrivals per week (subject to Commonwealth dispensation) and no departures.
AAL continues to work in partnership with all airlines, State Government agencies, the freight and cargo industry and the tourism and hospitality industry, to develop sustainable airline services that meet the air travel, import and export needs and social demands of South Australia.
34
3. THE AIRPORT
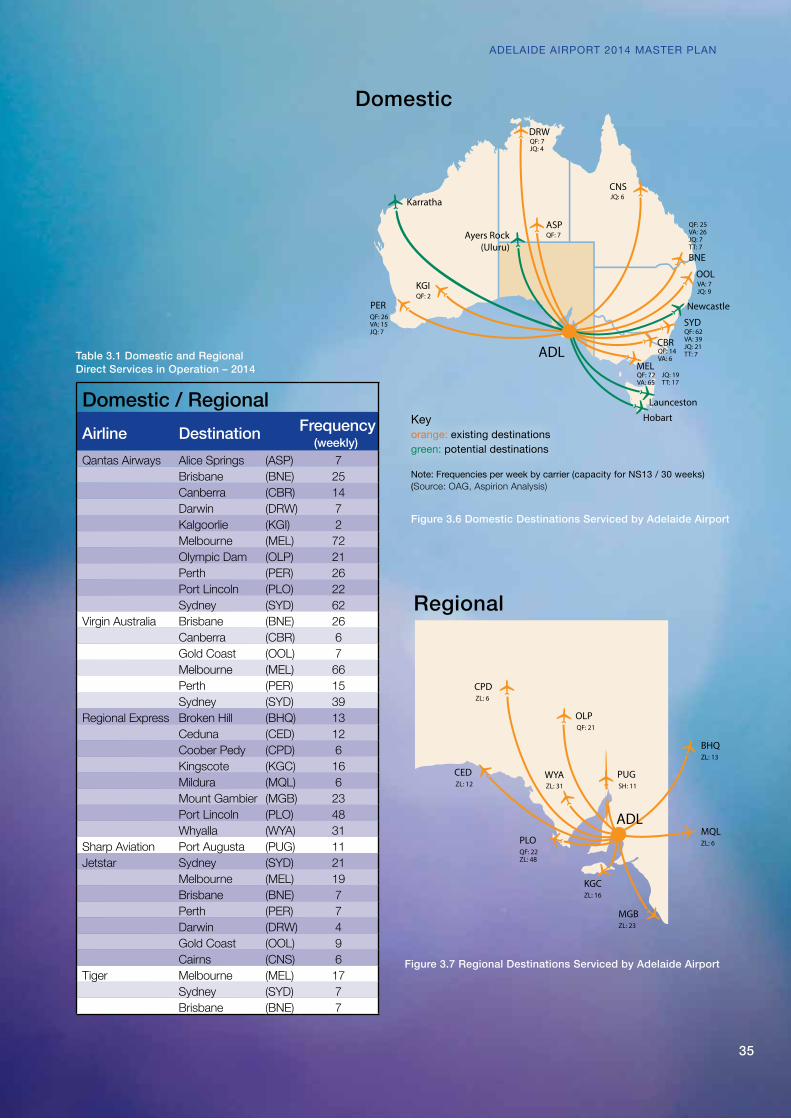
Table 3.1 Domestic and Regional Direct Services in Operation – 2014
PER
KGI
Karratha
DRW
ADL
ASP
CNS
OOL
Newcastle
SYD
CBR
MEL
Launceston
Hobart
Ayers Rock(Uluru)
QF: 26VA: 15JQ: 7
QF: 2
QF: 7JQ: 4
QF: 7
JQ: 6
QF: 25VA: 26JQ: 7TT: 7
VA: 7JQ: 9
QF: 62VA: 39JQ: 21TT: 7
QF: 72VA: 65
BNE
JQ: 19TT: 17
QF: 14VA: 6
CEDZL: 12
CPDZL: 6
OLPQF: 21
PUGSH: 11
WYAZL: 31
BHQZL: 13
MQLZL: 6
MGBZL: 23
KGCZL: 16
PLOQF: 22ZL: 48
ADL
Figure 3.6 Domestic Destinations Serviced by Adelaide Airport
Note: Frequencies per week by carrier (capacity for NS13 / 30 weeks)(Source: OAG, Aspirion Analysis)
Keyorange: existing destinations green: potential destinations
Figure 3.7 Regional Destinations Serviced by Adelaide Airport
Domestic
Regional
Domestic / RegionalAirline Destination Frequency
(weekly)Qantas Airways Alice Springs (ASP) 7
Brisbane (BNE) 25Canberra (CBR) 14Darwin (DRW) 7Kalgoorlie (KGI) 2Melbourne (MEL) 72Olympic Dam (OLP) 21Perth (PER) 26Port Lincoln (PLO) 22Sydney (SYD) 62
Virgin Australia Brisbane (BNE) 26Canberra (CBR) 6Gold Coast (OOL) 7Melbourne (MEL) 66Perth (PER) 15Sydney (SYD) 39
Regional Express Broken Hill (BHQ) 13Ceduna (CED) 12Coober Pedy (CPD) 6Kingscote (KGC) 16Mildura (MQL) 6Mount Gambier (MGB) 23Port Lincoln (PLO) 48Whyalla (WYA) 31
Sharp Aviation Port Augusta (PUG) 11Jetstar Sydney (SYD) 21
Melbourne (MEL) 19Brisbane (BNE) 7Perth (PER) 7Darwin (DRW) 4Gold Coast (OOL) 9Cairns (CNS) 6
Tiger Melbourne (MEL) 17Sydney (SYD) 7Brisbane (BNE) 7
ADELAIDE AIRPORT 2014 MASTER PLAN
35
BNE
SYD
MELADL AKL
HKG
KULSIN
DPS
DXB
Figure 3.8 Existing International Destinations Serviced by Adelaide Airport
International
InternationalAirline Destination Frequency
(weekly)CathayPacificAirlines Hong Kong (HKG) 4Malaysia Airlines Kuala Lumpur (KUL) 7Singapore Airlines Singapore (SIN) 12Air New Zealand Auckland (AKL) 5Virgin Australia Denpasar, Bali (DPS) 5Emirates Dubai (DXB) 7AirAsia X Kuala Lumpur (KUL) 4Jetstar Denpasar, Bali (DPS) 7Jetstar Auckland (AKL) 3
Table 3.2 Existing International Direct Services in Operation – 2014
36
3. THE AIRPORT
3.5 Economic SignificanceAdelaide Airport is the aviation gateway to South Australia. It makes an important contribution to the South Australian economy through employment and value-added production associated with the airport’s business activities (both aviation and non-aviation related businesses). This is measured through a combination of a business survey and economic modelling to estimate the direct and indirect (multiplier) economic benefitsattributabletoairportactivity.
3.5.1 Economic ImpactAircraft movements and the number of passengers at Adelaide Airport has substantially increased in 2013. International passengers increased as a result of Emirates, SingaporeAirlines,CathayPacific,AirNewZealandandMalaysia Airlines increasing services. Low-cost operator AirAsia X introduced a Kuala Lumpur service in October 2013, while Jetstar began international services to Denpasar (Bali) and Auckland in December 2013.
Adelaide Airport achieved record growth in passenger numbers in 2011, totalling 7.1 million. Passenger movements increased to 7.2 million in 2012, and further increased to 7.5 million in 2013. Of these passengers, 89% were domestic and regional, with the remaining being international passengers.
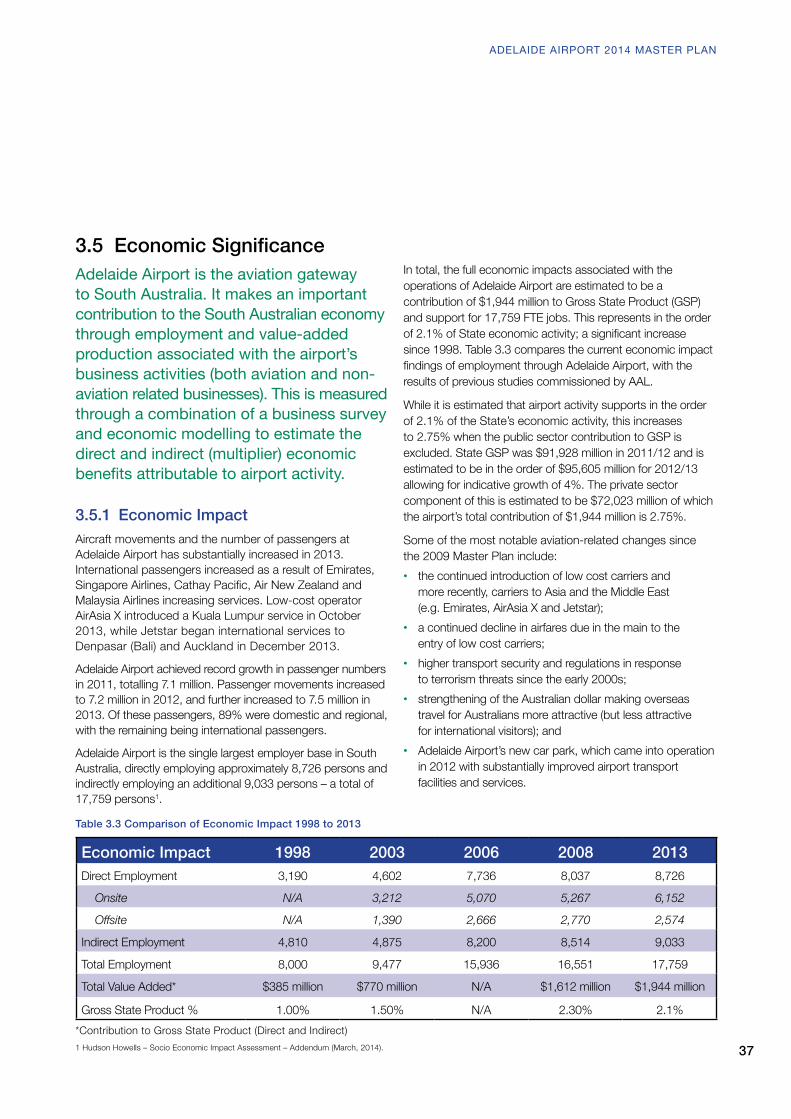
Adelaide Airport is the single largest employer base in South Australia, directly employing approximately 8,726 persons and indirectly employing an additional 9,033 persons – a total of 17,759 persons1.
In total, the full economic impacts associated with the operations of Adelaide Airport are estimated to be a contribution of $1,944 million to Gross State Product (GSP) and support for 17,759 FTE jobs. This represents in the order of2.1%ofStateeconomicactivity;asignificantincreasesince 1998. Table 3.3 compares the current economic impact findingsofemploymentthroughAdelaideAirport,withtheresults of previous studies commissioned by AAL.
While it is estimated that airport activity supports in the order of 2.1% of the State’s economic activity, this increases to 2.75% when the public sector contribution to GSP is excluded. State GSP was $91,928 million in 2011/12 and is estimated to be in the order of $95,605 million for 2012/13 allowing for indicative growth of 4%. The private sector component of this is estimated to be $72,023 million of which the airport’s total contribution of $1,944 million is 2.75%.
Some of the most notable aviation-related changes since the 2009 Master Plan include:• the continued introduction of low cost carriers and
more recently, carriers to Asia and the Middle East (e.g. Emirates, AirAsia X and Jetstar);
• a continued decline in airfares due in the main to the entry of low cost carriers;
• higher transport security and regulations in response to terrorism threats since the early 2000s;
• strengthening of the Australian dollar making overseas travel for Australians more attractive (but less attractive for international visitors); and
• Adelaide Airport’s new car park, which came into operation in 2012 with substantially improved airport transport facilities and services.
Table 3.3 Comparison of Economic Impact 1998 to 2013
*Contribution to Gross State Product (Direct and Indirect)
Economic Impact 1998 2003 2006 2008 2013Direct Employment 3,190 4,602 7,736 8,037 8,726
Onsite N/A 3,212 5,070 5,267 6,152
Offsite N/A 1,390 2,666 2,770 2,574
Indirect Employment 4,810 4,875 8,200 8,514 9,033
Total Employment 8,000 9,477 15,936 16,551 17,759
Total Value Added* $385 million $770 million N/A $1,612 million $1,944 million
Gross State Product % 1.00% 1.50% N/A 2.30% 2.1%
1 Hudson Howells – Socio Economic Impact Assessment – Addendum (March, 2014). 37
ADELAIDE AIRPORT 2014 MASTER PLAN
3.5.2 Freight MovementsThe South Australian Government’s Department of Planning, TransportandInfrastructure(DPTI)identifiesthefollowingair freight export data and trends in its most recent South Australia Exports by Air report (DPTI 2014): • In the 2013 calendar year, South Australia exported more
than 14,280 tonnes of products worth almost $570 million by air. The total tonnage exported by air loaded at Adelaide Airportandflowndirectlytointernationaldestinationsortranshipped to interstate gateways (by air and road) for export over the past seven years is shown in Figure 3.9. The total exports by value is shown in Figure 3.10.
• 2013 saw a decrease of 782.3 tonnes (or -5.2%) from 2012 in total SA exports by air. The total actually loaded for export at Adelaide Airport, however, increased by 820.1 tonnes or 11.4%, which resulted in the proportion of the total loaded at Adelaide increasing from 47.6% in 2012 to 55.9% in 2013.
• The volume of all product types exported through interstate gateways (via air and road) decreased by more than 1,602 tonnes or 20.3%.
Singapore was SA’s biggest export market by volume in 2013 at over 2,215 tonnes, increasing by some 30.6% over 2012 and amounting to 15.5% of total exports, by attracting relatively low volume horticultural products and live animals.
Switzerlandrankedfirstbyvalueofexportsat25.6%ofthe total, increasing from $9.7 million in 2012 to $185 million in 2013, with new exports of wrought silver at 195.4 tonnes, plus fresh beef.
Othersignificantexportswere:• Vietnam – Fresh beef and lobsters;• China – Table wine and frozen beef; and• United Arab Emirates – Fruit and vegetables.
The results of a recent survey undertaken by AAL suggest that Adelaide Airport can expect sustained increases in outbound freight volumes over the next 5 years in the order of 1 to 2% per annum (predominantly manufactured goods and seafood). These results are consistent with the above export results for 2013 and suggest that total outbound air freight volumes (direct export and transhipped) could start toreturntothoseexperiencedpriortotheglobalfinancialcrisis. For example, 2% growth in freight per annum over the next 5 years would increase SA exports by air (direct and transhipped) from 14,280 tonnes to around 16,000 tonnes per annum.
Notwithstanding this expected growth in outbound air freight, inbound air freight is expected to grow at double the outbound rate and be in the order of 2 to 4% per annum over the next 5 years and between 6.8% and 9.7% per annum over the next 20 years. This highlights the changes taking place in the South Australian economy and a greater reliance on imported manufactured goods.
Air freight statistics for Adelaide Airport indicate that in 2012 there were approximately 6,100 tonnes of freight imported from overseas, with the major source markets being the USA, China, Germany and the United Kingdom. Growth of 4% per annum over the next 5 years could see this volume rise to in the order of 7,420 tonnes per annum.
The above data is consistent with the AAL survey results, with the exceptions of Singapore and Thailand. However, the growth of these inbound markets can be expected given the Australian manufacturing trends already noted above, and as both Singapore and Thailand are already rating in South Australia’s top 10 air import markets.
38
3. THE AIRPORT
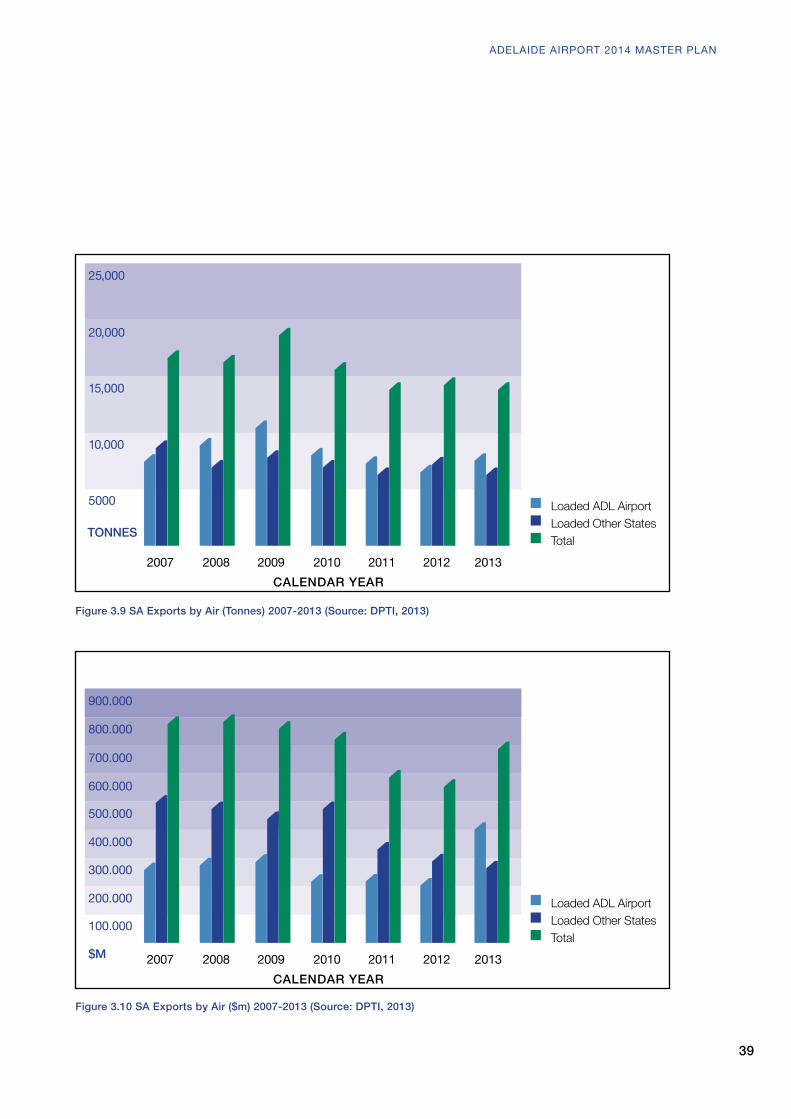
Figure 3.9 SA Exports by Air (Tonnes) 2007-2013 (Source: DPTI, 2013)
Figure 3.10 SA Exports by Air ($m) 2007-2013 (Source: DPTI, 2013)
5000
100.000
TONNES
$M
2012
2012
2011
2011
2010
2010
2009
2009
2008
2008
2007
2007
CALENDAR YEAR
CALENDAR YEAR
2013
2013
10,000
300.000
200.000
15,000
500.000
400.000
20,000
700.000
600.000
25,000
900.000
800.000
Loaded ADL AirportLoaded Other StatesTotal
Loaded ADL AirportLoaded Other StatesTotal
39
ADELAIDE AIRPORT 2014 MASTER PLAN
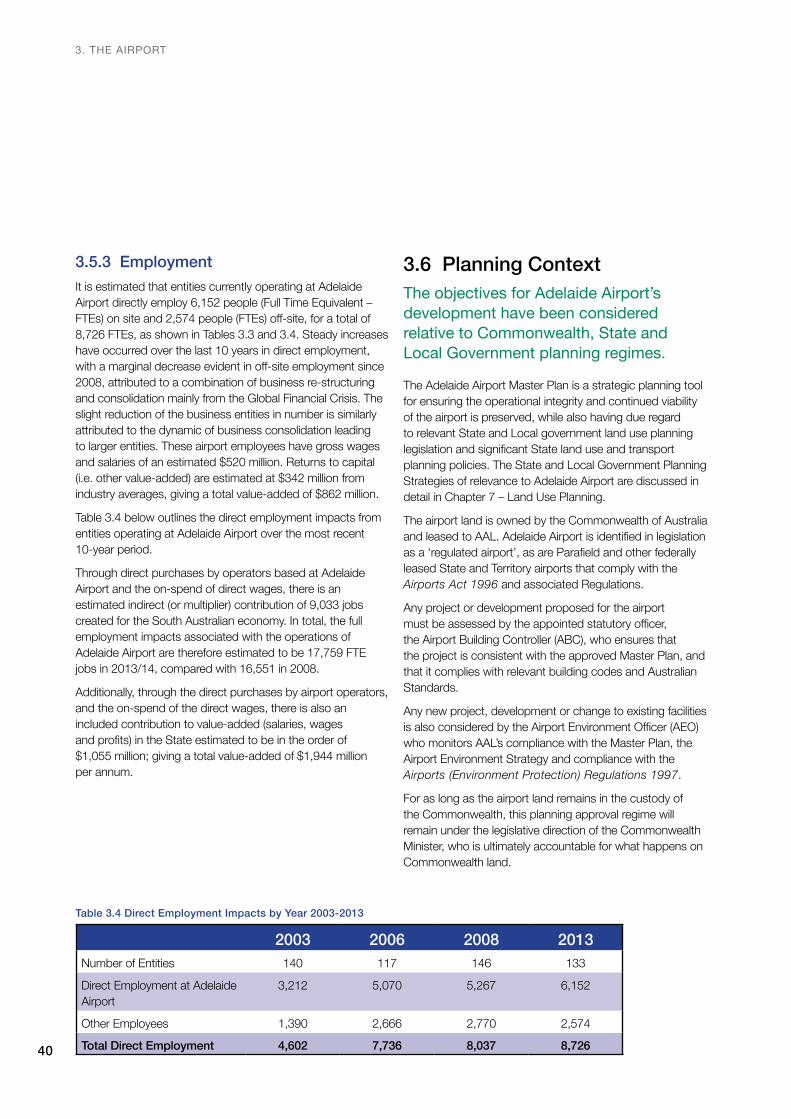
3.5.3 EmploymentIt is estimated that entities currently operating at Adelaide Airport directly employ 6,152 people (Full Time Equivalent – FTEs)onsiteand2,574people(FTEs)off-site,foratotalof8,726 FTEs, as shown in Tables 3.3 and 3.4. Steady increases have occurred over the last 10 years in direct employment, withamarginaldecreaseevidentinoff-siteemploymentsince2008, attributed to a combination of business re-structuring and consolidation mainly from the Global Financial Crisis. The slight reduction of the business entities in number is similarly attributed to the dynamic of business consolidation leading to larger entities. These airport employees have gross wages and salaries of an estimated $520 million. Returns to capital (i.e. other value-added) are estimated at $342 million from industry averages, giving a total value-added of $862 million.
Table 3.4 below outlines the direct employment impacts from entities operating at Adelaide Airport over the most recent 10-year period.
Through direct purchases by operators based at Adelaide Airport and the on-spend of direct wages, there is an estimated indirect (or multiplier) contribution of 9,033 jobs created for the South Australian economy. In total, the full employment impacts associated with the operations of Adelaide Airport are therefore estimated to be 17,759 FTE jobs in 2013/14, compared with 16,551 in 2008.
Additionally, through the direct purchases by airport operators, and the on-spend of the direct wages, there is also an included contribution to value-added (salaries, wages andprofits)intheStateestimatedtobeintheorderof$1,055 million; giving a total value-added of $1,944 million per annum.
3.6 Planning ContextThe objectives for Adelaide Airport’s development have been considered relative to Commonwealth, State and Local Government planning regimes.
The Adelaide Airport Master Plan is a strategic planning tool for ensuring the operational integrity and continued viability of the airport is preserved, while also having due regard to relevant State and Local government land use planning legislationandsignificantStatelanduseandtransportplanning policies. The State and Local Government Planning Strategies of relevance to Adelaide Airport are discussed in detail in Chapter 7 – Land Use Planning.
The airport land is owned by the Commonwealth of Australia andleasedtoAAL.AdelaideAirportisidentifiedinlegislationasa‘regulatedairport’,asareParafieldandotherfederallyleased State and Territory airports that comply with the Airports Act 1996 and associated Regulations.
Any project or development proposed for the airport mustbeassessedbytheappointedstatutoryofficer, the Airport Building Controller (ABC), who ensures that the project is consistent with the approved Master Plan, and that it complies with relevant building codes and Australian Standards.
Any new project, development or change to existing facilities isalsoconsideredbytheAirportEnvironmentOfficer(AEO)who monitors AAL’s compliance with the Master Plan, the Airport Environment Strategy and compliance with the Airports (Environment Protection) Regulations 1997.
For as long as the airport land remains in the custody of the Commonwealth, this planning approval regime will remain under the legislative direction of the Commonwealth Minister, who is ultimately accountable for what happens on Commonwealth land.
Table 3.4 Direct Employment Impacts by Year 2003-2013
2003 2006 2008 2013Number of Entities 140 117 146 133
Direct Employment at Adelaide Airport
3,212 5,070 5,267 6,152
Other Employees 1,390 2,666 2,770 2,574
Total Direct Employment 4,602 7,736 8,037 8,72640
3. THE AIRPORT
Accordingly, the principal development objectives for Adelaide Airport include:• airport capacity to meet future demand from the aviation
industry;• the continuing commercial viability of the airport
as a business;• safeandefficientaircraftoperationsattheairport
into the future; and• environmental protection from noise and other
potential impacts;• provisionofsafeandefficientaccessintoandwithinthe
airport for ground transport.
Themasterplanningprocessensuresthatsufficientlandhasbeenidentifiedtomeetthecommunity’sdemandforairtransport growth and supporting activities. Additionally, the Master Plan assists in ensuring structured development of commercial and industrial areas to guarantee the ongoing viability of the airport as a major component of the State’s transport infrastructure.
The planning assessment process for development on airport land addresses issues such as the height
of developments, wildlife hazards and the impact of lighting on aircraft operations
in the vicinity of the airport. The planning assessment process
and development principles are further discussed in
Chapter 7 – Land Use Planning.
41
ADELAIDE AIRPORT 2014 MASTER PLAN