The Aging Physician Workforce: A Demographic DilemmaTHE AGING PHYSICIAN WORKFORCE: A DEMOGRAPHIC...
16
The Aging Physician Workforce: A Demographic Dilemma A resource provided by Merritt Hawkins, the nation’s leading physician search and consulting firm and a company of AMN Healthcare (NYSE: AHS), the largest healthcare workforce solutions company in the United States. www.merritthawkins.com 800-876-0500 © 2015 Merritt Hawkins 5001 Statesman Drive Irving, Texas 75063
Transcript of The Aging Physician Workforce: A Demographic DilemmaTHE AGING PHYSICIAN WORKFORCE: A DEMOGRAPHIC...

The Aging Physician Workforce:
A Demographic Dilemma
A resource provided by Merritt Hawkins, the nation’s leading physician search and
consulting firm and a company of AMN Healthcare (NYSE: AHS), the largest
healthcare workforce solutions company in the United States.
www.merritthawkins.com 800-876-0500
© 2015 Merritt Hawkins 5001 Statesman Drive Irving, Texas 75063

THE AGING PHYSICIAN WORKFORCE:
A DEMOGRAPHIC DILEMMA
A resource provided by Merritt Hawkins, the nation’s leading physician search and consulting firm and a
company of AMN Healthcare
Introduction
It can be said of each one of us, of the nation as a whole, and of its 750,000-plus physicians: we are not
getting any younger.
Advances in technology, nutrition, healthcare delivery services, and overall quality of life have extended the
life expectancy of people around the world, particularly those in developed countries such as the United
States. The chart below shows percent of population of various countries aged 65 or over. While the
United States is not in the top ten, the U.S. does rank second in the world in percent of population 80 years
old or older.
Source: The World Bank DataBank
Aging patient demographics are a key driver of healthcare demand and delivery. Older patients are more
likely to have a regular healthcare provider, require treatment for chronic conditions, undergo surgical
procedures or diagnostic testing, and access Medicare as a form of insurance coverage than are younger
people, to a highly significant degree.
An important subgroup within the U.S. population – physicians - is aging along with the general population.
25.08
21.14
21.13
19.67
19.33
19.31
19.04
18.77
18.57
18.36
13.96
0 5 10 15 20 25 30
Japan
Germany
Italy
Greece
Sweden
Bulgaria
Finland
Portugal
Latvia
Austria
United States
PERCENTAGE OF POPULATION 65+

The combination of an aging patient population and an aging physician population is creating one of the
underlying drivers of the growing physician shortage.
The doctor shortage recently was projected to reach as many as 90,400 physicians by 2025 as patients
age and as more physicians, prompted in some cases by low morale and a rapidly changing medical
practice environment, choose to retire (for more information on the physician shortage see “The
Complexities of Physician Supply and Demand: Projections from 2013 to 2025”. Association of American
Medical Colleges. March, 2015).
With an aging general population in need of medical coverage, and an aging physician population nearing
retirement, the healthcare system is facing a profound demographic dilemma: who will provide care to the
elderly when physicians themselves age out of the workforce?
In this white paper, Merritt Hawkins, the nation’s leading physician search firm, examines physician and
population aging trends by state and by specialty, looks at healthcare utilization by age, and reveals some
of the reasons a growing number of physicians are likely to retire.

United States Population Demographics
The United States has a current population (2015) of 318,857,056, making it the third most populous country in the world behind China and India. Of that population, 14.1%, or 44,958,845 people, are 65 years of age or older- the portion of the population that requires the most healthcare coverage. A breakdown of population age by state is below:
State Total Population
(2014) Population 65+
(2014) Percentage of Population
65+
Alabama 4,849,377 722,557 14.9%
Alaska 736,732 66,306 9.0%
Arizona 6,731,484 1,036,649 15.4%
Arkansas 2,966,369 456,821 15.4%
California 38,802,500 4,850,313 12.5%
Colorado 5,355,866 658,772 12.3%
Connecticut 3,596,677 546,695 15.2%
Delaware 935,614 148,763 15.9%
Washington, D.C. 658,893 75,114 11.4%
Florida 19,893,297 3,720,047 18.7%
Georgia 10,097,343 1,211,681 12.0%
Hawaii 1,419,561 221,452 15.6%
Idaho 1,634,464 225,556 13.8%
Illinois 12,880,580 1,738,878 13.5%
Indiana 6,596,855 916,963 13.9%
Iowa 3,107,126 484,712 15.6%
Kansas 2,904,021 406,563 14.0%
Kentucky 4,413,457 635,538 14.4%
Louisiana 4,649,676 618,407 13.3%
Maine 1,330,089 235,426 17.7%
Maryland 5,976,407 800,839 13.4%
Massachusetts 6,745,408 998,320 14.8%
Michigan 9,909,877 1,486,482 15.0%
Minnesota 5,457,173 758,547 13.9%
Mississippi 2,994,079 416,177 13.9%
Missouri 6,063,589 909,538 15.0%
Montana 1,023,579 165,820 16.2%
Nebraska 1,881,503 265,292 14.1%
Nevada 2,839,099 388,957 13.7%
New Hampshire 1,326,813 204,329 15.4%
New Jersey 8,938,175 1,287,097 14.4%
New Mexico 2,085,572 306,579 14.7%
New York 19,746,227 2,843,457 14.4%
North Carolina 9,943,964 1,421,987 14.3%
North Dakota 739,482 105,006 14.2%
Ohio 11,594,163 1,750,719 15.1%
Oklahoma 3,878,051 554,561 14.3%
Oregon 3,970,239 615,387 15.5%

Pennsylvania 12,787,209 2,097,102 16.4%
Rhode Island 1,055,173 163,552 15.5%
South Carolina 4,832,482 734,537 15.2%
South Dakota 853,175 127,123 14.9%
Tennessee 6,549,352 962,755 14.7%
Texas 26,956,958 3,019,179 11.2%
Utah 2,942,902 288,404 9.8%
Vermont 626,562 102,756 16.4%
Virginia 8,326,289 1,115,723 13.4%
Washington 7,061,530 960,368 13.6%
West Virginia 1,850,326 320,106 17.3%
Wisconsin 5,757,564 852,119 14.8%
Wyoming 584,153 78,861 13.5%
United States 318,857,056 44,958,845 14.1%
Source: U.S. Census Bureau
Not surprisingly, Florida ranks as the oldest state on average, with close to 19 percent of the population 65 or older and eligible for Medicare. This is a harbinger of the future. By 2030, the U.S. Census Bureau projects that the entire nation will be as old on average as Florida is now. Over the next few decades, the Census Bureau projects that this aging population will increase at a steady rate- reaching nearly 100 million individuals aged 65 or older by the year 2060 (see chart below).
United States Population Projections for Individuals 65 and Older
Current 2020 2030 2040 2050 2060
44,958,845 56,441,000 74,107,000 82,344,000 87,996,000 98,164,000
Source: U.S. Census Bureau These projections represent a significant portion of the U.S. population that will require a growing volume of healthcare services over coming decades, an important factor when considering supply and demand of
0
20,000,000
40,000,000
60,000,000
80,000,000
100,000,000
120,000,000
Current 2020 2030 2040 2050 2060
U.S. Population Projections Age 65+

physician providers and advanced practitioners. A large portion of individuals aged 65 or older utilize Medicare for health insurance coverage. Individuals qualify for Medicare if:
They are 65 years old or older and are a U.S. citizen/permanent legal resident; and
The individual or their spouse has worked long enough to collect Social Security or railroad
retirement benefits; or
The individual or their spouse has paid Medicare payroll taxes while working.
Source: American Association of Retired Persons (AARP)
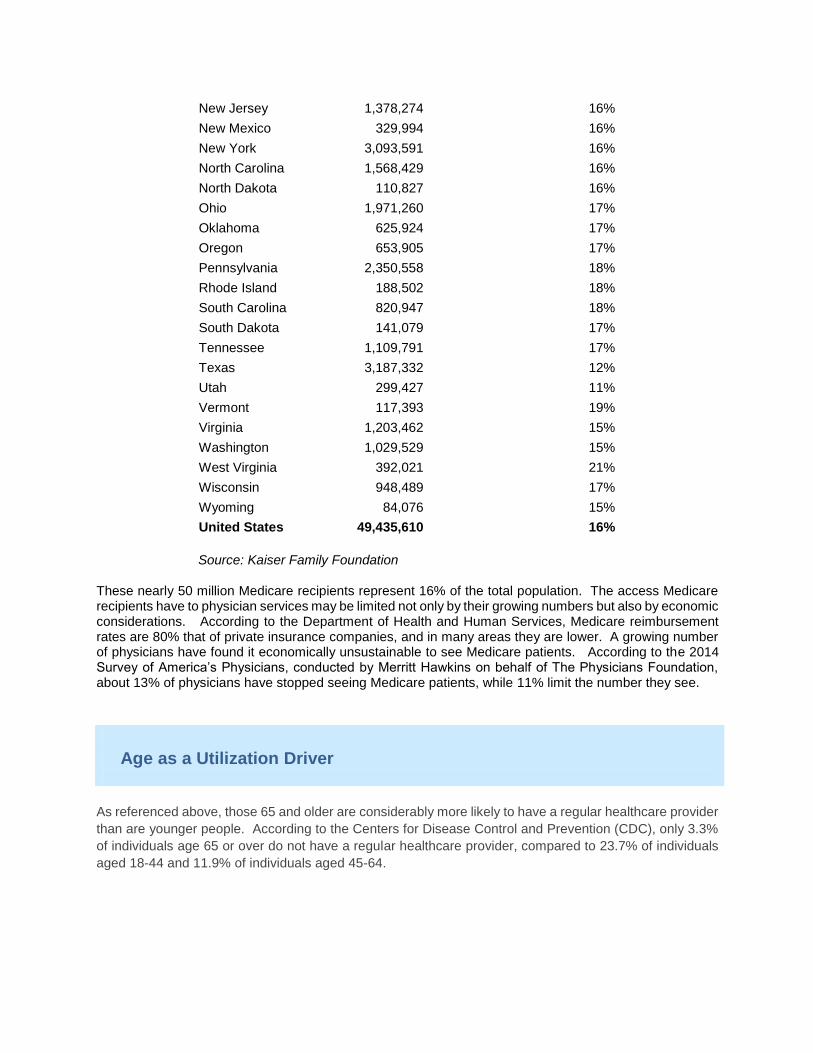
Based on these qualifications, nearly 50 million individuals accessed Medicare insurance coverage in 2012, according to the Kaiser Family Foundation. A state-by-state breakdown is below:
Location
Total Medicare
Beneficiaries Percentage of Total
Population
Alabama 881,686 18%
Alaska 69,301 10%
Arizona 977,447 15%
Arkansas 552,375 19%
California 5,000,198 13%
Colorado 667,277 13%
Connecticut 586,545 16%
Delaware 157,289 17%
Washington, D.C. 81,260 13%
Florida 3,527,830 19%
Georgia 1,318,733 13%
Hawaii 217,678 16%
Idaho 242,889 15%
Illinois 1,907,859 15%
Indiana 1,048,499 16%
Iowa 531,209 17%
Kansas 448,215 16%
Kentucky 793,271 18%
Louisiana 718,037 16%
Maine 276,467 21%
Maryland 827,426 14%
Massachusetts 1,104,483 17%
Michigan 1,728,338 18%
Minnesota 819,803 15%
Mississippi 516,809 17%
Missouri 1,040,491 17%
Montana 177,835 18%
Nebraska 287,565 16%
Nevada 379,860 14%
New Hampshire 231,444 18%
New Jersey 1,378,274 16%
New Mexico 329,994 16%
New York 3,093,591 16%
North Carolina 1,568,429 16%
North Dakota 110,827 16%
Ohio 1,971,260 17%
Oklahoma 625,924 17%
Oregon 653,905 17%
Pennsylvania 2,350,558 18%
Rhode Island 188,502 18%
South Carolina 820,947 18%
South Dakota 141,079 17%
Tennessee 1,109,791 17%
Texas 3,187,332 12%
Utah 299,427 11%
Vermont 117,393 19%
Virginia 1,203,462 15%
Washington 1,029,529 15%
West Virginia 392,021 21%
Wisconsin 948,489 17%
Wyoming 84,076 15%
United States 49,435,610 16%
Source: Kaiser Family Foundation
These nearly 50 million Medicare recipients represent 16% of the total population. The access Medicare recipients have to physician services may be limited not only by their growing numbers but also by economic considerations. According to the Department of Health and Human Services, Medicare reimbursement rates are 80% that of private insurance companies, and in many areas they are lower. A growing number of physicians have found it economically unsustainable to see Medicare patients. According to the 2014 Survey of America’s Physicians, conducted by Merritt Hawkins on behalf of The Physicians Foundation, about 13% of physicians have stopped seeing Medicare patients, while 11% limit the number they see.
Age as a Utilization Driver
As referenced above, those 65 and older are considerably more likely to have a regular healthcare provider
than are younger people. According to the Centers for Disease Control and Prevention (CDC), only 3.3%
of individuals age 65 or over do not have a regular healthcare provider, compared to 23.7% of individuals
aged 18-44 and 11.9% of individuals aged 45-64.

Source: Centers for Disease Control and Prevention (CDC) Summary Health
Statistics for U.S. Adults: National Health Interview Survey, 2012
According, those 65 and older generate a considerably higher number of physician visits per year than do
those in younger age cohorts. The chart below indicates that young adults are much more likely not to
see a physician in the course of a year than are older people, and that older people are much more likely
to see a physician multiple times during the year than are younger people.
Number of Physician Visits in Last 12 Months
Number of Visits
Age None 1 2 or 3 4 to 9 10+
18-44 27.2% 21.0% 24.3% 16.9% 10.6%
45-64 16.0% 17.5% 27.5% 25.0% 13.9%
65-74 7.5% 12.6% 27.6% 34.0% 18.3%
75+ 5.8% 8.5% 24.3% 38.7% 22.6%
Source: Centers for Disease Control and Prevention (CDC) Summary Health Statistics
for U.S. Adults: National Health Interview Survey, 2012
In addition to generating proportionately more physician visits, older patients are also more likely to
undergo inpatient procedures than are younger patients. CDC data for 2010 analyzing some 51,430,000
inpatient procedures indicate that 67.4% were undergone by patients 45 years of age or older.
23.7%
11.9%
3.3%
0.0%
10.0%
20.0%
30.0%
18-44 45-64 65+
Age Group
Individuals Without Regular Healthcare Provider
0.0%
10.0%
20.0%
30.0%
40.0%
50.0%
None 1 2 or 3 4 to 9 10+
PER
CEN
TAG
E O
F A
GE
GR
OU
P
NUMBER OF VISITS
Number of Physician Visits in Last 12 Months
18-44 45-64 65-74 75+

Age Number of Inpatient
Procedures Percentage
Under 15 1,771,000 3.4%
15 to 44 15,036,000 29.2%
45-64 15,404,000 30.0%
65+ 19,219,000 37.4%
Total 51,430,000
Source: Center for Disease Control and Prevention
Though they represent only 14% of the population, people 65 and older generate over 37% of all inpatient
procedures.
Older individuals are also more likely to undergo diagnostic testing or treatments than are younger
individuals. In 2010, the CDC reports that of the 16,893,000 diagnostic treatments, 47.1% were undergone
by individuals 65 or older:
Age Number of Diagnostic
Treatments Percentage
Under 15 741,000 4.4%
15 to 44 2,607,000 15.4%
45-64 5,591,000 33.1%
65+ 7,954,000 47.1%
Total 16,893,000
Under 15, 3.4%
15 to 44, 29.2%
45-64, 30.0%
65+, 37.4%
IN-PATIENT PROCEDURES BY AGE GROUP

Source: Center for Disease Control and Prevention
As these figures indicate, the Medicare-eligible population continues to drive the greatest demand for
healthcare services, through frequency of physician visits and utilization of diagnostic testing/treatments
and in-patient procedures. As the portion of this population continues to grow in size over the coming
decades, it will be essential to generate physician supply and other healthcare resources commensurately.
The Graying of the Physician Workforce
While the general population is rapidly aging it also is true that “Young Doctor Kildaire” is no longer so
young. According to the Association of American Medical Colleges (AAMC) 2013 State Physician
Workforce Data Book, 27.6% of the physician population is 60 years of age or older- a total of 225,221
physicians. Below is a breakdown of physicians 60 or older by state:
State Number of
Physicians 60+ Percentage of Physician
Population
Alabama 2,612 27.0%
Alaska 477 26.4%
Arizona 3,988 26.5%
Arkansas 1,609 28.6%
California 30,835 31.5%
Colorado 3,548 25.6%
Connecticut 3,442 28.8%
Delaware 590 24.2%
Washington, D.C. 1,653 29.7%
Florida 14,318 29.4%
Georgia 5,266 24.7%
Hawaii 1,229 30.5%
Idaho 721 24.6%
Illinois 8,865 26.2%
Indiana 3,625 25.4%
Under 15, 4.4%
15 to 44, 15.4%
45-64, 33.1%
65+, 47.1%
USE OF DIAGNOSTIC TESTS/TREATMENTS BY AGE GROUP

Iowa 1,608 25.1%
Kansas 1,716 27.9%
Kentucky 2,499 25.9%
Louisiana 3,161 29.2%
Maine 1,243 30.5%
Maryland 6,307 29.4%
Massachusetts 7,516 26.8%
Michigan 7,352 28.0%
Minnesota 3,516 23.7%
Mississippi 1,511 28.0%
Missouri 3,996 26.2%
Montana 716 31.2%
Nebraska 991 24.3%
Nevada 1,332 25.0%
New Hampshire 997 25.3%
New Jersey 7,682 30.1%
New Mexico 1,610 33.3%
New York 20,474 30.0%
North Carolina 5,214 22.6%
North Dakota 427 25.9%
Ohio 7,742 24.9%
Oklahoma 2,237 29.7%
Oregon 2,932 26.7%
Pennsylvania 10,478 27.3%
Rhode Island 923 26.0%
South Carolina 2,586 25.2%
South Dakota 473 25.7%
Tennessee 4,119 26.5%
Texas 13,599 25.1%
Utah 1,403 24.2%
Vermont 589 28.3%
Virginia 5,322 25.8%
Washington 5,119 27.8%
West Virginia 1,337 30.1%
Wisconsin 3,395 23.3%
Wyoming 321 29.2%
United States 225,221 27.6%
Source: AAMC 2013 State Physician Workforce Data Book
While the overall physician population is aging, some specialties are aging faster than others.
Percent of Physicians 55 and Older by Specialty
Specialty Percentage
Pulmonology 73%
Oncology 66%
Psychiatry 59%

Cardiology 54%
Orthopedic Surgery 52%
Neurology 50%
General Surgery 48%
Ophthalmology 48%
Urology 48%
Radiology 47%
Gastroenterology 45%
Neurological Surgery 45%
Otolaryngology 45%
Anesthesiology 44%
Dermatology 43%
Hematology/Oncology 41%
Internal Medicine 40%
Vascular Surgery 40%
Family Practice 38%
Obstetrics/Gynecology 38%
Pediatrics 38%
Emergency Medicine 34%
Nephrology 34%
Source: Merritt Hawkins’ Physician Staffing Slide Rule; 2013 American Medical
Association (AMA) Master File)
Of these 23 major specialties, 13 are 45% or more comprised of physicians 55 years old and older.
Internal medicine subspecialists and surgical specialists often treat the pathologies and conditions
associated with aging, and it is these physicians who are aging out the fastest at the precise time when
patient demographics are inexorably driving need for medical specialists higher.
A Wave of Retirements
As these numbers show, a significant percent of physicians are at or near retirement age. According to
The Physicians Foundation 2014 Survey of America’s Physicians referenced above, 22.2% of physicians
aged 56 or older indicate they will retire in the next 1-3 years, while 9.4% of all physicians indicate they
will retire in the next 1 to 3 years. In addition, many physicians indicate that due to changes in the
healthcare system they will accelerate their retirement plans.

Source: The Physicians Foundation 2014 Survey of America’s Physicians
Even 33.7% of physicians 45 or younger in the survey indicated they plan to accelerate their retirement
plans.
Physician retirement numbers are difficult to project because economic and medical practice conditions are
subject to changes which may alter physician retirement patterns. However, the AAMC study referenced
above projects that an upper end shortage of 90,400 physicians by 2025 will be more likely given an
accelerated rate of physician retirement. Physician surveys conducted by Merritt Hawkins and others
suggest an accelerated pace of physician retirements is to be expected.
Physician Morale
Changing dynamics in the healthcare field, including the implementation of the Affordable Care Act (ACA),
flat or declining reimbursement, rising costs, an increased level of regulatory compliance and the
implementation of electronic medical records (EMR), have placed older physicians at a crossroads. While
certain physicians welcome the new changes, others are not as optimistic about the state of the medical
profession:
Source: The Physicians Foundation 2014 Survey of America’s Physicians

As indicated above, over 60% of physicians 46 and older have negative feelings about the current state
of the medical profession, while over 54% either feel somewhat negative or very negative about the future
of the medical profession. This pessimistic outlook is driven by a variety of factors, two of which are
referenced below (EMR implementation and the ACA):
Source: The Physicians Foundation 2014 Survey of America’s Physicians
Over 51% of physicians aged 46 or over feel that EMR has detracted from practice efficiency, while 49.4%
feel that EMR has detracted from patient interaction. Over half of physicians 46 or older (58.4%) also
express concern that EMR poses a risk to patient privacy. Many older doctors also are dubious about the
ACA:
Source: The Physicians Foundation 2014 Survey of America’s Physicians
Over 77% of physicians 46 or older give the ACA a grade of C or worse, including 28.5% that give the
ACA a failing grade. Many older physicians entered medical practice in the “golden age” of fee-for-service
medicine and feel that the game has changed on them beneath their feet.
It can be reasonably projected that tens of thousands of these physicians will retire in the near future. If,
in fact, 9.4% of physicians retire within three years, as indicated in The Physicians Foundation survey, it

would result in a loss of approximately 76,000 physicians from the workforce. If 22% of physicians 60
and over retire in the next one to three years, it would result in the loss of over 49,000 physicians from the
workforce. About 78,000 physicians will join the workforce in the next three years, barely offsetting the
potential number who will leave. Because younger physicians tend to work fewer hours than older
physicians and are more likely to take employed positions, one new physician entering practice is unlikely
to equal one older physician leaving.

Conclusion
As we move further into the 21st century, aging population demographics will become a key challenge
facing the healthcare system. A growing older population, with more frequent physician visits, surgical
rates and diagnostic testing per capita, will require a larger physician workforce to make access possible.
This challenge will correspond with the challenge created by an aging physician workforce, many of whose
members are primed for retirement.
For additional information on nurse practitioners and physician assistants, contact:
Corporate Office: Eastern Regional Office:
Merritt Hawkins Merritt Hawkins
5001 Statesman Drive 7000 Central Pkwy NE
Irving, Texas 75063 Suite 850
800-876-0500 Atlanta, Georgia 30328
800-306-1330
www.merritthawkins.com 800-876-0500
© 2015 Merritt Hawkins 5001 Statesman Drive Irving, Texas 75063