The Aggregate Expenditures Model Chapter 11 McGraw-Hill/Irwin Copyright © 2009 by The McGraw-Hill...
23
The Aggregate Expenditures Model Chapter 11 McGraw-Hill/Irwin Copyright © 2009 by The McGraw-Hill Companies, Inc. All rights reserved.
-
Upload
aileen-rice -
Category
Documents
-
view
223 -
download
3
Transcript of The Aggregate Expenditures Model Chapter 11 McGraw-Hill/Irwin Copyright © 2009 by The McGraw-Hill...
The Aggregate ExpendituresModel
Chapter 11
McGraw-Hill/Irwin Copyright © 2009 by The McGraw-Hill Companies, Inc. All rights reserved.

Chapter Objectives
• Aggregate expenditures for a private closed economy
• Characteristics of equilibrium real GDP in a private closed economy
• Changes in equilibrium real GDP and the multiplier
• Adding the government and international sectors
• Recessionary and inflationary expenditure gaps
11-2
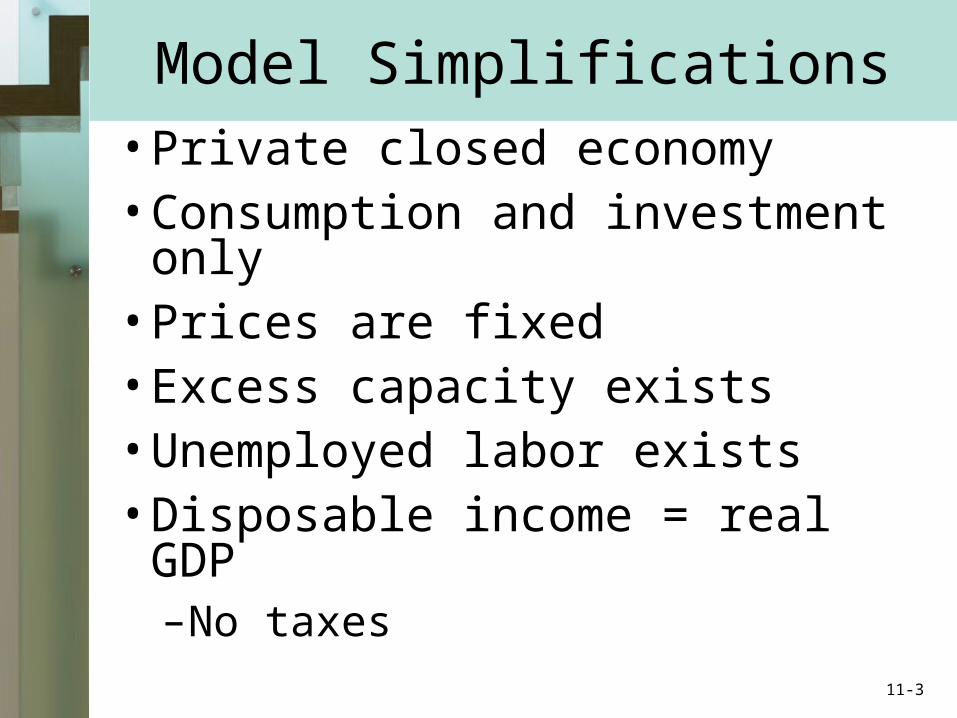
Model Simplifications
• Private closed economy• Consumption and investment
only• Prices are fixed• Excess capacity exists• Unemployed labor exists• Disposable income = real GDP
–No taxes11-3

Model Simplifications
• Investment demand vs. schedule r
an
d i
(p
erc
en
t)
Investment (billions of dollars)
ID
20
8
Real GDP (billions of dollars)
20
Inve
stm
ent
(bil
lio
ns
of
do
llar
s)
Ig
Investment Demand Curve Investment Schedule
2020
Investment Demand Curve
Investment Schedule
11-4

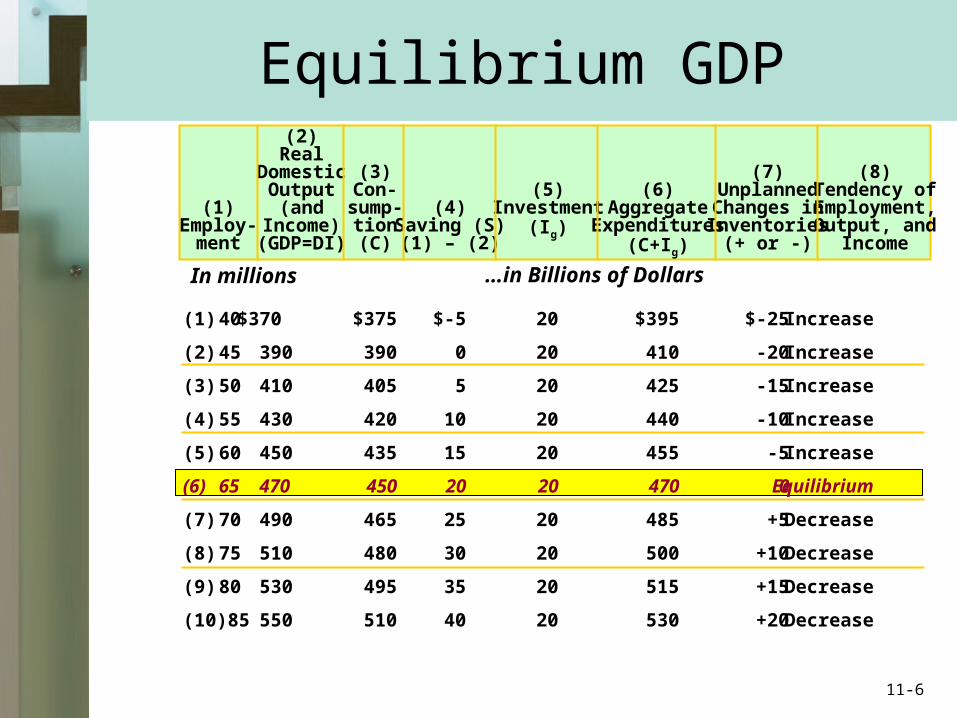
Equilibrium GDP
• Real GDP = C + Ig • Aggregate expenditures
–Equal to C + Ig –Aggregate expenditures schedule
• Quantity goods produced = quantity goods purchased
• Disequilibrium–Only 1 equilibrium level of GDP
11-5
(1) 40
(2) 45
(3) 50
(4) 55
(5) 60
(6) 65
(7) 70
(8) 75
(9) 80
(10) 85
$375
390
405
420
435
450
465
480
495
510
$-5
0
5
10
15
20
25
30
35
40
20
20
20
20
20
20
20
20
20
20
$395
410
425
440
455
470
485
500
515
530
$-25
-20
-15
-10
-5
0
+5
+10
+15
+20
Increase
Increase
Increase
Increase
Increase
Equilibrium
Decrease
Decrease
Decrease
Decrease
$370
390
410
430
450
470
490
510
530
550
(2)Real
DomesticOutput
(andIncome)
(GDP=DI)
(3)Con-
sump-tion(C)
(4)Saving (S)
(1) – (2)
(5)Investment
(Ig)
(6)Aggregate
Expenditures(C+Ig)
(7)UnplannedChanges inInventories
(+ or -)
(8)Tendency ofEmployment,Output, and
Income
(1)Employ-
ment
…in Billions of Dollars
Equilibrium GDP
In millions
11-6

530
510
490
470
450
430
410
390
370
45°
370 390 410 430 450 470 490 510 530 550
Disposable Income (billions of dollars)
Co
nsu
mp
tio
n (
bill
ion
s o
f d
olla
rs) C
Ig = $20 Billion
AggregateExpenditures
C = $450 Billion
C + Ig(C + Ig = GDP)
EquilibriumPoint
Equilibrium GDP
11-7
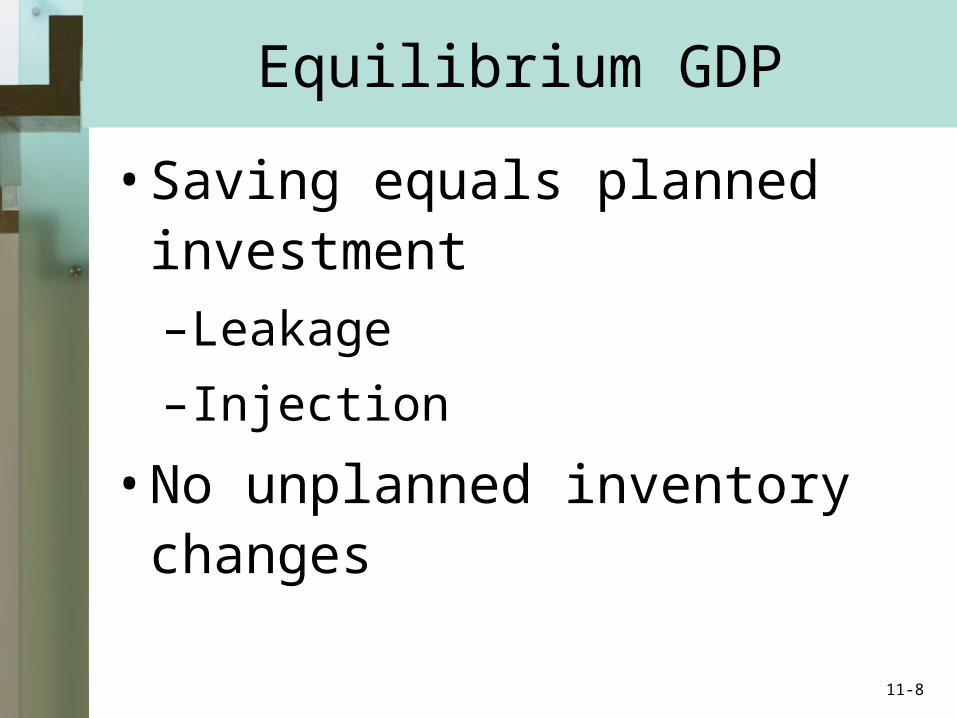
Equilibrium GDP
• Saving equals planned investment–Leakage
–Injection
• No unplanned inventory changes
11-8

510
490
470
450
430
45°
430 450 470 490 510
Real GDP (billions of dollars)
Ag
gre
gat
e E
xpen
dit
ure
s (b
illio
ns
of
do
llars
)
Changes in Equilibrium GDP
Increase inInvestment by 5
(C + Ig)0
Decrease inInvestment by 5
(C + Ig)2
(C + Ig)1
The Multiplier Effect
11-9

International Trade
• Net exports and aggregate expenditures
• Net exports schedule• Net exports and equilibrium GDP
– Positive net exports– Negative net exports
• International economic linkages– Prosperity abroad– Tariffs– Exchange rates
11-10

RealGDP
+5
0
-5
Net
Exp
ort
s X
n(b
illio
ns
of
Do
llars
)
Real GDP (billions of dollars)
Ag
gre
gat
e E
xpen
dit
ure
s(b
illio
ns
of
do
llars
)
510
490
470
450
43045°
430 450 470 490 510
Net Exports and Equilibrium GDP
AggregateExpenditureswith PositiveNet Exports
C + Ig
AggregateExpenditureswith NegativeNet Exports
C + Ig+Xn2
C + Ig+Xn1
Xn1
Xn2
Positive Net Exports
Negative Net Exports
450 470 490
11-11

-700 200 150 100 50 0 50 100 150 200 250
Net Exports of Goods
Select Nations, 2006
Positive Net ExportsNegative Net Exports
Canada
France
Japan
Italy
Germany
United Kingdom
United States
+31
+70
+203
-45
-27
-171
-881
Source: World Trade Organization 11-12

Adding the Public Sector
• GDP = Cd + Ig + Xn + G
• Lump sum taxes–Taxes affect disposable income–Consumption and the MPC
• Leakages = Sd + M + T
• Injections = Ig + X + G
• Sd + M + T = Ig + X + G11-13

Adding the Public Sector
(1) $370
(2) 390
(3) 410
(4) 430
(5) 450
(6) 470
(7) 490
(8) 510
(9) 530
(10) 550
$375
390
405
420
435
450
465
480
495
510
$-5
0
5
10
15
20
25
30
35
40
$20
20
20
20
20
20
20
20
20
20
10
10
10
10
10
10
10
10
10
10
20
20
20
20
20
20
20
20
20
20
$415
430
445
460
475
490
505
520
535
550
10
10
10
10
10
10
10
10
10
10
(1)Level ofOutput
andIncome
(GDP=DI)
(2)Consump-
tion(C)
(3)Saving (S)
(4)Investment
(Ig)
(5)Net Exports
(Xn) (6)Government
(G)
(7)Aggregate
Expenditures(C+Ig+Xn+G)
(2)+(4)+(5)+(6)
Exports(X)
Imports(M)
…in Billions of Dollars
11-14

45°
470 550
Real GDP (billions of dollars)
Ag
gre
gat
e E
xpen
dit
ure
s (b
illio
ns
of
do
llars
)
Government Spending Effect
C
GovernmentSpending of$20 Billion
C + Ig + Xn
C + Ig + Xn + G
$20 Billion Increasein GovernmentSpending Yields an$80 Billion IncreaseIn GDP
11-15

45°
490 550
Real GDP (billions of dollars)
Ag
gre
gat
e E
xpen
dit
ure
s (b
illio
ns
of
do
llars
)
Lump Sum Tax Effect
$15 Billion DecreaseIn Consumption Froma $20 Billion (MPC=.75)Increase inTaxes
Cd + Ig + Xn + G
C + Ig + Xn + G
$20 Billion Increasein Taxes Yields a$60 Billion DecreaseIn GDP
11-16

Recessionary Expenditure Gap
GDP is below full employment
Real GDP (billions of dollars)
Ag
gre
gat
e E
xpen
dit
ure
s(b
illio
ns
of
do
llars
)550
530
510
490
47045°
490 510 530
AE0
AE1
FullEmployment
RecessionaryExpenditureGap = $5 Billion
$5 BillionGap Yields$20 Billion
GDPChange
11-17

Inflationary Expenditure Gap
GDP is above full employment
Real GDP (billions of dollars)
Ag
gre
gat
e E
xpen
dit
ure
s(b
illio
ns
of
do
llars
)550
530
510
490
47045°
490 510 530
AE0
AE2
FullEmployment
InflationaryExpenditureGap = $5 Billion $5 Billion
Gap Yields$20 Billion
GDPChange
11-18
The Complete Model
• GDP and full employment• Multiplier effects
–Government spending–Lump sum taxes
• Recessionary gap–Policy options
• Inflationary gap–Demand pull inflation
11-19

Application
• U.S. economy late 1990’s–Too much investment–Stock market bubble–Consumer debt–Fraudulent business practice
• Aggregate expenditure falls• U.S. recession of 2001• Terror attacks prolonged
recession11-20
The Great Depression
• Classical economics– Mills and Ricardo– Prices adjust to maintain full
employment• Say’s Law
– Supply creates its own demand• Depression challenged the theory• New theory developed
– Keynes– Aggregate expenditure model
11-21

Key Terms
• planned investment• investment schedule• aggregate expenditures schedule• equilibrium GDP• leakage• injection• unplanned changes in inventories• net exports• lump-sum tax• recessionary expenditure gap• inflationary expenditure gap
11-22

Next Chapter Preview…
Aggregate Demand and Aggregate Supply
11-23