The Agency Structure of Loan Syndicates - HEC- · PDF fileThe Agency Structure of Loan...
37
The Agency Structure of Loan Syndicates Pascal François ∗ HEC Montréal Franck Missonier-Piera ESSEC Business School JEL code: G21. Keywords: Loan syndication; Monitoring; Bank specialization; Co-agents. ∗ Corresponding author. Pascal François, HEC Montréal, 3000 Côte-Ste-Catherine, Montréal (QC) H3T 2A7, Canada. Tel.: +1 (514) 340-7743. Fax: +1 (514) 340-5632. E-mail: [email protected]. Financial support from IFM 2 and FQRSC is gratefully acknowledged. Part of this research was completed while François was visiting IGR at Université de Rennes and Missonier- Piera was at HEC Lausanne. We are grateful to two anonymous referees and the editor (Arnold Cowan) for their helpful comments. We have also benefited from discussions with Benoît Dostie, Georges Hübner, Denis Larocque, Thomas Moeller, Nicolas Papageorgiou, Sophie Pardo, and participants of the 2004 NFA Conference and the 2005 FMA Conference. We thank Sarah Bounab, Yann Bieli, and Marie-Chantal Ouellette for excellent research assistance. Any remaining errors are our own.
Transcript of The Agency Structure of Loan Syndicates - HEC- · PDF fileThe Agency Structure of Loan...

The Agency Structure of Loan Syndicates
Pascal François∗
HEC MontréalFranck Missonier-PieraESSEC Business School
JEL code: G21.Keywords: Loan syndication; Monitoring; Bank specialization; Co-agents.
∗Corresponding author. Pascal François, HEC Montréal, 3000 Côte-Ste-Catherine,Montréal (QC) H3T 2A7, Canada. Tel.: +1 (514) 340-7743. Fax: +1 (514) 340-5632.E-mail: [email protected] support from IFM2 and FQRSC is gratefully acknowledged. Part of this researchwas completed while François was visiting IGR at Université de Rennes and Missonier-Piera was at HEC Lausanne. We are grateful to two anonymous referees and the editor(Arnold Cowan) for their helpful comments. We have also benefited from discussions withBenoît Dostie, Georges Hübner, Denis Larocque, Thomas Moeller, Nicolas Papageorgiou,Sophie Pardo, and participants of the 2004 NFA Conference and the 2005 FMAConference.We thank Sarah Bounab, Yann Bieli, and Marie-Chantal Ouellette for excellent researchassistance. Any remaining errors are our own.

The Agency Structure of Loan Syndicates
We challenge two arguments that explain the agency structure of loan syn-dicates. The specialization hypothesis claims that multiple co-agents arise inloan syndicates because of their different competitive advantages for perform-ing administrative tasks. According to the monitoring hypothesis, co-agentsact as delegated monitors to mitigate informational asymmetry problems.Using syndicated loan characteristics from the Dealscan database, we findstrong evidence for both hypotheses. A sub-sample analysis reveals that spe-cialization effects are more pronounced for small-size and short-term loans.Monitoring effects are also reduced by repeated contracting among syndicateplayers.

1. Introduction
Loan syndication is a widely used financing channel for corporations. Accord-
ing to the Loan Pricing Corporation, the annual volume of syndicated loans
has been stable around $ 1 trillion between 1999 and 2003. The loan syn-
dication process starts with negotiations between the borrower and a bank
(the “arranger” or the “leader”) on the terms and provisions of the debt
contract. The arranger then collects confidential bids from other banks (the
“members”) regarding their contributions to the loan. Finally, she proceeds
to the allocation of the loan parcels. In addition to initiating and setting up
the syndicate, the arranger has to issue the legal documents, administer the
loan, and hold the collateral, if any. In practice however, the arranger of-
ten delegates these administrative tasks to other banks, acting as co-agents.
For instance, the “documentation agent” drafts the loan documents, the
“administrative agent” calculates the interest payments and collects loan re-
payments, and the “collateral agent” is in charge of the pledged collateral.
The decision to delegate some of these tasks is made solely by the arranger.
Our research aims to investigate what drives this decision, or, in other
words, why multiple co-agents arise in the syndication process. We address
the issue of the agency structure of the loan syndicate both theoretically and
empirically.
First, we present two competing hypotheses on the agency structure of
loan syndicates. On one hand, the specialization hypothesis, consistent with
Das and Nanda (1999), states that multiple co-agents arise in loan syndicates
because of the different competitive advantages they have for performing all
the administrative tasks. On the other hand, the monitoring hypothesis
1

states that multiple co-agents arise in loan syndicates to mitigate informa-
tional asymmetry problems. As shown by Strausz (1997), the delegation
of monitoring to a third party (in our case, co-agents) can effectively re-
duce agency conflicts. Based on this theoretical discussion, we derive six
testable implications on observable characteristics of syndicated deals. Next,
we test these implications on a sample of 1,181 loans between 1992 and 2003
taken from the Dealscan database. Overall, we find strong evidence support-
ing both the specialization and monitoring effects. A sub-sample analysis
reveals that specialization effects are more pronounced for small-size loans
while monitoring effects are dominant for short-term loans. Finally, we pro-
vide evidence of repeated contracting between leaders and co-agents (which
is consistent with the specialization hypothesis), and between leaders and
participants (which attenuates monitoring effects).
The rest of the paper is organized as follows. In Section 2 we briefly
review the related literature on loan syndication, and we present the two
competing hypotheses on the agency structure of loan syndicates. We derive
their testable implications in Section 3. The empirical model is detailed in
Section 4. We analyze the results in Section 5, and Section 6 concludes.
2. Literature review and hypotheses
2.1. Related literature
Earlier theoretical works focus on the rationales for loan syndication. The
risk-sharing function of the syndicate is put forward by Wilson (1968) and
Chowdhry and Nanda (1996). According to Pichler andWilhelm (2001), syn-
2

dication emerges as the structure that best copes with moral hazard in team
production. The existence of a lead bank, subject to reputational concerns,
combined with implicit barriers at entry, makes syndicates Pareto-dominant
forms. Simons (1993) argues that syndication helps lenders circumvent the
stringent bank regulation regarding capital requirements and lending limits.
Papers most closely related to ours are those that investigate the own-
ership structure of the syndicate, i.e. the number of participating banks
and the concentration of the holdings in the syndicate. Lee and Mullineaux
(2004) find a positive association between large and/or diffuse syndicates and
the available information about the borrower, the credit risk of the loan, the
collateral, the reputation of the lead bank, the constraints relative to the
loan re-sale activity, the loan maturity, and the importance of the borrower’s
growth options. Their results hold when controlling for the listing status or
the rating of the borrowers, and support the argument that group monitor-
ing matters in the loan market as agency and information costs affect the
syndicate structure. Sufi (2005) finds evidence suggesting that lead arrangers
look for more participants in the syndicate to make renegotiation more dif-
ficult, which discourages opportunistic behavior by the borrower. Esty and
Megginson (2003) focus on the impact of political risk on syndicate struc-
ture. They find that, in the international context of the project finance loan
market, a diffuse ownership structure (i.e. number of banks and the con-
centration of the holdings) is also associated with weak creditors’ rights and
poor legal enforcement. Jones, Lang and Nigro (2005) conclude that agents
reduce their share of a syndicated loan when they face capital constraints or
an informational disadvantage.
3

Though all of these studies contribute to our understanding of the syn-
dication procedure, they consider that the syndicate is managed by a single
entity. Our paper contributes to the field in that we analyze the syndication
structure at a finer level, namely the distinction between the lead arranger
and co-agents. To the best of our knowledge, the agency structure of loan
syndicates has not been addressed.
2.2. The specialization hypothesis
We identify two explanations for the participation of several co-agents in
the syndicate. The first rationale for multiple co-agents is based on a spe-
cialization argument. Das and Nanda (1999) present a model of a bank-
ing structure where, in equilibrium, banks involved in relationship-specific
transactions tend to underspecialize in their skills, whereas banks involved
in deal-specific transactions tend to overspecialize. Within this framework,
syndication appears to be an efficient way to allow banks to specialize opti-
mally. In other words, banks would act in the syndication process according
to the competitive advantage that they have acquired in performing different
administrative tasks.
To support this view, several papers provide international evidence of
productive specialization in the banking sector (see, for instance, Maudos,
Pastor, and Perez, 2002; Mukherjee, Ray, and Miller, 2001). Little is known,
however, about how much this specialization affects the structure of bank
syndication. Melnik and Plaut (1996) study the structure of the Eurocredit
underwriting market. They find that leaders of these syndicates are recruited
mostly to share the costs of bearing the risk. However, additional managers of
4

the syndicate do not seem to arise for risk-sharing reasons. Rather, they as-
sist the leader in dealing with an expanded underwriting distribution, which
suggests that they help in splitting the costs of managing the syndicate. Song
(2004) finds evidence of clientele effects in loan syndication. She suggests that
highly-specialized underwriters co-manage deals to enhance their services in
response to clients’ specific needs.
2.3. The monitoring hypothesis
The second rationale for multiple co-agents is based on the monitoring hy-
pothesis. Syndication enables the arranger to transfer some of the borrower’s
credit risk to other banks. However, since the arranger is the only bank to
negotiate with the borrower, she is usually the best informed bank on the
corporation’s financial status. As a result, the syndication process leaves
room for adverse selection and moral hazard. Adverse selection occurs if the
arranger systematically decides to syndicate the most risky loans.1 Moral
hazard occurs if the arranger loosely monitors the borrower because she has
a very limited stake in the loan.
A classic topic in agency theory is the study of moral hazard problems in
team production (e.g., Alchian and Demsetz, 1972; Holmström, 1982). The
syndication process can be analyzed as an example of this issue. Pichler
and Wilhelm (2001) develop an agency model to explain the formation of
syndicates. They consider that the syndicate is managed by a single arranger
1 Dai (2002) suggests that adverse selection problems may worsen if banks haveheterogeneous screening abilities. Loan syndicates would then be subject to herdbehavior from inferior banks who rely on superior banks’ (i.e. the arrangers’)credit decisions.
5

and therefore they do not address the issue of its agency structure. In this
paper, we conjecture that agency theory can also account for the presence of
co-agents in loan syndicates.
In the agency theory framework, we interpret the role of co-agents in the
syndicate as banks mandated to supervise the arranger-principal. In other
words, the arranger delegates the syndication agency to co-agents to mitigate
the informational asymmetries between the agents and the members of the
syndicate. In a model where signals are private information and commit-
ment to monitoring is not possible, Strausz (1997) studies the impact on the
principal-agent relationship of the introduction of a third player, namely a
supervisor who has been delegated as monitor. Strausz (1997) shows that
delegation of monitoring is profitable in that the principal can better reg-
ulate incentives. First, as co-agents get involved in the syndication deal,
they acquire more accurate information on the borrower. They are able to
monitor the arranger on behalf of the members and determine whether the
creditworthiness of the borrower is acceptable for the benefit of the syndicate
(note that the reputation of the co-agents is at stake). The adverse selec-
tion behavior is therefore partially controlled by co-agents. Second, if the
arranger delegates the agency to other banks, a bigger portion of the loan
will be held by agents. Consequently, members should expect these agents
to monitor the borrower more closely. Thus, moral hazard behavior is also
partially controlled by co-agents.
Narayanan, Rangan, and Rangan (2004) study the market for seasoned
equity offerings, and examine whether underwriting banks use their lending-
generated private information at the expense of investors. They find evidence
6

that the syndication structure, through the involvement of co-managers, in-
duces these banks to credibly commit against any opportunistic behavior. In
this paper, we investigate whether a comparable phenomenon applies to the
loan syndication market.
3. Testable implications
According to the agency theory framework, the presence of co-agents in the
syndicate stems from the delegation of monitoring that helps mitigate ad-
verse selection and moral hazard problems. We will refer to this as the mon-
itoring hypothesis. Alternatively, the specialization argument claims that
co-agent roles are shared between several banks according to the competi-
tive advantage they have in performing their tasks. We will refer to this as
the specialization hypothesis. The difference between the two hypotheses can
be summarized as follows: The agency structure of the syndicate responds
to characteristics of the deal to (i) mitigate informational asymmetries ac-
cording to the monitoring hypothesis, or (ii) reduce the total cost structure
according to the specialization hypothesis.
Our analysis relies on the following testable implications, which relate
the extent of delegation in the syndicate to the main characteristics of the
syndicated loan, namely the level of fees, the borrower’s credit quality, the
number of covenants, the loan maturity, the number of participants (i.e. mere
lenders not acting as co-agents), and the lead arranger’s share of the loan.
We expect that competition among specialized banks brings down the cost
of managing the syndicate. Thus, according to the specialization hypothesis,
7
the leader will charge low fees for deals that are going to be handled by many
co-agents. Supporting this view, Melnik and Plaut (1996) find evidence that
co-agents in the market for syndicated Euroloans mostly act as “service-for-
fee” players.
By contrast, the monitoring hypothesis states that fees represent a liquid-
ity transfer to compensate for the monitoring costs (see Gorton and Kahn,
2000). Thus, we expect that if the leader charges high fees, this indicates a
deal requiring an expensive monitoring activity.
Implication 1 The specialization hypothesis predicts a negative relation be-
tween fees and delegation.
Adverse selection and moral hazard problems are likely to be more se-
vere when the borrower’s credit quality is poor. The monitoring hypothesis
predicts that in this case, the arranger will choose a higher delegation. Sufi
(2005) finds the size of the syndicate to increase with the borrower’s esti-
mated risk of default. However, he does not analyze the agency structure of
the syndicate.
Implication 2 The monitoring hypothesis predicts a negative relation be-
tween the borrower’s creditworthiness and delegation.
As initially put forward by Smith and Warner (1979), covenants serve
as an ex post monitoring device. According to the monitoring hypothesis,
covenants and co-agents can be seen as substitutes because they both help
mitigate the moral hazard problem. Goyal (2005) and Harvey, Lins, and
Roper (2004) conduct empirical studies supporting this view on the U.S.
8

bank debt market and on the emerging debt market, respectively. Bradley
and Roberts (2004) focus on the syndicated loan market and also find that
the use of covenants is consistent with agency theory. However, all studies are
not unanimous on the monitoring role of covenants. On the U.S. bond mar-
ket, Nash, Netter, and Poulsen (2003) find evidence that high-growth firms
include few covenants in their debt contracts because they prefer maintaining
flexibility in financing rather than reducing agency costs.
Nevertheless, the monitoring role of covenants must be balanced with
their implementation cost. For instance, Viswanath and Eastman (2003)
model the use of covenants as a trade-off between the cost of implementing
the contract and the residual agency costs. If the specialization hypothesis
holds, a deal with many covenants is more expensive to manage, all things
equal. In this case, the lead arranger is more likely to look for additional
co-agents to split the cost of managing the syndicate. Thus, according to
specialization hypothesis, deals with many covenants should exhibit a higher
delegation.
Implication 3 The monitoring hypothesis predicts a negative relation be-
tween the number of covenants and delegation. The specialization hypothesis
predicts the opposite relation.
In the agency theory, short-term debt is more efficient in alleviating con-
flicts between shareholders and creditors (see e.g. Myers, 1977, or Berglöf and
Van Thadden,1994). Barclay and Smith (1995), Guedes and Opler (1996),
and Johnson (2003) provide evidence on short-term debt mitigating the un-
derinvestment problem. Gonas, Highfield, and Mullineaux (2004) find that
9

longer maturity loans are more prone to collateralization to reduce adverse
selection and moral hazard. Thus, according to the monitoring hypothesis,
co-agents would more likely arise in deals with long-term debt.
Narayanan, Rangan, and Rangan (2004) document economies of scale in
managing loans. A longer maturity helps the leader amortize the fixed cost
component of the loan. For short-term loans, however, the leader will seek
to lower these costs by increasing the level of delegation. The specialization
hypothesis therefore predicts a negative relation between the loan maturity
and delegation.
Implication 4 The monitoring hypothesis predicts a positive relation be-
tween the loan maturity and delegation. The specialization hypothesis predicts
the opposite relation.
If agency conflicts matter, a highly delegated syndicate is more likely to
attract many participants since information asymmetry is mitigated. If there
is no agency effect in the process of loan syndication, a simple mechanical
relation indicates that, all other things being equal (i.e. for a fixed number of
banks involved in the deal), more participants in the syndicate reduces the
number and the financial implication of co-agents. Furthermore, if the total
number of banks involved increases, the level of delegation cannot rise in the
same proportion because the number of co-agent roles is in practice limited
to a few specific administrative tasks.
Implication 5 According to the monitoring hypothesis, the number of par-
ticipants (i.e. mere lenders not acting as co-agents) and delegation should
10

be positively related. In the absence of any agency effect, the specialization
hypothesis predicts the opposite relation.
The syndicate will rely on a lower delegation if the lead arranger has a
big stake in the deal. In this case, indeed, mere participants are more likely
to trust the leader and her non-opportunistic behavior. Leaders with a lower
stake will, however, need more co-agents to persuade participants of a low
risk of adverse selection and moral hazard in the syndicate.
Implication 6 The monitoring hypothesis predicts a negative relation be-
tween the share of the leader and delegation.
We now present the model that will serve to test the previous implications.
4. The empirical model
4.1. Description of the variables
To measure the extent of delegation in the syndicate, we analyze the agency
structure along three dimensions: (i) the number of co-agents (NCA), (ii) the
proportion of the loan held by all the co-agents (PCA), which measures how
much the delegated monitors are financially involved, and (iii) the level of
concentration among co-agents (CCA) (measured by the Herfindahl index),
which measures the dispersion of the delegation of monitoring (which could
in particular lead to collusion). Delegation is a positive function of NCA
and PCA and a negative function of CCA. Each of these variables will serve
as the dependent variable of our models.
11

Specifically, NCA is simply the number of banks in the syndicate acting
with a co-agent role (that is, with a responsibility in the administration of
the loan). These banks have to be distinguished from the leader and from
other banks who only act as mere lenders. PCA is the sum of all co-agents’
shares in the loan expressed as a percentage. CCA is the Herfindahl index
of the co-agents’ shares expressed as a percentage. Denoting mi the amount
lent by co-agent i in a loan with total facility M , we have that
PCA = 100× 1
M
NCAXi=1
mi
CCA = 100×NCAXi=1
ÃmiPj mj
!2.
Consistent with our testable implications, the explanatory variables are
as follows. Total fees (“Fee”) are expressed in basis points as the sum of
upfront fees, commitment fees, other fees, and annual fees. Note that these
total fees are shared between the leader and co-agents. The information
regarding the fraction of total fees that specifically accrues to co-agents is
not available in general. As a measure of the borrower creditworthiness, we
use the Standard & Poor’s senior long term debt rating prevailing at the deal
inception. This piece of information is in most cases provided by the Dealscan
database. We retrieved the rating for around 50 additional deals in the Fixed
Investment Securities Database (FISD). The variable “Rating” is a dummy
with value 1 if the borrower’s rating belongs to the investment grade category
and zero otherwise. The variable “Covenants” counts the number of financial
covenants included in the deal.2 The loan maturity (“Maturity”) is expressed
2Admittedly, this criterion does not capture how tight the covenant is. This ishowever the only information available in the database.
12

in months. The number of participants (“Participants”) is simply the number
of banks in the syndicate that are neither leader nor co-agents. The variable
“Leader share” is the share of the leader expressed as a percentage.
Finally, the following control variables are used. The loan facility (“Loan
size”) is the nominal amount of the loan expressed in U.S. dollars. The
logarithm of the annual sales of the borrower in U.S. dollars (“Firm size”)
is a proxy for firm size. We also add dummy variables to control for the
loan purpose,3 for the borrower’s industry (SIC codes are grouped in eight
categories based on the first digit of the code), and for the year of the deal
inception (there are 12 years in our sample). Hence there is a total of 24
control variables.
4.2. The data
Data on syndicated loan deals are obtained from Dealscan provided by the
Loan Pricing Corporation, a Reuters subsidiary focusing on the international
private debt market. Recent studies on syndicated loans use this database
(see e.g., Angbazo, Mei, and Saunders, 1998; Dennis and Mullineaux, 2000;
Dichev and Skinner, 2002; Esty and Megginson, 2003). The size of this data-
base is constantly growing as new deals are regularly added (around 2,000
deals are added every three months since 1996). At the time of our data ex-
traction (as of July 7, 2003), the total sample was comprised of 91,063 loans
3Purposes reported in the database have been grouped in five categories: (1)Capital budgeting (including capital expenditure, project finance, acquisition), (2)Long-term financing (including recapitalization, debt repayment), (3) Short-termfinancing (including working capital, CP backup), (4) Restructuring (includingtakeover, LBO/MBO, spinoff, debtor-in-possession, stock buyback), and (5) Othergeneral purpose.
13

during the 1987-2003 period.4 We first restricted the sample to syndicated
loans, which left us with 60,239 observations. We then excluded tranches with
a nominal amount below $100 million, since these tranches are too small to
have complex agency structures, which left us with 28,407 loans.5 Excluding
financial and government institutions (SIC codes between 6000 and 6999,
and between 9100 and 9999) yielded 23,665 loans. Furthermore, we had to
select the loans disclosing the information about the agency structure of the
syndicate and about covenant information. Specifically, identification of a
lead arranger, information on the number of co-agents and participants, and
covenant information were required. These three additional restrictions cut
our final sample to 11,639, 3,275 and 1,609 tranches respectively. Still, indi-
cations of the borrower’s sales and SIC code were sometimes missing. This
piece of information was retrieved from Mergent Online and the borrowers’
own web sites. Furthermore, we excluded the 92 deals for which the infor-
mation on co-agents’ shares is not disclosed, which left us with 1,517 deals.
Finally, we only kept the deals for which a rating was available at the time of
loan inception. This yielded a total of 1,181 observations.6 Our final sample
size is comparable to previous studies that used Dealscan. Esty and Meggin-
son (2003) or Dichev and Skinner (2002) use samples of 495 and 1,313 loans,
4In the Dealscan dataset, the basic unit of observation is the loan facility ortranche. In practice many firms group these tranches into “deals.” However,tranches (that we shall call “loans”) are the focus of our analysis since they ex-hibit very different patterns in terms of maturity, size, syndication structure, andso forth.
5Altman and Suggitt (2000) as well as Esty and Megginson (2003) also excludethe smallest tranches in their analysis of syndicated loans.
6We also excluded two observations, interpreted as outliers, that reported atotal of 188 and 56 co-agents, respectively.
14

respectively.
Deal dates range from January 21, 1992 to June 23, 2003. The year,
industry and purpose distributions of the final sample are presented in Table
1.
Insert Table 1 Here
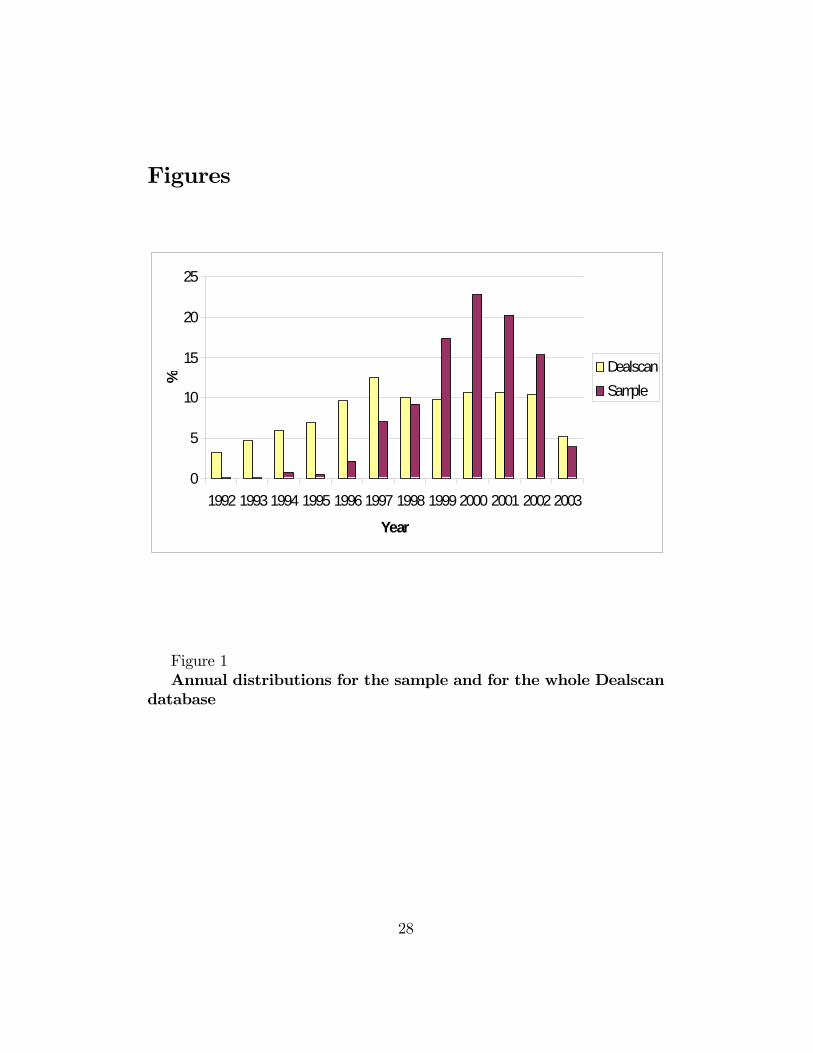
Most loans were issued within the last five years, which justifies the use
of time dummies in our regressions. There are two reasons for this over-
representation of recent deals. First, the Dealscan database is growing and
more deals have been added in the recent years. Second, our selection criteria
require knowledge of the agency structure of loans. Old deals seldom disclose
this piece of information. These two effects are graphically represented in
Figure 1. Our bias to recent loans should be kept in mind when interpreting
the results.
Insert Figure 1 Here
We also note in Table 1 that all industries have observations in our samples.
Manufacturing companies and utilities are the most represented, which is
symptomatic of developed economies. Syndicated loans are contracted for
various purposes, although the capital budgeting argument seems under-
represented. This may not reflect the real economic activity, however. Many
firms opt not to disclose the purpose of capital budgeting for strategic reasons.
Rather, these firms choose to fall in the “other general purpose” category,
which explains the relatively large number of observations in this category.
The descriptive statistics of the variables are summarized in Table 2.
Insert Table 2 Here
15

Table 2 reveals the diverse and sometimes complex agency structure of
syndicated loans. Theoretical models that consider syndicates as being man-
aged by a single bank (and not a group of banks) may therefore fail to capture
an important feature of the loan syndication process. Specifically, the number
of co-agents varies from zero (the arranger administrates the loan all by her-
self) to 38, with a mean value of 6.00. The financial involvement of co-agents
is very significant because their average stake in the loan is 42.55%. But
beyond this mean value, the financial participation of co-agents can take on
very extreme values. The same remark applies to the financial concentration
among co-agents (measured by the Herfindahl index).
4.3. The regression models
We test our six implications using three separate ordinary least squares (OLS)
regressions on our sample, one for each dependent variable (NCA, PCA and
CCA). However, results for the PCA regressions and the CCA regressions
(both available upon request) are very similar, so we do not report them.
Note that the terms of the deal are negotiated by the arranger and the
borrower before the agency structure of the syndicate is set, which rules out
endogenous relations between explanatory and dependent variables.7
Since the number of co-agents is a count data, the errors for the NCA
linear model may not be normally distributed and the OLS regression may
7There is a caveat for the variable “Participants.” In practice, the arrangeroften begins the syndication process with informal rounds to determine the banksinterested in participating in the syndicate. In some cases however, co-agents andmere participants may arise simultaneously in the syndicate. Results concerningthe variable “Participants” should therefore be interpreted with care.
16

not be well specified. We therefore choose to complement the OLS regressions
with a negative binomial regression for the variable NCA.
We perform a collinearity diagnostic before estimating the regression
models. Table 3 reports the Pearson correlations involving explanatory and
control variables.
Insert Table 3 Here
On the whole, correlation coefficients are of moderate magnitude. We note,
however, that among explanatory variables, “Rating” and “Covenants” are
involved in the highest two Pearson coefficients. To control for potential
endogeneity problems, we shall estimate the NCA regression four times: (i)
with all six explanatory variables, (ii) excluding the variable “Rating,” (iii)
excluding the variable “Covenants,” and (iv) excluding these two variables.
This procedure serves as a robustness check for the signs of the coefficients.
5. Analysis of results
5.1. Results for the whole sample
Results for the NCA regressions are presented in Table 4. Reported t-
statistics are corrected for potential heteroskedasticity using the White cor-
rection. The results for the negative binomial regressions for the variable
NCA are shown in Table 5.
Insert Tables 4 and 5 Here
All regressions have a substantial explanatory power. As far as OLS
regressions are concerned, the adjusted R2 is 43%. Regarding the negative
17

binomial regression, the scaled Pearson chi-square is about 1.14. Robustness
checks confirm that the collinearity between two of the explanatory variables
does not alter the results in a significant manner.
Four of the six explanatory variables are consistently significant in all
of our regressions. Another variable (Rating) is occasionally significant.
This suggests that most selected variables are important determinants of
the agency structure of loan syndicates. We now scrutinize them in greater
detail.
The level of fees We find strong evidence that fees are negatively as-
sociated with the extent of delegation in the syndicate. The evidence is much
stronger for the negative binomial model. The coefficients for the variable Fee
are negative, which validates the predictions of the specialization hypothesis.
Results, therefore, suggest that co-agents compete in the syndicate to reduce
the total cost of the deal.
The borrower’s rating The variable Rating is significant in two re-
gressions (see Tables 4 and 5) and at the 10% level only. This is very weak
evidence for the monitoring hypothesis, suggesting that deals with a risky
borrower need to rely on more co-agents to mitigate informational asymme-
tries between the lead arranger and the borrower.
The number of covenants The coefficient for the variable Covenants
is never significant.8 Contrary to Dichev and Skinner’s (2002) results, finan-
8We only find one significant (at the 10% confidence level) and positive coef-ficient for the variable Covenant in the PCA model (not reported). This resultprovides very weak evidence for the specialization hypothesis. Consistent with
18

cial covenants do not seem to act as a device to mitigate agency problems
in syndicated loans. However, one should keep in mind that our variable is
the number of covenants: It is therefore an imperfect proxy for implementa-
tion costs as well as for monitoring effects, which are both influenced by the
tightness of covenants.
The loan maturity Our results provide very strong evidence that loan
maturity is positively correlated with delegation in the syndicate. The co-
efficients for the variable Maturity are all significant at the 1% level in all
regressions (see Tables 4 and 5). Their signs are always consistent with the
monitoring hypothesis. Agency theory suggests that longer loans are riskier
and more loosely monitored. A stronger participation of co-agents is required
to handle agency conflicts with those deals.
The number of participants The coefficients for the variable Partic-
ipants are all significant at the 1% level in all regressions (see Tables 4 and
5). Their signs always confirm a negative relation with the level of delega-
tion. This very strong evidence sharply conflicts with the prediction of the
monitoring hypothesis. If the function of co-agents is to mitigate informa-
tional asymmetries, then mere lenders would recognize their monitoring role
by participating more actively in highly delegated deals. This is not the case
in our sample.
Viswanath and Eastman (2003), it indicates that the number of covenants in-creases the deal implementation costs that are split by additional co-agents.
19

The share of the leader We find very strong evidence of a negative
relation between delegation and the share of the leader. The coefficients for
the variable Leader share are all significant at the 1% level in all regressions
(see Tables 4 and 5). This result strongly supports the monitoring hypothesis.
It indicates that when the leader is substantially involved in the deal, his
interests are more aligned with those of the participating members. Hence,
the leader does not need to rely on additional co-agents to mitigate agency
problems.
Overall, our findings support both hypotheses. Regarding the monitoring
hypothesis, we find that two predictions (related to the variables Maturity
and Leader share) are strongly confirmed. Another prediction (related to
Rating) is weakly confirmed. In addition, one prediction (related to the
variable Participants) is strongly rejected. Regarding the specialization hy-
pothesis, we find that two predictions (related to the variables Fee and Par-
ticipants) are strongly confirmed. In addition, one prediction (related to the
variable Maturity) is strongly rejected.
A possible explanation for these mixed results is that the specialization
and the monitoring hypotheses are not exclusive. For a given deal, the lead
arranger may select co-agents for cost splitting and monitoring purposes.
Another explanation is that some deals may be more costly to manage and
co-agents’ specialization will be more necessary, and some other deals may
be subject to higher informational asymmetries and monitoring will be the
main reason for co-agents. The next sub-section investigates this latter ex-
planation.
20

5.2. Results for sub-samples
Taking the two extreme quartiles, we select the four sub-samples that contain
the deals with the smallest and biggest amounts as well as the deals with the
shortest and the longest maturities. We report OLS regressions results in
Table 6.
Insert Table 6 Here
Due to the presence of fixed costs, we expect deals of small size to be
more expensive to manage. Hence, specialization effects should be more pro-
nounced. Furthermore, the stakes of agency conflicts should increase with
the loan size. Monitoring effects should therefore be stronger. As a matter
of fact, the negative coefficient for the variable Fee is no longer significant
and the negative coefficient for the variable rating becomes significant when
it comes to big loans. Interestingly, Panyagometh and Roberts (2002) ar-
gue that lead banks do not seem to act as if they benefited from private
information about the borrower’s credit quality, thereby denying the adverse
selection problem that could be associated with loan syndication. One should
note, however, that their sample contains, on average, deals of smaller size
(mean facility is 132 m$ compared to 591 m$ in our sample). Their conclu-
sion regarding the absence of agency effect is therefore partly driven by a
sample bias.
We also expect long-term loans to be more subject to monitoring effects
and less subject to specialization effects. This is confirmed in Table 6. The
positive coefficient for Rating becomes negative as we move from short- to
long-term loans. Also, the coefficient for Covenant is only significant and
negative for long-term loans.
21

5.3. Associations in the syndication process
Another direction to explain the mixed results about the specialization and
the monitoring hypotheses is to investigate the associations among banks
in the syndication process. In this sub-section, we investigate if identical
leaders and co-agents are involved in the same syndicates.9 We repeat the
investigation for leaders and participants.
We run a Chi-square test to determine if the identity of the leader affects
the occurrence of banks acting as co-agents. Specifically, we compare the
unconditional distribution of co-agents across deals with the same distribu-
tion conditional on bank L being the leader. Let N denote the total number
of deals involving NB banks. Let NC denote the total number of co-agent
roles played by bank C. The unconditional probability of bank C acting as
a co-agent is NC/N . Suppose bank L is the leader in NL deals. Within these
NL deals, bank C is a co-agent in NCL deals. The conditional probability of
bank C acting as a co-agent in a deal led by bank L is NCL/NL.
The bias in leader L’s co-agent selection is measured by the Chi-square
distance between the conditional and the unconditional distributions given
by
Dχ2 =
NB−1X1
³NCL
NL− NC
N
´2Nc
N
.
Under the null hypothesis that the two distributions are the same, the law
of the variable NL ·Dχ2 converges to a Chi-square law with NB − 1 degreesof freedom as NL goes to infinity.
Since the market for leading syndicates is strongly oligopolistic, we need
9We thank one referee for making this suggestion.
22

to restrict our sample to deals led by the top three lead banks to maintain the
validity of the asymptotic test (all these leaders have led at least a hundred
deals in our sample). We get a total of N = 672 deals (57% of the 1,181
initial observations) that involve NB = 192 different co-agents. The top
three leaders are JP Morgan (321 leads), Bank of America (195 leads), and
Citigroup (156 leads).10 We repeat the same procedure to test if leaders are
biased when selecting participants. The total 672 deals involve NB = 554
different participants. Results are reported in Table 7.
Insert Table 7 Here
First, we find very strong evidence that co-agents are not uniformly dis-
tributed across top leaders. For all top three leaders, the conditional prob-
ability of being a co-agent is statistically different from the unconditional
probability. This result indicates that leaders tend to work with specific
co-agents. Consistent with the specialization hypothesis, leaders do not ran-
domly select co-agents but rather choose those whose administrative skills
are complementary. Also, this finding limits the importance of the monitor-
ing effect as participants can interpret the repeated contracting as a risk of
collusion between leaders and co-agents.
Second, we find the same very strong evidence that participants are not
uniformly distributed across leaders. Rather, we observe that banks cluster
their participations around deals led by specific leaders. We interpret this
result as evidence that syndicates arise as repeated contracting relations with
10Note that this oligopoly is not a bias in our sample. According to Dealscan, the
average market share for syndication lead over the 1999-2003 period of JP Morgan, Bank
of America, and Citigroup was 19%, 13%, and 11.5%, respectively.
23

the same participants. Such repeated contracting relations reduce adverse se-
lection and moral hazard problems between the leader and participants. This
explains why our previous analysis finds mixed support for the monitoring
hypothesis.
6. Conclusion
The process of loan syndication typically involves the participation of co-
agents. These banks share administrative tasks with the lead arranger.
Hence, their presence can be justified by cost reduction reasons. Since they
work in collaboration with the leader, co-agents can also have an informa-
tional advantage over other members of the syndicate. Their role can there-
fore consist of mitigating potential agency conflicts between the informed
leader and the other members of the syndicate.
We have challenged the specialization and the monitoring hypotheses to
explain the agency structure of loan syndicates. Using the Dealscan database
to examine the observable characteristics of the syndicated loans, we find
strong evidence for both hypotheses. One possible explanation for this finding
is that specialization and monitoring effects may not be exclusive.
We provide support for alternative explanations. First, the specialization
and monitoring effects do not apply for the same deals. A sub-sample analysis
reveals that co-agents arise for cost-cutting reasons when loans are of short
term and small in size. In contrast, co-agents act as delegated monitors when
informational conflicts are potentially severe: that is, when loans are of long
term and large in size. Second, we find evidence of repeated contracting
24

between leaders and participants and also between leaders and co-agents,
which attenuates the monitoring effect.
References
Alchian, Armen A. and Harold Demsetz, 1972. Production, informationcosts, and economic organization, American Economic Review 62,777-795.
Altman, Edward and Heather Suggitt, 2000. Default rates in the syndicatedbank loan market: A mortality analysis, Journal of Banking and Finance24, 229-253.
Angbazo, Lazarus, JianpingMei and Anthony Saunders, 1998. Credit spreadsin the market for highly leveraged transaction loans, Journal of Bankingand Finance 22, 1249-1282.
Barclay, Michael J. and Clifford W. Smith, 1995. The maturity structure ofcorporate debt, Journal of Finance 50, 609-631.
Berglöf, Erik and Ernst-Ludwig von Thadden, 1994. Short-term versuslong-term interests: Capital structure with multiple investors, QuarterlyJournal of Economics 109, 1055-1084.
Bradley, Michael and Michael R. Roberts, 2004. The structure and pricingof corporate debt covenants. Working paper, Duke University.
Chowdhry, Bhagwan and Vikram Nanda, 1996. Stabilization, syndicationand pricing of IPOs, Journal of Financial and Quantitative Analysis 31,25-42.
Dai, Jie, 2002. Heterogeneous banks, loan decisions, and their informationalexternality. Working paper, Laval University.
Das, Sanjiv R. and Ashish Nanda, 1999. A theory of banking structure,Journal of Banking and Finance 23, 863-895.
Dennis, Steven and Donald J. Mullineaux, 2000. Syndicated loans, Journalof Financial Intermediation 9, 404-426.
Dichev, Ilia D. and Douglas J. Skinner, 2002. Large-sample evidence on thedebt covenant hypothesis, Journal of Accounting Research 40, 1091-1124.
Esty, Benjamin C. and William L. Megginson, 2003. Creditor rights,enforcement, and debt ownership structure: Evidence from the globalsyndicated loan market, Journal of Financial and Quantitative Analysis
25

38, 37-59.Gonas, John S., Michael J. Highfield, and Donald J. Mullineaux, 2004. Whenare commercial loans secured?, The Financial Review 39, 79-99.
Gorton, Gary and James A. Kahn, 2000. The design of bank loan contracts,Review of Financial Studies 13, 331-364.
Goyal, Vidhan K., 2005. Market discipline of bank risk: Evidence fromsubordinated debt contracts, Journal of Financial Intermediation 14,318-350.
Guedes, José Correia and Tim C. Opler, 1996. The determinants of thematurity of corporate debt issues, Journal of Finance 51, 1809-1833.
Harvey, Campbell R., Karl V. Lins and Andrew H. Roper, 2004. The effectof capital structure when expected agency costs are extreme, Journal ofFinancial Economics 74, 3-30.
Holmström, Bengt, 1982. Moral hazard in teams, Bell Journal of Economics13, 324-340.
Johnson, Shane A., 2003. Debt maturity and the effects of growthopportunities and liquidity risk on leverage, Review of Financial Studies16, 209-236.
Jones, Jonathan, William W. Lang and Peter Nigro, 2005. Agent bankbehavior in bank loan syndications, Journal of Financial Research 28,385-402.
Lee, Sang Whi and Donald J. Mullineaux, 2004. Financial distress, and thestructure of commercial lending syndicates, Financial Management 33,107-130.
Maudos, Joaquin, José M. Pastor and Francisco Perez, 2002. Competitionand efficiency in the Spanish banking sector: The importance ofspecialization, Applied Financial Economics 12, 505-526.
Melnik, Arie L. and Steven E. Plaut, 1996. Industrial structure in theEurocredit underwriting market, Journal of International Money andFinance 15, 623-636.
Mukherjee, Kankana, Subhash C. Ray and Stephen M. Miller, 2001.Productivity growth in large US commercial banks: The initialpost-deregulation experience, Journal of Banking and Finance 25,913-940.
Myers, Stewart C., 1977. Determinants of corporate borrowing, Journal ofFinancial Economics 5, 147-175.
Narayanan, Rajesh P., Kasturi P. Rangan and Nanda K. Rangan, 2004. Therole of syndicate structure in bank underwriting, Journal of Financial
26

Economics 72, 555-580.Nash, Rob C., Jeffry M. Netter and Annette B. Poulsen, 2003. Determinantsof contractual relations between shareholders and bondholders:Investment opportunities and restrictive covenants, Journal of CorporateFinance 9, 201-232.
Panyagometh, Kamphol and Gordon S. Roberts, 2002. Private information,agency problems and determinants of loan syndications: Evidence from1987-1999. Working paper, York University.
Pichler, Pegaret and William J. Wilhelm, 2001. A theory of the syndicate:Form follows function, Journal of Finance 56, 2237-2264.
Simons, Katerina, 1993. Why do banks syndicate loans?, New EnglandEconomic Review, Federal Reserve Bank of Boston, 45-52.
Smith, Clifford W. and Jerold B. Warner, 1979. On financial contracting,Journal of Financial Economics 7, 117-161.
Song, Weiling, 2004. Competition and coalition among underwriters: Thedecision to join a syndicate, Journal of Finance 59, 2421-2444.
Strausz, Roland, 1997. Delegation of monitoring in a principal-agentrelationship, Review of Economic Studies 64, 337-357.
Sufi, Amir, 2005. Information asymmetry and financing arrangements:Evidence from syndicated loans, Journal of Finance, forthcoming.
Viswanath, P.V. and Wayne Eastman, 2003. Bondholder-stockholderconflict: Contractual covenants vs. court-mediated ex-post settling-up,Review of Quantitative Finance and Accounting 21, 157-177.
Wilson, Robert B., 1968. The theory of syndicates, Econometrica 36,119-132.
27
Figures
0
5
10
15
20
25
1992 1993 1994 1995 1996 1997 1998 1999 2000 2001 2002 2003
Year
%
DealscanSample
Figure 1Annual distributions for the sample and for the whole Dealscan
database
28

Tables
Table 1Year, industry, and loan purpose distributions
The distributions of the 1,181 loans of the final sample with respect to theyear of loan activation (Panel A), the borrower’s industry (Panel B) and the loanpurpose (Panel C).
Panel A: Panel B: Panel C:Year Distribution Industry Distribution Loan Purpose DistributionYear # deals SIC code # deals Loan purpose # deals1992 1 0-999 2 Capital budgeting 321993 1 1000-1999 100 Long-term financing 3841994 10 2000-2999 221 Short-term financing 3411995 7 3000-3999 253 Restructuring 2501996 26 4000-4999 322 Other general purpose 1741997 84 5000-5999 1391998 109 7000-7999 981999 206 8000-8999 462000 2682001 2402002 1822003 47Total 1,181 1,181 1,181
29

Table 2Descriptive statistics of the final sampleThe mean, median, standard deviation, minimum and maximum values for the
dependent variables, the explanatory variables and the control variables that arenot dummies.
Standard Minimum MaximumMean Median Deviation Value Value
Dependent variablesNCA 6.00 4.00 6.14 0.00 38.00PCA (%) 42.55 42.22 25.56 0.00 95.37CCA (%) 39.00 25.98 32.61 2.76 100.00Explanatory variablesFee (basis points) 100.97 42.50 122.60 0.00 900.00Rating 0.59 1.00 0.49 0.00 1.00Covenants 1.80 2.00 0.97 0.00 5.00Maturity (months) 40.19 36.00 27.03 3.00 301.00Participants 8.87 7.00 7.81 0.00 106.00Leader share (%) 18.38 13.33 16.02 0.00 100.00Control variablesLoan size (m$) 590.64 300.00 982.88 100.00 18469.00Firm size (log of sales) 21.60 21.62 1.36 16.57 24.94
30
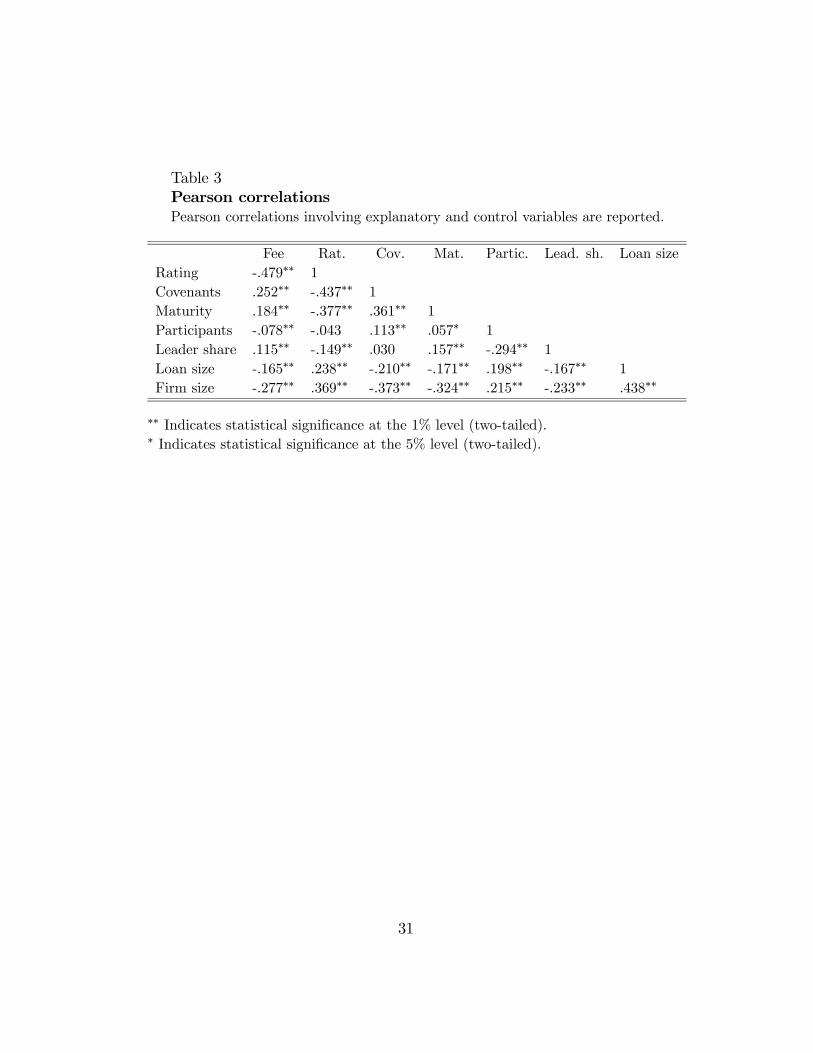
Table 3Pearson correlationsPearson correlations involving explanatory and control variables are reported.
Fee Rat. Cov. Mat. Partic. Lead. sh. Loan sizeRating -.479∗∗ 1Covenants .252∗∗ -.437∗∗ 1Maturity .184∗∗ -.377∗∗ .361∗∗ 1Participants -.078∗∗ -.043 .113∗∗ .057∗ 1Leader share .115∗∗ -.149∗∗ .030 .157∗∗ -.294∗∗ 1Loan size -.165∗∗ .238∗∗ -.210∗∗ -.171∗∗ .198∗∗ -.167∗∗ 1Firm size -.277∗∗ .369∗∗ -.373∗∗ -.324∗∗ .215∗∗ -.233∗∗ .438∗∗
∗∗ Indicates statistical significance at the 1% level (two-tailed).∗ Indicates statistical significance at the 5% level (two-tailed).
31

Table 4OLS regression results for the NCA modelThe corresponding t-statistics are in parentheses. Regression (1) includes all
six explanatory variables. Regression (2) excludes the variable Rating. Regression(3) excludes the variable Covenants. Regression (4) excludes the variables Ratingand Covenants.
Predicted sign RegressionSpecial. Monit. (1) (2) (3) (4)
Intercept -13.199∗∗∗ -13.298∗∗∗ -13.891∗∗∗ -13.668∗∗∗
(-4.113) (-4.142) (-4.505) (-4.435)Fee − ? -0.003∗∗ -0.002∗ -0.003∗∗ -0.002∗
(-2.208) (-1.705) (-2.245) (-1.783)Rating ? − -0.613∗ -0.549
(-1.676) (-1.540)Covenants + − -0.135 -0.069
(-0.780) (-0.412)Maturity − + 0.034∗∗∗ 0.036∗∗∗ 0.034∗∗∗ 0.035∗∗∗
(5.657) (5.933) (5.606) (5.977)Participants − + -0.176∗∗∗ -0.173∗∗∗ -0.178∗∗∗ -0.174∗∗∗
(-8.941) (-8.820) (-9.158) (-9.030)Leader share ? − -0.124∗∗∗ -0.123∗∗∗ -0.124∗∗∗ -0.123∗∗∗
(-13.463) (-13.358) (-13.444) (-13.361)Loan size 0.003∗∗∗ 0.003∗∗∗ 0.003∗∗∗ 0.003∗∗∗
(16.001) (15.929) (16.086) (16.012)Firm size 1.020∗∗∗ 0.995∗∗∗ 1.041∗∗∗ 1.008∗∗∗
(7.666) (7.521) (7.986) (7.835)Adjusted R2 43.0% 42.9% 43.0% 42.9%F -statistic 30.669∗∗∗ 31.580∗∗∗ 31.716∗∗∗ 32.725∗∗∗
∗∗∗ Indicates statistical significance at the 0.01 level.∗∗ Indicates statistical significance at the 0.05 level.∗ Indicates statistical significance at the 0.10 level.
32

Table 5Negative binomial regression results for the NCA modelThe corresponding Chi-square statistics are in parentheses. Regression (1)
includes all six explanatory variables. Regression (2) excludes the variable Rat-ing. Regression (3) excludes the variable Covenants. Regression (4) excludes thevariables Rating and Covenants.
Predicted sign RegressionSpecial. Monit. (1) (2) (3) (4)
Intercept -0.8237∗ -0.8637∗ -0.8092∗ -0.8091∗
(2.93) (3.23) (3.04) (3.04)Fee − ? -0.0007∗∗∗ -0.0005∗∗∗ -0.0007∗∗∗ -0.0005∗∗∗
(9.18) (6.83) (9.18) (6.64)Rating ? − -0.0966 -0.0979∗
(2.65) (2.82)Covenants + − 0.0031 0.0117
(0.01) (0.19)Maturity − + 0.0047∗∗∗ 0.0050∗∗∗ 0.0047∗∗∗ 0.0051∗∗∗
(24.32) (27.49) (25.23) (29.66)Participants − + -0.0243∗∗∗ -0.0238∗∗∗ -0.0243∗∗∗ -0.0235∗∗∗
(55.88) (53.78) (57.30) (54.66)Leader share ? − -0.0322∗∗∗ -0.0319∗∗∗ -0.0322∗∗∗ -0.0320∗∗∗
(276.92) (274.32) (277.32) (274.66)Loan size 0.0003∗∗∗ 0.0003∗∗∗ 0.0003∗∗∗ 0.0003∗∗∗
(89.31) (88.18) (89.49) (88.14)Firm size 0.1525∗∗∗ 0.1498∗∗∗ 0.1520∗∗∗ 0.1478∗∗∗
(59.27) (57.56) (61.75) (59.31)Scaled deviance 1.1605 1.1602 1.1595 1.1594Scaled Pearson χ2 1.1445 1.1457 1.1431 1.1433
∗∗∗ Indicates statistical significance at the 0.01 level.∗∗ Indicates statistical significance at the 0.05 level.∗ Indicates statistical significance at the 0.10 level.
33

Table 6Regression results for sub-samplesThis table reports the coefficient estimations of the OLS regressions of the
NCA model for two sub-samples. In regressions (1) and (2), the sub-sample isthe first and last quartiles of loan size, respectively. In regressions (3) and (4), thesub-sample is the first and last quartiles of loan maturity, respectively.
Sub-sample Predicted sign Loan size Loan maturityQuartile Special. Monit. Smallest Biggest Shortest LongestIntercept -5.883 -12.099∗∗ -8.770 -28.732∗∗∗
(-0.682) (-2.250) (-1.228) (-3.959)Fee − ? -0.010∗ -0.001 0.007 0.001
(-1.963) (-0.893) (1.483) (0.364)Rating ? − -1.072 -1.135∗∗ 1.931∗∗ -3.075∗∗∗
(-0.875) (-2.120) (2.192) (-3.878)Covenants + − 0.851 -0.210 0.050 -0.608∗
(1.417) (-0.872) (0.122) (-1.852)Maturity − + 0.084∗∗∗ 0.006 0.231 0.007
(4.547) (0.768) (1.286) (0.453)Participants − + -0.313∗∗∗ -0.091∗∗ -0.230∗∗∗ -0.128∗∗∗
(-7.197) (-2.282) (-4.520) (-4.358)Leader share ? − -0.231∗∗∗ -0.073∗∗∗ -0.162∗∗∗ -0.080∗∗∗
(-7.358) (-5.467) (-6.422) (-4.652)Loan size 0.003∗∗∗ -0.005 0.003∗∗∗ 0.004∗∗∗
(7.108) (-0.740) (9.446) (7.462)Firm size 0.849∗∗ 0.975∗∗∗ 0.436 1.753∗∗∗
(2.285) (4.540) (1.557) (5.977)Adjusted R2 41.2% 22.4% 40.2% 51.8%F -statistic 8.344∗∗∗ 4.034∗∗∗ 8.315∗∗∗ 12.725∗∗∗
∗∗∗ Indicates statistical significance at the 0.01 level.∗∗ Indicates statistical significance at the 0.05 level.∗ Indicates statistical significance at the 0.10 level.
34

Table 7Chi-square tests for associations in syndicatesThis table reports chi-square tests about the difference between the condi-
tional and the unconditional probabilities of banks acting as co-agent (panel A) orparticipant (panel B) for the top three leaders.
Panel A: Associations between leader and co-agentsLeader JP Morgan Bank of America Citigroup
Chi-square 278.91∗∗∗ 356.07∗∗∗ 518.11∗∗∗
Degree of freedom 191 191 191Panel B: Associations between leader and participantsLeader JP Morgan Bank of America CitigroupChi-square 929.03∗∗∗ 895.06∗∗∗ 796.57∗∗∗
Degree of freedom 553 553 553
∗∗∗ Indicates statistical significance at the 0.01 level.∗∗ Indicates statistical significance at the 0.05 level.∗ Indicates statistical significance at the 0.10 level.
35

![Henderson v Merrett Syndicates [1994] 3 WLR 761](https://static.fdocuments.in/doc/165x107/577cc1781a28aba711932aad/henderson-v-merrett-syndicates-1994-3-wlr-761.jpg)


![Index [researchonline.jcu.edu.au] · joint venture see Joint venture overview .... 16.2 partnership see Partnership sole trader see Sole trader syndicates see Syndicates trading trust](https://static.fdocuments.in/doc/165x107/5e1f645778460e348e4c4e11/index-joint-venture-see-joint-venture-overview-162-partnership-see-partnership.jpg)