
The Age of Reason: Financial Decisions Over the Lifecycle Sumit Agarwal Federal Reserve Bank of...
25
The Age of Reason: Financial Decisions Over the Lifecycle Sumit Agarwal Federal Reserve Bank of Chicago John Driscoll Federal Reserve Board Xavier Gabaix NYU and NBER David Laibson Harvard and NBER The views expressed in this paper are not necessarily those of the Federal Reserve Bank of Chicago or of the Federal Reserve Board. May 2008
-
Upload
myrtle-mckenzie -
Category
Documents
-
view
213 -
download
0
Transcript of The Age of Reason: Financial Decisions Over the Lifecycle Sumit Agarwal Federal Reserve Bank of...

The Age of Reason:Financial Decisions Over the Lifecycle
Sumit Agarwal Federal Reserve Bank of Chicago
John Driscoll Federal Reserve Board
Xavier Gabaix NYU and NBER
David Laibson Harvard and NBER
The views expressed in this paper are not necessarily those of the Federal Reserve Bank of Chicago or of the Federal Reserve Board.
May 2008

“Performance” peaks.
• Baseball: 29 (James 2003)• Mathematicians, theoretical physicists, and lyric poets:
early 30s (Simonton 1988). • Chess players: mid-30s (Charness and Bosman 1990). • Autocratic rulers: early 40s (Simonton 1988). • Novelists: 50 (Simonton 1988).• Economists?
– 20s (Hamermesh and Oster 1998)– Nobel-Prize-winners (Weinberg & Galenson 2005)
• “Conceptual” laureates: 43• “Experimental” laureates: 61

Our findings:
• Financial “performance” rises then declines with age• Performance:
– negotiate low (borrowing) interest rates– pay fewer fees
• This regularity is confirmed for 10 separate types of financial choices
• On average, financial performance peaks at age 53

(1,2) Home Equity Loans and Home Equity Credit Lines
• Proprietary data from large financial institutions• 75,000 contracts for home equity loans and lines of
credit, from March-December 2002• We observe:
– Contract terms: APR and loan amount– Borrower demographic information: age, employment status,
years on the job, home tenure, home state location– Borrower financial information: income, debt-to-income ratio– Borrower risk characteristics: FICO (credit) score, loan-to-value
(LTV) ratio

Home Equity Loan APR by Borrower Age
5.00
5.25
5.50
5.75
6.00
6.25
6.5020 23 26 29 32 35 38 41 44 47 50 53 56 59 62 65 68 71 74 77 80
Borrower Age (Years)
AP
R (
Pe
rce
nt)
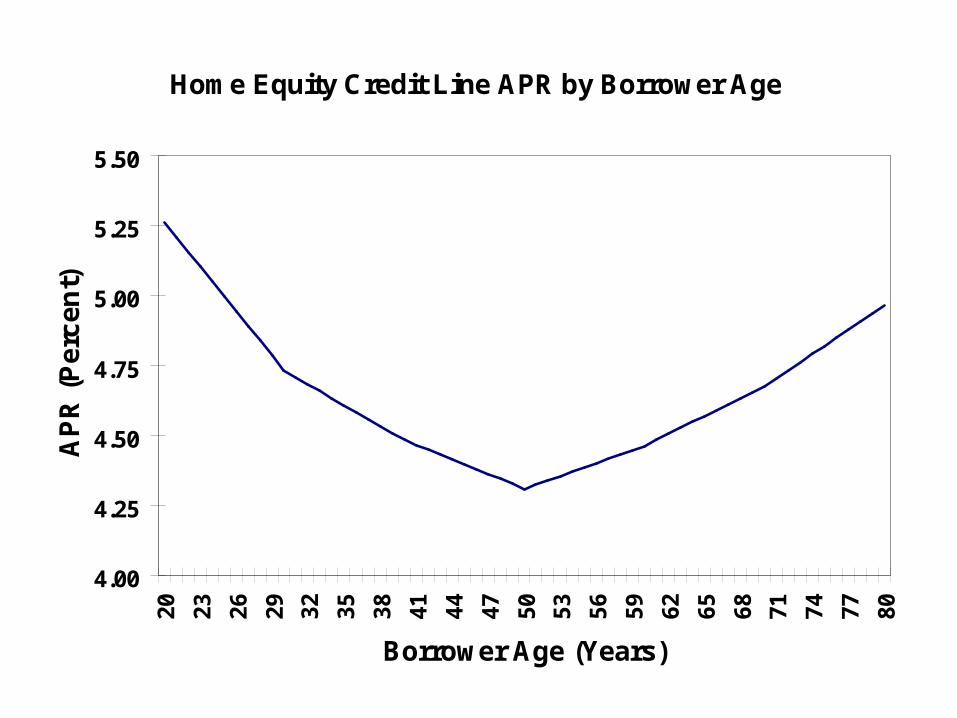
Home Equity Credit Line APR by Borrower Age
4.00
4.25
4.50
4.75
5.00
5.25
5.5020 23 26 29 32 35 38 41 44 47 50 53 56 59 62 65 68 71 74 77 80
Borrower Age (Years)
AP
R (
Pe
rce
nt)

(3) “Eureka”: Learning to Avoid Interest Charges on Balance Transfer Offers
• Balance transfer offers: borrowers pay lower APRs on balances transferred from other cards for 6-9 months
• New purchases on card have higher APRs• Payments go towards balance transferred first, then
towards new purchases• Optimal strategy: make no new purchases on card to
which balance has been transferred

Eureka: Predictions
• Borrowers may not initially understand card terms• Borrowers learn about terms through usage
– We will see “eureka” moments: new purchases on balance-transfer cards drop to zero in the month after borrowers “figure out” how to optimize
• Study: 14,798 balance transfer accounts over the period January 2000 to December 2002

Fraction of Borrowers in Each Age Group Experiencing a Eureka Moment, by Month
0%
10%
20%
30%
40%
50%
60%
18 to 24 25 to 34 35 to 44 45 to 64 Over 65Borrower Age Category
Per
cen
t o
f B
orr
ow
ers
Month One Month TwoMonth Three Month FourMonth Five Month SixNo Eureka

(4,5,6) Fee payments
• We examine payments of three types of credit card fees:– Late payment fees– Over credit limit fees– Cash advance fees
• We again see U-shaped patterns by age• The opportunity cost model (younger and older adults
have more time to avoid fees) would predict the opposite pattern
• 3.9 million month-borrower observations on credit card purchases from January 2002 through December 2004

Frequency of Fee Payment by Borrower Age
0.15
0.17
0.19
0.21
0.23
0.25
0.27
0.29
0.31
0.33
0.352
02
32
62
93
23
53
84
14
44
75
05
35
65
96
26
56
87
17
47
78
0
Borrower Age (Years)
Fe
e F
req
ue
nc
y (
pe
r m
on
th)
Late Fee
Over Limit Fee
Cash Advance Fee
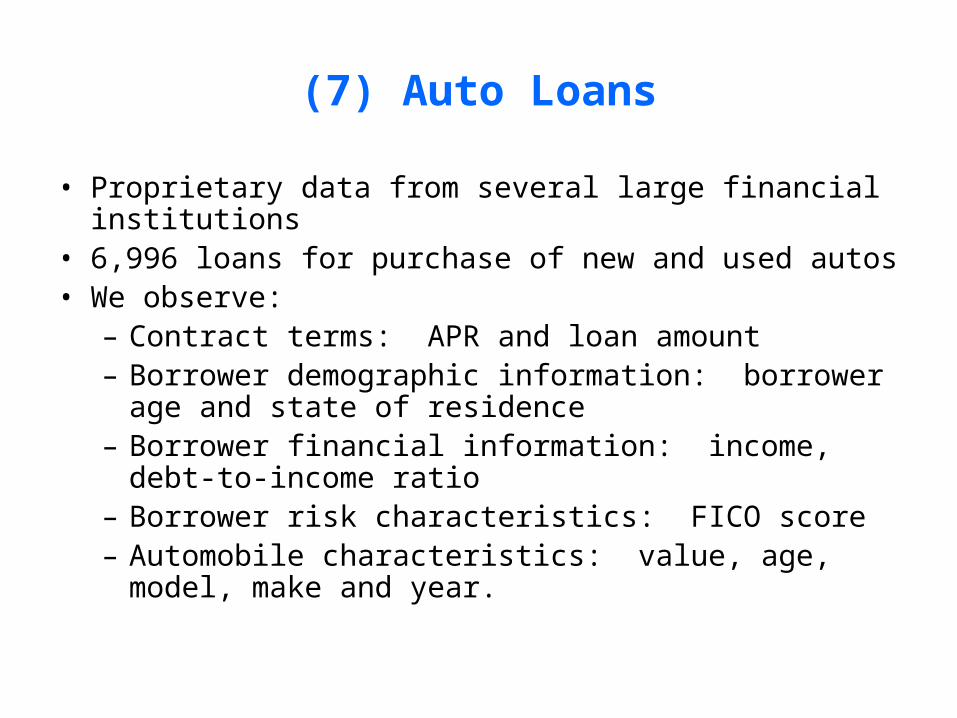
(7) Auto Loans
• Proprietary data from several large financial institutions• 6,996 loans for purchase of new and used autos• We observe:
– Contract terms: APR and loan amount– Borrower demographic information: borrower age
and state of residence– Borrower financial information: income, debt-to-
income ratio– Borrower risk characteristics: FICO score– Automobile characteristics: value, age, model, make
and year.

Auto Loan APR by Borrower Age
8.00
8.25
8.50
8.75
9.00
9.25
9.50
Borrower Age (Years)
AP
R (
Pe
rce
nt)
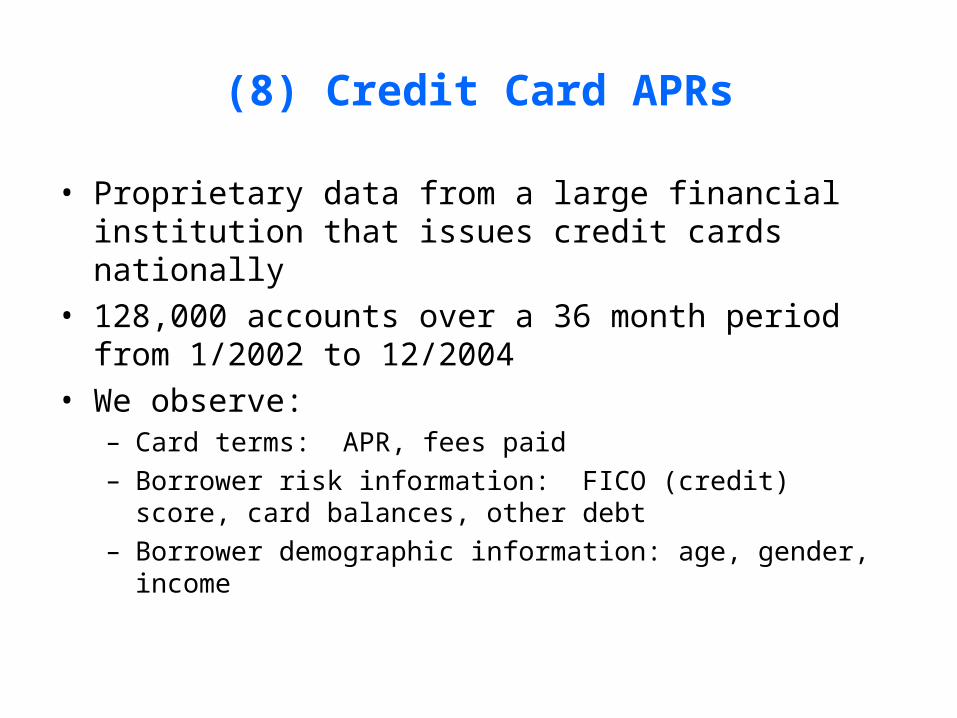
(8) Credit Card APRs
• Proprietary data from a large financial institution that issues credit cards nationally
• 128,000 accounts over a 36 month period from 1/2002 to 12/2004
• We observe:– Card terms: APR, fees paid– Borrower risk information: FICO (credit) score, card balances,
other debt– Borrower demographic information: age, gender, income
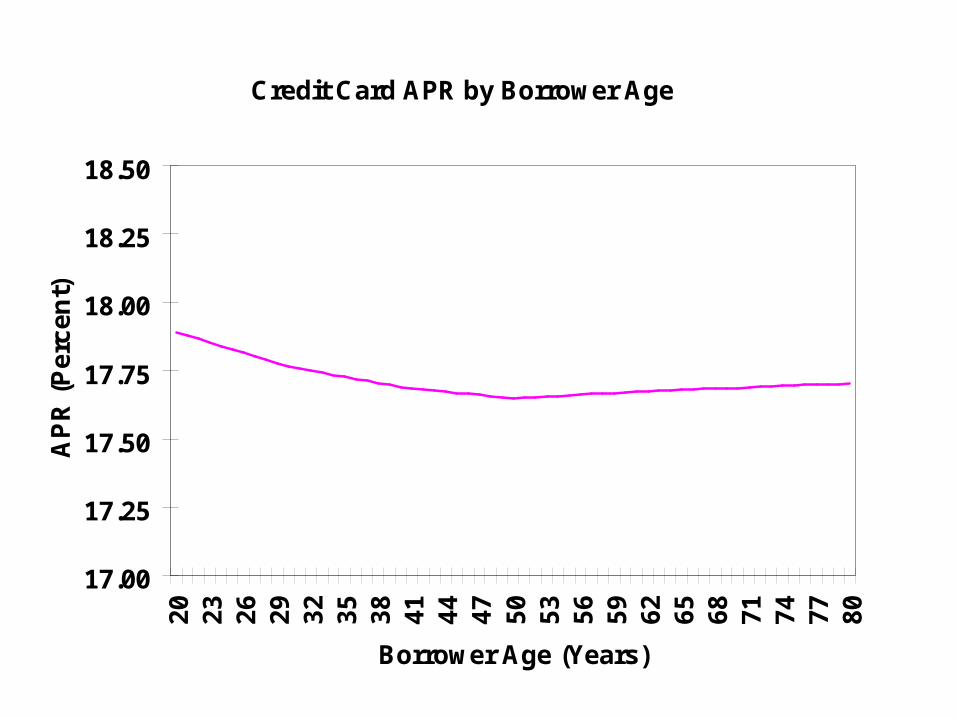
Credit Card APR by Borrower Age
17.00
17.25
17.50
17.75
18.00
18.25
18.502
02
32
62
93
23
53
84
14
44
75
05
35
65
96
26
56
87
17
47
78
0
Borrower Age (Years)
AP
R (
Pe
rce
nt)

(9) Mortgage APRs
• Proprietary data from a large financial institution that originates first mortgages in Argentina
• 4,867 fixed-rate, first-mortgage loans on owner-occupied properties between June 1998 and March 2000
• We observe:– Contract terms: APR and loan amount– Borrower demographic information: age, employment status,
years on the job, home tenure, home location– Borrower financial information: income, debt-to-income ratio– Borrower risk characteristics: Veraz (credit) score, loan-to-value
(LTV) ratio
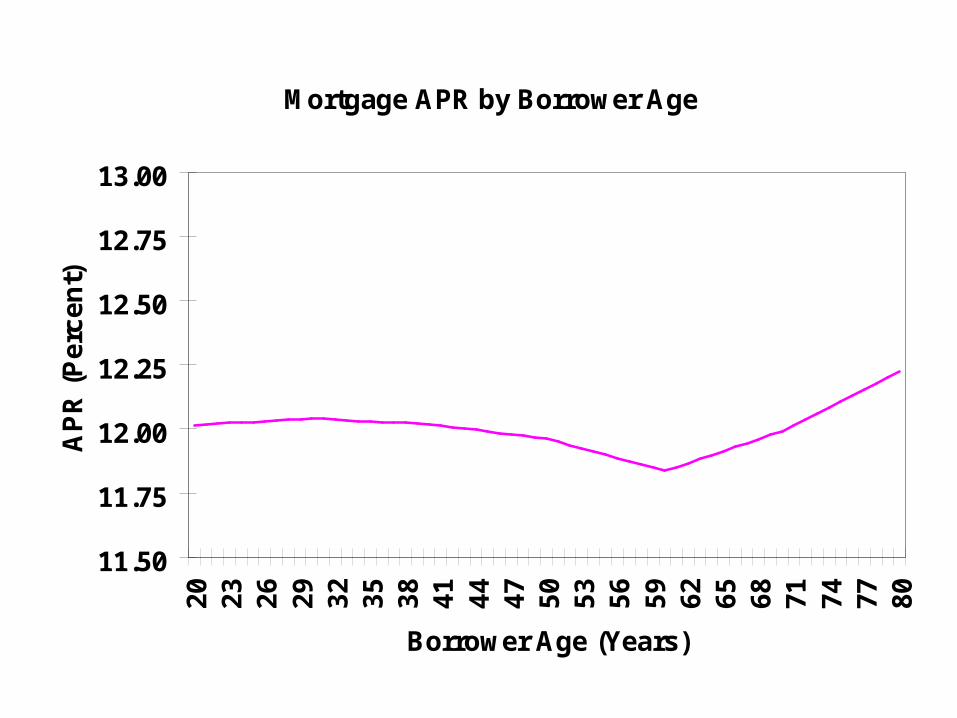
Mortgage APR by Borrower Age
11.50
11.75
12.00
12.25
12.50
12.75
13.002
02
32
62
93
23
53
84
14
44
75
05
35
65
96
26
56
87
17
47
78
0
Borrower Age (Years)
AP
R (
Pe
rce
nt)
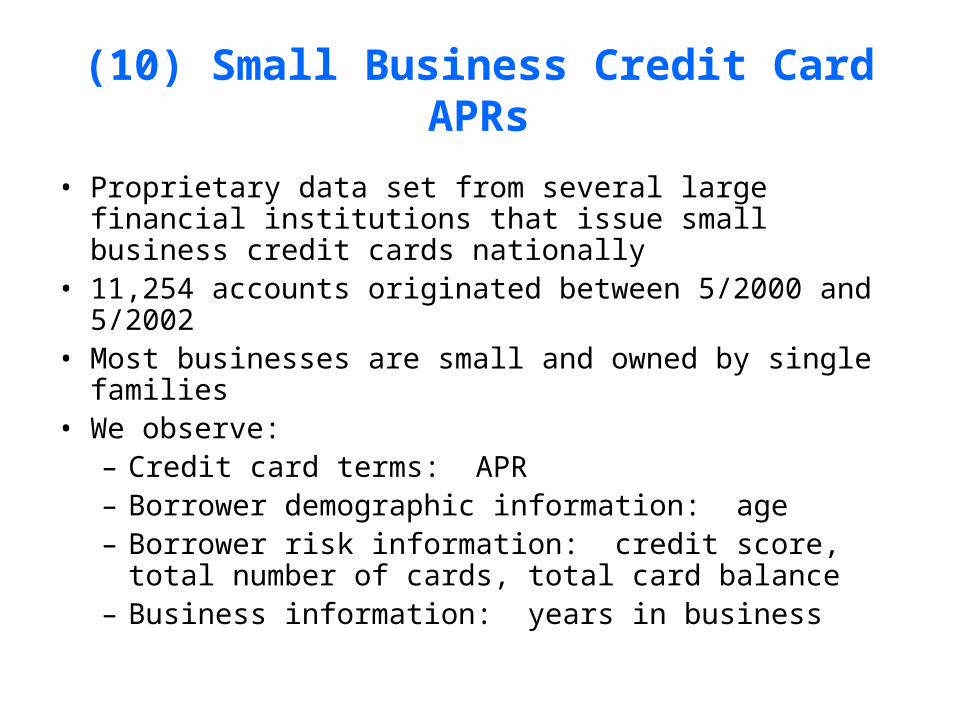
(10) Small Business Credit Card APRs
• Proprietary data set from several large financial institutions that issue small business credit cards nationally
• 11,254 accounts originated between 5/2000 and 5/2002• Most businesses are small and owned by single families• We observe:
– Credit card terms: APR– Borrower demographic information: age– Borrower risk information: credit score, total number
of cards, total card balance– Business information: years in business

Small Business Credit Card APR by Borrower Age
14.50
14.75
15.00
15.25
15.50
15.75
16.00
20
23
26
29
32
35
38
41
44
47
50
53
56
59
62
65
68
71
74
77
80
Borrower Age (Years)
AP
R (
Pe
rce
nt)

U-shape for financial mistakes in 10 examples
– Home equity loans – Home equity lines of credit– Eureka moments for balance transfers– Late payment fees– Over credit limit fees– Cash advance fees– Auto loans– Credit cards– Small business credit cards– Mortgages
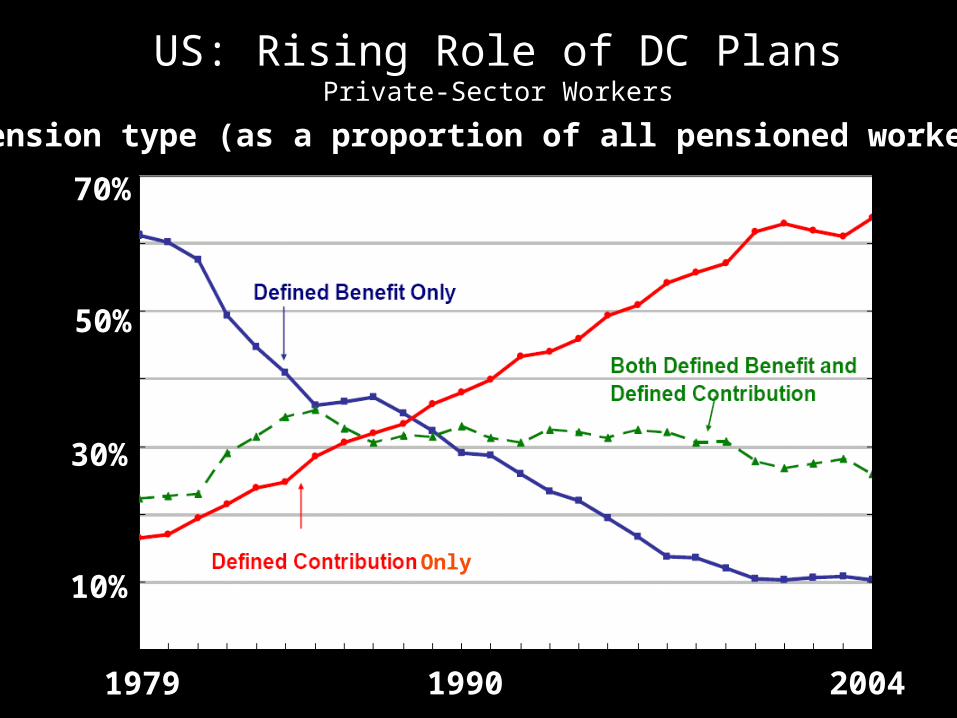
US: Rising Role of DC PlansPrivate-Sector Workers
1979 1990 2004
Only10%
30%
50%
70%
Pension type (as a proportion of all pensioned workers)
Only

Breakdown of Retirement Assets in US Market (year-end 2007)
Total US Retirement Assets: $17.4 trillion
Pension plans forGovernment Employees:
$4.4 trillion
Private pension plans: $13.0 trillion
IRA: $4.6 trillionDC: $4.4 trillion
Annuities: $1.6 trillion
DB Assets:$2.4 trillion
Other Assets:$10.6 trillion
Source: ICI, December 2007

Most Retirement Savings is inIndividual Accounts
Total US Retirement Assets: $17.4 trillion
All DB Pensions $4.6 trillion
Individual accounts: $12.8 trillion
Source: ICI, December 2007

$100 bills on the sidewalkChoi, Laibson, Madrian (2004)
• Employer match is an instantaneous, riskless return on investment
• Particularly appealing if you are over 59½ years old
– Have the most experience, so should be savvy
– Retirement is close, so should be thinking about saving
– Can withdraw money from 401(k) without penalty
• We study seven companies and find that on average, half of employees over 59½ years old are not fully exploiting their employer match
– Average loss is 1.6% of salary per year
• Educational intervention has no effect
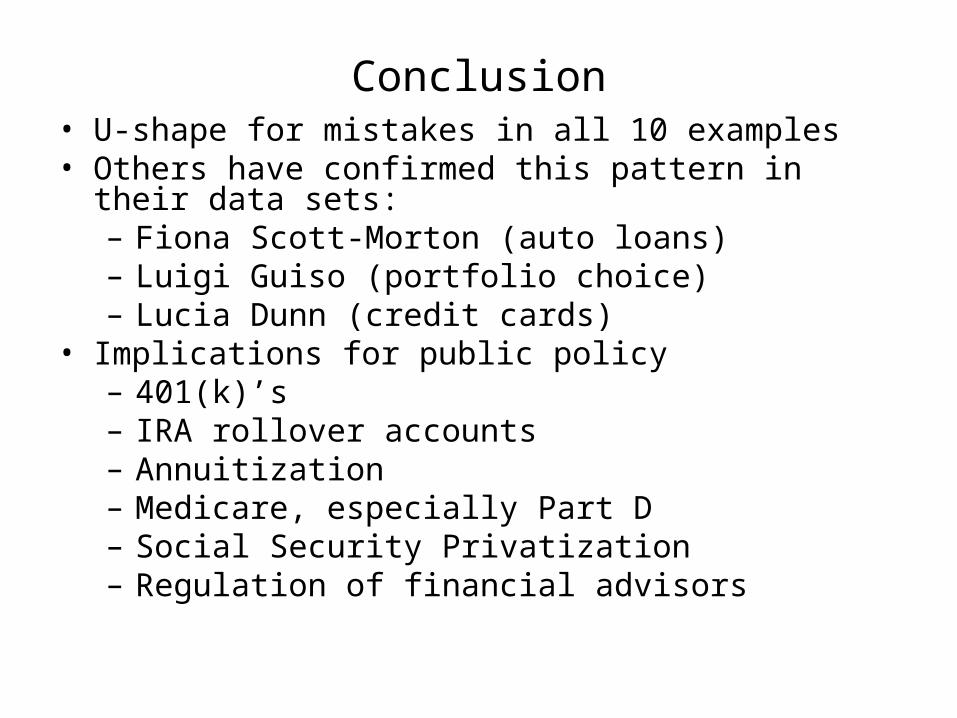
Conclusion• U-shape for mistakes in all 10 examples• Others have confirmed this pattern in their data sets:
– Fiona Scott-Morton (auto loans)– Luigi Guiso (portfolio choice)– Lucia Dunn (credit cards)
• Implications for public policy– 401(k)’s– IRA rollover accounts– Annuitization– Medicare, especially Part D– Social Security Privatization– Regulation of financial advisors