The Afghan-Pakistan War: New NATO/ISAF Reporting on Key Trends · The Afghan-Pakistan War: New NATO...
23
The Afghan-Pakistan War: New NATO/ISAF Reporting on Key Trends Anthony H. Cordesman Arleigh A. Burke Chair in Strategy February 10, 2009 1800 K Street, NW Suite 400 Washington, DC 20006 Phone: 1.202.775.3270 Fax: 1.202.775.3199 Web: www.csis.org/burke/reports
Transcript of The Afghan-Pakistan War: New NATO/ISAF Reporting on Key Trends · The Afghan-Pakistan War: New NATO...

The Afghan-Pakistan War:
New NATO/ISAF Reporting
on Key TrendsAnthony H. Cordesman
Arleigh A. Burke Chair in Strategy
February 10, 2009
1800 K Street, NW
Suite 400
Washington, DC 20006
Phone: 1.202.775.3270
Fax: 1.202.775.3199
Web:
www.csis.org/burke/reports

The Challenge of Reporting on the War
New NATO/ISAF reporting that maps and charts the course of the war in Afghanistan is now available provides
important into the trends in the war in Afghanistan, and show the situation at the point the President announces his
new strategy. It is important to note, however, that many of the "favorable" trends are favorable because they use a
90 day rolling average as a basis of comparison for February statistics which means they reflect a downward trend
in threat activity because they compare the worst winter months for fighting with an earlier period where fighting is
more intense. NATO indicates that it will to return to comparing rolling trends to a similar timeframe in 2008 from
March onwards. These comparisons of multiple years are far more useful that comparisons of one sequential period
to another in a highly seasonal war.
The Limits to the Analysis We Have
The new NATO/ISAF data are extremely helpful, and do a much better job of explaining the tactical situation. At
the same time, they fall short of providing meaningful transparency into what is a war of political attrition fought in
two different countries, and what is really happening in the political and economic dimensions.
NATO/ISAF does not map the combined situation in Afghanistan and Pakistan, and there are serious limits on the
scope of its analysis which still focuses on the tactical or "kinetic" situation, and which does not cover
NATO/ISAF's ability to provide lasting security or "hold" capabilities, and the level of aid and development or
"build" capabilities. Security is also an issue.
These data are also more favorable in describing Jihadist influence and activity than the UN estimates and maps
and those of groups like the Senlis Council, although this does not mean that they are not correct. As a result, one
UN and two Senlis maps are added to the NATO/ISAF data.

More broadly, the reader should consider the following additional trend data.
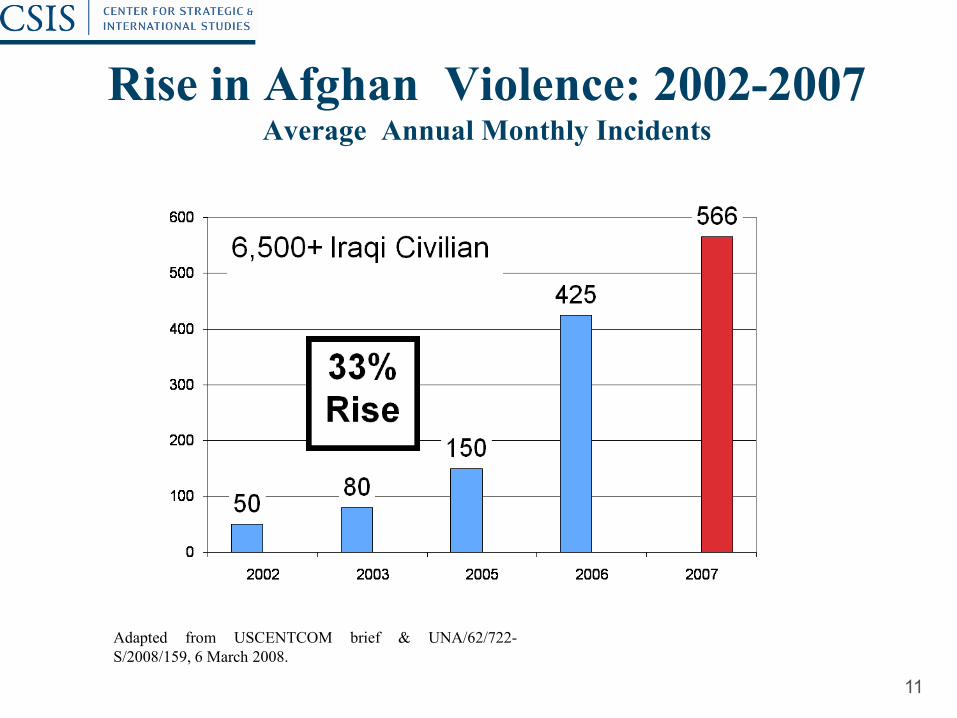
Various testimony and briefings show that the average monthly number of major incidents rose from only 50 in 2002 to 80 in 2003, 150 in 2005, 425 in
2006, and 566 in 2007. Suicide bombings rose from 1 in 2001 and 0 in 2002 to 2 in 2003, 6 in 2004, 21 in 2005, 123 in 2006, and 160 in 2007, and
reached just over 1200 by the end of the first six months of 2008. The number of IEDs and roadside bombs rose from 22 in 2002 to 83 in 2003, 325 in
2004, 782 in 205, 1,931 in 2006, and 2,615 in 2007, although the number of effective IED attacks remained low.
The number of attacks in the peak month in each year rose from 400 in 2005 to 800 in 2006 and 1,000 in 2007, and reach 1,000 in September 2008.
Attacks causing at least one death rose from 366 in 2005 to 695 in 2006 and 892 in 2007, and the number killed, injured, or kidnapped rose from 1540 in
2005 to 3,557 in 2006 and 4,672 in 2007. Peak monthly US casualties (killed and wounded) rose from less than 20 from 2002-2003 to the mid-30s in
2004, 70 in 2005 and 2006, and 130 in 2007.
These figures rose by roughly third between 2007 and 2008. As the NATO/ISAF figures attached to this analysis show. During 2008, there was a 33%
increase in kinetic events or military clashes, a 27% increase in indirect fire attacks, and a 67% increase in surface to air fire. The number of IED attacks –
the most serious source of casualties, rose by 26% to 27%. There was a 119% increase in the number of attacks on Government of Afghanistan personnel,
and 50% rise in kidnappings and assassinations. The number of suicide attacks dropped by 5%, but their lethality and skill increased and so did estimates
of the number of suicide bombers in training. The number of NATO/ISAF deaths rose by 35% and civilian deaths rose by 40-46%.
The situation deteriorated further in late 2008 and early 2009, in part because the weather permitted more Jihadist movement. Clashes and attacks in the
first two months of 2009 were twice the numbers as during the same period in 2008. They surged by 131% in the Eastern province of Kunar relative to
the same month in 2008, highlighting the growth of the threat in the east as well as in the south.i This situation continued to deteriorate in March. US
forces reported that "kinetic activity" in eastern Afghanistan increased by 68 percent this year compared to the same 80-or-so-day span last year. In the
two provinces bordering Pakistan's Waziristan provinces, violence involving Western troops is up 90 percent, and attacks rose by 130% in the area across
from the Mohmand and Bajaur tribal areas -- where the Pakistani military claimed the Taliban had "lost".
US and UN intelligence maps that were issued or leaked during 2005 to 2007, and more recent NATO/ISAF maps issued in January 2009, do show the
size of the high risk-areas inside Afghanistan have increased by 30% to 50% every year since 2005. Kabul is scarcely under siege, but it has turned from a
city where NATO/ISAF and aid personnel could wander as tourists to one so filled with violence that the US and foreign compounds have become the
equivalent of a “Green Zone.” There has been a particularly serious increase in violence in the Afghan-Pakistan border area. There were 431 insurgent
attacks in the Khyber border area during January-November 2007, and 625 during the same period in 2008 – an increase of 45%.ii
i Fisnik Abbashi, “Roadside Bomb Kills 4 Troops in Afghanistan,” Washington Post, March 16, 2009, p. A8.
ii Candace Rondeaux, “ US-Funded Intelligence Center Struggles in the Khyber Region,” Washington Post, January 12, 2008, p. A6.

Even these data understate the scale of the problem since they do not count all the Afghan on Afghan violence that does not attack
government officials and forces, and kidnappings, night letters, and Taliban attacks on Afghan civilians have spread to cover nearly
half of the country. The UN rates nearly half the country as unsafe for movement by aid workers not supported by troops, and security
has deteriorated sharply in Kabul, particularly in the last year. The level of violence, incidents, and casualties continues to rise, as does
the frequency and intensity of combat. A new threat has also developed to US and NATO/ISAF lines of supply, as well as imports
from Pakistan, during 2008. This is critical because at least 60% of all supplies come from ports in Pakistan across the border in the
Khyber and FATA areas.
While detailed NATO/ISAF and US maps that show the growth of Taliban, Hekmatyar, and Haqqani areas of influence are classified,
it is clear from unclassified briefings that these insurgent groups continue to expand their influence at the local level. Although they
are controversial, estimates by the International council on Security and Development (formerly the Senlis Council) indicate that the, i
“Taliban now holds a permanent presence in 72% of Afghanistan, up from 54% a year ago. Taliban forces have advanced from their southern
heartlands, where they are now the de facto governing power in a number of towns and villages, to Afghanistan’s western and north-western provinces,
as well as provinces north of Kabul. Within a year, the Taliban's permanent presence in the country has increased by a startling 18%. Three out of the
four main highways into Kabul are now compromised by Taliban activity. The capital city has plummeted to minimum levels of control, with the
Taliban and other criminal elements infiltrating the city at will.”
The increase in their geographic spread illustrates that the Taliban’s political, military and economic strategies are now more successful than the West’s
in Afghanistan. Confident in their expansion beyond the rural south, the Taliban is at the gates of the capital and infiltrating the city at will. Of the four
doors leading out of Kabul, three are now compromised by Taliban activity. The roads to the west, towards the Afghan National Ring Road through
Wardak to Kandahar have become unsafe for Afghan or international travel by the time travelers reach the entrance to Wardak province, which is about
thirty minutes from the city limits.
The road south to Logar is no longer safe for Afghan or international travel. The road east to Jalalabad is not safe for Afghan or international travel once
travelers reach the Sarobi Junction which is about an hour outside of the city. Of the two roads leaving the city to the north only one – the road towards
the Panjshir valley, Salang tunnel and Mazar – is considered safe for Afghan and international travel. The second road towards the north that leads to the
Bagram Air Base is frequently used by foreign and military convoys and subject to insurgent attacks.
By blocking the doors to the city in this way, the Taliban insurgents are closing a noose around the city and establishing bases close to the city from
which to launch attacks inside it. Using these bases, the Taliban and insurgent attacks in Kabul have increased dramatically – including kidnapping of
Afghans and foreigners, various bomb attacks and assassinations. This dynamic has created a fertile environment for criminal activity. The links
between the Taliban and criminals are increasing and the lines between the various violent actors becoming blurred. All of these Taliban successes are
forcing the Afghan government and the West to the negotiating table.

The Taliban are now dictating terms in Afghanistan, both politically and militarily. At the national level, talk of reconciliation and power sharing
between undefined moderate elements of the Taliban movement and elected government officials is commonplace. At a local level, the Taliban is
maneuvering skillfully to fill the governance void, frequently offering a mellower version of localized leadership than characterized their last stint in
power.
At the same time, the Afghan government remains absent or ineffective in much of the country, most foreign aid has no practical
impact on the security and stability of threatened areas, and the combination of US, NATO/ISAF, and Afghan security forces is far too
small to secure the countryside. Refugee problems and poverty are made worse by the problem of both personal and organized crime.
While narcotics output is down -- largely because of a saturated market and dropping street price as well as drought issues – it remains
a key part of the national economy and a force behind both crime and corruption.
These problems are compounded by the situation in Pakistan. The Pakistani Army and government have not provided reliable
reporting on military operations or a meaningful assessment of the growth of the threat inside Pakistan. Whatever the Pakistani
military may have been, the steady politicization of Pakistan’s military forces since Zia has left it largely an inept flatland army
steadily more focused on internal control and whose finances and use of outside aid have become progressively more suspect.
Few unclassified or reliable data are available on the expansion of Islamist extremist influence and control in the FATA (tribal areas)
along the Afghan-Pakistan border in the east, but it is clear that this region has become the center of Al Qa’ida operations.
Furthermore, it seems apparent that near sanctuaries exist for two increasingly independent centers of Taliban activity as well as the
Hekmatyar and Haqqani movements.
The Scope of the Analysis We Need
If we are to win this war, we need a far greater degree of transparency, and a recognition that the war is extremely complex, that it
cannot be solved by focusing on one element or country, and the use of information and metrics can be used both to show the need for
sacrifice and sustained effort, and to put pressure of those who do not perform, in ways that can offset any negative impacts for
disclosing such data to the enemy.
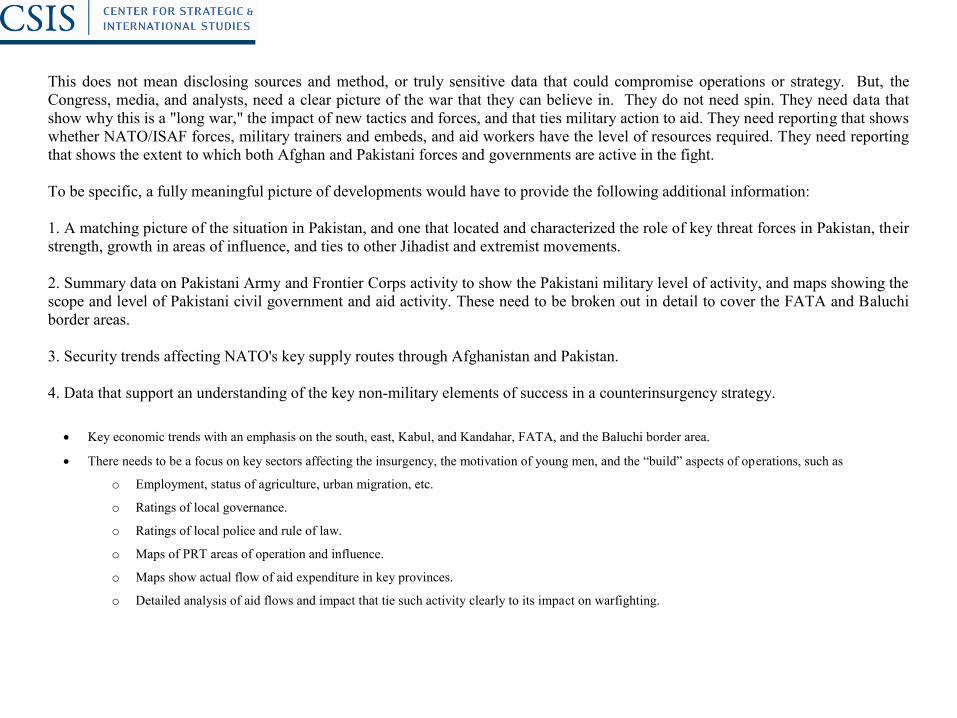
This does not mean disclosing sources and method, or truly sensitive data that could compromise operations or strategy. But, the
Congress, media, and analysts, need a clear picture of the war that they can believe in. They do not need spin. They need data that
show why this is a "long war," the impact of new tactics and forces, and that ties military action to aid. They need reporting that shows
whether NATO/ISAF forces, military trainers and embeds, and aid workers have the level of resources required. They need reporting
that shows the extent to which both Afghan and Pakistani forces and governments are active in the fight.
To be specific, a fully meaningful picture of developments would have to provide the following additional information:
1. A matching picture of the situation in Pakistan, and one that located and characterized the role of key threat forces in Pakistan, their
strength, growth in areas of influence, and ties to other Jihadist and extremist movements.
2. Summary data on Pakistani Army and Frontier Corps activity to show the Pakistani military level of activity, and maps showing the
scope and level of Pakistani civil government and aid activity. These need to be broken out in detail to cover the FATA and Baluchi
border areas.
3. Security trends affecting NATO's key supply routes through Afghanistan and Pakistan.
4. Data that support an understanding of the key non-military elements of success in a counterinsurgency strategy.
Key economic trends with an emphasis on the south, east, Kabul, and Kandahar, FATA, and the Baluchi border area.
There needs to be a focus on key sectors affecting the insurgency, the motivation of young men, and the “build” aspects of operations, such as
o Employment, status of agriculture, urban migration, etc.
o Ratings of local governance.
o Ratings of local police and rule of law.
o Maps of PRT areas of operation and influence.
o Maps show actual flow of aid expenditure in key provinces.
o Detailed analysis of aid flows and impact that tie such activity clearly to its impact on warfighting.

5. ANA and ANP charts that show force growth against force goals, and ANP readiness. Similar data need to be developed for the
Pakistani Frontier Corps and relevant elements of the Pakistani Army.
6. ANA and ANP, and Pakistani Frontier Corps and Pakistani Army, charts that show expanding areas of operation. These maps
should show how ANSF forces are expanding their areas of operation and serve as metrics of operational success in giving "win" and
"hold" an Afghan face. The same is needed for Pakistani forces.
7. Breakouts that show similar data in more detail for the East and South and that show activity in both Afghanistan and Pakistan
relative to maps of location of the insurgent groups.
8. Data that show the threat in non-kinetic terms, that characterize each key element separately -- including the role of Al Qa'ida and
foreign volunteers – as it exists and operates in both Afghanistan and Pakistan:
Descriptions of activity, ideology, estimated force size, and objectives by individual movement and that define and characterize the threat.
Divisions in the Taliban by area of operation should be clearly shown and characterized. The same is needed for the Hekmatyar and Haqqani groups.
A detailed section is needed on Al Qa'ida and foreign volunteers to highlight the continuing threat of international terrorism and regional impacts.
Maps that counterbalance the UN maps and show the area and level of Jihadist influence in Afghanistan and Pakistan by district and how they have
expanded and contracted since 2005. Detailed breakouts should be provided for the East and South
Maps that show areas where Jihadists conduct operations against the local population – including breakouts of activity in addition to casualties that cover
night letters, killings of tribal leaders, kidnappings, and the broader patterns of Jihadist violence.
A summary analysis and mapping of levels of activity and influence in key cities like Kabul and Kandahar.
Maps and charts by Jihadist element show growth in areas of influence and operation, breaking Kinetic activity out by movement, and describing goals
and methods. These data should clearly cover both Afghanistan and Pakistan.
Summary maps and metrics that cover crime and narcotics and show the overlap – if any – with Jihadist activity.
Polling of Afghan and Pakistani attitudes towards Jihadist movement by movement, activity, and location – including negative and positive reactions.

9. An analysis of NATO air and UCAV strikes that shows levels of fixed and rotary wing activity, estimated casualty effects, and ties
strikes clearly to levels of success in striking at Taliban and other Jihadist cadres. NATO/ISAF need to explain and justify the air
dimension of the war. I'd also add a summary slide here showing how the US and NATO/ISAF screen attack requests and the level of
restraint and care in rules of engagement (ROEs).
10. Summary reporting on which elements of NATO are actually in the fight:
Measures of activity by NATO/ISAF country in the field
Data on the growth of forces, aid workers, and aid by country; and
Maps of PRT areas of operation versus PRT location.
Open reporting of member country caveats and problems in using national forces effectively, and of limits to aid and PRT activity that keep such activity
too local and limited to be effective.
Polling of Afghan and Pakistani attitudes towards US, NATO/ISAF, Afghan government, and Pakistani government activity – including negative
reactions to the use of force.
11. Analysis of aid efforts that clearly recognizes the fact that this is armed nation building during a state of war, and not post-conflict
reconstruction. Like every other aspect of counterinsurgency, aid and development “is local.” It either supports a “win, hold, build”
strategy or it doesn’t.
Maps that show what level of aid actually reaches into key threat and high-risk areas, which provides, and estimated effect.
Reporting that focuses almost exclusively on auditing how aid is spent by function and location with measures of effectiveness clearly tie to “win, hold,
build” impact.
Polling of Afghan and Pakistani attitudes towards aid activity – including negative reactions to the use of force.
Summary analysis of aid activity by country, NGO, and UN element that rates effectiveness, actual flow of money into activity in country, and that
separately names groups and individuals believed to be ineffective or corrupt.

12. Open analysis of the success or failure of key elements of Afghan and Pakistani government activity that puts direct pressure on
both governments to act, eliminate the corrupt and inept, use aid honestly and effectively, avoid ties to narcotics, and avoid covert
links to Jihadist forces like those of the Pakistani ISI.
Maps that show what level of government actually reaches into key threat and high-risk areas, which provides, and estimated effect.
Reporting that focuses almost exclusively on auditing how aid is spent by function and location with measures of effectiveness clearly tie to “win, hold,
build” impact.
Polling of Afghan and Pakistani attitudes towards, Afghan government, and Pakistani government activity.
Summary analysis of activity by province and high threat or key that rates effectiveness, actual flow of money into activity in country, and that separately
names groups and individuals believed to be ineffective or corrupt.

10
UN Estimate of Expanding No Go Zones:
2005 versus 2007
SenlisAfghanistan, Decision Point 2008, London, 2008, p. 27;
11
Rise in Afghan Violence: 2002-2007 Average Annual Monthly Incidents
Adapted from USCENTCOM brief & UNA/62/722-
S/2008/159, 6 March 2008.
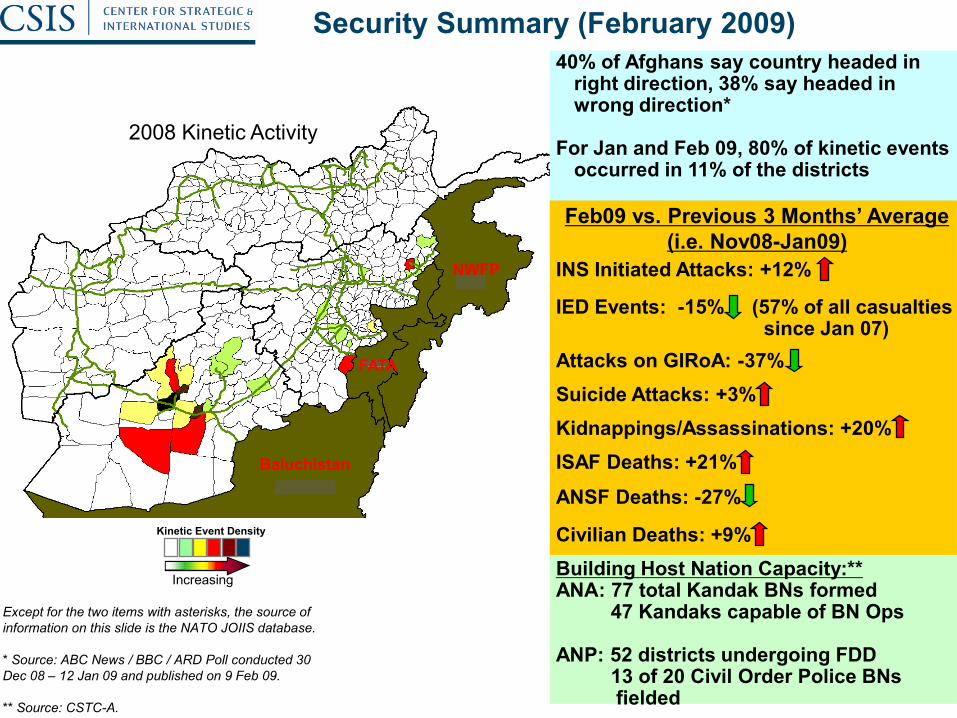
40% of Afghans say country headed in right direction, 38% say headed in wrong direction*
For Jan and Feb 09, 80% of kinetic events occurred in 11% of the districts
Feb09 vs. Previous 3 Months’ Average
(i.e. Nov08-Jan09)
INS Initiated Attacks: +12%
IED Events: -15% (57% of all casualties since Jan 07)
Attacks on GIRoA: -37%
Suicide Attacks: +3%
Kidnappings/Assassinations: +20%
ISAF Deaths: +21%
ANSF Deaths: -27%
Civilian Deaths: +9%
Building Host Nation Capacity:**ANA: 77 total Kandak BNs formed
47 Kandaks capable of BN Ops
ANP: 52 districts undergoing FDD13 of 20 Civil Order Police BNs fielded
Kinetic Event Density
Increasing
Security Summary (February 2009)
Baluchistan
NWFP
FATA
2008 Kinetic Activity
Except for the two items with asterisks, the source of
information on this slide is the NATO JOIIS database.
* Source: ABC News / BBC / ARD Poll conducted 30
Dec 08 – 12 Jan 09 and published on 9 Feb 09.
** Source: CSTC-A.

13Senlis, “Stumbling into Chaos, Afghanistan on the Brink, November 2007, p. 8.”

Taliban Presence in November 2008
Source: ICOS, The Struggle for Kabul: The Taliban Advance,” December 2008, p.9.

0 – 24%
25-50%
51-75%
* Word used in Dari & Pashto to encompass all AGEs
77% 74%
10% 7%
Percent in province
responding AGE
has more influence
Source: MRA, ANQAR 2.0, Dec 08
77%
56%
68%
14%
27%
17%
10%17% 15%
0%
25%
50%
75%
100%
Apr-08 Jul-08 Sep-08
Taliban/AGE
Neither/Don't Know
GIRoA
Down arrow indicates more
AGE influence relative to
last survey
“Between the Anti-Government Elements (AGE)* and the Government, who has more influence in your area?"
77%
56%
68%62%
14%
27%
17%
19%
10%17% 15% 19%
0%
25%
50%
75%
100%
Apr-08 Jul-08 Sep-08 Dec-08
Day Kundi not sampled due to extremely poor security & high risk
Up arrow indicates less
AGE influence relative to
last survey
Insurgency vs. GIRoA Influence

.0
10.0
20.0
30.0
40.0
50.0
60.0
70.0
80.0
90.0
100.0
1Source: ANQAR 2.0, Dec 08
Are you satisfied or
dissatisfied with the
provision of roads?
Nationwide Results
26.5%
27.9%
15.2%
18.1%
11.7%
Don’t Know / NA
Very dissatisfied
Somewhat dissatisfied
Neither
Somewhat satisfied
Very satisfied
Completed
To be complete
by Mar 09
To be complete
by Mar 10
To be complete
after Mar 10
Unknown
Transportation Infrastructure
570 km of regional highways were constructed
or rehabilitated with asphalt in 2008Source: USAID, 28 Feb 09
No events
Low
Medium
High
Events Density
(400km2)
Significant
No events
Low
Medium
High
Events Density
(400km2)
Significant
Attacks on Freedom of Movement
(within 500m of ISAF Routes)
0
5
10
15
20
25
30
35
40
45
50
Jan
07
Feb Mar Apr May Jun Jul Aug Sep Oct Nov Dec Jan
08
Feb Mar Apr May Jun Jul Aug Sep Oct Nov Dec Jan
09
Feb
Comparing Feb 09 to the previous 3 months (Nov
08 – Jan 09), attacks on convoys are down 53%
13 Sep ISAF
FRAGO MSR
Security
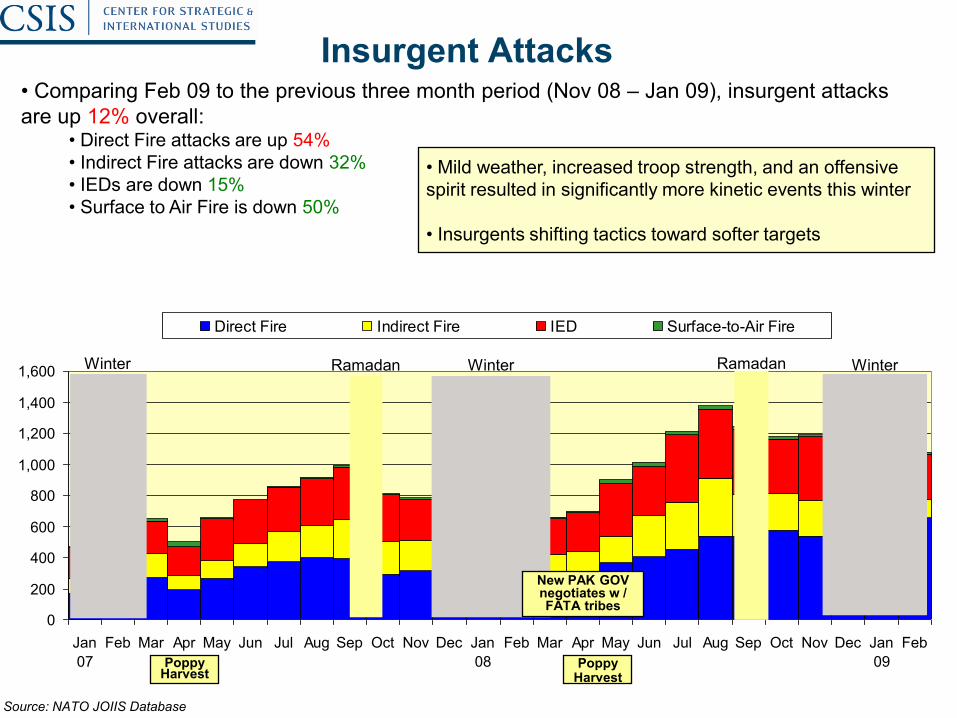
• Comparing Feb 09 to the previous three month period (Nov 08 – Jan 09), insurgent attacks
are up 12% overall:• Direct Fire attacks are up 54%
• Indirect Fire attacks are down 32%
• IEDs are down 15%
• Surface to Air Fire is down 50%
0
200
400
600
800
1,000
1,200
1,400
1,600
Jan
07
Feb Mar Apr May Jun Jul Aug Sep Oct Nov Dec Jan
08
Feb Mar Apr May Jun Jul Aug Sep Oct Nov Dec Jan
09
Feb
Direct Fire Indirect Fire IED Surface-to-Air Fire
PoppyHarvest
Winter
PoppyHarvest
New PAK GOVnegotiates w /FATA tribes
WinterWinter Ramadan Ramadan
Insurgent Attacks
• Mild weather, increased troop strength, and an offensive
spirit resulted in significantly more kinetic events this winter
• Insurgents shifting tactics toward softer targets
Source: NATO JOIIS Database

0
50
100
150
200
250
300
350
400
450
500
Jan
07
Feb Mar Apr May Jun Jul Aug Sep Oct Nov Dec Jan
08
Feb Mar Apr May Jun Jul Aug Sep Oct Nov Dec Jan
09
Feb
ISAF Finds ANSF Finds Turn-Ins Detonations
• Comparing Feb 09 to the previous three month period (Nov 08 – Jan 09):
• Total IED events were down 15%
• Total casualties from IED events were down 26% (for ISAF, IED casualties down 45%)
• For the 3-month period ending Feb 09 relative to the same period ending Feb 08,
discoveries (IED finds by ISAF / ANSF plus turn-ins by local nationals) were up 66%
• Since January 2007, discoveries account for 52% of all IED events
IED Events (Found and Detonated)
Source: NATO JOIIS Database UNCLASS // REL USA ISAF NATO
0
50
100
150
200
250
Jan
07
Feb Mar Apr May Jun Jul
07
Aug Sep Oct Nov Dec Jan
08
Feb Mar Apr May Jun Jul
08
Aug Sep Oct Nov Dec Jan
09
Feb
ISAF/OEF Responsible Insurgent Responsible
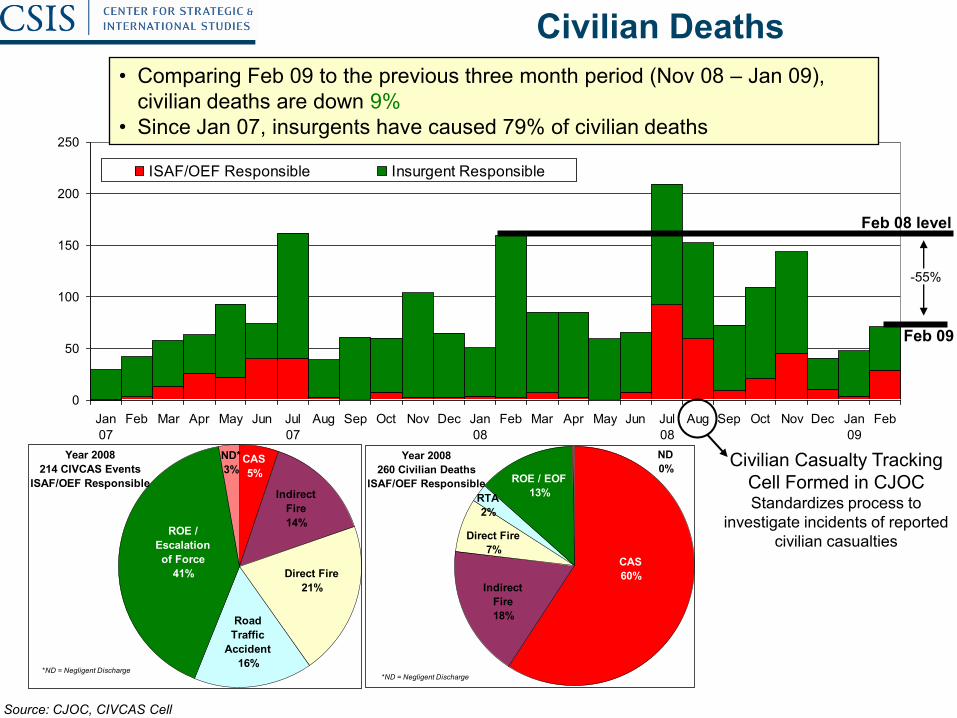
Civilian Deaths • Comparing Feb 09 to the previous three month period (Nov 08 – Jan 09),
civilian deaths are down 9%
• Since Jan 07, insurgents have caused 79% of civilian deaths
Civilian Casualty Tracking
Cell Formed in CJOCStandardizes process to
investigate incidents of reported
civilian casualties
Year 2008
214 CIVCAS Events
ISAF/OEF Responsible
ND*
3%CAS
5%
Road
Traffic
Accident
16%
Indirect
Fire
14%
Direct Fire
21%
ROE /
Escalation
of Force
41%
*ND = Negligent Discharge
Year 2008
260 Civilian Deaths
ISAF/OEF Responsible
ND
0%
CAS
60%
ROE / EOF
13%RTA
2%
Direct Fire
7%
Indirect
Fire
18%
*ND = Negligent Discharge
Source: CJOC, CIVCAS Cell
Feb 08 level
-55%
Feb 09
Civilian Deaths

*Attributed to insurgent initiated attacks (direct fire, indirect fire, IEDs, and surface-to-air fire)
Military Deaths*
Source: NATO JOIIS Database
• Comparing Feb 09 to the previous 3 month period (Nov 08 – Jan 09) :
• Total military deaths are down 21%
• ANSF deaths are down 29% (though ANA deaths are up 21%)
• ISAF deaths are up 21%
0
25
50
75
100
125
150
175
200
Jan
07
Feb Mar Apr May June Jul Aug Sep Oct Nov Dec Jan
08
Feb Mar Apr May June Jul Aug Sep Oct Nov Dec Jan
09
Feb
ISAF ANA ANP
0%
10%
20%
30%
40%
50%
60%
70%
80%
90%
100%
Jan
07
Feb Mar Apr May Jun Jul 07 Aug Sep Oct Nov Dec Jan
08
Feb Mar Apr May Jun Jul 08 Aug Sep Oct Nov Dec Jan
09
Feb
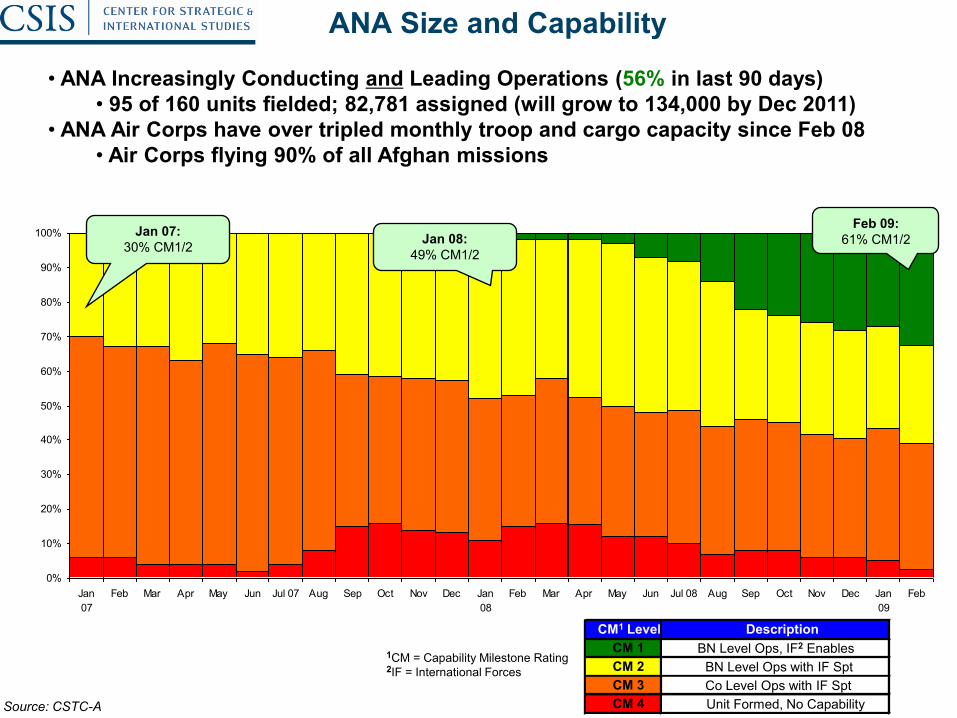
• ANA Increasingly Conducting and Leading Operations (56% in last 90 days)
• 95 of 160 units fielded; 82,781 assigned (will grow to 134,000 by Dec 2011)
• ANA Air Corps have over tripled monthly troop and cargo capacity since Feb 08
• Air Corps flying 90% of all Afghan missions
CM1 Level Description
CM 1 BN Level Ops, IF2 Enables
CM 2 BN Level Ops with IF Spt
CM 3 Co Level Ops with IF Spt
CM 4 Unit Formed, No Capability
Feb 09:
61% CM1/2Jan 08:
49% CM1/2
Jan 07:
30% CM1/2
1CM = Capability Milestone Rating2IF = International Forces
Source: CSTC-A
ANA Size and Capability
0
5000
10000
15000
20000
25000
30000
35000
40000
1
Day Kundi not sampled due to extremely poor security & high risk
*rating good
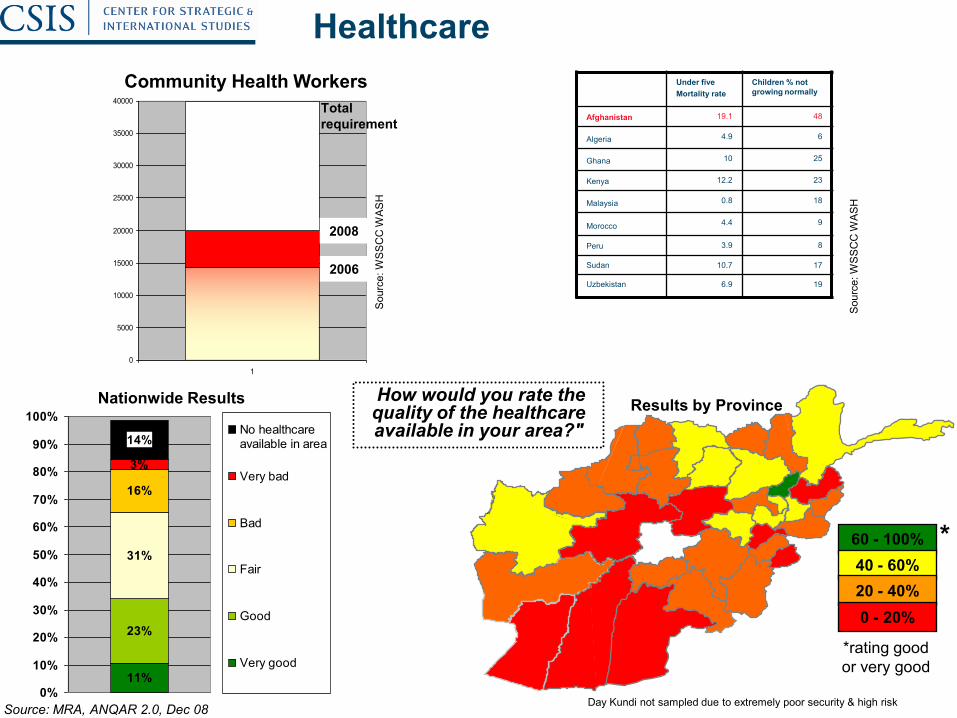
or very good11%
23%
31%
16%
3%
14%
0%
10%
20%
30%
40%
50%
60%
70%
80%
90%
100%No healthcareavailable in area
Very bad
Bad
Fair
Good
Very good
Source: MRA, ANQAR 2.0, Dec 08
How would you rate the quality of the healthcare available in your area?"
60 - 100%
40 - 60%
20 - 40%
0 - 20%
*
Community Health Workers
Total
requirement
2006
2008
Under five
Mortality rate
Children % not
growing normally
Afghanistan 19.1 48
Algeria 4.9 6
Ghana 10 25
Kenya 12.2 23
Malaysia 0.8 18
Morocco 4.4 9
Peru 3.9 8
Sudan 10.7 17
Uzbekistan 6.9 19
Nationwide Results Results by Province
Sourc
e: W
SS
CC
WA
SH
Healthcare
Sourc
e: W
SS
CC
WA
SH
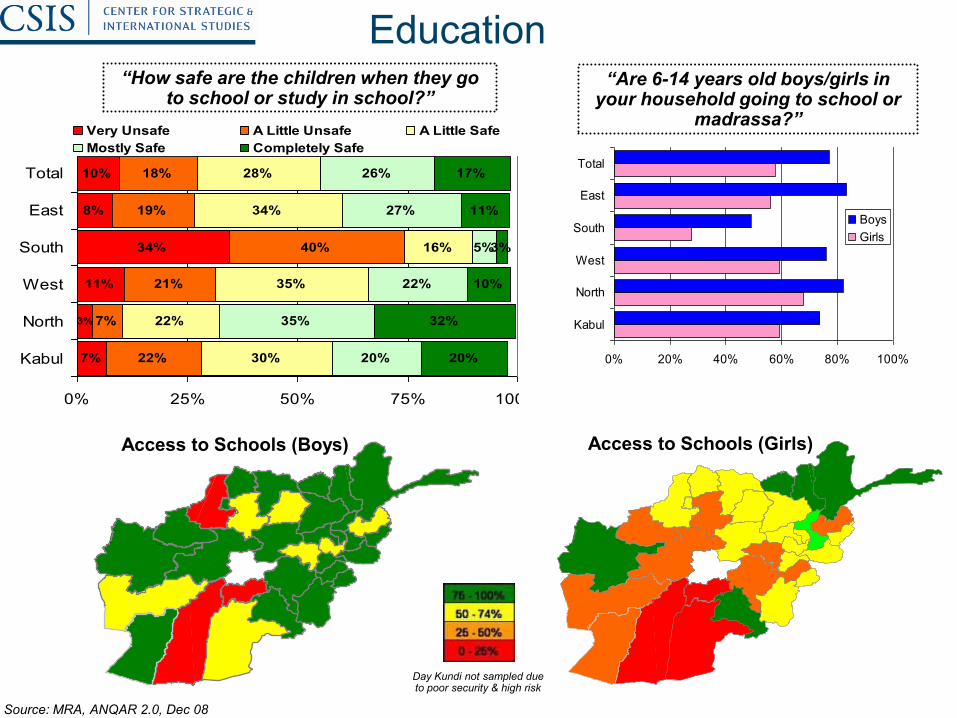
7%
11%
34%
8%
10%
22%
7%
21%
40%
19%
18%
30%
22%
35%
16%
34%
28%
20%
35%
22%
5%
27%
26%
20%
32%
10%
3%
11%
3%
17%
0% 25% 50% 75% 100%
Kabul
North
West
South
East
Total
Very Unsafe A Little Unsafe A Little Safe
Mostly Safe Completely Safe
Education“Are 6-14 years old boys/girls in
your household going to school or madrassa?”
Access to Schools (Girls)Access to Schools (Boys)
“How safe are the children when they go to school or study in school?”
0% 20% 40% 60% 80% 100%
Kabul
North
West
South
East
Total
Boys
Girls
Day Kundi not sampled due to poor security & high risk
Source: MRA, ANQAR 2.0, Dec 08