The Affect Of Sales Promotion On Consumer Interest … Papers () Journal of Knowledge Management,...
17
Scientific Papers (www.scientificpapers.org) Journal of Knowledge Management, Economics and Information Technology 1 Issue 4 June 2011 The Affect Of Sales Promotion On Consumer Interest To Purchase In IKCO Automotive Company Author: Shahriar Ansari CHAHARSOUGHI, Jamia Hamdard University, New Delhi, India, [email protected] Sales promotion has become a vital tool for marketing and its importance has been increasing significantly over the years. One of the purposes of a sales promotion is to elicit a direct impact on the purchase behavior of the firm’s consumers. Firms have to rethink the relationship between attitude and behavior of their consumers. Sales promotions are highly affective in exposing consumers to products for the first time and can serve as key promotional components in the early stages of new product presentation. The purpose of this paper is to study of the affect of sales promotion on consumer interest to purchase products of IKCO automotive company as well as Performance of sales promotion in introducing of new product to consumer is studied. Keywords: sales promotion, consumer interest, IKCO, automobile, new product JEL Classification: M51, D11, L15 All businesses need to communicate to the consumer what they have to offer. (Jobber&Lancaster, 2006). Dwyer & Tanner (2006) states that Business consumers are larger than individual consumers; meaning that each 4
Transcript of The Affect Of Sales Promotion On Consumer Interest … Papers () Journal of Knowledge Management,...
Scientific Papers (www.scientificpapers.org) Journal of Knowledge Management, Economics and Information Technology
1
Issue 4 June 2011
The Affect Of Sales Promotion On
Consumer Interest To Purchase In IKCO
Automotive Company
Author: Shahriar Ansari CHAHARSOUGHI, Jamia Hamdard
University, New Delhi, India, [email protected]
Sales promotion has become a vital tool for marketing and its importance has
been increasing significantly over the years. One of the purposes of a sales
promotion is to elicit a direct impact on the purchase behavior of the firm’s
consumers. Firms have to rethink the relationship between attitude and
behavior of their consumers.
Sales promotions are highly affective in exposing consumers to
products for the first time and can serve as key promotional components in
the early stages of new product presentation. The purpose of this paper is to
study of the affect of sales promotion on consumer interest to purchase
products of IKCO automotive company as well as Performance of sales
promotion in introducing of new product to consumer is studied.
Keywords: sales promotion, consumer interest, IKCO, automobile, new
product
JEL Classification: M51, D11, L15
All businesses need to communicate to the consumer what they have to
offer. (Jobber&Lancaster, 2006). Dwyer & Tanner (2006) states that Business
consumers are larger than individual consumers; meaning that each
4

Scientific Papers (www.scientificpapers.org) Journal of Knowledge Management, Economics and Information Technology
2
Issue 4 June 2011
business consumers is more important to the economic situation of the
business marketers company. There are also fewer business consumers, so
each business consumer is also more important to the economical situation
of the company; unhappy consumers can affect the business marketers
business in a noteworthy way. Shultz, et al. (1998) says that sales promotion
generally works on a direct behavioral basis rather than affect ing awareness
or attitude. It is continuously said that most types of sales promotions affect
the decision-making and purchasing stages of the buying-process directly
that is affective in the long-run since it leads to increased sales and profit.
(Kwok & Uncles, 2005)
The Main of purpose of this paper is study of affect of sales
promotion on consumer interest to purchase products of IKCO automotive
company as well as Performance of sales promotion in introducing of new
product to consumer is studied. Based on purpose of this study the following
research question are stated:
Q1: Do Introducing IKCO's Products Through Sales Promotion attract
Consumer interest to purchase?
Q2: Do the methods used in the sales promotion of IKCO attract viewers'
interest to purchase?
Q3: Do the music used in IKCO's sales promotion attracts viewer's interest
to purchase?
Q4: Do sales promotion make consumer aware of new products of
company?
Q5: Do sales promotion provoke consumer to purchase of products of
company?
Q6: Do the content of sales promotion has attracted consumer interest to
purchase?
Q7: Do the advertisement slogan at the sales promotion attracts consumer’s
interest to purchase?
In this paper sales promotion in automotive industry of Iran have
been selected because: (1) it is a very service intensive industry; (2) its
services involve sales promotion; (3) it is an emerging and fast growing
service sector; (4) consumers are very sensible to sales promotion.
Scientific Papers (www.scientificpapers.org) Journal of Knowledge Management, Economics and Information Technology
3
Issue 4 June 2011
Literature Review
Nature of Sales Promotion
Promotion is one of the key factors in the marketing mix and has a
key role in market success. Promotion is used to ensure that consumers are
aware of the products that the organization is offering. The promotional mix
is the combination of the different channels that can be used to
communicate the promotional message to the consumers. The channels to
be used are; advertising, direct marketing, public relations and publicity,
personal selling, sponsorship and sales promotion (Rowley, 1998). One of
most important of channels is sales promotion. Sales promotion is action-
focused marketing events whose purpose is to have a direct impact on the
behavior of the firm’s consumers. There are three major types of sales
promotion: consumer promotion, retailer promotion, and trade promotion.
Consumer promotions are promotions offered by manufacturer
directly to consumers (Blattberg and Neslin 1990). Throughout the world,
sales promotion offered to consumers are an integral part of the marketing
mix for many consumer products (Huff and Alden 1998, Chandon et al.
2000). Studies that strive to understand the impact of sales promotion on
consumers are very important. Thus, sales promotion tools are amply
employed by retailers and manufacturers to achieve their commercial
objectives in terms of sales volumes, market share, category penetration, and
so forth.
According to Low & Mohr (2000) manufacturers continue to spend
a large amount from their communication budget on sales promotion. They
allocate around 75 percent of their marketing communication budgets to
sales promotion.(Hellman, 2005) In order to develop a successful sales
promotion strategy a clear definition of the targeted market must be
included. It is important to note that the character of sales promotion has
been changing slightly over time, with the arising of relationship marketing.
Sales promotion, like other traditional forms of marketing activities, have
been about mass offer (Mitchell, H., 2000).
Scientific Papers (www.scientificpapers.org) Journal of Knowledge Management, Economics and Information Technology
4
Issue 4 June 2011
Definition for sales promotion
(Brassington and Pettitt 2000, p. 643) provide a revised definition for sales
promotions: “… a range of marketing techniques designed within a strategic
marketing framework to add extra value to a product or service over and
above the ‘normal’ offering in order to achieve specific sales and marketing
objectives. This extra value may be a short-term tactical nature or it may be
part of a longer-term franchise-building program.”
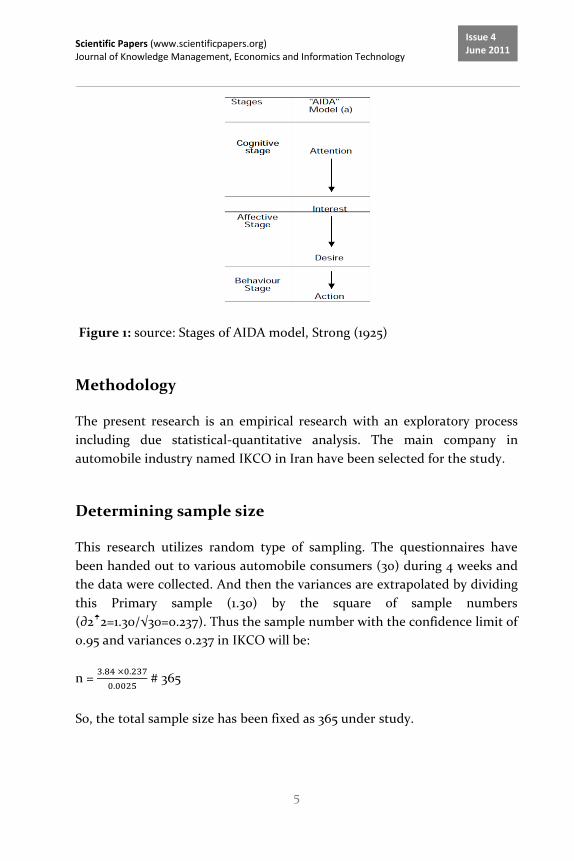
AIDA Model
Marketing today is fiercely competitive and products despite having quality
need support from promotional team of the organization. AIDA however is
an acronym to sales promotion that is necessary to learn in marketing.
Using a system like this, allows a general understanding of how to target a
market affectively. Moving step by step, AIDA model aims to affectively
influence the consumers. It proposes combination of promotional tools that
help drawing consumer’s interest and generate interest. This process is
shown as “AIDA Inverted Triangle” (figure 1). This includes the four stages
of:
1. Attention– where the consumer becomes aware of the product.
2. Interest – where an interest in the product develops.
3. Desire – Where the consumer has developed a sense of wanting the
product.
4. Action – where a purchase is made (Strong, 1925).
Scientific Papers (www.scientificpapers.org) Journal of Knowledge Management, Economics and Information Technology
5
Issue 4 June 2011
Figure 1: source: Stages of AIDA model, Strong (1925)
Methodology
The present research is an empirical research with an exploratory process
including due statistical-quantitative analysis. The main company in
automobile industry named IKCO in Iran have been selected for the study.
Determining sample size
This research utilizes random type of sampling. The questionnaires have
been handed out to various automobile consumers (30) during 4 weeks and
the data were collected. And then the variances are extrapolated by dividing
this Primary sample (1.30) by the square of sample numbers
(∂2ꜛ2=1.30/√30=0.237). Thus the sample number with the confidence limit of
0.95 and variances 0.237 in IKCO will be:
n =
# 365
So, the total sample size has been fixed as 365 under study.
Scientific Papers (www.scientificpapers.org) Journal of Knowledge Management, Economics and Information Technology
6
Issue 4 June 2011
Research Variables
In this study, sales promotions are the independent variable and consumers'
interest of purchasing are dependent variables. The intervening variables
like consumers' mood, situation, and others' opinions are held constant.
Data Collection
Data collection procedure consists of two parts, primary and secondary data.
Such data has been collected through questionnaires. Writing the
questionnaire was a time-consuming process. It went through several stages
of modifications after getting feedback from preliminary questionnaires in
order to be in line with the aims of the present research. This questionnaire
contains personal information of consumers and other common questions
related to the study. Also the ordering of questions has been done according
to the criteria found in research literature such as clarity of questions,
avoiding hard-to-understand questions at the beginning, avoiding similar
choices in a line, etc. This questionnaire has the Likert scale and the
questions as far as possible addressed hypotheses of the study. It consists of
seven items, Items 1-7 are to confirm or reject the first to seventh hypothesis
respectively, so that answers to these questions will help the author to reach
a conclusion on the hypothesis. It should be noted that the questions are
opinion-based which seek to find out viewpoints, opinions and perceptions
of respondents.
Questionnaire Validity and Reliability
Seif (2006) argues that validity is “an assessment of the sufficiency and
appropriacy of interpretations and usage of assessment results”. It is
considered as the similarity between the test performance and the criterion
performance. So, the first pretest is given after the draft questionnaire is
written in order to eliminate the possible mistakes; the second pre-test is
given after the questionnaire is finalized. The questionnaire will be ready to
be handed out to consumers. It has been distributed to IKCO consumers
and the related expert to mark out the flaws in the questionnaire. Then, its
finalized version was given to consumers to be filled out.

Scientific Papers (www.scientificpapers.org) Journal of Knowledge Management, Economics and Information Technology
7
Issue 4 June 2011
So, in this study used Cronbach's Alpha to measure the
questionnaire reliability. The reliability coefficient is measured from 0 to 1
with 0 denoting no reliability and 1 denoting total reliability. The Cronbach's
alpha of the questionnaire is calculated by software as 0.859.
Questionnaire Scale
Likert scale is the most popular one used in research questionnaires.
Participants are asked to show their opinion by choosing from 1 to 5. Likert
scale is composed of a number of questions and choices, so it is considered
as a compound scale. The choices reflect your agreement or disagreement
with a particular concept. In other words, we are able to reveal the
participants emotions, attitudes, beliefs, or points of view, because they
show their positive or negative emotion toward a concept by selecting a
choice best representing their feelings (Likert,1932).
Hypothesis:
While conducting research, the researcher had following hypotheses:
H1: Introducing IKCO's Products Through Sales Promotion Attracts
Consumers' attention to purchase.
H2: The Methods used in the sales promotion of IKCO attract viewers'
interest to purchase.
H3: The music used in IKCO's sales promotion attracts viewer's interest to
purchase.
H4: Sales promotion makes consumer aware of IKCO's new products.
H5: IKCO's sales promotion provoke consumer to purchase the products.
H6: The content of IKCO's sales promotion has attracted consumer interest.
H7: The advertisement slogan in IKCO’s sales promotion attracts consumer’s
interest to purchase.
Data Analysis
The data gathered through questionnaires have been analyzed by descriptive
statistics instruments such as frequency distribution and diagrams. The

Scientific Papers (www.scientificpapers.org) Journal of Knowledge Management, Economics and Information Technology
8
Issue 4 June 2011
hypotheses have also been tested one by one by the T-Test and SPSS
software. This section deals with how the data are analyzed by SPSS software
program in order to test the hypotheses. First the ethnographical
characteristics of participants and their responses are demonstrated, then
the hypotheses are tested.
Participants Demography
Table 1: Frequency Distribution of respondents according to their sex
Cumulative
Percentage
Cumulative
Frequency Percentage Frequency
42 153 42 153 Female
99 362 57 209 Male
100 365 01 3 Unknown
100 365 Total
Participants' Educational Qualifications
Table 2: Frequency Distribution of respondents according to their education
Cumulative
Percentage
Cumulative
Frequency Percentage Frequency
06 21 06 21
High
school
36 130 30 109 Diploma
86 313 50 183
College &
Bachelor’s
Scientific Papers (www.scientificpapers.org) Journal of Knowledge Management, Economics and Information Technology
9
Issue 4 June 2011
98 356 12 43
Master’s
& PhD
100 365 02 9 Unknown
100 365 Total
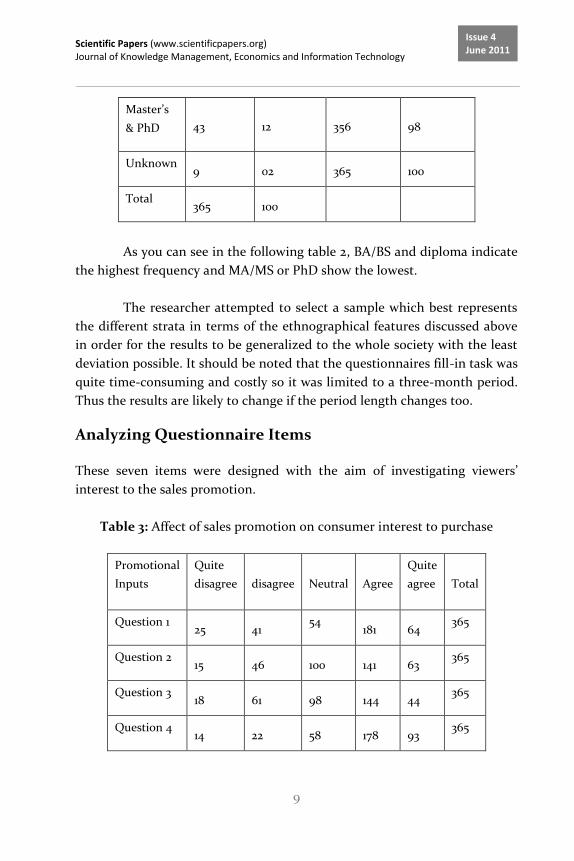
As you can see in the following table 2, BA/BS and diploma indicate
the highest frequency and MA/MS or PhD show the lowest.
The researcher attempted to select a sample which best represents
the different strata in terms of the ethnographical features discussed above
in order for the results to be generalized to the whole society with the least
deviation possible. It should be noted that the questionnaires fill-in task was
quite time-consuming and costly so it was limited to a three-month period.
Thus the results are likely to change if the period length changes too.
Analyzing Questionnaire Items
These seven items were designed with the aim of investigating viewers’
interest to the sales promotion.
Table 3: Affect of sales promotion on consumer interest to purchase
Promotional
Inputs
Quite
disagree
disagree
Neutral
Agree
Quite
agree
Total
Question 1 25 41
54 181 64
365
Question 2 15 46 100 141 63
365
Question 3 18 61 98 144 44
365
Question 4 14 22 58 178 93
365
Scientific Papers (www.scientificpapers.org) Journal of Knowledge Management, Economics and Information Technology
10
Issue 4 June 2011
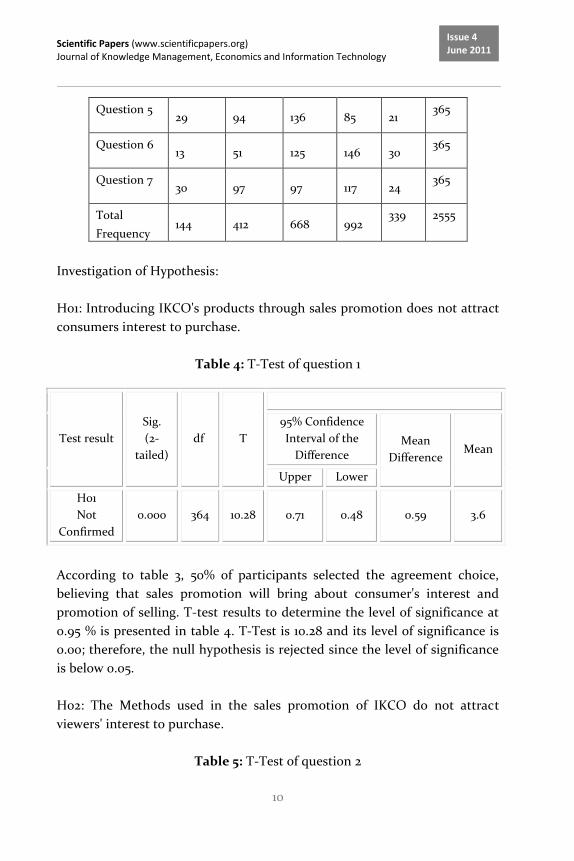
Question 5 29 94 136 85 21
365
Question 6 13 51 125 146 30
365
Question 7 30 97 97 117 24
365
Total
Frequency 144 412 668 992
339 2555
Investigation of Hypothesis:
H01: Introducing IKCO's products through sales promotion does not attract
consumers interest to purchase.
Table 4: T-Test of question 1
df T
Sig.
(2-
tailed)
Test result Mean
Mean
Difference
95% Confidence
Interval of the
Difference
Lower Upper
3.6 0.59 0.48 0.71 10.28 364 0.000
H01
Not
Confirmed
According to table 3, 50% of participants selected the agreement choice,
believing that sales promotion will bring about consumer's interest and
promotion of selling. T-test results to determine the level of significance at
0.95 % is presented in table 4. T-Test is 10.28 and its level of significance is
0.00; therefore, the null hypothesis is rejected since the level of significance
is below 0.05.
H02: The Methods used in the sales promotion of IKCO do not attract
viewers' interest to purchase.
Table 5: T-Test of question 2

Scientific Papers (www.scientificpapers.org) Journal of Knowledge Management, Economics and Information Technology
11
Issue 4 June 2011
df TSig. (2-
tailed) Test result
Mean Mean
Difference
95% Confidence
Interval of the
Difference
Lower Upper
3.52 0.52 0.42 0.63 9.54 364 0.000
H02
Not
Confirmed
According to the table 3, 39% of participants selected the agreement choice
and 17% selected the complete agreement choice, believing that the
Methods used in the sales promotion of IKCO attract people's interest. T-
test results to determine the level of significance at 0.95% is presented in
table 5. T-Test is 9.54 and its level of significance is 0.00; therefore, the null
hypothesis is rejected since the level of significance is below 0.05.
H03: The music used in IKCO's sales promotion does not attract viewer's
interest.
Table 6: T-Test of question 3
df TSig. (2-
tailed)
Test
result Mean Mean
Difference
95% Confidence
Interval of the
Difference
Lower Upper
.3.3 73.3 73.0 73.0 0336 .0. 73777
H03
Not
Confirmed
According to table 3, 39% of participants selected the agreement
choice, and 12 % selected the complete agreement choice, believing that the
music in sales promotions will bring about consumer's interest. T-test
results to determine the level of significance at 0.95 % is presented in table
6. T-Test is 6.71 and its level of significance is 0.00; therefore, the null
hypothesis is rejected since the level of significance is below 0.05.
Scientific Papers (www.scientificpapers.org) Journal of Knowledge Management, Economics and Information Technology
12
Issue 4 June 2011
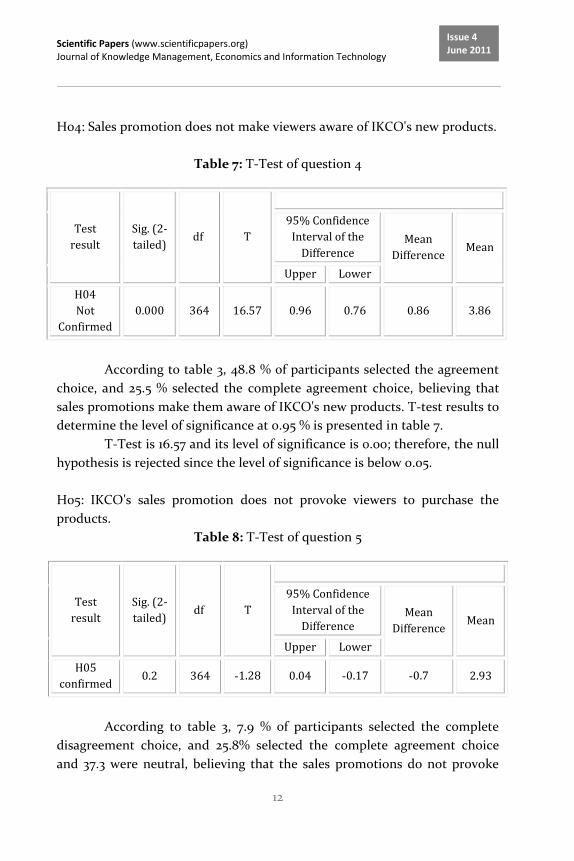
H04: Sales promotion does not make viewers aware of IKCO's new products.
Table 7: T-Test of question 4
df TSig. (2-
tailed)
Test
result Mean Mean
Difference
95% Confidence
Interval of the
Difference
Lower Upper
.300 7300 7330 73.0 60363 .0. 73777
H04
Not
Confirmed
According to table 3, 48.8 % of participants selected the agreement
choice, and 25.5 % selected the complete agreement choice, believing that
sales promotions make them aware of IKCO's new products. T-test results to
determine the level of significance at 0.95 % is presented in table 7.
T-Test is 16.57 and its level of significance is 0.00; therefore, the null
hypothesis is rejected since the level of significance is below 0.05.
H05: IKCO's sales promotion does not provoke viewers to purchase the
products.
Table 8: T-Test of question 5
df TSig. (2-
tailed)
Test
result Mean Mean
Difference
95% Confidence
Interval of the
Difference
Lower Upper
.3.. 733- 7363- 737. 63.0- .0. 73. H05
confirmed
According to table 3, 7.9 % of participants selected the complete
disagreement choice, and 25.8% selected the complete agreement choice
and 37.3 were neutral, believing that the sales promotions do not provoke
Scientific Papers (www.scientificpapers.org) Journal of Knowledge Management, Economics and Information Technology
13
Issue 4 June 2011
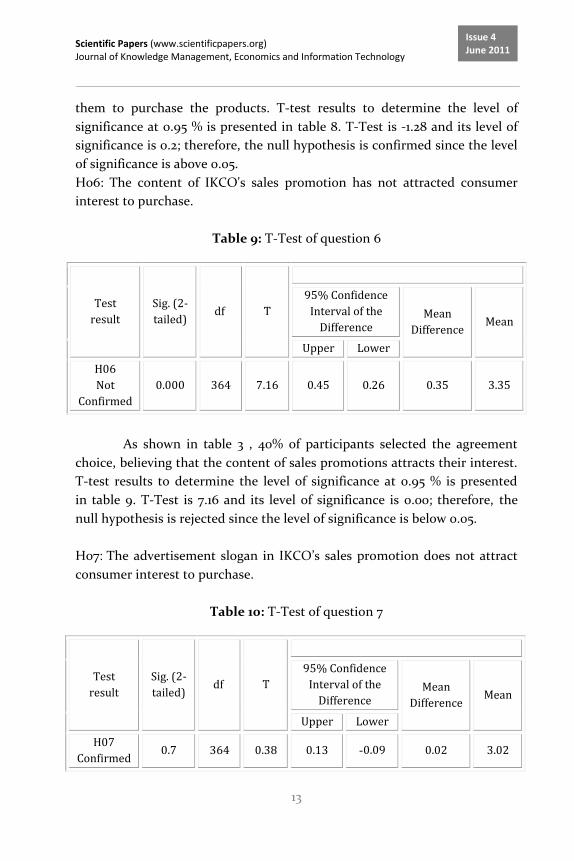
them to purchase the products. T-test results to determine the level of
significance at 0.95 % is presented in table 8. T-Test is -1.28 and its level of
significance is 0.2; therefore, the null hypothesis is confirmed since the level
of significance is above 0.05.
H06: The content of IKCO's sales promotion has not attracted consumer
interest to purchase.
Table 9: T-Test of question 6
df TSig. (2-
tailed)
Test
result Mean Mean
Difference
95% Confidence
Interval of the
Difference
Lower Upper
.3.6 73.6 73.0 73.6 3360 .0. 73777
H06
Not
Confirmed
As shown in table 3 , 40% of participants selected the agreement
choice, believing that the content of sales promotions attracts their interest.
T-test results to determine the level of significance at 0.95 % is presented
in table 9. T-Test is 7.16 and its level of significance is 0.00; therefore, the
null hypothesis is rejected since the level of significance is below 0.05.
H07 : The advertisement slogan in IKCO’s sales promotion does not attract
consumer interest to purchase.
Table 10: T-Test of question 7
df TSig. (2-
tailed)
Test
result Mean Mean
Difference
95% Confidence
Interval of the
Difference
Lower Upper
.37. 737. 737.- 736. 73.0 .0. 733 H07
Confirmed
Scientific Papers (www.scientificpapers.org) Journal of Knowledge Management, Economics and Information Technology
14
Issue 4 June 2011
According to table 3, 8.2% of participants selected the total
disagreement choice, 26.6% selected the disagreement choice, and 26.6
chose neutral choice, indicating that the slogan in sales promotions will not
capture viewers' interest. T-test results to determine the level of significance
at 0.95% is presented in table 10. T-Test is 0.38 and its level of significance is
0.7; therefore, the null hypothesis is confirmed since the level of significance
is above 0.05. Thus the hypothesis that the slogan in the sales promotions
catches viewers' interest is rejected.
The results indicate that all the elements, excluding the music track
used and the slogans, are considered as catching viewer's interest to
purchase.
Findings and conclusions
The main purpose of this study is to the affect of sales promotion on
consumer interest to purchase used in market in general and in automobile
industry in particular. Through comparing theories brought up in the
conceptual framework to the empirical data, we have been able to answer
the research questions. The findings and conclusions concerning the
research questions of sales promotion used and the objectives of them
contributes to existing theories by more thoroughly describe the
implementation.
We have found that IKCO Co. sales promotion have a positive affect
on consumers' interest to purchase. The results of significance level test
indicate that out of all seven factors-music, expressing the features,
techniques used, content, stimulating affect, providing information about
the New products, and the advertising slogans-five factors have significant
impact on viewers’ interest to purchase, leaving the other two factors, i.e.
stimulating affect and advertising slogans had comparatively, a little lesser
impact on consumers’ interest.
As discussed in evaluating the paper hypotheses, sales promotion of
IKCO could help company to achieve their main goal, namely motivating
consumers to purchase their products. Furthermore, these sales promotional
efforts do cause much motivation and creation of interest. Therefore the
Scientific Papers (www.scientificpapers.org) Journal of Knowledge Management, Economics and Information Technology
15
Issue 4 June 2011
designers of these sales promotion strategies should take this aspect into
account.
It has been clearly established that success story of promotional
efforts of Iran Khordo, in terms of drawing interest and generating interest.
Limitations
There were several limitations in the present research, which may
have affected the results:
1. We worked on a sample size of 365 respondents against the whole
population due to lack of resources. This sample may not be
considered as a good representative of the whole population.
2. Given the fact that researcher is not scientifically trained for the
data collection and thus there is a possibility of human error that
researcher regrets.
3. The questionnaire to collect data, is made by the researcher which
needs to be revised in terms of reliability and validity.
Implications for Future Research
While writing this paper several issues connected to this research
purpose have been encountered. Since they have been beyond this study and
would have had a negative broadening affect, they have been ignored until
this chapter where a proposal of the different issues as future research areas
is presented. When studying the area of sales promotion there was the lack
of information on how sales promotions differs from consumer sales
promotion. Since there is limited amount of studies conducted in sales
promotion, a comparison could contribute to a deeper understanding in the
area. Look into how sales promotions used in consumers markets can be put
into practice. Any research focuses on one aspect of a certain issue to
provide a better description and explanation.
Similarly, this research has focused on the affect s sales promotion
on consumer interest to purchase. The following suggestions are proposed
for further research:
1. Investigating the affect sales promotion using other models
discussed early.
Scientific Papers (www.scientificpapers.org) Journal of Knowledge Management, Economics and Information Technology
16
Issue 4 June 2011
2. Investigating the consumers' attitude towards sales promotions in
Iran.
3. Using this papers' conceptual model to investigate the affect of sales
promotion in services and other industries.
4. Investigating about other Marketing Mix instruments using the
present model.
5. Investigating the affect of sales promotion on other national than
Iranian to find out and establish any potential cultural bearing on
findings.
6. Conduct a cross-case analysis where the implementation of sales
promotion used are compared between various companies within
the same consumer market.
References :
[1] Blattberg, Robert C. and Scott A. Neslin (1990), Sales Promotion,
Concepts, Methods and Strategies, Englewood Cliffs, New Jersey:
Prentice Hall.
[2] Brassington, F. and Pettitt, S. (2000), Sales Promotion. In: Principles
of Marketing, 2nd
ed., FT Prentice Hall, Harlow, pp. 642-685
[3] Chandon, P. & Laurent, G. (2000), Hedonic and utilitarian consumer
benefits of sales promotions, Marketing Science Institute Working
Paper No. 99– 109. Cambridge, MA: Marketing Science Institute.
[4] Dwyer, F. R., & Tanner, F. J., (2006), Business marketing, Connecting
strategy, relationships, and learning, (3rd
ed.), New York: McGraw-
Hill Companies.
[5] Hellman Karel (2005), Strategy-driven B2B Promotion, Journal of
Business &Industrial Marketing ,Volume : 20, 4-11
[6] Huff, L.C. and D.L. Alden (1998), An investigation of consumer
response to sales promotions in developing markets: A three-country
analysis, Journal of Advertising Research, 38,3, 47-57.
[7] Jobber, D., & Lancaster, G. (2006), Selling and sales management,
(7th ed.), Harlow: Pearson Education.
[8] Kwok, S., & Uncles, M. (2005), Sales promotion effectiveness: the
impact of consumer differences at an ethnic-group level, Journal of
Product & Brand Management, Vol. 14 No. 3 pp. 170-186

Scientific Papers (www.scientificpapers.org) Journal of Knowledge Management, Economics and Information Technology
17
Issue 4 June 2011
[9] Low, G.S., Mohr, J.J. (2000), Advertising vs. sales promotion: a brand
management perspective, Journal of product & brand management,
Vol. 9 No. 6, pp. 389-414.
[10] Mitchell, H. (2000), The Communication Mix. In: Marketing
Management: A relationship marketing perspective, edited by
Cranfield School of Management, Palgrave Macmillan, Basingstoke,
pp. 196
[11] Rowely, J. (1998), Promotion and marketing communications in the
information, Library Review, Vol. 47 No. 8, pp. 383-387.
[12] Schultz, D.E. and Robinson, W.A., Sales Promotion Management,
Chicago: Crain Books, 1998.
[13] Seif Naraghi, M., (2006), Research methodology in educational
educational sciences, Badr Publisher, Tehran.
[14] Strong, F.K. (1925), The Psychology of Selling, McGraw Hill, New
York, NY.