The aetiology and epidemiology of PD, HMSI and CMS in …1 The aetiology and epidemiology of PD,...
20
1 The aetiology and epidemiology of PD, HMSI and CMS in Scotland Project Code: SARF015 November 2007 Report Prepared for the Scottish Aquaculture Research Forum By: Institute of Aquaculture, University of Stirling
Transcript of The aetiology and epidemiology of PD, HMSI and CMS in …1 The aetiology and epidemiology of PD,...

1
The aetiology and epidemiology of PD, HMSI and CMS in Scotland Project Code: SARF015 November 2007 Report Prepared for the Scottish Aquaculture Research Forum By: Institute of Aquaculture, University of Stirling
2
Milestone one – Is CMS infectious?
More than 20 years have passed since the first outbreaks of Cardiomyopathy Syndrome (CMS)
were described (Ferguson et al. 1990). We still know little about this disease and the question ‘Is it an infectious disease or not?’ remains unanswered. The aim of this milestone was try to establish if CMS is infectious or not.
A methodical and scientific approach to determine the infectivity of a disease is usually performed by infecting healthy organisms with the infectious agent. When the agent is unknown or has not been isolated, extracts from diseased tissues are used. Cell extracts (1:1 of kidney:heart tissues) from a CMS outbreak in Norway were prepared and sent to FRS marine laboratory in Aberdeen to be used in a challenge experiment.
The challenge performed at the FRS marine laboratory used two groups of Atlantic salmon – large fish and post-smolts. These Atlantic salmon, from a farm site with no CMS history, were screened for the presence of SPDV antibodies (analysed by ELISA) and the presence of SPDV virion particles (analysed by RT-PCR). Both tests revealed negative results.
Large Atlantic salmon (25 fish) were injected with 0.2 ml of cell extracts and 15 fish were injected with 0.2 ml of PBS, to act as control fish. The infected fish were kept in two 3 m tanks, while the control fish were kept in one 3 m tank. The challenged fish were sampled on weeks 2, 4, 8, 12, 15 and 20. Week 4 was the exception with just infected fish being sampled. Per sampling point four infected and three control fish were sampled. Sixty post-smolt fish were injected with 0.1 ml of cell extract while 40 fish were injected with 0.1 ml of PBS. The fish were sampled on weeks 2, 3, 4, 10, 18, 22, 28 and 35, being sampled six injected and four control fish. In both challenges spleen, caeca/pancreas, intestine, gill, heart, kidney and liver were collected for histopathology; virus culture was performed, individually, with serum and with a pool of heart, kidney and caeca/pancreas. The presence of SPDV antibodies was tested by serology and the presence of SPDV virion particles by molecular analysis (RT-PCR to heart, kidney and caeca/pancreas samples).
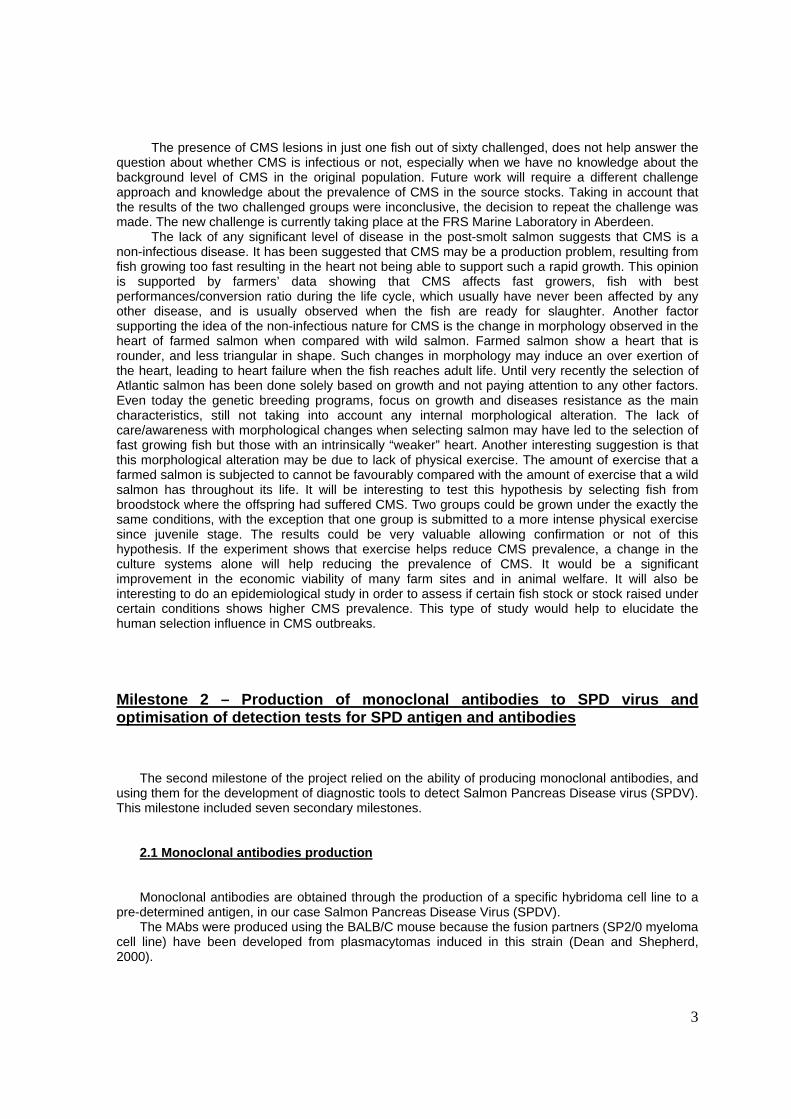
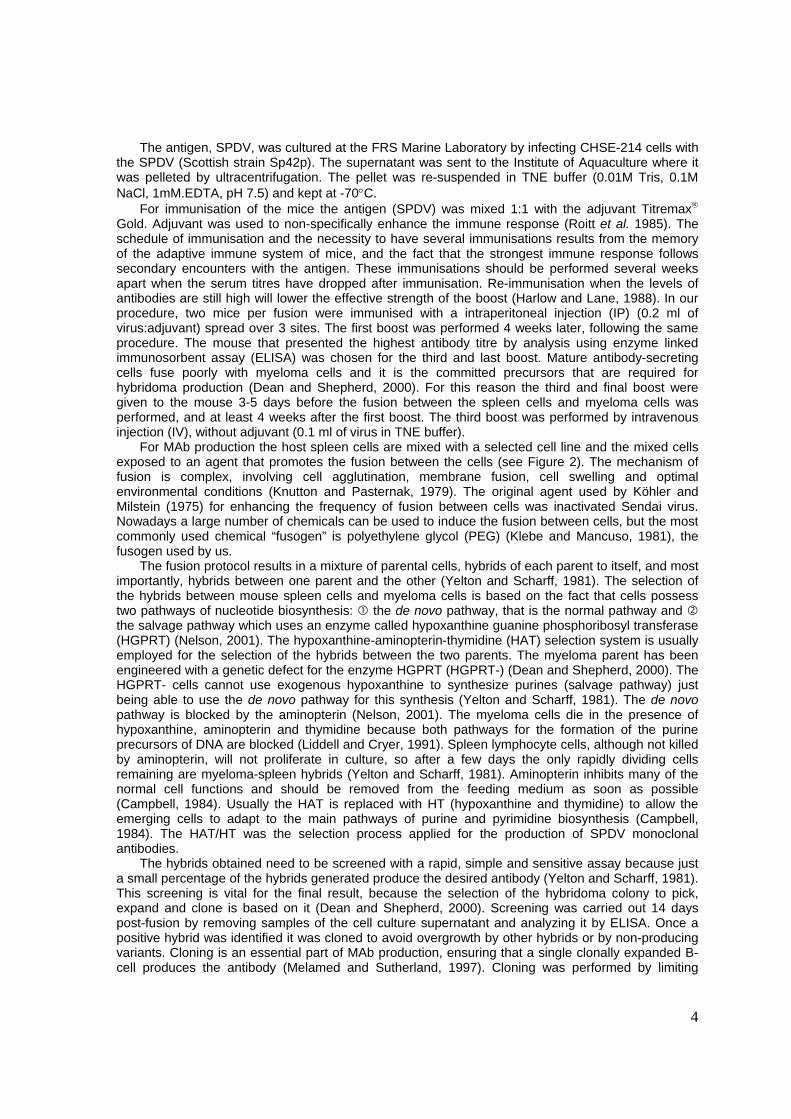
The analysis of serology and molecular biology samples revealed that none of the Atlantic salmon challenged had antibodies to SPDV and were negative for the presence of SPDV virion particles. All the virology samples were also negative. The histopathology results of large salmon showed typical CMS lesions in both, control and infected fish, right from the beginning of the experiment. The salmon were screened for SPDV before challenge but because they were from a “CMS-free” site, histopathology was not performed prior to injection. The fact that the lesions were present from the beginning of the challenge, precluded the possibility that the control fish heart lesions could be attributed to contamination between tanks. With post-smolt salmon the histopathology revealed that just one fish at week 22 showed typical CMS pathology (Figure 1).
Figure 1 – Heart of the post-smolt fish showing the typical CMS lesions
3
The presence of CMS lesions in just one fish out of sixty challenged, does not help answer the question about whether CMS is infectious or not, especially when we have no knowledge about the background level of CMS in the original population. Future work will require a different challenge approach and knowledge about the prevalence of CMS in the source stocks. Taking in account that the results of the two challenged groups were inconclusive, the decision to repeat the challenge was made. The new challenge is currently taking place at the FRS Marine Laboratory in Aberdeen.
The lack of any significant level of disease in the post-smolt salmon suggests that CMS is a non-infectious disease. It has been suggested that CMS may be a production problem, resulting from fish growing too fast resulting in the heart not being able to support such a rapid growth. This opinion is supported by farmers’ data showing that CMS affects fast growers, fish with best performances/conversion ratio during the life cycle, which usually have never been affected by any other disease, and is usually observed when the fish are ready for slaughter. Another factor supporting the idea of the non-infectious nature for CMS is the change in morphology observed in the heart of farmed salmon when compared with wild salmon. Farmed salmon show a heart that is rounder, and less triangular in shape. Such changes in morphology may induce an over exertion of the heart, leading to heart failure when the fish reaches adult life. Until very recently the selection of Atlantic salmon has been done solely based on growth and not paying attention to any other factors. Even today the genetic breeding programs, focus on growth and diseases resistance as the main characteristics, still not taking into account any internal morphological alteration. The lack of care/awareness with morphological changes when selecting salmon may have led to the selection of fast growing fish but those with an intrinsically “weaker” heart. Another interesting suggestion is that this morphological alteration may be due to lack of physical exercise. The amount of exercise that a farmed salmon is subjected to cannot be favourably compared with the amount of exercise that a wild salmon has throughout its life. It will be interesting to test this hypothesis by selecting fish from broodstock where the offspring had suffered CMS. Two groups could be grown under the exactly the same conditions, with the exception that one group is submitted to a more intense physical exercise since juvenile stage. The results could be very valuable allowing confirmation or not of this hypothesis. If the experiment shows that exercise helps reduce CMS prevalence, a change in the culture systems alone will help reducing the prevalence of CMS. It would be a significant improvement in the economic viability of many farm sites and in animal welfare. It will also be interesting to do an epidemiological study in order to assess if certain fish stock or stock raised under certain conditions shows higher CMS prevalence. This type of study would help to elucidate the human selection influence in CMS outbreaks. Milestone 2 – Production of monoclonal antibodies to SPD virus and optimisation of detection tests for SPD antigen and antibodies
The second milestone of the project relied on the ability of producing monoclonal antibodies, and
using them for the development of diagnostic tools to detect Salmon Pancreas Disease virus (SPDV). This milestone included seven secondary milestones.
2.1 Monoclonal antibodies production Monoclonal antibodies are obtained through the production of a specific hybridoma cell line to a
pre-determined antigen, in our case Salmon Pancreas Disease Virus (SPDV). The MAbs were produced using the BALB/C mouse because the fusion partners (SP2/0 myeloma
cell line) have been developed from plasmacytomas induced in this strain (Dean and Shepherd, 2000).
4
The antigen, SPDV, was cultured at the FRS Marine Laboratory by infecting CHSE-214 cells with the SPDV (Scottish strain Sp42p). The supernatant was sent to the Institute of Aquaculture where it was pelleted by ultracentrifugation. The pellet was re-suspended in TNE buffer (0.01M Tris, 0.1M NaCl, 1mM.EDTA, pH 7.5) and kept at -70°C.
For immunisation of the mice the antigen (SPDV) was mixed 1:1 with the adjuvant Titremax® Gold. Adjuvant was used to non-specifically enhance the immune response (Roitt et al. 1985). The schedule of immunisation and the necessity to have several immunisations results from the memory of the adaptive immune system of mice, and the fact that the strongest immune response follows secondary encounters with the antigen. These immunisations should be performed several weeks apart when the serum titres have dropped after immunisation. Re-immunisation when the levels of antibodies are still high will lower the effective strength of the boost (Harlow and Lane, 1988). In our procedure, two mice per fusion were immunised with a intraperitoneal injection (IP) (0.2 ml of virus:adjuvant) spread over 3 sites. The first boost was performed 4 weeks later, following the same procedure. The mouse that presented the highest antibody titre by analysis using enzyme linked immunosorbent assay (ELISA) was chosen for the third and last boost. Mature antibody-secreting cells fuse poorly with myeloma cells and it is the committed precursors that are required for hybridoma production (Dean and Shepherd, 2000). For this reason the third and final boost were given to the mouse 3-5 days before the fusion between the spleen cells and myeloma cells was performed, and at least 4 weeks after the first boost. The third boost was performed by intravenous injection (IV), without adjuvant (0.1 ml of virus in TNE buffer).
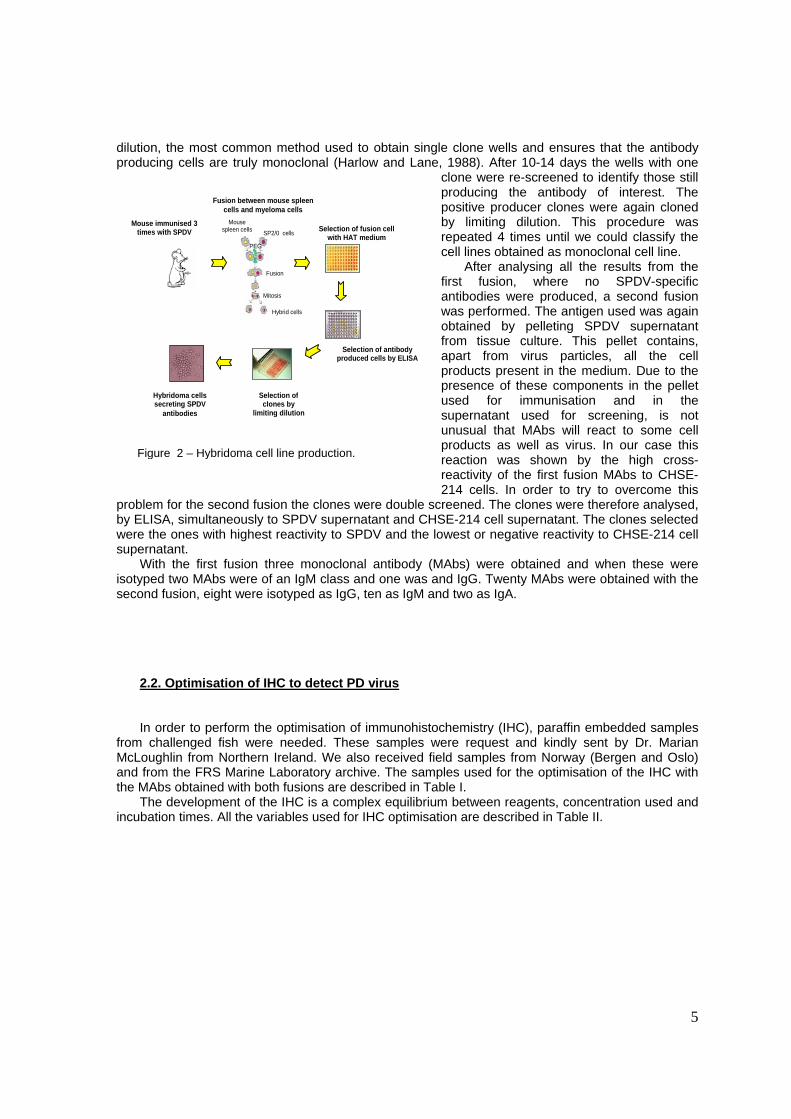
For MAb production the host spleen cells are mixed with a selected cell line and the mixed cells exposed to an agent that promotes the fusion between the cells (see Figure 2). The mechanism of fusion is complex, involving cell agglutination, membrane fusion, cell swelling and optimal environmental conditions (Knutton and Pasternak, 1979). The original agent used by Köhler and Milstein (1975) for enhancing the frequency of fusion between cells was inactivated Sendai virus. Nowadays a large number of chemicals can be used to induce the fusion between cells, but the most commonly used chemical “fusogen” is polyethylene glycol (PEG) (Klebe and Mancuso, 1981), the fusogen used by us.
The fusion protocol results in a mixture of parental cells, hybrids of each parent to itself, and most importantly, hybrids between one parent and the other (Yelton and Scharff, 1981). The selection of the hybrids between mouse spleen cells and myeloma cells is based on the fact that cells possess two pathways of nucleotide biosynthesis: the de novo pathway, that is the normal pathway and the salvage pathway which uses an enzyme called hypoxanthine guanine phosphoribosyl transferase (HGPRT) (Nelson, 2001). The hypoxanthine-aminopterin-thymidine (HAT) selection system is usually employed for the selection of the hybrids between the two parents. The myeloma parent has been engineered with a genetic defect for the enzyme HGPRT (HGPRT-) (Dean and Shepherd, 2000). The HGPRT- cells cannot use exogenous hypoxanthine to synthesize purines (salvage pathway) just being able to use the de novo pathway for this synthesis (Yelton and Scharff, 1981). The de novo pathway is blocked by the aminopterin (Nelson, 2001). The myeloma cells die in the presence of hypoxanthine, aminopterin and thymidine because both pathways for the formation of the purine precursors of DNA are blocked (Liddell and Cryer, 1991). Spleen lymphocyte cells, although not killed by aminopterin, will not proliferate in culture, so after a few days the only rapidly dividing cells remaining are myeloma-spleen hybrids (Yelton and Scharff, 1981). Aminopterin inhibits many of the normal cell functions and should be removed from the feeding medium as soon as possible (Campbell, 1984). Usually the HAT is replaced with HT (hypoxanthine and thymidine) to allow the emerging cells to adapt to the main pathways of purine and pyrimidine biosynthesis (Campbell, 1984). The HAT/HT was the selection process applied for the production of SPDV monoclonal antibodies.
The hybrids obtained need to be screened with a rapid, simple and sensitive assay because just a small percentage of the hybrids generated produce the desired antibody (Yelton and Scharff, 1981). This screening is vital for the final result, because the selection of the hybridoma colony to pick, expand and clone is based on it (Dean and Shepherd, 2000). Screening was carried out 14 days post-fusion by removing samples of the cell culture supernatant and analyzing it by ELISA. Once a positive hybrid was identified it was cloned to avoid overgrowth by other hybrids or by non-producing variants. Cloning is an essential part of MAb production, ensuring that a single clonally expanded B-cell produces the antibody (Melamed and Sutherland, 1997). Cloning was performed by limiting
5
dilution, the most common method used to obtain single clone wells and ensures that the antibody producing cells are truly monoclonal (Harlow and Lane, 1988). After 10-14 days the wells with one
clone were re-screened to identify those still producing the antibody of interest. The positive producer clones were again cloned by limiting dilution. This procedure was repeated 4 times until we could classify the cell lines obtained as monoclonal cell line.
After analysing all the results from the first fusion, where no SPDV-specific antibodies were produced, a second fusion was performed. The antigen used was again obtained by pelleting SPDV supernatant from tissue culture. This pellet contains, apart from virus particles, all the cell products present in the medium. Due to the presence of these components in the pellet used for immunisation and in the supernatant used for screening, is not unusual that MAbs will react to some cell products as well as virus. In our case this reaction was shown by the high cross-reactivity of the first fusion MAbs to CHSE-214 cells. In order to try to overcome this
problem for the second fusion the clones were double screened. The clones were therefore analysed, by ELISA, simultaneously to SPDV supernatant and CHSE-214 cell supernatant. The clones selected were the ones with highest reactivity to SPDV and the lowest or negative reactivity to CHSE-214 cell supernatant.
With the first fusion three monoclonal antibody (MAbs) were obtained and when these were isotyped two MAbs were of an IgM class and one was and IgG. Twenty MAbs were obtained with the second fusion, eight were isotyped as IgG, ten as IgM and two as IgA.
2.2. Optimisation of IHC to detect PD virus In order to perform the optimisation of immunohistochemistry (IHC), paraffin embedded samples
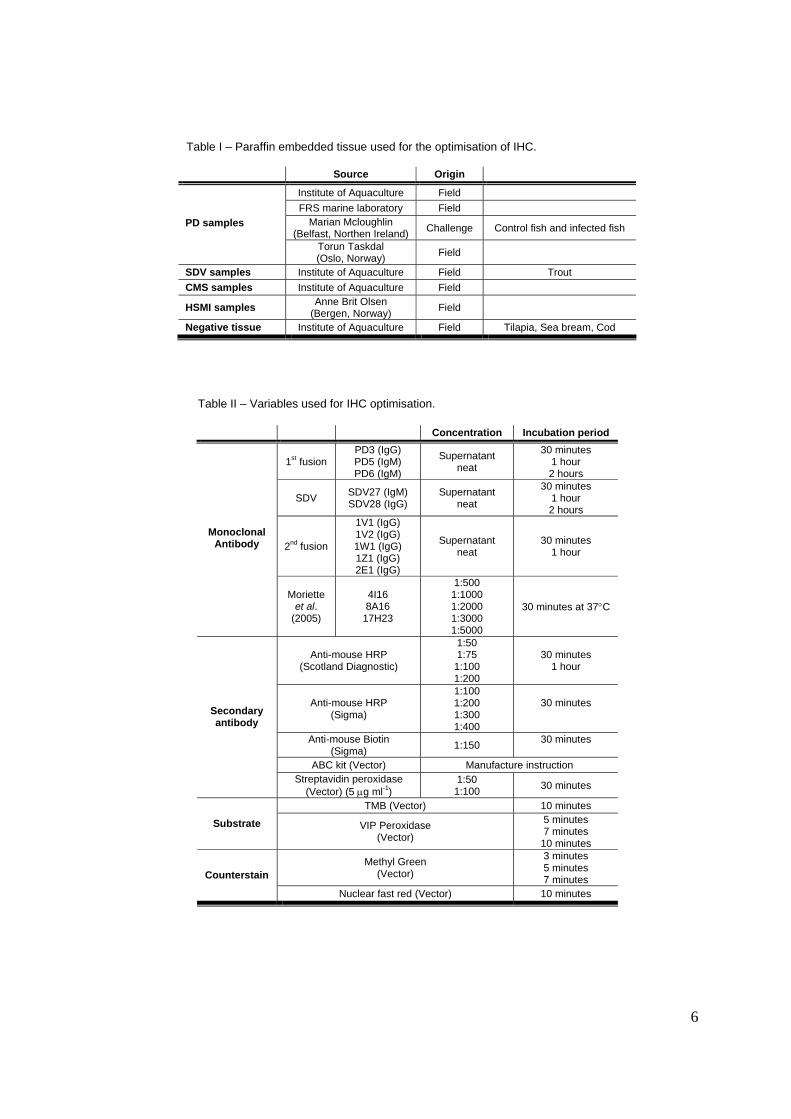
from challenged fish were needed. These samples were request and kindly sent by Dr. Marian McLoughlin from Northern Ireland. We also received field samples from Norway (Bergen and Oslo) and from the FRS Marine Laboratory archive. The samples used for the optimisation of the IHC with the MAbs obtained with both fusions are described in Table I.
The development of the IHC is a complex equilibrium between reagents, concentration used and incubation times. All the variables used for IHC optimisation are described in Table II.
Figure 2 – Hybridoma cell line production.
Mouse immunised 3
times with SPDV Mouse
spleen cells SP2/0 cells
PEG
Fusion
Mitosis
Hybrid cells
Selection of fusion cell with HAT medium
Selection of antibody produced cells by ELISA
Selection of clones by
limiting dilution
Hybridoma cells secreting SPDV
antibodies
Fusion between mouse spleen cells and myeloma cells
6
Table I – Paraffin embedded tissue used for the optimisation of IHC.
Source Origin
Institute of Aquaculture Field FRS marine laboratory Field
Marian Mcloughlin (Belfast, Northen Ireland) Challenge Control fish and infected fish PD samples
Torun Taskdal (Oslo, Norway) Field
SDV samples Institute of Aquaculture Field Trout CMS samples Institute of Aquaculture Field
HSMI samples Anne Brit Olsen (Bergen, Norway) Field
Negative tissue Institute of Aquaculture Field Tilapia, Sea bream, Cod
Table II – Variables used for IHC optimisation.
Concentration Incubation period
1st fusion PD3 (IgG) PD5 (IgM) PD6 (IgM)
Supernatant neat
30 minutes 1 hour 2 hours
SDV SDV27 (IgM) SDV28 (IgG)
Supernatant neat
30 minutes 1 hour 2 hours
2nd fusion
1V1 (IgG) 1V2 (IgG) 1W1 (IgG) 1Z1 (IgG) 2E1 (IgG)
Supernatant neat
30 minutes 1 hour
Monoclonal Antibody
Moriette et al.
(2005)
4I16 8A16
17H23
1:500 1:1000 1:2000 1:3000 1:5000
30 minutes at 37°C
Anti-mouse HRP (Scotland Diagnostic)
1:50 1:75
1:100 1:200
30 minutes 1 hour
Anti-mouse HRP (Sigma)
1:100 1:200 1:300 1:400
30 minutes
Anti-mouse Biotin (Sigma) 1:150 30 minutes
ABC kit (Vector) Manufacture instruction
Secondary antibody
Streptavidin peroxidase (Vector) (5 µg ml-1)
1:50 1:100 30 minutes
TMB (Vector) 10 minutes
Substrate VIP Peroxidase (Vector)
5 minutes 7 minutes
10 minutes
Methyl Green (Vector)
3 minutes 5 minutes 7 minutes Counterstain
Nuclear fast red (Vector) 10 minutes
7
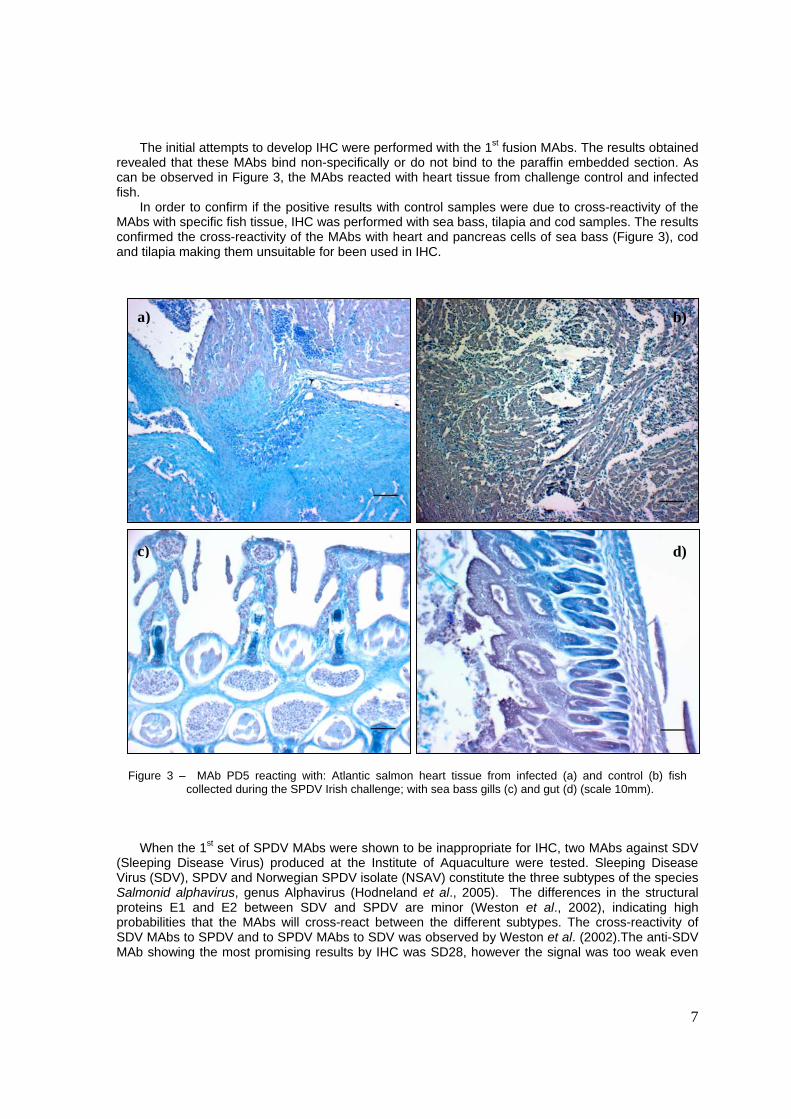
The initial attempts to develop IHC were performed with the 1st fusion MAbs. The results obtained revealed that these MAbs bind non-specifically or do not bind to the paraffin embedded section. As can be observed in Figure 3, the MAbs reacted with heart tissue from challenge control and infected fish.
In order to confirm if the positive results with control samples were due to cross-reactivity of the MAbs with specific fish tissue, IHC was performed with sea bass, tilapia and cod samples. The results confirmed the cross-reactivity of the MAbs with heart and pancreas cells of sea bass (Figure 3), cod and tilapia making them unsuitable for been used in IHC.
Figure 3 – MAb PD5 reacting with: Atlantic salmon heart tissue from infected (a) and control (b) fish
collected during the SPDV Irish challenge; with sea bass gills (c) and gut (d) (scale 10mm). When the 1st set of SPDV MAbs were shown to be inappropriate for IHC, two MAbs against SDV
(Sleeping Disease Virus) produced at the Institute of Aquaculture were tested. Sleeping Disease Virus (SDV), SPDV and Norwegian SPDV isolate (NSAV) constitute the three subtypes of the species Salmonid alphavirus, genus Alphavirus (Hodneland et al., 2005). The differences in the structural proteins E1 and E2 between SDV and SPDV are minor (Weston et al., 2002), indicating high probabilities that the MAbs will cross-react between the different subtypes. The cross-reactivity of SDV MAbs to SPDV and to SPDV MAbs to SDV was observed by Weston et al. (2002).The anti-SDV MAb showing the most promising results by IHC was SD28, however the signal was too weak even
a) b)
c) d)

8
when using biotin-streptavidin amplification. This lack of a strong signal makes this MAb unsuitable for diagnostic use.
After the 2nd fusion the MAbs obtained were tested by IHC. These MAbs showed cross-reactivity with tissue cells, and no reaction with the PDV as observed with the MAbs obtained for the 1st fusion.
Facing the possibility of having no MAbs that funtioned in IHC, Dr. Brémont from INRA in France was approached. This group had produced MAbs in the past (Moriette et al., 2005). The major difference between the production of these MAbs and the ones produced at our lab was the antigen used. The mice had been immunised with recombinant protein and not the virus itself. These MAbs were kindly sent by Dr. Brémont.
The MAbs were tested in IHC and although MAb 8A16 did not show any type of reaction, and MAb 17H23 showed cross-reaction, MAb 4I16 revealed to be specific to SPDV (Figure 4). The IHC protocol was therefore optimised using this MAb (Table III).
Figure 4 – IHC with 4I16. The samples used were control and infected samples obtained from a challenge sent by Dr. McLoughlin. The virus is labelled in purple.
Table III – Optimised IHC protocol.
Step Reagent Incubation
Endogenous peroxidase
blocking 3% H2O2 in methanol
30 minutes RT
Non-specific antibody blocking
Anti-goat serum
(1:10 in PBS)
20 minutes RT
MAb 4I16 (1:1000 in PBS)
1 hour 37°C
Secondary antibody
Anti-mouse HRP (1:200
in PBS)
20 minutes RT
Substrate VIP 10 minutes RT
Counterstaining Methyl Green 5 minutes RT
RT- room temperature

9
2.3 Optimisation of IFAT to detect PD virus The use of the indirect fluorescence antibody test (IFAT) for the detection of SPDV would be
extremely useful for an early diagnostic test of SPDV. The isolation of SPDV is extremely difficult and usually a blind passage is necessary. Sometimes just at the 3rd passage through the cells it is possible to observe some cytopathic effects. As this virus grows so slowly identification of the virus very rarely can be performed earlier than 21 days following infection of the cells in tissue culture.
The IFAT was initially optimised using the 1st fusion MAbs and CHSE-214 cell line. This cell line is normally used for isolation of SPDV, making it the preferential target for developing of an IFAT assay. The first trials with IHC were performed by growing the CHSE-214 cells into cover slips but this was unsuccessful. Therefore special cell culture chambers that can be used directly with confocal microscopy were used. The first trials always revealed the same result – positive signal with control cells. The SPDV is an alphavirus and this type of virus uses the heterodimer E1-E2 protein to enter into an uninfected cell by membrane fusion or for their membrane assembly in infected cells (Strauss & Strauss, 1994). When E1-E2 protein fuses with the cell line membrane allowing the virion particles to infect the cell infect the cells, and the release of new virion particles is done by budding, part of the cell membrane will become part of the E1-E2 protein. The E1-E2 protein is the structural protein and is the most exposed protein of alphavirus, and therefore these will be the most natural immunogenic proteins when trying to produce MAbs. The mice were immunised using the whole virus, so the fact that the MAbs also recognised the CHSE-214 is not surprising.
In order to try to overcome this problem a different cell line, CHH-1 cell line (Chinook Heart cells), was inoculated with SPDV and used for the optimisation of the IFAT. To our knowledge this was the first time that this cell line was used for SPDV propagation and all the details of virus culture are described in milestone 5. Most of the optimisation attempts were performed with the CHH-1 cell line. It was established that the optimum amount of CHH-1 to seed into each well of the chambers was 300 µl of cells at a concentration of 7.5×10⁵ cells ml-1. In order to make sure that cross-reactivity was not induced by the procedure several modifications were made to the standard IFAT protocol, as shown in Table IV.
Due to the fact that the binding of the MAbs to control cells may be due to fixation problems, three different fixatives were used. Methanol appears to be slightly better than the others and was selected. Another possibility was that the cross-reactivity of the MAbs may be due to non-specific binding. This type of binding can be reduced by blocking the sample with mouse serum. This was performed but unsuccessfully. Some MAbs react better with a conjugated secondary antibody than another. Due to this fact we tested two different antibodies (FITC and Texas Red conjugated) at different concentrations. The results were similar.
The results obtained show that the MAbs have a weaker cross reaction with CHH-1 than with CHSE-214 cells. However, the cross-reactivity was strong enough rule out using these MAbs for the detection of SPDV in IFAT (Figure 5).

10
Table IV– Variables used for IFAT optimisation.
Concentration Incubation period
1st fusion PD3 (IgG) PD5 (IgM) PD6 (IgM)
SDV SDV27 (IgM) SDV33 (IgG)
2nd fusion
1V1 (IgG) 1V2 (IgG) 1W1 (IgG) 1Z1 (IgG) 2E1 (IgG)
Supernatant neat
30 minutes 45 minutes
1 hour RT Monoclonal Antibody
Moriette et al. (2005)
4I16 8A16
17H23
1:500 1:750
1:1000
30 minutes 45 minutes
RT
Anti-mouse FITC (Sigma)
1:75 1:100
30 minutes 45 minutes
RT Secondary antibody Anti-mouse Texas Red (1.5 mg
ml-1) (Vector) 1:50 1:75
30 minutes 45 minutes
RT
Cytoskeleton Stain Phalloidin (Molecular Probes) 2:100 30 minutes RT
Nuclear stain DAPI Until read
Fixation Methanol
Gluteraldehyde Neutral Buffered Formalin
95% v/v 0.05% in PBS
4% v/v 5 minutes TR
Blocking MAb unspecific binding Mouse serum 1:10 30 minutes
RT
Figure 5 - MAb PD6 in IFAT reacting with a) CHSE-214 cells infected with SPDV and b) CHSE-214 control
cells. Blue is the cell nucleos stained with DAPI and green the MAb labelled with FITC.
a) b)

11
2.4 Optimisation of ELISA to detect PD antibodies and PD virus ELISA is a very widely used method for the detection of both antibodies and pathogens. Until now
the assay for detection of SPDV antibodies was developed by Graham et al. (2003). This assay has been prove to be very robust, and is based on the inhibition of virus propagation by neutralising antibodies. This is a complex technique, very time consuming, dependent on cell culture of the virus and the ability of an antibody to neutralise virus propagation. The ELISA to detect SPDV antibodies developed and optimised during this project was an indirect ELISA (Figure 6). Briefly, the wells were coated with SPDV supernatant (from tissue cultured cells infected with virus), then fish serum was added and allowed to incubate. Anti-salmon IgM antibody conjugated with HRP (Aquatic Diagnostic Ltd) was added and the assay read using a peroxidase substrate.
In order to optimise the detection of antibodies and due to the fact that we did not possess known positive sera, Dr. David Graham sent sera samples from two different studies. The first study was a longitudinal field study where no infection occurred throughout the trial, so the ten sera samples were known negatives. The second study was a challenge study and the samples sent were composed by ten positive samples (SPDV infected fish) and ten negative samples (control fish). All the samples were analysed and all the negative samples presented negative results with the ELISA developed. The SPDV infected samples (positive sera) were analysed and revealed that nine out of the ten sera samples were positive by ELISA. Not having 100% matching between our ELISA and Dr. Graham assay can be explained by the sensitivity of antibodies to freeze/thaw cycles. For three positive samples sent, the ELISA was repeated and just one of the samples still gave a positive result, showing the sensitivity of the antibodies to freeze/thaw cycles.
The development of a sandwich ELISA for the detection of SPDV virus was planned in the project. Due to the fact that the MAbs obtained all cross-react with CHSE-214 supernatant the development of this assay was impossible to achieve.
2.5 - Development of lateral flow kits to detect PD virus
Lateral flow tests are also known as immunochromatographic strip (ICS) tests. For the detection of SPDV particles the test requires at least two different MAbs, one for immobilizing in the membrane (test line) and a different one labelled that will bind to the virus and to the control line (species specific antibody) (Figure 7). The sample is loaded into the release pad and it will run through capillarity, passing through the antigen-specific MAb where the antigen will bind. A second antibody labelled with gold is then added and will run through the membrane where it will bind to the antigen, and to the species specific antibody creating the positive control lane. Unfortuntely, due to the fact that anti-SPDV MAbs were not produced this assay was not developed. Aquatic Diagnostic Lld, a commercial partner in the project, will try to license the MAbs produced by Morietti et al. (2005) in order to develop these tests in the near future.
Figure 6 – Indirect ELISA for the detection of SPDV antibodies. A) wells coated with SPDV supernatant; B) antibodies added; C) anti-fish antibodies-HRP added; D) Substrate added and read at 455 nm.
A B C D

12
Figure 7 - Constituent components of a lateral flow device for detecting virus. (copied from http://beebase.csl.gov.uk/public/Research/lateralFlow.cfm, 30/08/2007)
2.6 - Development of lateral flow kits to detect PD antibodies For the development of a lateral flow test for the detection of PD antibodies the reagents are
different. Instead of an antibody immobilised in the membrane is necessary to immobilise purified SPDV particles and the control line is an anti-fish antibody. However, the purified virus was impossible to obtain. Our partners at the FRS Marine Laboratory tried to produce SPDV supernatant and purified the virus using the caesium chloride purification method. With this method the amounts of virus obtain were extremely low, and therefore test development could not proceed. Other researcher have also found difficulties in obtaining purified virus (Weston et al., 2002).
Another approach for virus purification is the use of affinity chromatography. With this method virus-specific antibodies are bound to sepharose pre-packed into a column, the virus supernatant is passed through the column and will bind to the antibodies. The purified virus is then eluted and collected. This was the approach that was to be used when the purification through the conventional method fail, however as virus specific MAbs were not developed this method could not be attempted.
2.7 – Development of Bioplex assay to detect and quantify PD virus in serum Bioplex is a Luminex-100 instrument commercialised by Bio-Rad. The Luminex-100 instrument
has been design by Luminex Corporation (Austin, Texas) especially for fluorosphere-based flow cytometry (Nolan and Mandy, 2001), also known as xMAP technology. This equipment uses traditional flow cytometry hardware and spectrally discrete polystyrene beads, or microspheres, to measure multiple analytes simultaneously (Seideman and Peritt, 2002). By varying the ratio of the two fluorophores (red and orange), up to 100 different bead sets can be distinguished and each bead set can be coupled to a different biological probe (Dasso et al. 2002). The possibility of using such a high number of beads and running assays in 96 well plates allows multiplexing and an high throughput, making it ideal for epidemiologic assays. The assay design to detect virus is very simple, the beads are coated with a specific antibody and are incubated with the serum samples. The virus present in the samples will bind to the antibody. Another virus specific antibody conjugated with Phycoerythrin (PE). will be added to act as fluorescent reporter (Figure 8). The equipment has two lasers, a green one that reads the beads dye and a red one that reads the reporter fluorescence molecule (PE). Data is acquired when the two fluorescence signals are read simultaneously. The

13
development of the assay was compromised by the lack of SPDV MAbs. The MAbs could have been used for capturing the virus however the quantification would have been impossible due to the cross reactivity of the MAbs with cell product. The quantification of a SPDV is performed by assessing the infectivity of the virus. The SPDV supernatant would need to be use for the establishment of a standard curve that would allow the quantification of the virus in the sample. With the MAbs reacting against the cell line product such quantification is impossible.
Figure 8 – Bioplex assay development. A: Beads coated with SPDV MAb; B) beads incubated with fish serum; C) SPDV MAb conjugated with PE added and the assay is read.
Milestone 3 – Determine the prevalence of PD in Scotland using the test developed in 2
Study the prevalence of PD was not possible as SPDV antibodies were not available to develop
the appropriate tests.
Milestone 4 – Determine if PD is always, sometimes or never present in CMS and HSMI affected fish
The successful achievement of this milestone was closely related with the success in the
development of diagnostic tools. As mentioned above it was not possible to produce suitable MAbs and develop appropriate diagnostic tools. It was however known that Scottish farms diagnosed with HSMI and CMS had sent serum to be analysed by Dr. Graham. The veterinarians responsible for the farms kindly supplied the results obtained. The results revealed that none of the fish analysed had antibodies to SPDV.
A more methodical approach to fully complete this milestone was planned at the beginning of the project. However, the results of the CMS/HSMI outbreaks that occurred in Scotland since the October 2005 showed that the fish has not been exposed to SPDV recently. In a longitudinal study performed by Graham et al. (2005) SPDV antibodies persisted for up to 9 months after an outbreak, the full length of the study. The negative results obtained showed that a SPDV infection did not occur in the stocks before or during these outbreaks.
14
Milestone 5 – Identification of cell types involved in the tissue response to CMS, HSMI and PD
The identification of cells is highly dependent on the availability of cell markers. Some cell
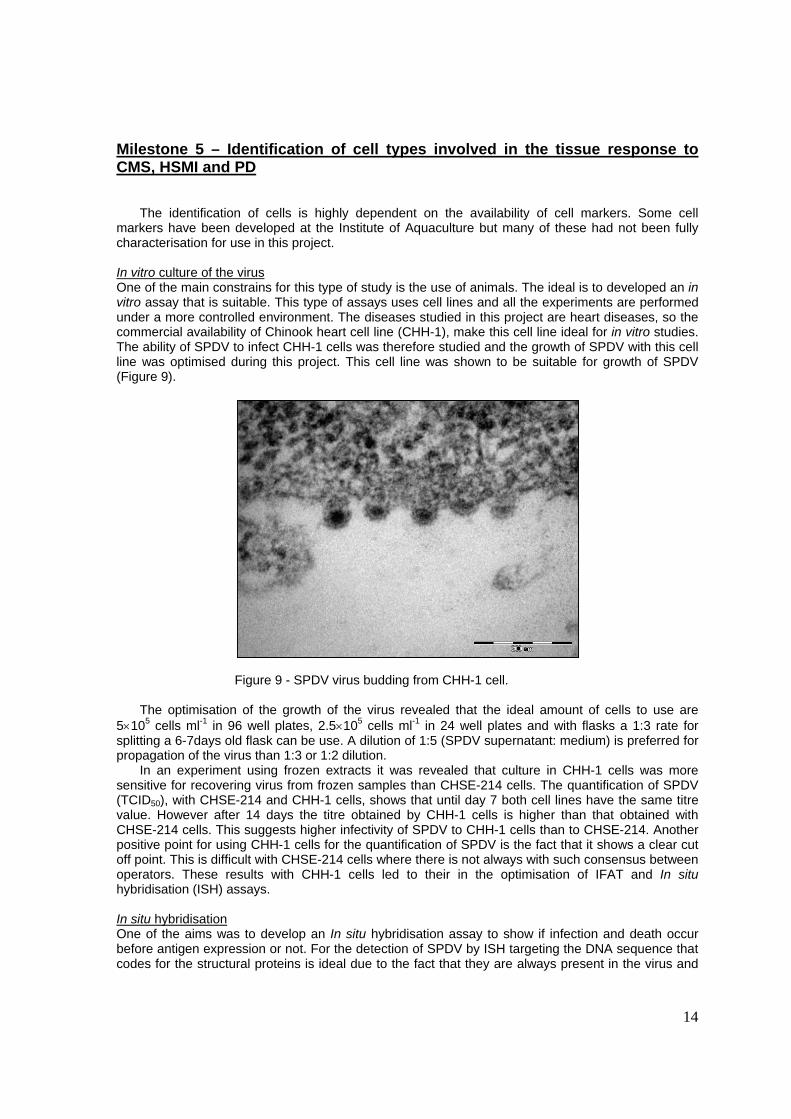
markers have been developed at the Institute of Aquaculture but many of these had not been fully characterisation for use in this project. In vitro culture of the virus One of the main constrains for this type of study is the use of animals. The ideal is to developed an in vitro assay that is suitable. This type of assays uses cell lines and all the experiments are performed under a more controlled environment. The diseases studied in this project are heart diseases, so the commercial availability of Chinook heart cell line (CHH-1), make this cell line ideal for in vitro studies. The ability of SPDV to infect CHH-1 cells was therefore studied and the growth of SPDV with this cell line was optimised during this project. This cell line was shown to be suitable for growth of SPDV (Figure 9).
Figure 9 - SPDV virus budding from CHH-1 cell.
The optimisation of the growth of the virus revealed that the ideal amount of cells to use are
5×10⁵ cells ml-1 in 96 well plates, 2.5×10⁵ cells ml-1 in 24 well plates and with flasks a 1:3 rate for splitting a 6-7days old flask can be use. A dilution of 1:5 (SPDV supernatant: medium) is preferred for propagation of the virus than 1:3 or 1:2 dilution.
In an experiment using frozen extracts it was revealed that culture in CHH-1 cells was more sensitive for recovering virus from frozen samples than CHSE-214 cells. The quantification of SPDV (TCID50), with CHSE-214 and CHH-1 cells, shows that until day 7 both cell lines have the same titre value. However after 14 days the titre obtained by CHH-1 cells is higher than that obtained with CHSE-214 cells. This suggests higher infectivity of SPDV to CHH-1 cells than to CHSE-214. Another positive point for using CHH-1 cells for the quantification of SPDV is the fact that it shows a clear cut off point. This is difficult with CHSE-214 cells where there is not always with such consensus between operators. These results with CHH-1 cells led to their in the optimisation of IFAT and In situ hybridisation (ISH) assays. In situ hybridisation One of the aims was to develop an In situ hybridisation assay to show if infection and death occur before antigen expression or not. For the detection of SPDV by ISH targeting the DNA sequence that codes for the structural proteins is ideal due to the fact that they are always present in the virus and
15
they are the proteins with the highest number of copies. The non-structural proteins are present when the virus is replicating inside the cell, and detection is more complicated due to the relative low amount of copies and the short time spam to detect them. The first step for the development of HIS was to produce specific probes. In order to do so specific primers were designed to produce specific PCR products to the structural proteins E1 and E2, and the non-specific proteins nsP3 and nsP4. The RT-PCR was optimised and fragments with 200-300 bp were obtained. The RT-PCR products were cleaned and labelled with Biotin using Photoprobe®biotin (Vector). The labelled product was cleaned up, quantified and was ready to use. The second step was to produce positive and negative samples suitable for the development of this technique. Field samples are not the most suitable due to the fact that is unknown if SPDV is present when the histological lesion can be observed. The positive samples were produced by infecting CHSE-214 and CHH-1 cells with SPDV. Negative samples were produced by using the cells infected with HBSS (Hanks Buffer Saline solution). The flasks with the cells (infected or not) were prepared for paraffin embedding by fixating with 10% Neutral Buffer Formalin, washed with PBS, cells collected and passed through a serial of ethanols and xylene steps. The cells pellets were them embedded in paraffin and a paraffin blocks were prepared. The cells were ready to be used in the development of HIS.
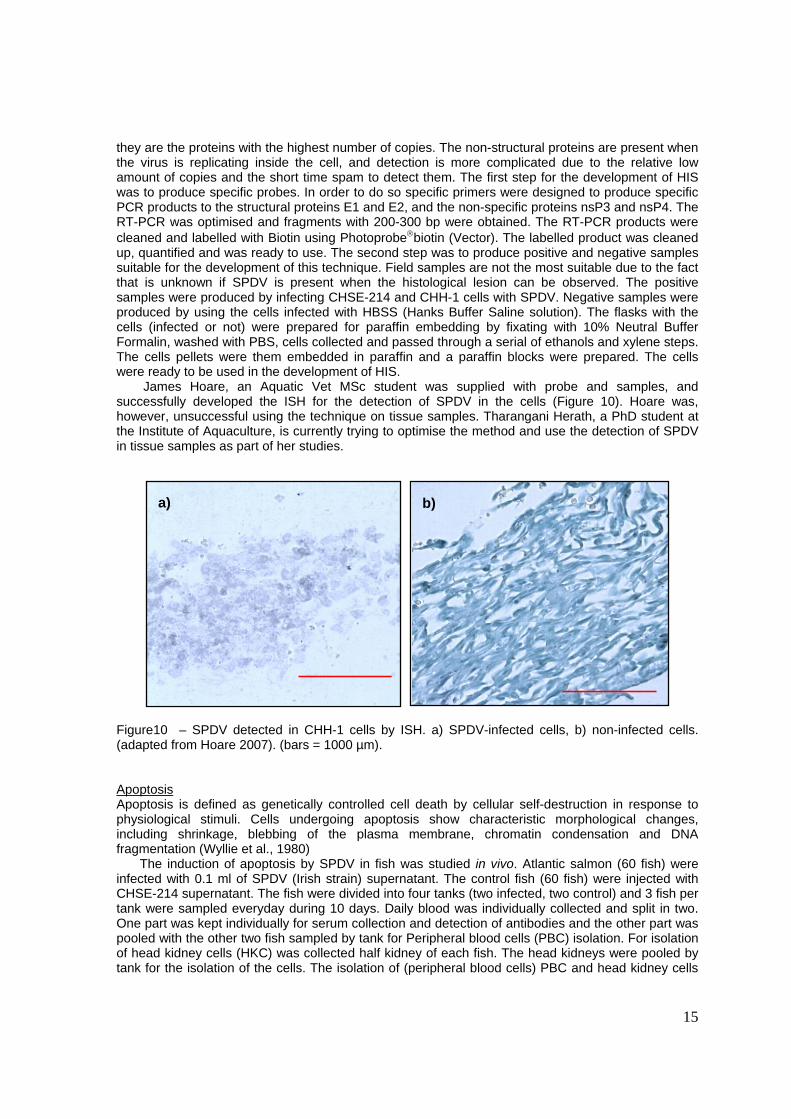
James Hoare, an Aquatic Vet MSc student was supplied with probe and samples, and successfully developed the ISH for the detection of SPDV in the cells (Figure 10). Hoare was, however, unsuccessful using the technique on tissue samples. Tharangani Herath, a PhD student at the Institute of Aquaculture, is currently trying to optimise the method and use the detection of SPDV in tissue samples as part of her studies.
Figure10 – SPDV detected in CHH-1 cells by ISH. a) SPDV-infected cells, b) non-infected cells. (adapted from Hoare 2007). (bars = 1000 µm).
Apoptosis Apoptosis is defined as genetically controlled cell death by cellular self-destruction in response to physiological stimuli. Cells undergoing apoptosis show characteristic morphological changes, including shrinkage, blebbing of the plasma membrane, chromatin condensation and DNA fragmentation (Wyllie et al., 1980)
The induction of apoptosis by SPDV in fish was studied in vivo. Atlantic salmon (60 fish) were infected with 0.1 ml of SPDV (Irish strain) supernatant. The control fish (60 fish) were injected with CHSE-214 supernatant. The fish were divided into four tanks (two infected, two control) and 3 fish per tank were sampled everyday during 10 days. Daily blood was individually collected and split in two. One part was kept individually for serum collection and detection of antibodies and the other part was pooled with the other two fish sampled by tank for Peripheral blood cells (PBC) isolation. For isolation of head kidney cells (HKC) was collected half kidney of each fish. The head kidneys were pooled by tank for the isolation of the cells. The isolation of (peripheral blood cells) PBC and head kidney cells
a) b)

16
(HKC) was performed using a 52% Percoll gradient. For histological analysis the other half of head kidney, half of the heart, spleen, liver, pancreas, muscle and gills were collected into 10% neutral buffered formalin. The detection of apoptosis was divided into two groups - fresh isolated cells by detection annexin V and DNA fragmentation (TUNEL and isolation of genomic DNA); and paraffin embedded samples by detection of DNA fragmentation (TUNEL) and detection of caspace 3 activated (by IHC).
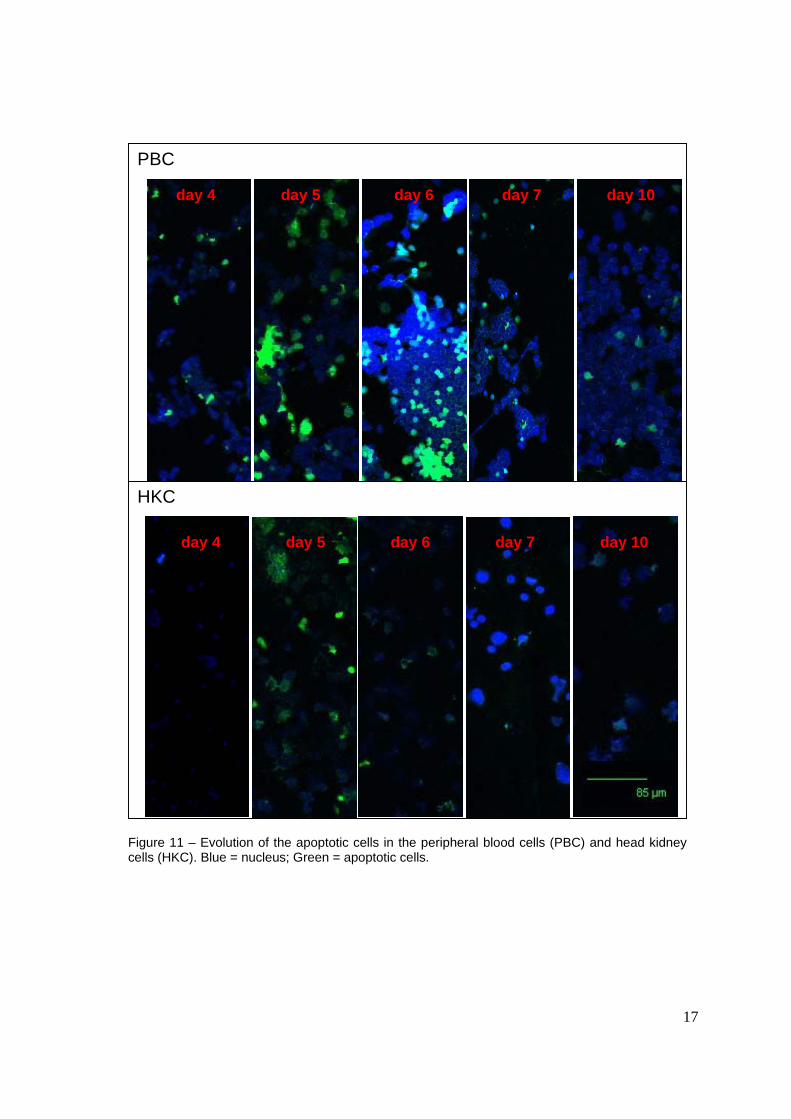
With TUNEL it is possible to observe that apoptotic cells are present at an higher level in PBC than HKC (Figure 11). With the PBC on day 4 is possible to observe the start appearing of apoptotic cells reaching a pick day 5, decreasing from day 6. On day 7 and day 10 the amount of apoptotic cells is almost inexistent. With the HKC is just possible to observe the presence of apoptotic bodies on day 5.
A software program specially designed, for this experiment by Dr. James Bron, Institute of Aquaculture, to automatically analyse and quantify the samples was used to eliminate the bias approach of quantifying the amount of apoptotic cells by human eye. The apoptotic event measured by TUNEL is DNA fragmentation, so it will occur inside the nucleus. The program was design to use the nucleus (dyed with DAPI and acquired on the blue channel) to create a mask. This mask is transposed into the image acquired using the green channel (FITC). All the FITC colour intensity that is inside the nucleus of each cell, in each picture, is measured. By using the mask the quantification of the background green colour was avoided. The data obtained were mean densitometric values amongst all the cells measured in all the samples for a certain day. When analysing the data, it was possible to observe that both infected PBC and infected HKC showed significantly higher mean values than the control fish (P<0.001 when P<0.05) (Figure 12). The highest value was observed for day 3 in both samples. This is possibly due to the fact that when day 3 samples were processed they were no longer at their best. According to manufacture’s instructions the samples should be processed within 2 weeks and day 3 samples were processed after 16 days due to the length of the experiment (10 consecutive days) and availability of Dr. James Bron to operate the Confocal microscope.
The presence of the virus will be detected by IHC using MAb 4I16 and the protocol described above (milestone 2.2). We are waiting for Dr. Brémont to send more MAb in order finish the samples.
The results show that apoptotic bodies are present in the samples and the time schedule accords to that observed for IPNV. Due to the fact that natural apoptosis occurs, the presence of apoptosis needs to be confirmed by complementary methods to DNA fragmentation (TUNEL). Caspaces are the central players in apoptosis. The activation of caspaces initiates the proteolytic activities of downstream effector caspases such as caspace 3. Activated caspase-3 is a central effector of apoptosis that cleaves and inactivates a number of molecules contributing to the typical morphology of apoptosis and leading to the dismantling of the apoptoting cell (Fischer et al., 2003; Wolf and Green, 1999). The detection of activated caspase 3 will be performed by IHC using a Human anti-caspace polyclonal antibody. Reis et al. (2007) has demonstrated that this antibody is suitable for detecting caspace 3 in fish.
The results show that during the first days after an SPDV infection there is an increase in the number of apoptotic cells. However, is this apoptosis induced by the host to prevent virus replication, or is it induced by the virus to avoid the development of antibodies? This could be resolved by determining which genes are up and down-regulated e.g. with genes such as Bcl-2 and Bcl-xL, that help protect the cell from death, or Bax and Bak proteins that promote cell death.
One of the major constrains for cell response studies is the availability of sampled material. Most of the events occurred within the first 10 days, and many of them within a matter of 24 hours between starting and finishing. A “normal” challenge never samples fish daily, so samples for cell response are rare. During this experiment samples were collected daily and material was generated for sequence studies for detection of cells as soon as cell markers will be available. In addition , an interferon (IFN) assay has been developed at the Institute of Aquaculture and the samples collected during this study will be one of the first to be analysed.
17
Figure 11 – Evolution of the apoptotic cells in the peripheral blood cells (PBC) and head kidney cells (HKC). Blue = nucleus; Green = apoptotic cells.
day 4 day 5 day 6 day 7 day 10
PBC
day 4 day 5 day 6 day 7 day 10
HKC

18
Figure 12 – Mean densitometric intensity of the apoptotic cells in the 1) peripherical blood cells (PBC) and head kidney cells (HKC).
The study of cellular defence mechanisms in HSMI and CMS is highly compromised by the fact
that no aetological agents have been isolated. As mentioned in milestone 1 the role of an aetiological agent for CMS is still uncertain. With HSMI the role of a virus as the aetiological agent has been proven. However, the isolation and characterisation have never been successful.
In order to try to study the cells involved in CMS, two approached were used: 1) isolation of single cells from the heart; 2) isolation of endocardial cells.
A) PBC
B) HKC

19
The 1st method for the isolation of heart single cells was based on the procedure to obtain a primary culture from heart cells. Heart tissue was cut into ~1mm2 pieces and was digested with trypsin in DMEM medium. The cells were collected, pelleted by centrifugation; then cell separation was attempted. It was impossible to gather information about the heart cells size and separation methods, so protocols established for separation of blood cells were used instead. The cells were loaded into Percoll® gradients (52% and 52%:36%) and Histopaque®. All of them were shown to be unsuitable and the final product was a mix of cells with very different sizes. Due to the fact that CMS affects the endocardium, this type of cell was the one that we were interested in isolating, having a mix as final product was not suitable for our aims.
The 2nd method was based on the isolation of endocardial cells by digesting the cells from inside with trypsin. In order to do this a catheter was inserted through the bulbus arteriosus into the ventricle. Once the catheter was inside the ventricle, trysin was injected slowly and the ventricle and the atrium filled with trypsin (Figure 13). The valve connecting the atrium and the sinus venosus collapsed due to the volume of trypsin inside the heart. This collapse allowed the trypsin and the cells to emerge and be collected into a Petri dish. The cells obtained were pelleted and analysed by FACS. The results show that the sample was a mix of several different cells but it was not possible to isolate individual populations. The inability to isolate populations made this method unsuitable for the isolation of endocardial cells. Maybe with more time the technique could be optimised and become a very successful technique as has been shown with mammalian heart cells.
Figure 13 – Atlantic salmon heart injected with trypsin for the isolation of endocardial cells.
References
Campbell, A.M. (1984). Monoclonal antibodies technology. The Netherlands, Elsivier Science Publishers B. V., p 265. Dasso, J., Lee, J., Bach, H. and Mage, R.G. (2002). A comparison of ELISA and flow microsphere-based assays for quantification of immunoglobulins. Journal of Immunological Methods 263:23-33. Dean, C. and Shepherd, P. (2000). Preparation of rodent monoclonal antibodies by in vitro somatic hybridization. In: Shepherd, P. and Dean, C., (Eds.). Monoclonal antibodies. Great Britain, Oxford University Press pp. 1-23.

20
Ferguson, H.W., Poppe, T. and Speare, D.J. (1990). Cardiomyopathy in farmed Norwegian salmon. Diseases of Aquatic Organisms 8:225-231. Fischer, U., Janicke, R.U., Schulze-Osthoff, K., 2003. Many cuts to ruin: a comprehensive update of caspase substrates. Cell Death Differ. 10:76–100. Graham D.A., Jewhurst V.A., Rowley H.M., McLoughlin M.F. & Todd D. (2003). A rapid immunoperoxidase-based virus neutralization assay for salmonid alphavirus. Journal of Fish Diseases 26, 407–413. Graham, D.A., Jewhurst V.A., Rowley H.M., McLoughlin M.F. & Todd D. (2005). Longitudinal serological surveys of Atlantic salmon, Salmo salar L., using a rapid immunoperoxidase-based neutralization assay for salmonid alphavirus. Journal of Fish Diseases, 28, 373–379. Harlow, E. and Lane, D. (1988). Antibodies a laboratory manual. U.S.A., Cold Spring Harbor Laboratory, p 726. Hoare, J. (2007). Development of in situ hybridisation for the detection of Salmon Pancreas Disease Virus. Master thesis in Aquatic Vet Studies. Institute of Aquaculture, University of Stirling, Stirling. 34 pages. Hodneland, K.; Bratland, A; Christie, K.E.; Endresen, C. & Nylund, A. (2005). New type of salmonid alphavirus (SAV) Togaviridae, from Atlantic salmon Salmo salar and rainbow trout Oncorhynchus mykiss in Norway. Diseases of Aquatic Organisms 66:113-120. Klebe, R.J. and Mancuso, M.G. (1981). Chemicals which promote cell hybridization. Somatic Cell Genetics 7:473-488. Knutton, S. and Pasternak, C.A. (1979). The mechamisn of cell-cell fusion. Trends in Biochemical Sciences 4:220-223. Köhler, G. and Milstein, C. (1975). Continuos cultures of fused cells secreting antibody of predefined specificity. Science 256:495-497. Liddell, J.E. and Cryer, A. (1991). A practical guide to monoclonal antibodies. Great Britain, John Wiley & Sons Ltd., p 188. Melamed, M.D. and Sutherland, J. (1997). Production of human monoclonal antibodies from B lymphocytes. In: Johnstone, A.P. and Turner, M.W., (Eds.). Immunochemistry 1. Oxford, Oxford University Press pp. 55-82. Nelson, P.N. (2001). Generating monoclonal antibody probes and techniques for characterizing and localizing reactivity to antigen determinants. In: Westwood, O.M.R. and Hay, F.C., (Eds.). Epitope mapping. Great Britain, Oxford University Press pp. 159-197. Nolan, J.P. and Mandy, F.F. (2001). Suspension array technology: new tools for gene and protein analysis. Cellular and Molecular Biology 47:1241-1256. Reis, M.I.R.; Nascimento, D.S.; do Vale, A.; Silva, M.T., dos Santos, N.M.S. (2007). Molecular cloning and characterisation of sea bass (Dicentrarchus labrax L.) caspase-3 gene. Molecular Immunology 44 :774–783. Roitt, I., Brostoff, J. and Male, D. (1985). Immunology. London, Gower Medical Publishing, p 25.10. Seideman, J. and Peritt, D. (2002). A novel monoclonal antibody screening method using the Luminex-100™ microsphere system. Journal of Immunological Methods 267:165-171. Strauss, J.H. & Strauss E.G. (1994). The alphaviruses: gene expression, replication, and evolution. Microbiology Review 58:491-562. Weston, J.; Villoing, S.; Brémont, M.; Castric, J.; Pfeffer, M.; Jewhurst, V.; McLoughlin, M.; Rødseth, O.; Christie, K.E.; Koumans, J. & Todd, D. (2002). Comparison of two aquatic alphaviruses, Salmon Pancreas Disease Virus and Sleeping Disease Virus, by using genome sequence analysis, monoclonal reactivity, and cross-infection. Journal of Virology 76(2):6155-6163. Wyllie A.H.: Kerr, J.F.: Currie, A.R. (1980). Cell death: the significance of apoptosis. International Review Cytology 68:251-306. Wolf, B.B., Green, D.R., 1999. Suicidal tendencies: apoptotic cell death by caspase family proteinases. J. Biol. Chem. 274:20049–20052. Yelton, D.E. and Scharff, M.D. (1981). Monoclonal Antibodies: a powerful new tool in biology and medicine. Annual Review of Biochemistry 50:657-680.