THE ACCELEROMETER PICKUP AS A DIAGNOSTIC …downloads.bbc.co.uk/rd/pubs/reports/1963-37.pdfReport...
15
RESEARCH DEPARTMENT THE ACCELEROMETER PICKUP AS A DIAGNOSTIC TOOL IN NOISE STUDIES IN BUILDINGS Report No. (1963/37 ) - (Wo Proctor Wilson)
Transcript of THE ACCELEROMETER PICKUP AS A DIAGNOSTIC …downloads.bbc.co.uk/rd/pubs/reports/1963-37.pdfReport...

RESEARCH DEPARTMENT
THE ACCELEROMETER PICKUP AS A DIAGNOSTIC TOOL IN NOISE STUDIES IN BUILDINGS
Report No. B~078
(1963/37 )
-(Wo Proctor Wilson)

This Report is tbe property ot tbe British Broadcasting Corporation and aa, Dot be reproduced In any form without the written permIssIon ot the CorporatioD.

Report No, s.,078
THE ACCELEROMETER PICKUP AS A DIAGNOSTIC TOOL IN NOISE STUDIES IN BUILDINGS
Section
L
Title
SUMMARY
INTRODUCTI ON
MOUNTING OF ACCELEROMETER TRANSDUCERS
AMPLIFICATION AND MEASUREMENT
VIBRATION SOURCES,
4,1, Types of Source 4,2, Impact Sources
TYPES OF PROBLEM ,
5.1, Identification of Noise Sources 5,2, Tracing the Transmission Route 5,3, Efficiency of Methods of Isolation SA, Estimation of Expected Sound Pressure Level (SPL) 5.5, Establishment of Vibration Level Criteria 5,6, Sound Insulation of Partitions 00 •
EXAMPLES OF ACCELEROMETER MEASUREMENTS
6,1, Vibration Levels due to Pile~driving 6.2, Comparison of Wall Structures 6,3, Vibration Levels on a Ceiling 6,4. Transmission Loss, 6,5, Vibration Levels in a Wall ,
DISCUSSION
REFERENCES
Page
1
1
2
3
5
5 5
5
5 6 6 7 7. 7
8
8 8 9
10 11
11
12

September 1963 Report No, B-078
0963/37)
TOE ACCELEROMETER PICKUP AS A DIAGNOSTIC TOOL IN NOISE STUDIES IN BUILDINGS
SUMMARY
In this report are discussed the ways in which a piezo~electric accelerometer pickup can be of value in noise studies in studios and associated buildings, Five cases are described briefly ,as examples.
The report is based ona paper presented at the Fourth International Congress on Acoustics held at Copenhagen from 21st to 28th August 1962, It contains some material which, although presented in the lecture, is not included in the printed report of the Congress.
l, INTRODUCTION
<Ate of the functions carried out by the BBC Engineering Research Department is to investigate problems of noise in sound and television studios and to suggest remedies,
There are special difficulties with measurements in the field, notably:
{1} Time is usually very limited
(2) Apparatus needs to be easily transportable'
(3) Working conditions may be very noisy,
Consequently, measurement techniques which quickly produce an indication of the nature of the problem and an order of magnitude are often more useful than those which, while being more accurate, involve much labour and time. The techniques described here are thus mainly of an exploratory nature, often giving only an indi~ cation of the orders involved, although on occasion high accuracy is possible,
Where transmission through air paths is reduced to a minimum, as in broadcasting studios, the sound in a room due to an external noise source is often entirely the result of vibration of the room surfaces, Common exceptions to this arise where interfering sound is transmitted along ventilation trunking and through inadequate door-seals,

2
Ihrect measurement of the amplitude of vibration or of velocity of a surface requires a stable mounting unaffected by sound fields and vibration elsewhere in the enclosure. Measurement of acceleration by means of a piezo-electric elastic element in conjunction with a small mass does not have this disadvantage. The accelerometer found to be most useful is the GEC type E which has barium titanate as the piezoelectric material and weighs about 20 g.
The advantages of such a transducer are:
(a) It will operate on any surface without adjustment.
(b) Its mass produces negligible effect on most surfaces encountered in buildIngs, and the elastic restraint caused by its cable is also negligible.
(c) For a constant velocity-amplitude the output rises with increasing frequency at a rate of 6 dB per octave; this tends to compensate for the lower energy at high frequencies which is characteristic of most noise sources studied, and thus improves the final signal level with respect to electronic noise.
(d) If well designed, it IS very insensitive to direct airborne sound fields.
(e) It is normally very robust.
A disadvantage is that piezo-electric transducers have rather low sensitivities and high noise levels compared with moving-coil devices.
2. MOUNTING OF ACCELEROMETER TRANSDUCERS
The GEC accelerometer is designed to be secured to the surface under test by a stud. \~ere this is not possible, it has been found entirely satisfactory to attach the accelerometer by a pellet of modelling clay; the clay has no measurable effect on the sensitivity of the transducer. An extension of this principle employing a special mounting device has been used where the latter method is not suitable. This device, shown in Fig. 1, consists of a circular duralumin plate (A) of thickness 3 mm and diameter 50 mm, to which the accelerometer (B) is screwed, The front surface of the plate is normally covered with a 2 mm layer of modelling clay which is itself covered with a thin plastic membrane. This assembly is attached to a backplate (C) by three resilient mounts· (0).
The membrane-covered surface of the clay is pressed lightly against the surface to be examined either by hand, or with a sprung lever device which is shown in Fig. 2. With thin panels, care has to be taken that the light spring or hand pressure required do not unduly affect the movements of the surface. With constructional walls and most light partitions, however, the method is reliable and convenient for transferring the movement of a surface to the accelerometer, and the point of measurement· can be changed at intervals of a few seconds if required.
It was found in early experiments with accelerometers that movements of the cable, occasioned by vibration or during adjustment of the position of the accelerometer, set up static charges on the coaxial cable which then produced noise in the system. To prevent this, the braid of the cable under the plastic sheath was treated with a silicone fluid, as recommended by Hole.!

L ~
1 c o
Fig.- 1 - An accelerometer fitted to a mounting for application to a vibrating surface
A Duralumin plate B Accelerometer
3, AMPLIFICATION AND MEASUREMENT
C Back plate D Resilient mounts
3
A
A cathode - follower amplifying stage with an input impedance of 40 megohms is used to link the transducer to a high gain amplifier . The cathode- follower stage has a simple integrating circuit for use when direct measurements of velocity amplitude are required . It is usually found best to record the output of the amplifier for subsequent analysis , using a twin - track tape recorder , The second track may carry a signal from a second accelerometer or a microphone, or it may be used for verbal cues or commentary . When it is necessary to examine signals at frequencies below the working frequency of the recording machine , a suppressed- carrier modulation system may be employed , the carrier being recorded on the second track,
The type of indicator or detector used will depend on the nature of the signal ; it may be an RMS meter , level - recorder , oscilloscope or a peak programme meter (PPM) . Band- pass filters may be incorporated in the analysis chain when broad- band noises are being studied , bandwidths of one octave or one - third octave being most generally used.

4
Fig . 2 - Accelerometer applied to a wall , using sprung-lever device
A barium titanate accelerometer is sufficiently stable to require calibration in the laboratory only at long intervals , If desired , a microphone calibrator of the type employing falling balls as a wideband noise source provides a useful comparative check of sensitivity , the accelerometer being applied to an arbitrarily chosen point on the case of the calibrator ,

5
4. VIBRATION SOURCES
4.1. Types of Source
An interfering noise source may be a steady or varying vibration, or some form of impact.
For experimental work, three types of test signal are commonly used:
1. A continuous tone with or without frequency modulation, particularly used in connection with sound insulation measurements, for which steady conditions are required.
2. Narrow-band or broad-band 'white' noise, employed for the same purposes.
3. Impacts on the surfaces of a building, used for a variety of tests 1n connection with tracing transmission paths through the structure.
4.2. Impact Sources
As a source of impact sound, a standard 'footsteps' machine employing five hammers is often used. Such a machine is shown in Fig. 3 which is a typical experimental arrangement. Where a peak programme meter, as ~pposed to an HMS indicator, is used for measurement, a single hammer-blow repeated at intervals of a few seconds may be suitable. An ordinary hammer held in the hand is satisfactory for some investigations; although appearing to be crude, it does, in fact, provide a substantially stable source of impulsive sound of convenient energy level.
It is desirable, where possible, to mount a second accelerometer close to the striking point of the hammer to provide a control signal. This is especially necessary where there is a risk that the successive blows will damage the surface and consequently change the character of the signal transmitted to the structure.
5. TYPES OF PROBLEM
In practice, the investigation of a particular problem may require measurements of more than one type. Typical cases follow.
5.1. Identification of Noise Sources
An accelerometer may be of value 1n two ways where there 1S a complex noise with a variety of possible sources:
(a) A comparison of sound levels at different parts of the structure may indicate the position of the source of noise.
(b) A comparison of the character of the noise with that of the output of an accelerometer placed on the structure near to various possible sources of noise may indicate which of them is the most important. This method is particularly useful as the sound transmitted by the source into the structure usually differs in character from that radiated into the surrounding air, thus making direct aural recognition difficult.

6
Fig. 3 - Accelerometer in use in conjunction with 'footsteps' machine
5. 2 . Tracing the Transmission Route
Measurements of the relative vibration levels in a structure due to a known source make it possible to decide the relative importance of the various radiating surfaces in an enclosure and o.f the different routes by which energy reaches these surfaces . This leads to efficient remedial measures .
5 . 3 . Efficiency of Methods of Isolation
Measurements are usually required to provide in f ormation regarding the efficiency of specific measures adopted to isolate existing installations , or to determine whether a specified isolation has been achieved and what further measures are likely to be worthwhile . Such measures may include antivibration mountings for various machines , resilient floor coverings , and resilient joints in a building structure . Comparative measurements may be made : (a) on both sides ' of an isolating system; (b) before and after the modification to an existing system; (c) on similar equipment with and without isolating systems .

5.4. Estimation of Expected Sound Pressure Level (SPL)
The need for estimating the SPLto be expected from the vibration amplitude In existing surfaces arises where alterations to the existing internal treatment of a room are to be made. Following Beranek 2 and quoting in terms of c.g.s. units we have:
SPL = 10 log (W/WR ) + 10 log (1/Sx + 4/R) + 30'2 (in dB)
where: R = as/(1 - a) 2
S = Room Area (cm )
W = Power Radiated (Watts)
WR = Reference Power Level
Sx = Radiating Area (cm2
)
-13 (10 Watts)
a = Average Absorption Coefficient
The power radiated will depend on the radiation efficiency of the surface. The maximum radiated power which may be attained with stiff walls having a radiation factor of unity is given by the following formula. (See, for example, Gosele 3.)
where: v = Velocity Amplitude (cm/sec)
p = Density of Air (g/cc)
- c = Velocity of Sound III Air (cm/sec)
For accuracy, many points of observation on the surface are required because of the large variation of vibration amplitude with position usually observed 0
5.5. Establishment of Vibration Level Criteria
Occasions arise when it is necessary'to specify maximum permissible vibration levels generated by equipment, or the maximum vibration amplitudes to which a parti~ cular piece of apparatus, for example, a high-stability oscillator, may be subjectedo
Reference criteria are established by me'asuring levels in existing installations where the 'nuisance value' of the interference is known.
5.6. Sound Insula.tion of Partitions
Estimates of the transmission loss of a partItIon may sometimes be made by means of accelerometer measurements, where other methods cannot be used. For instance, the presence of flanking transmission may invalidate the usual method of measurement and alternative, more complicated, methods may not be available.
The transmission loss is derived frem a comparison of the energy incident on the partition (derived from the measurement of the SPLwith a microphone on the source side) with the energy transmitted on the far side (computed from accelerometer measurements of velocity amplitude, as is done for estimation of SPLdescribed above).
_____________________________ .................. ""_~""""''''''.''''''''·'''',.·.:":.cC7",. ~ ...... _~_. :""' _____ _
8
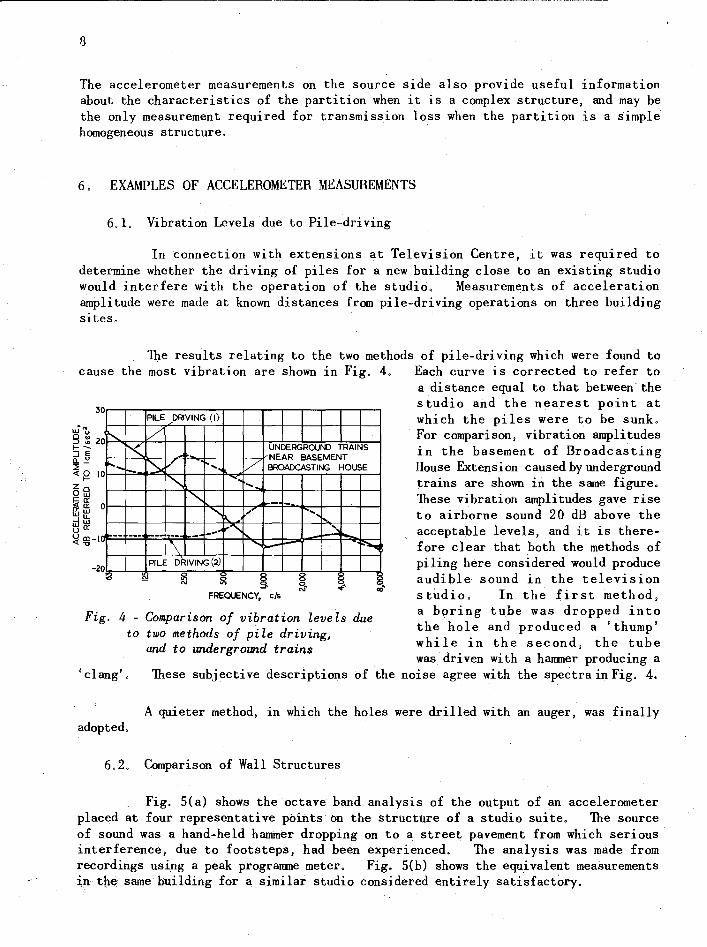
The accelerometer measurements on the source side also provide useful information about the characteristics of the partition when it is a complex structure, and may be the only measurement required for transmission loss when the partition is a simple homogeneous structure, .
6, EXAMPLES OF ACCELEROMETER MEASUREMENTS
6.1. Vibration Levels due to Pile-driving
In connection with extensions at Television Centre, it was required to determine whether the driving of piles for a new building close to an existing studio would interfere with the operation of the studio. Measurements of acceleration amplitude were made at known distances from pile-driving operations on three building sites.
T4e results relating to the two methods of pile-driving which were found to cause the most vibration are shown in Fig. 4. Each curve is corrected to refer to
3
'", UJu g ~ 2 f--:J e ~-«8' Zo QUJ
~lli UJUJ .JlL UJUJ uO:
0 PILE
o~ V'" K
1"-- ~ 0
0
-- --- ~-
a distance equal to that between' the
DRIVING (I}
UNDERGROUND TRAINS NEAR BASEMENT
V ... V BROADCASTING HOUSE
"-., ~~ .......
"'" - -" , ... ~
...... ... --- - -' ~ !l5-' \ I-"" "loo.,,;
studio and the nearest point at which the piles were to be sunk. For comparison, vibration amplitudes in the basement of Broadcasting House Extension caused by underground trains are shown in the same figure • These vibration amplitudes gave rise to airborne sound 20 dB above the acceptable levels, and it is therefore clear that both the methods of piling here considered would produce audible sound in the television studio. In the first method,
-2 0 PILE DRIVING (2)
~ 0 0 g 0 - on 0 0 '" .... 0 .
- N'" ...
FREQUENCY, cl_
Fig. 4 - Comparison of vibration levels due to two methods of pile driving,
and to underground trains
'clang' . These subjective descriptions of
a boring tube was dropped into the hole and produced a 'thump' while in the second, the tube was driven with a hammer producing a
the noise agree with the spectra in Fig. 4.
A quieter method, in which the holes were drilled with an auger, was finally adopted.
6.2. Comparison of Wall Structures
Fig. 5(a) shows the octave band analysis of the output of an accelerometer placed at four representative points on the structure of a studio suite. The source of sound was a hand-held hammer dropping on to a street pavement from which serious interference, due to footsteps, had been experienced. The analysis was made from recordings using a peak progranme meter. Fig. 5(b) shows the equivalent measurements in,the same building for a similar studio considered entirely satisfactory.

5 0 ~MER
50 HA~MER
0 ~
t a -c
4 d Ir b I~d 40
b- ':--d 0
a PAVEMENT
a PAVEMENT"-", ./' '""-... ~ Y ,....
"'" 30
0 \ I I I l/"
V
'" :-- ./' 20
__ b OUTSIDE STUDIO ~/ .... -, ..... ... ... -",
....,~";::,..
~7 j~ 10
.--' r--: ~:' .- ....... \ 0 --<==- L""" ." ..... ---
/c INSIDE STUDIO • ~ b OUTSIDE STUDIO
~..:: L.. -.I-:::-A~·· j,...::': ........ o
....... -~ .... .... ". -I 0 ...... ----- 'd INSIDE STUDIO ----~ ........ '. -10
-2 0", on 0
FREQUENCY. c/s a
~
.'
- 20
'" on
diNNER
0
WALL
0 o on
FREQUENCY, c/s b
'. '.
'. 0
Fig. 5 - Vibration levels due to standard hammer blows on street pavement. Comparison of wall structures of two studios
(a) Unsatisfactory studio (case 1) (b) Satisfactory studio (case 2)
9
Comparing the two sets of curves, there are indications of a difference in construction between the two cases. In case (1) most of the attenuation takes place across the outer wall of the studio, indicating that this is a complex structure with at least one cavity, while in case (2) there is high attenuation between the pavement and the studio wall and none at all across the wall itself, indicating that this is a solid, single-leaf construction.
The existence of an additional part1t10n of building board and plasterboard surrounding the satisfactory studio was discovered from accelerometer measurements which revealed the rapid decrease in vibration level with increase of frequency. A small hole was then cut in the partition to allow measurements to be made on the structural wall.
6.3. Vibration Levels on a Ceiling
Fig. 6 shows the vibration levels on the surfaces of the studio suite described above, the source being a hammer blow on the pavement. The measurements were obtained on newlyconstructed inner partitions 1n the studio and ceiling void, and on the structural and studio ceilings.
FREQUENCY, c/s
Fig. 6 - Vibration levels tn studio due to standard hammer blows on
street pavement (a) Partition in ceiling void (b) Structural ceiling (c) Studio ceiling (d) Partition in studio
10
It was concluded from these measurements, together with measurements of SPL in the studio and void, that:
1. The studio ceiling (c) rather than the studio partItIon (d) was the major contributor to the unwanted sound energy In the studio.
2. At low frequencies, the vibration energy in the studio ceiling (c) was not due to direct transmission from the structural ceiling (b) through the ceiling ties, but to the high sound level In the void, which itself originated mainly in the void partition "(a).
3. At high frequencies, the structural ceiling (b) was the principal source.
4. The attenuation due to the,ceiling ties was at least 25 dB at frequencies of 2 kc/s and above.
It was concluded that no further isolating measures would be economically worthwhile. (It was, however, recommended that heavy density rockwool should be laid on the ceiling in order to reduce the sound level in the void and to damp the vibration In the ceiling itself.)
70
60
ID "SO li 9 z 40 o Uj V)
~ 30 V)
z ii I- 20
10
o '" '0
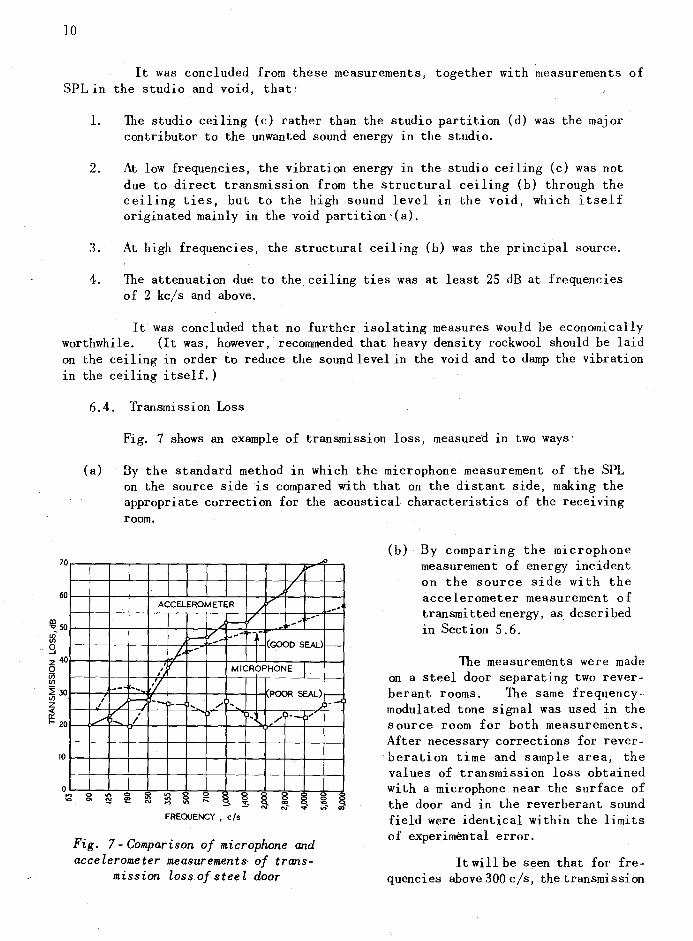
6.4. Transmission Loss
Fig. 7 shows an example of transmission loss, measured in two ways:
(a) By the standard method in which the microphone measurement of the SPL on the source side is compared with that on the distant side, making the appropriate correction for the acoustical characteristics of the receiving room.
I / V
ACCELEROMETER V ,,-
f-- / ---"
." " :>---- 'r ,,' (GOOD SEAL) j~
-"
, MICROPHONE I
I
" -- '1 POOR SEAL) -:::; I >--I / '-., --< " ", ,
.........., J, / -, ", --~ ...
0 on 0 0 on 0 0 ~ 0 0 0 § .,. !l! !!! on on 0 ;::: 0 0 0 N '" on - '" a>
FREQUENCY, c/s
Fig. 7 - Comparison of microphone and accelerometer measurement~ of trans
mission loss of stee l door
0 8 0 '0 0
(b) By comparing the microphone measurement of energy incident on the source side with the accelerometer measurement of transmi tted energy, as described III Section 5.6.
The measurements were made on a steel door separating two reverberant rooms. The same frequencymodulated tone signal was used in the source room for both measurements. After necessary corrections for reverberation time and sample area, the values of transmission loss obtained with a microphone near the surface of the door and in the reverberant sound field were identical within the limits of experimental error.
It will be seen that for frequencies above 300 cls, the transmission

11
loss measured by the accelerometer method was much higher than that indicated by the conventional measurement when the door wa~ fitted with its original sealing system. It increased at a rate of about 9 dB/octave compared with the substantially constant transmission loss derived from microphone level comparison.
This clear indication of the presence of flanking transmission was supported by an examination of the sealing system, which appeared unsatisfactory. Special additional measures were then taken to seal the door temporarily and under these conditions, the conventional measurement gave values approaching the accelerometer values. As successive attempts to carry out the sealing produced appreciable variations in the transmission loss curve, it is considered that the sealing was still not perfect, and the values obtained at high frequencies using the accelerometer probably indicate correctly the transmission loss of the door itself.
6.5. Vibration Levels in a Wall
In Fig. 8 are plotted lines of constant acceleration amplitude, 'vibration contours', for a wall subjected to vibration from a footsteps machine working on a floor above the wall. Thecontours are based on levels obtained from an accelerometer
dB RELATIVE TO I cm/Sllc2
dB RELATIVE TO I cm/ SIlC2
a
Fig. 8 - Vibration. level contours in a wall due to impact machine working on floor above the wall octave-bandwidth
fi 1 ters centrl!d at (a) 500 c/ s (b) 2 kc/ s
applied successively to a large number of positions on the wall. The two contour maps reproduced here refer to octave bands centred at 500 c/s and 2 kc/so
The figure demonstrates first, the large variation that can appear from point to point in a structure for a given octave band. Secondly, by comparing the maps for the two octave bands, it will be seen that their relative contributions also vary greatly from point to point, The change which this implies in the quality of the received signal in moving the accelerometer over the wall was clearly audible through headphones.
The especially high levels in the 2 kc/s octave near the point X s~ggest the presence of an unusual transmission route in this neighbourhood.
7. DISCUSSION
This report is intended principally to review the ways in which an accelerometer may be of service in solving a number of problems which arise in acoustical field work.
"" ----~-

12
The most useful applications are those in which the accelerometer is used in • combination with microphone measurements, particularly for the identification of noise components and their transmission routes. Some of the methods of absolute measure~ ment, such as estimates of sound pressure levels and sound insulation, are potentially very useful, but require to be used with caution in the present state of experience. Such experience can be gained only by the continued use of the technique, and hence one of the purposes of this report is to encourage the acquisition of this experience by engendering confidence in the usefulness of the accelerometer in field investigations,
8, REFERENCES
1. R.D, Hole, 'Noise Generation by Coaxial Cables when Subjected to Vibration'. Electronic Engineering, December 1960, Vol. 32, No. 394, pp. 770 -772.
2. L. Beranek, 'Acoustics', (McGraw Hill, 1954). Chap. X, Art. 10.14.
3. K, GOsele, 'Abstrahlverhalten von Wan den , , Acustica, 1956, Vo!. 6, Beiheft 1, p. 94.
ALG
Printed by B.B.C. Research Department, Kingswood Warren, Tadworth, Surrey