The 2nd National Conference in Toxicology€¦ · Soranun Chantarangsu, DDS, PhD ... The 2nd...
37
Soranun Chantarangsu, DDS, PhD Department of Oral Pathology Faculty of Dentistry, Chulalongkorn University The 2 The 2 nd nd National Conference in Toxicology National Conference in Toxicology
Transcript of The 2nd National Conference in Toxicology€¦ · Soranun Chantarangsu, DDS, PhD ... The 2nd...

Soranun Chantarangsu, DDS, PhDDepartment of Oral Pathology
Faculty of Dentistry, Chulalongkorn University
The 2The 2ndnd National Conference in ToxicologyNational Conference in Toxicology

Variation in drug responseVariation in drug response
• Adverse drug reactions (ADRs) causes more than 2 million hospitalizations, including 100,000 deaths per year in USA
(Lazarou et al., JAMA 1998)
2

Factors influence drug responseFactors influence drug response
AgeAge
GenderGender
DiseasesDiseases
EnvironmentalEnvironmentalfactorsfactorsBody massBody mass
Genetic factorsGenetic factors
DietDiet
CoCo‐‐medicationmedication
3

Single Nucleotide Polymorphism (SNP)Single Nucleotide Polymorphism (SNP)
4
Wildtype
Mutant

5

PubMed hits on the keywords PubMed hits on the keywords ““PHARMACOGENOMICSPHARMACOGENOMICS””and and ““PHARMACOGENETICSPHARMACOGENETICS”” over the past 12 yearsover the past 12 years
(Hansen et al. Clin Pharmacol Ther 2009) 6
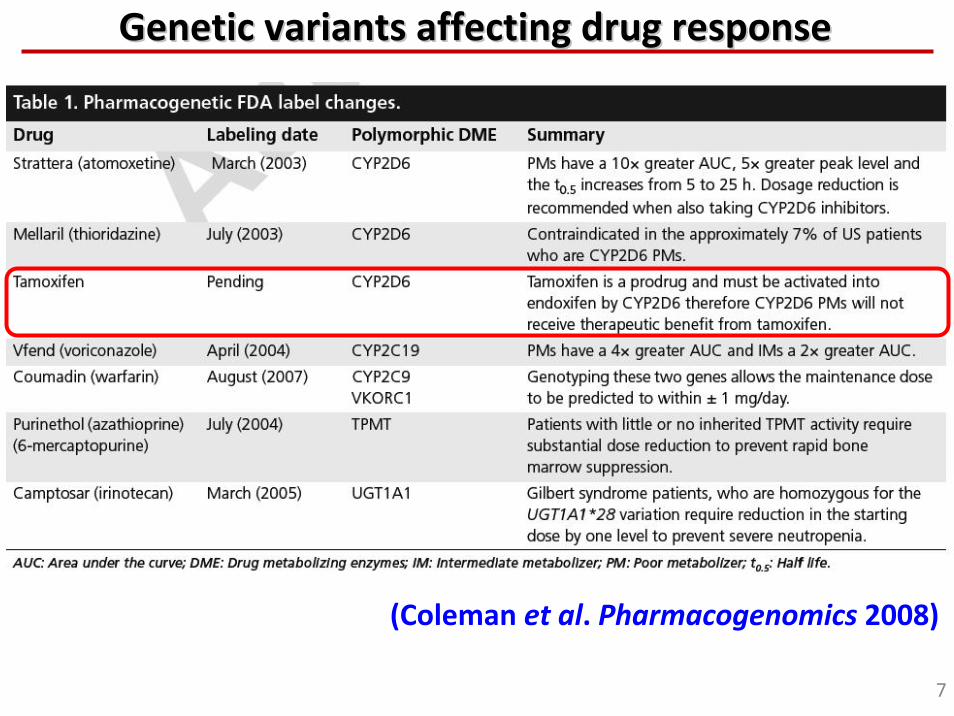
Genetic variants affecting drug responseGenetic variants affecting drug response
(Coleman et al. Pharmacogenomics 2008)
7

Metabolic activation of Tamoxifen by Metabolic activation of Tamoxifen by CYP2D6CYP2D6
(Jin et al. J Natl Cancer Inst 2005)
CYP2D6
CYP2D6
CYP3A4/5 CYP3A4/5
Tamoxifen
Endoxifen(active)
ON
ON
OH
ONH O
NH
OH 8

High frequency of High frequency of CYP2D6CYP2D6*10 in Japanese*10 in Japanese
Allele
CYP2D6*1
CYP2D6*3
CYP2D6*4
CYP2D6*5
Normal
None
None
None
Total
Whole deletion
A2549del
G1846A (splicing defect)
0
0.5
6.1
6.6
Allele freq.in Japanese
(homozygote, <1%)
C100T (P34S)Decreased 40.8CYP2D6*10
9

Effects of Effects of CYP2D6CYP2D6*10 on recurrence*10 on recurrence‐‐free survival of free survival of breast cancer patients treated with Tamoxifenbreast cancer patients treated with Tamoxifen
Years
0
0.2
0.4
0.6
0.8
1
0 2 4 6 8 10
P = 0.0010
Years
0
0.2
0.4
0.6
0.8
1
0 2 4 6 8 10
Recurren
ce‐free rate
P = 0.0031
*10/*10 (n=15)
*1/*10 (n=23)
*1/*1 (n=20)*1/*1+*1/*10
(n=43)
*10/*10 (n=15)
(Kiyotani et al. Cancer Sci 2008)
The genetic test should be mentioned in the label as an “OPTION”
10

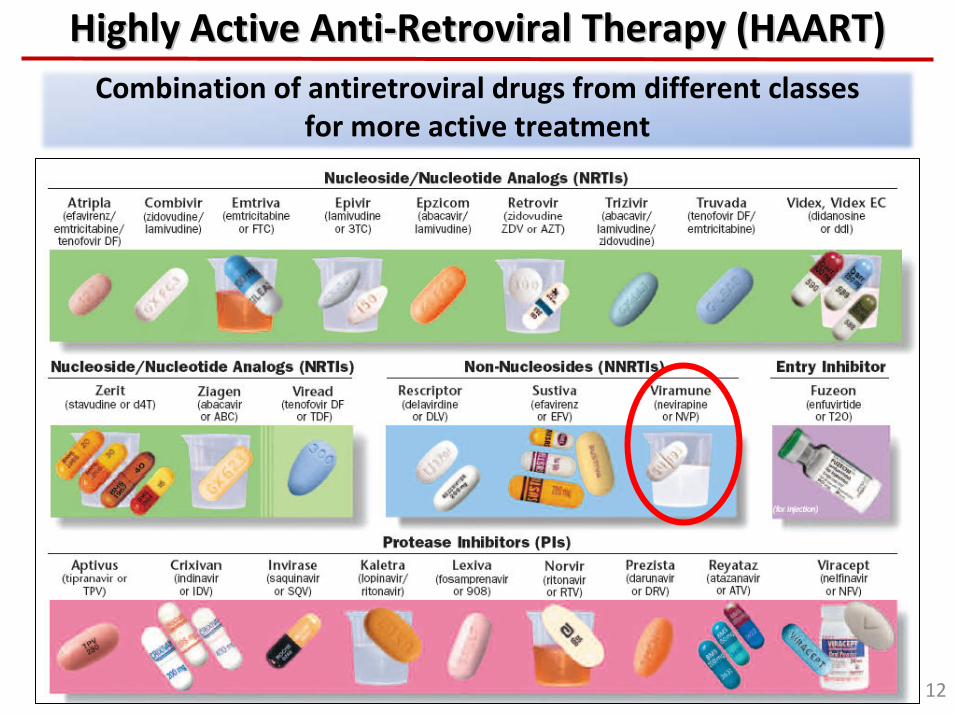
Highly Active AntiHighly Active Anti‐‐Retroviral Therapy (HAART) Retroviral Therapy (HAART) Combination of antiretroviral drugs from different classes
for more active treatment
12

Use of firstUse of first‐‐line antiretroviral drug regimens in adultline antiretroviral drug regimens in adult
77% usage of NVP for first‐line regimen in developing countries
(Renaud‐Thery et al. AIDS 2007)
13

Nevirapine (NVP)Nevirapine (NVP)
• GPO‐vir launched by Thai Government Pharmaceutical Organization (GPO)
Combination of 30/40 mg of stavudine (D4T), 150 mg of lamivudine (3TC) and 200 mg of NVP
• NVP adverse reactionsRash
Hepatotoxicity
• Recommendation of NVP usage
First 2 weeks lead‐in period;Using one 200 mg tablet daily for the first 14 days followed by one 200 mg tablet twice daily
14

NevirapineNevirapine‐‐induced skin rashinduced skin rash
• Rash is the most common ADRinduced by NVP
• Incidence in Thai HIV‐positive patients: 21 ‐ 38%(Ananworanich et al. AIDS 2005)
• Develop rash between 1st – 3rd week of treatment
• Four Grades defined by Division of AIDS, USAGrade 1: Localized macularGrade 2: Diffuse macular / maculopapular / morbilliformGrade 3: Grade 1, 2 + superficial ulcerations Grade 4: Generalized rash; SJS / TEN
• The mechanism of NVP‐related rash is unclear15

Risk factors of nevirapineRisk factors of nevirapine‐‐induced skin rashinduced skin rash
• Female gender
• Initiation of NVP at high CD4 cell count
• Higher plasma NVP‐level
• History of drug allergy
• Body weight
(Kiertiburanakul et al. Curr HIV Res 2008, Anonworanich et al. AIDS 2005de Maat et al. Eur J Clin Pharmacol 2003, Antinori et al. AIDS 2001)
16

HLA & NVP hypersensitivityHLA & NVP hypersensitivity
• HLA‐DRB1*0101 & NVP hypersensitivity in Australian HIV cohort (P = 0.01, OR = 4.8)
• HLA‐DRB1*01 & EFV/NVP induced cutaneous hypersensitivity in French HIV cohort (P = 0.004, OR = 70)
• HLA‐Cw*0802‐B*1402 & NVP hypersensitivity in Sardinian HIV cohort (P = 0.004, OR = 14.6)
• HLA‐Cw8 & NVP hypersensitivity in Japanese HIV cohort (P = 0.03, OR = 6.2)
(Martin et al. AIDS 2005)
(Vitezica et al. AIDS 2008)
(Littera et al. AIDS 2006)
(Gatanaga et al. AIDS 2007)
17

HLA & NVP hypersensitivityHLA & NVP hypersensitivity
NVP‐rash
NVP‐tolerant
NVP‐rash
NVP‐tolerant
1st 76 76 16 (21.1) 1 (1.3) 1.3E‐04 1.2E‐02 20.00 (3.26 ‐ 120.75)2nd 67 105 12 (17.9) 1 (1.0) 5.6E‐05 5.2E‐03 22.69 (3.66 ‐ 138.69)Combined 143 181 28 (19.6) 2 (1.1) 3.8E‐09 3.5E‐07 21.79 (5.62 ‐ 84.03)
OR (95% CI)no. of subject (%)
P1 Pc2All subjects
HLA‐B*3505 frequency in NVP‐rash and NVP‐tolerant control
HLA‐B*3505 is a strong predictor for NVP‐induced skin rash P = 3.8E‐09, Pc = 3.5E‐07, OR = 21.79Sensitivity = 19.6%, Specificity = 98.9%
(Chantarangsu et al. Pharmacogenet Genomics 2009)
18

Single Nucleotide Polymorphism (SNP)Single Nucleotide Polymorphism (SNP)
19
Wildtype
Mutant

ObjectivesObjectives
• Identification of genetic factors associated with NVP‐induced skin rash in HIV infected Thai patients by means of Genome‐wide approach
Illumina platform (550,000 SNPs)
• Development of predictive system for prediction of NVP‐induced skin rash
20

Study populationStudy population
Thai HIV‐positive patientsInfectious Disease Clinic, Ramathibodi Hospital
Bamrasnaradura Infectious Disease Institute
Faculty of Medicine, Srinakharinwirot University
CasesHIV patients who developed rash after treatment of standard NVP
Tolerant controlsHIV patients who received standard NVP more than 6 months without rash
First screening (Panel A) : 80 cases and 80 tolerant controls
Second screening (Panel B): 80 cases and 142 tolerant controls
21

GenomeGenome‐‐wide approachwide approach
First screening72 Cases vs 77 Controls
Second screening88 Cases vs 145 Controls
554,496 tagSNPs (Illumina’s HumanHap550K)
Top 200 SNPs with lowest P‐value(Invader assay, Direct sequencing)
Fine mapping of susceptible region‐ Re‐sequencing of susceptible region
Direct sequencingInvader assay
Defined susceptible region by linkage disequilibrium block
22

Genotyping method: Illumina 550KGenotyping method: Illumina 550K
AA AB BB
23

Patient characteristics (1)Patient characteristics (1)
24
Characteristic NVP‐rash NVP‐tolerant P value(n = 160) (n = 222)
Gender, n (%) 0.097
Male 69 (43.1) 116 (52.3)
Female 91 (56.9) 106 (47.7)
Age (years), median (IQR) 36.2 (31.8‐41.8) 35.4 (30.9‐41.8) 0.45
Body weight (kg), median (IQR) 53 (47‐60) 55 (48.5‐63.5) 0.13
AIDS defining‐illness, n (%) 84 (52.5) 124 (55.9) 0.60
Prescribed lead‐in, n (%) 87 (54.4) 164 (73.9) 0.000091
CD4 cell value at NVP initiation, median (IQR)
CD4 cell count (cells/mm3) 150 (45.8‐246.5) 69 (23‐208) 0.00060
(n = 156) (n = 217)
CD4 percentage 8 (3.3‐14) 6 (2‐11) 0.0064
(n = 154) (n = 213)
Liver function test at NVP initiation, median (IQR)
AST (mg/dL) 30.5 (23‐42.8) 29 (22‐44) 0.60
(n = 78) (n = 113)
ALT (mg/dL) 43.5 (31.8‐64) 42 (31‐57) 0.43
(n = 84) (n = 121)
Total

Patient characteristics (2)Patient characteristics (2)
a Some patients had more than one drug to cause allergy. b Some patients took more than one concomitant drug. 25
Characteristic NVP‐rash NVP‐tolerant P value(n = 160) (n = 222)
History of drug allergy a, n (%) 40 (25) 25 (11.3) 0.00053 Sulfamethozaxole 30 (18.8) 14 (6.3) 0.00027 Dapsone 6 (3.8) 2 (0.9) 0.073 Penicillin 2 (1.3) 1 (0.5) 0.57 Carbamazepine 1 (0.6) 0 (0) 0.42 Anti‐tuberculous drugs 0 (0) 6 (2.7) 0.043 Others 14 (8.8) 7 (3.2) 0.022
Concomitant drugs b, n (%) 87 (54.4) 151 (68) 0.0074 Fluconazole 44 (27.5) 89 (40.1) 0.028 Co‐trimoxazole 47 (29.4) 63 (28.4) 0.82 Dapsone 9 (5.6) 7 (3.2) 0.30 Anti‐tuberculous drugs 10 (6.3) 20 (9) 0.34 Others 6 (3.8) 8 (3.6) 1.00
Time to develop rash (days), 12 (8‐21) Not observedmedian (IQR)
Severity of rash, n (%) Grade 1 13 (8.1) Not observed Grade 2 58 (36.3) Not observed Grade 3 73 (45.6) Not observed Grade 4 11 (6.9) Not observed
Total

554,496 SNPsFirst screening: 80 cases VS 80 controls
QC control1. Autosomal chromosome2. Undetermined SNP (54,756 SNPs)3. P_HWE control ≥ 1.0E‐6 (10 SNPs)
499,730 SNPsFirst screening: 72 cases VS 77 controls
Exclusion of subjects with overall call rate ≤ 0.98
The QQ (quantile‐quantile) plot for all utilized SNPs
GenomeGenome‐‐wide approach: Results (1)wide approach: Results (1)
The genetic inflation factor (λ = 1.019) derived from the GWA study, implied that population stratification have been kept at minimal in this sample sets
λ = 1.019
26

GenomeGenome‐‐wide approach: Results (2)wide approach: Results (2)The Manhattans plot for all utilized SNPs
Replication study: top 200 SNPs with lowest p‐value
27

GenomeGenome‐‐wide approach: Results (3)wide approach: Results (3)
a Major allele in controls was defined as allele 1. Chr; Chromosome, MAF; minor allele frequency
28
Genotyping of 7 SNPs that showed improved pGenotyping of 7 SNPs that showed improved p‐‐valuevalue
SNP Chr GeneAllelesa
(1>2)Panel 11 12 22 MAF 11 12 22 MAF
Risk allele
1 VS 2 11/12+22 12+22/22
rs1265112 6 CCHCR1 A>G A 46 24 2 0.194 69 8 0 0.052 G 1.6E‐04 1.9E‐04 2.3E‐01B 57 31 0 0.176 128 15 2 0.066 2.3E‐04 2.6E‐05 5.3E‐01Combined 103 55 2 0.184 197 23 2 0.061 1.2E‐07 1.2E‐08 1.0E+00
rs746647 6 CCHCR1 T>C A 46 24 2 0.194 69 8 0 0.052 C 1.6E‐04 1.9E‐04 2.3E‐01B 57 31 0 0.176 128 15 2 0.066 2.3E‐04 2.6E‐05 5.3E‐01Combined 103 55 2 0.184 197 23 2 0.061 1.2E‐07 1.2E‐08 1.0E+00
rs9461684 6 13 kb near 3' C>T A 51 20 1 0.153 73 4 0 0.026 T 1.2E‐04 1.1E‐04 4.8E‐01end of HLA‐C B 70 18 0 0.102 136 9 0 0.031 2.0E‐03 1.4E‐03 1.0E+00
Combined 121 38 1 0.125 209 13 0 0.029 3.0E‐07 2.1E‐07 4.2E‐01rs130072 6 CCHCR1 G>A A 52 19 1 0.146 73 4 0 0.026 A 2.3E‐04 2.3E‐04 4.8E‐01
B 73 15 0 0.085 137 8 0 0.028 7.4E‐03 6.0E‐03 1.0E+00Combined 125 34 1 0.113 210 12 0 0.027 1.8E‐06 1.5E‐06 4.2E‐01
rs2073724 6 TCF19 C>T A 52 19 1 0.146 73 4 0 0.026 T 2.3E‐04 2.3E‐04 4.8E‐01B 73 15 0 0.085 137 8 0 0.028 7.4E‐03 6.0E‐03 1.0E+00Combined 125 34 1 0.113 210 12 0 0.027 1.8E‐06 1.5E‐06 4.2E‐01
rs2562519 5 POLR3G A>G A 36 30 6 0.292 17 41 19 0.487 A 1.5E‐04 5.6E‐04 8.6E‐03B 40 38 10 0.330 47 63 35 0.459 6.6E‐03 5.1E‐02 2.5E‐02Combined 76 68 16 0.313 64 104 54 0.477 5.1E‐06 2.4E‐04 4.3E‐04
rs6545803 2 Intergene G>T A 40 25 7 0.271 20 44 13 0.455 G 1.1E‐03 2.6E‐04 2.4E‐01B 39 39 10 0.335 39 82 24 0.448 1.9E‐02 6.9E‐03 3.4E‐01Combined 79 64 17 0.306 59 126 37 0.450 6.5E‐05 5.6E‐06 1.0E‐01
NVP‐rash NVP‐tolerant P value (Fisher's exact test)

GenomeGenome‐‐wide approach: Results (5)wide approach: Results (5)
P = 1.2E‐08
ReRe‐‐sequencing of sequencing of CCHCR1CCHCR1
29
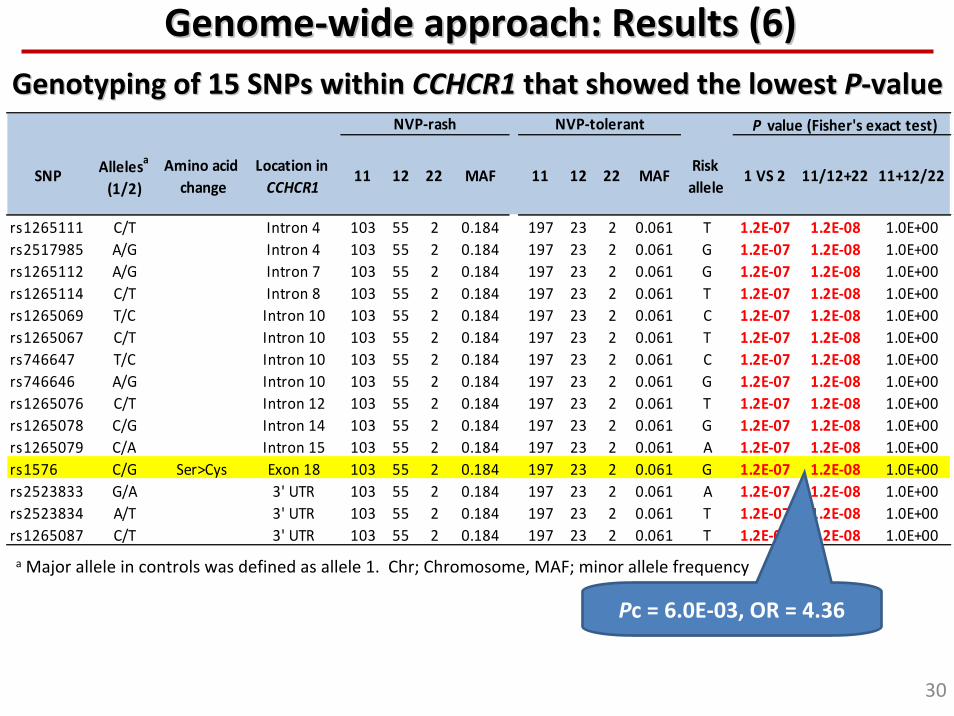
GenomeGenome‐‐wide approach: Results (6)wide approach: Results (6)
a Major allele in controls was defined as allele 1. Chr; Chromosome, MAF; minor allele frequency
30
Genotyping of 15 SNPs within Genotyping of 15 SNPs within CCHCR1CCHCR1 that showed the lowest that showed the lowest PP‐‐valuevalue
SNP Allelesa
(1/2)Amino acid change
Location in CCHCR1
11 12 22 MAF 11 12 22 MAFRisk allele
1 VS 2 11/12+22 11+12/22
rs1265111 C/T Intron 4 103 55 2 0.184 197 23 2 0.061 T 1.2E‐07 1.2E‐08 1.0E+00rs2517985 A/G Intron 4 103 55 2 0.184 197 23 2 0.061 G 1.2E‐07 1.2E‐08 1.0E+00rs1265112 A/G Intron 7 103 55 2 0.184 197 23 2 0.061 G 1.2E‐07 1.2E‐08 1.0E+00rs1265114 C/T Intron 8 103 55 2 0.184 197 23 2 0.061 T 1.2E‐07 1.2E‐08 1.0E+00rs1265069 T/C Intron 10 103 55 2 0.184 197 23 2 0.061 C 1.2E‐07 1.2E‐08 1.0E+00rs1265067 C/T Intron 10 103 55 2 0.184 197 23 2 0.061 T 1.2E‐07 1.2E‐08 1.0E+00rs746647 T/C Intron 10 103 55 2 0.184 197 23 2 0.061 C 1.2E‐07 1.2E‐08 1.0E+00rs746646 A/G Intron 10 103 55 2 0.184 197 23 2 0.061 G 1.2E‐07 1.2E‐08 1.0E+00rs1265076 C/T Intron 12 103 55 2 0.184 197 23 2 0.061 T 1.2E‐07 1.2E‐08 1.0E+00rs1265078 C/G Intron 14 103 55 2 0.184 197 23 2 0.061 G 1.2E‐07 1.2E‐08 1.0E+00rs1265079 C/A Intron 15 103 55 2 0.184 197 23 2 0.061 A 1.2E‐07 1.2E‐08 1.0E+00rs1576 C/G Ser>Cys Exon 18 103 55 2 0.184 197 23 2 0.061 G 1.2E‐07 1.2E‐08 1.0E+00rs2523833 G/A 3' UTR 103 55 2 0.184 197 23 2 0.061 A 1.2E‐07 1.2E‐08 1.0E+00rs2523834 A/T 3' UTR 103 55 2 0.184 197 23 2 0.061 T 1.2E‐07 1.2E‐08 1.0E+00rs1265087 C/T 3' UTR 103 55 2 0.184 197 23 2 0.061 T 1.2E‐07 1.2E‐08 1.0E+00
NVP‐rash NVP‐tolerant P value (Fisher's exact test)
Pc = 6.0E‐03, OR = 4.36

CoiledCoiled‐‐Coil Coil αα‐‐Helical Rod protein 1 (Helical Rod protein 1 (CCHCR1CCHCR1))• Function as a regulator of keratinocyte proliferation and
differentiation(Asumalahti et al. Hum Mol Genet 2002)
• Expressed in many organs and also moderately expressed in skin
• Several association studies suggested a potential role of CCHCR1in the pathogenesis of psoriasis
31
(Chang et al. Br J Dermatol 2004)
rs1576*G allele distribution in Chinese population
Controln = 206
Psoriasis‐alln = 230
Psoriasis‐early onsetn = 120
9.7%
20.4%
30%
% of sub
jects P > 0.05
P = 0.0003, OR = 3.99

32
Multiple logistic regressionMultiple logistic regression
Factors OR (95% CI) P value
HLA‐B*3505 29.04 (10.02‐84.17) 0.00155rs1576*G 2.55 (1.79‐3.63) 0.0080History of drug allergy 2.92 (2.08‐4.11) 0.0016Prescribed lead‐in 0.47 (0.36‐0.63) 0.0075CD4 cell count at NVP initiation,
each 50 cells/mm3 increment1.12 (1.08‐1.16) 0.0033
Association of SNPs in the CCHCR1 gene with NVP‐induced skin rash was independent from that of the HLA‐B*3505 allele
(Pinteraction = 0.98)

33
risk non‐risk risk non‐risk
B*3505 28 115 2 179 3.8E‐09 21.79 (5.62‐84.03) 19.6 98.9 82.7 82.0rs1576*G 57 103 25 197 1.5E‐08 4.36 (2.58–7.36) 35.6 88.7 46.0 83.7B*3505 + rs1576*G 54 89 21 160 3.3E‐08 4.36 (2.63‐8.11) 37.8 88.4 46.7 84.1
Specificity PPV NPVMarkerNVP‐rash NVP‐tolerant
P value SensitivityOR (95% CI)
Predictive values for the prediction of NVPPredictive values for the prediction of NVP‐‐rashrash
PPV and NPV were calculated based on the prevalence of NVP‐induced skin rash of 21.2% in Ramathibodi Hospital.
rs1576*G
rs1576*G

ConclusionsConclusions
• GWAS for NVP‐rash identified marker SNPs in CCHCR1gene that showed the lowest P‐value SNP (P = 1.2E‐08, Pc = 6.0E‐03, OR = 4.36)
• Combination of B*3505 & marker SNPs revealed higher sensitivity than only one marker (P = 3.3E‐08, OR = 4.62, Sensitivity = 37.8%, Specificity = 88.4%)
• Our finding supported
• Significance of pharmacogenomic study
• Development of diagnostic test for prevention of NVP‐induced skin rash especially in Thai population
34

This system requires a drop of blood for genotyping and provides genotype information within 60 minutes
����SNP����1���
A drop of blood
Disposable chip on which all reagents are ready for reaction
Drug X for Mr.A
Drug Y for Ms.B
Time(min)
Strength of fluorescent
�mV
�
G T C A T G G T C A G T C A T C G T C A
Mr.A Ms.B
Development of a fullyDevelopment of a fully‐‐automated SNP genotyping Systemautomated SNP genotyping System( Collaboration with TOPPAN and SHIMADZU )( Collaboration with TOPPAN and SHIMADZU )
Mr.A Ms.B
35

AcknowledgementAcknowledgement• Laboratory of Virology and Molecular Microbiology, Ramathobodi Hospital
Assoc. Prof. Wasun ChantratitaMiss Wantanit PairojMiss Chutatip Srichantaratsamee
Angkana Charoenyingwattana, PharmD• Infectious Disease Clinic, Ramathobodi Hospital
Assoc. Prof. Somnuek Sungkanuparph, MD Assist. Prof. Sasisopin Kiertiburanakul, MD
• Bamrasnaradurs Infectious Disease InstituteWeerawat Manosuthi, MD
• Faculty of Medicine, Srinakharinwirot UniversityAssoc. Prof. Woraphot Tantisiriwat, MD
• Department of Medical Sciences, Ministry of Public HealthSurakameth Mahasirimongkol, MDMiss Sukanya Wattanapokayakit
• Thailand Center of Excellence for Life Sciences (TCELS)• RIKEN Center for Genomic Medicine
Yusuke Nakamura, MD, PhD (Director)Taisei Mushiroda, PhD (Laboratory for Pharmacogenetics)Michiaki Kubo, PhD (Laboratory for Genotyping)Naoyuki Kamatani, MD, PhD (Laboratory for Statistical Analysis)Atsushi Takahashi, PhD (Laboratory for Statistical Analysis)
36

SNP Research Center in RIKEN Yokohama Institute
Thank you for your attentionThank you for your attention