
The 2019 Japan-NewZealand-Taiwan...Ying-Nien Chen P- 15 Long-period surface wave tomography of...
64
4 - 6 November, 2019 4 - 6 November, 2019 Toyako Cultural Center, Hokkaido, Japan The 2019 Japan-NewZealand-Taiwan Seismic Hazard Workshop The 2019 Japan-NewZealand-Taiwan Seismic Hazard Workshop Toyako Toyako
Transcript of The 2019 Japan-NewZealand-Taiwan...Ying-Nien Chen P- 15 Long-period surface wave tomography of...

4 -
6 N
ove
mbe
r, 2019
4 - 6 November, 2019
Toyako Cultural Center, Hokkaido, Japan
The 2019 Japan-NewZealand-TaiwanSeismic Hazard Workshop
The 2
019 J
apan-N
ew
Zealan
d-Taiw
an S
eism
ic H
azard Worksh
op
4 -
6 N
ove
mbe
r, 2019
Toyako Cultural Center, Hokkaido, Japan
The 2
019 J
apan-N
ew
Zealan
d-Taiw
an S
eism
ic H
azard Worksh
op
ToyakoToyako

■Front cover
Distribution of Seismic Intensity of the 2018 Hokkaido Eastern Iburi Earthquake estimated by J-RISQ.
This figure was automatically released in about 10 minutes after the P-wave arrival.
It is based on the more than 400 online seismic records in Hokkaido.
http://www.j-risq.bosai.go.jp/report/en/
■Back cover
Upper left: Hookaido Toyako summit commemorative museum
Upper right: Lake Toya
Lower left: Mount Showashinzan
Lower right: Landslide in Atsuma-town caused by the 2018 Iburi Earthquake
Legend

Abstract Proceedings
4 - 6 November, 2019
Toyako Cultural Center, Hokkaido, Japan
The 2019 Japan-NewZealand-Taiwan
Seismic Hazard Workshop
Probabilistic Seismic Hazard Assessment issues in the isl
and arc of Japan an
d Taiwan


Preface
Welcome to the 2019 Japan‐New Zealand‐Taiwan Seismic Hazard Assessment (SHA) meeting at Lake Toya (Toyako), Hokkaido. This is a third cycle of Group of SHA workshops after the first of 2013 Sendai and the second of 2016 Beppu. The Group of SHA (G‐SHA) workshop initiated by Japan‐China‐Korea strategic program after Wenchuan earthquake, inherited by Taiwan Earthquake Model (TEM) and Japan (NIED) after Tōhoku earthquake, as well as joined by New Zealand (GNS Science) from 2014.
Recently destructive earthquakes occurred in the G‐SHA countries as listed, which hints epistemic uncertainty of probabilistic SHA and sustainability of G‐SHA workshop. 2008 Wenchuan earthquake, China (M=7.9, 87,587 fatalities) 2011 Tōhoku earthquake and tsunami, Japan (M=9.0, 19,689 fatalities) 2011 Christchurch earthquake, New Zealand (M=6.2, 185 fatalities) 2016 Meinong earthquake, Taiwan (M=6.6, 117 fatalities) 2016 Kumamoto earthquake, Japan (Mj=7.3, 273 fatalities) 2016 Kaikoura M7.9 earthquake, New Zealand (M=7.9, 2 fatalities) 2018 Hualien earthquake, Taiwan (M=6.4, 17 fatalities) 2018 Osaka‐Fu Hokubu earthquake, Japan (Mj=6.1, 6 fatalities) 2018 Hokkaido Eastern Iburi earthquake, Japan (Mj=6.7, H=37km, 43 fatalities) 2019 Hualien earthquake, Taiwan (M=6.1, 1 fatalities)
Toyako is near an epicenter of the 2018 Hokkaido Eastern Iburi earthquake which was much deep focus than usual inland earthquakes. We choose it as the G‐SHA workshop venue and try to aware of the complexities of earthquake sources and challenges of the modelling of seismic hazard, especially for the triple countries where the island‐arc of plate boundaries located in. We also arrange a series of field trips for 1) Mt. Usu volcano eruption and damage traces; 2) active fault investigation; and 3) Iburi earthquake landslide damage.
Through this ongoing series of workshops, we aim to sophisticate the topics such as earthquake source characterization, ground motion simulation and prediction, subduction zone modelling and risk assessment. Some newer research topics will also be focus on in this year G‐SHA workshop. Colleagues from Building Research Institute Japan, Yonsei university Korea, USGS, and Global Earthquake Model Foundation (GEM) will share their ideas and participate G‐SHA collaborations.
Conveners Ken XS Hao, Takahiro Maeda & Hiroyuki Fujiwara (NIED) Field Trip Leader Takashi Azuma (GSJ, AIST)
The 2019 G-SHA Toyako Workshop, Japan
Contents
Program on 4 November 2019 ..................................................................ii
Program on 5 November 2019 ..................................................................iii
Program poster session .............................................................................iv
Program on 6 November 2019...................................................................v
Abstract ......................................................................................................1-54
The 2019 G-SHA Toyako Workshop, Japan
ⅰ

AM8:30-9:00 Registration
9:00-9:15 Opening ceremony
Session 1: Current status of Seismic hazard Assessment for each country (1)Chair : Ken Xiansheng Hao
Hiroyuki Fujiwara 9:15-9:30 1A- 1
Matt Gerstenberger 9:30-9:45 1A- 2
Kuo-Fong Ma 9:45-10:00 1A- 3
Coffee break & Poster session
Session 2: Current status of Seismic hazard Assessment for each country (2)Chair : Matt Gerstenberger
Ken Xiansheng Hao 10:50-11:00 1A- 4
Tae-Kyung Hong 11:00-11:15 1A- 5
Chung-Han Chan 11:15-11:30 1A- 6
Nobuyuki Morikawa 11:30-11:45 1A- 7
Group photo 1
Lunch & Poster session
PMSession 3: 2018 Hokkaido Eastern Iburi earthquake
Chair : Asako Iwaki
[Invited] Saeko Kita 13:00-13:30 1B- 1
Asako Iwaki 13:30-13:45 1B- 2
Coffee break & Poster session
Session 4: Active faults and PaleoseismologyChair : Nicol Andy
Nicol Andy 14:30-14:45 1B- 3
Takashi Azuma 14:45-15:00 1B- 4
Sze-Chieh Liu 15:00-15:15 1B- 5
Coffee break & Poster session
16:00
17:00 Reception & Poster session
Location: Toyako Cultural Center
National Seismic Hazard Maps for Japan and its application to improve disasterresilience
Group Discussion G1: PSHA and model validation (Chung-Han Chan and Matt Gerstenberger) G2: Ground motion prediction and site amplification (Hongjun Si and NobuyukiMorikawa) G3: Scenarios and subduction zone modeling (Bill Fry and Yin-Tung Yen) G4: Hazard and risk products (Toshihiro Yamada and Elizabet Abbot) G5: Fault structure and deformation model (Takashi Azuma and Andy Nicol)
Paleo-earthquake records of the Hengchun offshore structure, southern Taiwan
Active fault survey and long-term evaluation of the Shibetsu fault zone, easternHokkaido, Japan
Sampling and variability of recurrence intervals for New Zealand surface-rupturing paleoearthquakes; implications for seismic hazard models
Broadband ground-motion simulation of the 2018 Hokkaido Eastern Iburiearthquake
Spatial distribution of hypocenters of the 2018 M6.7 Hokkaido Eastern Iburiearthquake and its aftershocks with a three-dimensional seismic velocity structure
Recent studies on improvements of models in National Seismic Hazard Maps forJapan
A probabilistic Seismic Hazard Assessment for Taiwan: An update of the TaiwanEarthquake Model in 2019
Aftermath of crustal perturbation and regional seismicity change by the 2011M9.0 Tohoku-Oki megathrust earthquake
Toward Improvement of Seismic Hazard Assessment around Taiwan and Ryukyutrench
Historical earthquakes and dynamic modeling to PSHA
Recent progress and future plans with the New Zealand National Seismic HazardModel
Program on 4 November 2019 (Monday)
The 2019 G-SHA Toyako Workshop, Japan
ⅱ

AMSession 5: Seismic hazard and risk
Chair : Ruey-Juin Rau
Konstantinos Konstantinou 9:00-9:15 2A- 1
Toshihiro Yamada 9:15-9:30 2A- 2
Yiwun Liao 9:30-9:45 2A- 3
Russ Van Disser 9:45-10:00 2A- 4
Session 6: Deformation, Fault displacementChair : Russ Van Disser
Ruey-Juin Rau 11:00-11:15 2A- 5
Ian Hamling 11:15-11:30 2A- 6
Jia-Cian Gao 11:30-11:45 2A- 7
Ray Chuang 11:45-12:00 2A- 8
PMSession 7: Current status of Seismic hazard Assessment for each country (3)
Chair : Bill Fry
[Invited] Mark Petersen13:00-13:30 2B- 1
[Invited] Marco Pagani 13:30-14:00 2B- 2
Session 8: Earthquake, Ground motionChair : Marco Pagani
Hung-Yu Wu 14:45-15:00 2B- 3
Caroline Holden 15:00-15:15 2B- 4
Takahiro Maeda 15:15-15:30 2B- 5
Bill Fry 15:30-15:45 2B- 6
16:15-16:45
Millennial-scale slip rate variations on major strike-slip faults in central NewZealand and examples of potential resulting impacts on hazard estimation
Program on 5 November 2019 (Tuesday)Location: Toyako Cultural Center
The seismic future of the metropolitan city of Athens (Greece)
The Application and the Technical Issue of PSHA
Analysis of aftershocks sequence of M >= 6.0 earthquakes in Taiwan withETAS model
Coffee break & Poster session
Liquefaction-induced ground deformation caused by the shaking of the 2016Meinong earthquake
In search of New Zealand’s hidden faults: towards a high resolution velocityfield from InSAR and GPS observations
Probabilistic Fault Displacement Hazard Analysis : An Example of theHualien area
Working towards integrating geodetic data into PSHA
Lunch & Poster session
Coffee break & Poster session
Dense array ambient noise correlations and seismic reflectivity of themegathrust
Group Discussion G1: PSHA and model validation (Chung-Han Chan and Matt Gerstenberger) G2: Ground motion prediction and site amplification (Hongjun Si andNobuyuki Morikawa) G3: Scenarios and subduction zone modeling (Bill Fry and Yin-Tung Yen) G4: Hazard and risk products (Toshihiro Yamada and Elizabeth Abbot) G5: Fault structure and deformation model (Takashi Azuma and Andy Nicol)
Dinner (ON YOUR OWN)
Coffee break & Poster session
2018 and 2023 U.S. National Seismic Hazard Models
Exploring the Main Characteristics of GEM’s Global Mosaic of HazardModels
Rate and State Seismicity Simulations for Seismic Hazard Analysis in Taiwan
Towards ground motion predictions for a large Hikurangi subductionearthquake: lessons from the Kaikōura earthquake
Broadband ground-motion waveform synthesis utilizing AI-based upsamplingtechnique
The 2019 G-SHA Toyako Workshop, Japan
ⅲ
Name Title
Shao-Yi Huang P- 1 A revisit to the surface expression of the Milun Fault, east Taiwan
Jyr-Ching Hu P- 2Long-term fault slip rates and distributed deformation rates in Taiwan orogenic belt by finite-element kinematicmodel
Yin-Tung Yen P- 3 Re-evaluation of Earthquake Probability Assessment for the Active Faults in Taiwan
Kuan-Yu Chen P- 4 The Significant Fault Sources in Northern Taiwan
Ying-Ping Kuo P- 5 Logic Tree of Fault Models: A Case Study of Hengchun Fault System in Southern Taiwan
En-Jui Lee P- 6 GPU-accelerated Automatic Microseismic Monitoring Algorithm
Yen-Yu Lin P- 7Stress drops for microseismicity in asperity-like dynamic fault models: actual values vs. estimates from spectralfitting and second-moment approaches
Miki Aso P- 8 Focal Mechanisms of LFEs in Parkfield by the amplitude inversion using synthetic waveforms
Kuo-En Ching P- 9 Fault slip deficit rate derived from geodetic data for seismic hazard assessment
Ping-Chen Chiang P- 10 Insight of the surface deformation in the southwestern Taiwan by using PSInSAR technique
Li-Chieh Lin P- 11 Estimation of Coulomb Stress Changes from GPS Surface Displacements in the Taiwan Region
Strong Wen P- 12 Seismogenic characteristics of the plate collision zone: Application of the 2018 Hualien earthquake
Yu-Chih Huang P- 13Seismic disasters and volcanism associate with shallow velocity structures suggested from ambient seismicnoise studies in Tatun Volcano Group and Aso caldera
Jyun-Yan Huang P- 14 Mapping profiled engineering bedrock in Taiwan from low cost dense microtremor survey
Ying-Nien Chen P- 15 Long-period surface wave tomography of Taiwan and Seismic interferometry
Atsushi Wakai P- 16Modeling of Subsurface Velocity Structures in Sedimentary basins for the Tokai region, Japan, for broadbandstrong ground motion prediction
Chun-Te Chen P- 17 Surface topography effects on seismic amplification in Jiu-Jiu peaks of Taiwan
Tae-Kyung Hong P- 18 An updated model of seismic hazard map for the Korean Peninsula
Hongjun Si P- 19Attenuation characteristics of Recent earthquakes occurred in Alaska and Southern California, the UnitedStates of America
Satoshi Shimizu P- 20Spatial Distribution Databases of Ground Motion for the recent earthquakes in Taiwan, New Zealand, Italy andJapan
Ming-Kai Hsu P- 21 Assessing building amplification factor in Taiwan using dense building array
Shohei Naito P- 22Development of the building damage detection model based on the deep-learning utilizing aerial photographsof the plural earthquakes
Caroline Holden P- 23 It's Our Fault research programme: building earthquake resilience for the Wellington region
Hiromitsu Nakamura P- 24Prototype of capital stock model of private enterprises by industry for all of Japan to predict economic damageby earthquakes and tsunamis
Chia-Han Tseng P- 25 Study of factors in distribution and probability of landslides triggered by earthquakes in Taiwan
Yoshinori Tokizane P- 26 Example of long-term volcanic risk assessment in Shikotsu caldera, Hokkaido, Japan
Program Poster Session4-5 November 2019 (Monday - Tuesday)
Location: Toyako Cultural Center
The 2019 G-SHA Toyako Workshop, Japan
ⅳ

AM Chair : Ken Xiansheng Hao, Takahiro Maeda
9:00-11:00 Summary and discussion
Presentation from each Group
G1: PSHA and model validation (Chung-Han Chan and Matt Gerstenberger) G2: Ground motion prediction and site amplification (Hongjun Si and Nobuyuki Morikawa) G3: Scenarios and subduction zone modeling (Bill Fry and Yin-Tung Yen) G4: Hazard and risk products (Toshihiro Yamada and Elizabeth Abbot) G5: Fault structure and deformation model (Takashi Azuma and Andy Nicol)
Group photo 2
12:00 Field trip
Location: Hokkaido Toyako Summit Memorial
Program on 6 November 2019 (Wednesday)
The 2019 G-SHA Toyako Workshop, Japan
ⅴ

1A-1 National Seismic Hazard Maps for Japan and its application to improve disaster resilience
aHiroyuki Fujiwara
aNational Research Institute for Earth Science and Disaster Resilience, Japan, [email protected]
The national seismic hazard maps for Japan (NSHMJ) are prepared to estimate strong
motions caused by earthquakes that could occur in Japan in the future and show the estimated
results on the maps. The hazard maps consist of two kinds of maps. One is a probabilistic
seismic hazard map (PSHM) that shows the relation between seismic intensity value and its
probability of exceedance within a certain time period. The other one is a scenario
earthquake-shaking map (SESM). The 2011 Great East Japan Earthquake (Mw 9.0) was the
largest event in the history of Japan. The 2016 Kumamoto earthquake sequence occurred on
active faults where strong-motion evaluation was executed based on the long-term evaluation
and strong-motion prediction method ‘Recipe’ by the Headquarters for Earthquake Research
Promotion, Japan. Based on lessons learned from these earthquake disasters, efforts to revise
the seismic hazard assessment for Japan are progressing. In order to promote the use of the
national seismic hazard maps, we have developed an open web system to provide information
interactively, and have named this system the Japan Seismic Hazard Information Station
(J-SHIS). This J-SHIS system provides a web mapping system based on open source software
that allows public users to easily view various data by Internet browsers. The system manages
various data in an integrated manner, including provide detail information on seismic hazard
and site amplification models with a 250m mesh resolution, and the deep subsurface velocity
structure models. As a consequence of continuous NSHMJ in the 15-years sustainable mission,
the national seismic risk assessment (NSRA) on building damage in Japan was conducted based
on an accumulated result of NSHMJ. The NSRA results were significantly affected by building
structure and building age. We constructed a sets of NSRA database in a mesh-base of 250m,
consists of number of building, building structure with attributes, building age, and population
accommodation. We then conducted NSRA for the whole of Japan. We also have developed a
real-time earthquake damage estimation system for Japan (J-RISQ) on the basis of the J-SHIS
data with the aim of helping organizations establish a first response system as quickly as
possible in the event of earthquakes.
The 2019 G-SHA Toyako Workshop, Japan
1

1A-2 Recent progress and future plans with the New Zealand National Seismic Hazard Model
a Matt Gerstenberger
a GNS Science, New Zealand, [email protected]
The New Zealand National Seismic Hazard Model (NSHM) has been formally revised
twice in the last 20 years. First in 2002 in a revision that is tied to the current building design
standard and second in a 2012 revision that is used in engineering design, for insurance
purposes and numerous other societal decisions. Importantly the core assumptions and PSHA
methods have largely remained unchanged since 1998. During this period, we have learned a
significant amount about earthquake hazards in New Zealand and our knowledge of how to
model them has vastly improved. Our recent efforts have been around establishing funding for a
short-term revision to get the model to current international standards and then a longer-term
cycle of revisions that will integrate with revisions to the building design standards and
national-scale risk models. We have identified multiple priorities for the revision that include
scientific, procedural and results-delivery improvements. Some of the key topics are: 1) the
development of a New Zealand Community Fault Model; 2) accounting for epistemic
uncertainty in source modelling, including hybrid models and segmentation (e.g., reduction in
reliance on strict segmentation); 3) alternative methods for epistemic uncertainty in ground
motion models, including Sammon’s mapping; 4) validation of ground motion simulation and
understanding of their skill in improving ground motion predictions via data assimilation; 5)
end-user participation in the development of the model to optimise it for their needs and
exploration of, e.g., the trade-off between increased precision and uncertainty for decision
making; 6) use of international participatory review panel; 7) rigorous open documentation; 8)
open and web-based results delivery.
The 2019 G-SHA Toyako Workshop, Japan
2

1A-3 Historical earthquakes and dynamic modeling to PSHA
a, bKuo-Fong Ma,
aEarthquake-Disaster & Risk Evaluation and Management (E-DREaM) Center, National Central
University, Taiwan, ROC, [email protected]
bInstitute of Earth Sciences, Academia Sinica, Taiwan, ROC
Significant crustal damaging earthquakes in Taiwan mostly were from complicated fault
system rather than from a single fault segment, which was not incorporated in the
probability on seismic hazard analysis (PSHA) of Taiwan Earthquake Model (TEM), TEM
PSHA2015. In addition to the 1999 Chi-Chi Taiwan earthquake, we studied the historical
damaging earthquakes as the 1906 M7.1 Meishan earthquake, 1916 M6.8 Nantou
earthquake sequence, and the 1935 M7.1 Hsinchu-Taichung earthquakes to understand
their seismogenic mechanisms, and, thus, hope to incorporate the knowledge from
historical earthquakes for next generation of seismic hazard analysis. For the 1906 Meishan
earthquake, our study shows that this earthquake had been resolved to be from a fault
system of blind NE strike thrust with EW surface breaching fault (one of the identified
seismogenic structures). The 1916 M6.8 Nantou earthquake sequence was resulted from a
buried conjugate seismogenic structure above and below the Orogenic wedge. And, the
1935 M7.1 was occurred with bilateral rupture from a blind fault to strike-slip mechanism
to the south and thrusting mechanism to the north. We employed the rupture kinematic
modeling to the historical geodetic data with comparison to the intensity pattern to
understand the possible involvement of the fault system. These historical and past events
suggest that a single fault segment evaluation for seismic hazard might be inadequate, and
more complicated fault system identification is necessary. From the dynamic modeling of
the 1999 Chi-Chi earthquake, our studies show the importance of heterogenous distribution
of horizontal stress in magnitude, which controls the style of slip distribution, and thus,
might lead to the discrepancy in slip rate estimation along a single fault. The energy
partition in radiated energy, fracture energy, and thermal energy of an earthquake energy
budget from dynamic modeling might suggest that the large slip near the surface might be
from a thermal-dynamic process. This large slip when counted to the slip rate resulted from
plate motion would lead to large uncertainty in slip rate estimation along the fault, and,
also might be the reason of the discrepancy from the values in geodetic and geological
estimated slip rate. We hope to decipher the knowledge we learnt through events to bring
in the next development in probability seismic hazard assessment with more complete
picture from seismo-tectonics to earthquake seismology for seismic hazard assessment and
risk management.
The 2019 G-SHA Toyako Workshop, Japan
3

1A-4 Toward Improvement of Seismic Hazard Assessment around Taiwan and Ryukyu trench
aKen XianSheng Hao and bHiroyuki Fujiwara
aPrincipal Researcher Fellow, National Institute of Earth Science and Disaster Resilience, Japan, [email protected], National Institute of Earth Science and Disaster Resilience, Japan, [email protected]
Taiwan located on the south end of Ryukyu trench and on north end of Philippine trench. Larger earthquakes on both of trenches affect the Taiwan. Regional seismic activities almost dominate their result of probabilistic seismic hazard assessment (PSHA). However, beyond Taiwan margin along Ryukyu trench the seismic activity information is limited. A PSHA epistemic uncertainty could be resulted by its short history of literary and instrumental capability on earthquakes. Earthquake catalog used in Taiwan PSHA model is for M≧4.0 since 1973. On the other hand, earthquake catalog used in the Ryukyu trench PSHA model is limited only JMA dataset from 1983 for M≧5.0 that considered instrumental detection capability of observation network. As a consequence, there are differences of the assessment seismicity rates in the two models as shown in the figure. To reduce the PSHA epistemic uncertainty due to the lack of densification seismic data, we propose a Super-Large geotectonic region to mean the existed annual rate of earthquakes obtained from both of Taiwan and the Ryukyu islands L-3. We are looking forward to work together with Taiwan Earthquake Model to carry on a collaborative research. Thanks Chung-Han Chan’s courtesy for the figure.
Keywords: Probabilistic Seismic Hazard Assessment, seismicity, Ryukyu, Taiwan
The 2019 G-SHA Toyako Workshop, Japan
4
1A-5 Aftermath of crustal perturbation and regional seismicity change by the 2011 M9.0 Tohoku-Oki megathrust earthquake
a Tae-Kyung Hong, b Junhyung Lee, c Seongjun Park, d Ilgoo Kim, and e Woohan Kim
a Yonsei University, Seoul, South Korea, [email protected]
b Yonsei University, Seoul, South Korea
c Yonsei University, Seoul, South Korea
d Yonsei University, Seoul, South Korea
e Gyeongsang National University, Jinju, South Korea
A megathrust earthquake produces large coseismic and postseismic lithospheric
displacements. The 2011 M9.0 Tohoku-Oki megathrust earthquakes produced large
displacements up to regional distances. The lithospheric displacements directing to the
epicenter on the convergent plate boundary developed transient uniaxial tension field over the
backarc lithospheres. The Vp/Vs changes display characteristic 2 theta azimuthal variations in
the upper crust of the Japanese islands, ranging between -0.0458 and 0.0422. Large lateral
variations in Vp/Vs changes suggest medium-dependent perturbation. The lower crust of the
Korean Peninsula in distances of ~1300 km displayed coseismic velocity changes of 3 % after
the megathrust earthquake. The Vp/Vs ratios and seismic velocities recovered gradually over
time. Peak Vp/Vs and seismic velocity changes were observed along paths subparallel or
subperpendicular to the directions toward the megathrust earthquake. The azimuthal seismic
anisotropy may have developed from preferential crack orientation and azimuthal lithostatic
stress changes. The recovery of the medium properties may take decades. A series of
moderate-sized earthquakes occurred as a consequence of medium response to the temporal
evolution of stress field in the Korean Peninsula. The distance-dependent coseismic and
postseismic displacements caused medium weakening and stress perturbation in the crust, and
increased the seismicity with successive M5-level earthquakes in the Korean Peninsula. The
average M5-level occurrence rate prior to the megathrust earthquake was ~0.15 yr-1 at a 95 %,
and the rate has increased to 0.71 yr-1 since the megathrust earthquake. The increased seismic
risks may continue until the medium properties and stress field are recovered.
The 2019 G-SHA Toyako Workshop, Japan
5

1A-6 A probabilistic Seismic Hazard Assessment for Taiwan: An update of the Taiwan Earthquake Model in 2019
a Chung-Han Chan, b,c Kuo-Fong Ma, J. d Bruce H. Shyu, e,f Ya-Ting Lee, g Yu-Ju Wang,
h Yin-Tung Yen, and i Ruey-Juin Rau a Earth Observatory of Singapore, Nanyang Technological University, Singapore, [email protected] b Earthquake-Disaster & Risk Evaluation and Management (E-DREaM) Center, National Central University,
Taiwan, [email protected] c Department of Earth Sciences, National Central University, Taiwan d Department of Geosciences, National Taiwan University, Taiwan, [email protected] e Earthquake-Disaster & Risk Evaluation and Management (E-DREaM) Center, National Central University,
Taiwan f Department of Earth Sciences, National Central University, Taiwan g Department of Nuclear Backend Management, Taiwan Power Company, Taiwan hSinotech Engineering Consultants, Inc., Taiwan, [email protected] i Department of Earth Sciences, National Cheng Kung University, Taiwan, [email protected]
The Taiwan Earthquake Model (TEM) has published the first version of Taiwan probabilistic
seismic hazard assessment in 2015. That assessment was for the ground motion based of
engineering bedrock with regional and subduction inter- and intra-slab seismicity, and
individual rupture of the thirty-eight crustal seismogenic structure. This updated assessment
considered up to date seismogenic structure database, including six newly identified structures
with three-dimensional geometry, an updated earthquake catalogue to 2016, state-of-the-art
seismic models, and site amplification factors. Current seismic model includes possibility of
earthquake on multiple seismogenic structures with potential for a larger earthquake. To
include fault memory on some seismogenic structure sources with earthquake records, we
incorporated the Brownian Passage Time model. For the crustal seismicity that cannot be
attributed to any specific structure, we modelled their spatial distribution through both area
source and smoothing kernel into logic tree.
Our assessments include two versions of hazard maps that based on engineering bedrock and
VS30 (shear-wave velocity in the upper most 30 meters) of each calculation site. These two
hazard maps would be beneficial to engineering purpose and could be easily accessed by
laymen without science and engineering background, respectively. In addition, our database
and approach could be further implemented for detailed hazard or risk assessments on
infrastructures of interest, such as nuclear power plants.
The 2019 G-SHA Toyako Workshop, Japan
6
1A-7 Recent studies on improvements of models in National Seismic Hazard Maps for Japan
a Nobuyuki Morikawa, b Hiroyuki Fujiwara and c Jun’ichi Miyakoshi
a National Research Institute for Earth Science and Disaster Resilience, Japan, [email protected]
b National Research Institute for Earth Science and Disaster Resilience, Japan, [email protected]
c Ohsaki Research Institute, Inc., Japan
In this paper, we introduce recent studies on improvements of models in National Seismic
Hazard Maps for Japan (NSHMJ).
The focal depth (H) of the Hokkaido Iburi Earthquake (M6.7) that occurred in September
2018 was about 40 km, and deeper than the usual crustal earthquakes in Japan. Although it was
previously known that some small earthquakes occurred at a depth of about 40 km in that area,
central Hokkaido, we did not modeled them in NSHMJ. On the other hand, on the southeast
side of that area, apart from the both of shallow crustal and subduction earthquakes based on the
1982 Urakawa-oki earthquake (M7.1, H=40km), we have already modeled background
earthquakes with a depth of 25 to 45km. Therefore, we add areas of background earthquakes
same as the Urakawa-oki earthquake to the central Hokkaido where seismic activity can be seen
up to a depth of about 40km.
A large earthquake (M7.4) that occurred in the Pacific Ocean off Fukushima in November
2016 was a shallow crustal event (H=25km). However, all earthquakes in the Pacific Ocean
region have been modeled as subduction earthquakes, plate-boundary and intra-slab
earthquakes, in NSHMJ. For this issue, we add new region in the Pacific Ocean region of
background shallow crustal earthquakes. And we separate shallow crustal earthquakes from
subduction earthquakes.
In order to promote the engineering use of NSHMJ, we estimate the seismic hazard
assessment for the response spectrum. In this study, we apply three ground motion prediction
equations (GMPEs) individually. There is a large difference in the results depending on the
equation. The difference is greatly influenced by the ground motion prediction results with
extremely few records such as mega-earthquakes or near-source region. However, one of the
most important factors causing such a large difference is that individual databases have been
built for each Japanese GMPE, and the definition of ground motion index and processing
procedures of waveform records have been not unified.
The 2019 G-SHA Toyako Workshop, Japan
7

1B-1[Invited] Spatial distribution of hypocenters of the 2018 M6.7 Hokkaido Eastern Iburi earthquake and its aftershocks with a
three-dimensional seismic velocity structure
a Saeko Kita
a Building Research Institute, [email protected]
Hypocenters of the 2018 M6.7 Hokkaido Eastern Iburi earthquake and its aftershocks were
relocated using a three-dimensional seismic structure of Kita et al. [2012] and the JMA
earthquake catalog. The relocation results show that the focal depth of the mainshock became
35.4 km and its aftershocks are distributed at depths of approximately 10 to 40 km within the
lower crust of the anomalous deep and thickened curst near the uppermost mantle material
intrusions in the northwestern edge of the Hidaka collision zone. The anomalous deep and
thickened crust is formed due to the collision process of the northeastern Japan and Kuril arcs
since Miocene.
Like the two previous large events, the aftershocks of this event incline steeply eastward
and appear to be distributed in the deeper extension of the Ishikari-teichi-toen fault zone. The
aftershocks at depths of 10 to 20 km are located at the western edge of the high attenuation
(low-Qp) zone. These kinds of relationships between hypocenters and materials are the same as
the previous M~7 two events (the 1970 and 1982 events in the Hidaka collision zone). The
anomalous large focal depths of these large events compared with the average depth limit of
inland earthquakes in Japan could be caused by the locally lower temperature in south-central
Hokkaido. M7 class inland earthquakes have occurred beneath the Hokkaido collision zone
approximately every 40 years, including several 1930s, the 1970 and the 1982 event
s[Ichikawa, 1971]. This 2018 event is one of the M~7 large inland earthquakes that occurred
repeatedly at a recurrence interval of ~40 yrs and is important in the collision process in the
Hidaka collision zone.
References Ichikawa, M. (1971), Reanalysis of the mechanisms of earthquakes which occurred in and near Japan and
statistical studies on the nodal plane solu- tions obtained, 1926–1968, Geophys. Mag., 35, 207–273. Kita, S., A. Hasegawa, J. Nakajima, T. Okada, T. Matsuzawa, and K. Katsumata (2012), High-resolution seismic
velocity structure beneath the Hokkaido corner, northern Japan: Arc-arc collision and origins of the 1970 M 6.7 Hidaka and 1982 M 7.1 Urakawa-oki earthquakes, J. Geophys. Res., 117, B12301, doi:10.1029/2012JB009356.
The 2019 G-SHA Toyako Workshop, Japan
8

1B-2 Broadband ground-motion simulation of the 2018 Hokkaido Eastern Iburi earthquake
a Asako Iwaki, b Hisahiko Kubo, c Nobuyuki Morikawa, d Takahiro Maeda,
and e Hiroyuki Fujiwara
a National Research Institute for Earth Science and Disaster Resilience, Japan, [email protected] b National Research Institute for Earth Science and Disaster Resilience, Japan c National Research Institute for Earth Science and Disaster Resilience, Japan, [email protected] d National Research Institute for Earth Science and Disaster Resilience, Japan, [email protected] e National Research Institute for Earth Science and Disaster Resilience, Japan, [email protected]
The 2018 Hokkaido Eastern Iburi earthquake (MJMA=6.7) was an inland crustal earthquake at
a focal depth of approximately 35 km. This earthquake brought strong ground motion to the
southern Hokkaido, causing JMA seismic intensity of 6+ and 7 above the fault and nearby, and
6- in the city of Sapporo.
The seismicity around the source region reaches to deeper region compared to other inland
areas in Japan (HERP, 2018). Inland crustal earthquakes at this depth have not been considered
by the current ground-motion prediction procedure in Japan. Therefore it is necessary to
examine whether the strong ground motion from this earthquake can be modeled by the
conventional procedure.
We conducted broadband ground-motion simulation using the characterized source model
based on the “recipe” for strong motion prediction (HERP, 2017), aiming to reproduce the
observed ground motion. A planner fault is set referring to the fault slip model by Kubo et al.
(2019, EPS) in the lower crust, in which the rupture starting point is set to 35 km, and a single
asperity is set several km shallower than the rupture starting point on the fault plane. Source
parameters are derived by the recipe for inland crustal earthquakes. Broadband ground motion
time-series on the engineering bedrock is computed by a hybrid technique of the 3D
finite-difference method (Aoi et al. 2004) and the stochastic Green’s function method (Dan and
Sato 1998) superposed in time domain at the period of 1 s.
After examining several source and attenuation parameters, it was found that the ground
motion computed with higher value of short-period level (A) compared to the empirical relation
for the ordinary inland crustal earthquake was more consistent with the observed ground
motion. It maybe reflecting the feature of the earthquake source characterized by the depth or
the tectonic condition.
Acknowledgments: We used strong motion data provided by JMA, Hokkaido, the city of
Sapporo, and NIED.
The 2019 G-SHA Toyako Workshop, Japan
9

1B-3 Sampling and variability of recurrence intervals for New Zealand surface-rupturing paleoearthquakes; implications for seismic hazard
models
a Andy Nicol, b Russ Van Dissen and c Russell Robinson
a School of Earth and Environment, University of Canterbury, Christchurch 8020, New Zealand,
[email protected], b GNS Science, PO Box 30368, Lower Hutt, New Zealand, [email protected] c GNS Science, PO Box 30368, Lower Hutt, New Zealand
Recurrence intervals (RI) for successive earthquakes on individual faults is a key parameter
for seismic hazard analysis. These recurrence intervals are most often recorded by paleoseismic
datasets primarily derived from trenching fault scarps and dating displaced stratigraphy. The
available data are point samples that record the largest earthquakes on individual faults (in New
Zealand >Mw ~6 to 7.2). They become increasingly incomplete with age and, in some cases,
could have been generated by events that ruptured multiple faults. In this talk we will consider
how sampling of paleoearthquakes and variations in RI arising from fault interactions impact
our understanding of these earthquakes and how they could be better incorporated into seismic
hazard models. We will draw upon data and synthetic seismicity models for over 100 New
Zealand active faults with average RIs of ~130 to 8500 yrs and slip rates of ~1-30 mm/yr. These
data and models indicate that RI for individual faults can vary by more than an order of
magnitude with coefficient of variations (CoV) of 0.2 to 1 (mean of 0.6±0.2). Elapsed time
since the last event is generally less than the average RI on individual faults, suggesting that the
faults sampled are in active phases of their earthquake histories and/or that average RI is often
overestimated. Such increases in estimated RI would be expected for sample incompleteness
which maybe only partly countered by double counting of events due to co-rupture of multiple
faults.
Despite these sampling issues RI for the best paleoseismic data and earthquake simulations
are described by log-normal or Weibull distributions with long recurrence tails (~three times
the mean) and provide a basis for quantifying actual RI variability (rather than sampling
artefacts). Analysis indicates that CoV of RI is negatively related to fault size (e.g., slip rate).
These data are consistent with the notion that fault interaction and associated stress
perturbations arising from slip on larger faults are more likely to advance or retard future slip on
smaller faults than visa versa. Some of these interactions may occur during earthquakes that
rupture many faults.
After sampling artefacts have been accounted for, RI data can be estimated in seismic hazard
models using a combination of probability density functions, elapsed times, slip rates and
lengths for individual faults.
The 2019 G-SHA Toyako Workshop, Japan
10
1B-4 Active fault survey and long-term evaluation of the Shibetsu fault zone, eastern Hokkaido, Japan
a Takashi Azuma
a Geological Survey of Japan/AIST, Japan, [email protected]
We conducted paleoseismological trenching survey on the Shibetsu fault zone in 2018. This fault
zone is one of major fault zone in Japan selected by HARP, although no fault parameter, such as slip rate
and recurrence intervals, were not recognized. We obtained new data of faulting events in Holocene and
the last Pleistocene period of this fault zone by trenching and drilling survey.
Shibetsu fault zone is composed with 4 segment of reverse fault trending NE-SW and is 52 km in
length. Topographic analysis based on detailed digital elevation model by LiDAR survey shows a new
fault trace on the late Pleistocene fluvial terrace.
We made a paleoseismological trenching on that fault trace with size of 28 m in length, 12 m in width
and the maximum depth was 7 m.
We observed black soil, pumice, fine sand and gravels on the trench walls. Black soil has ca. 0.5 m
thickness and its upper part was disturbed by cultivation. Two of pumice layers were recognized in the
trench. Upper pumice is correlated with Ma-ghi and lower pumice is Ma-l based on mineral composition
and refractive index of volcanic glass. Volcanic ash and scoria in fine sand layer were not correlated with
recognized tephra in catalog. Lower part of fine sand layer was deformed by freeze-thaw process during
the last glacial maximum period.
Amount of displacement of bottom of the lower pumice layer is ca. 15 cm in vertical, whereas height
difference of top of gravel layer is 2.6 m in vertical based on drilling data. Samples for 14C dating were
picked up from black soil and fine sand layer. Result of 14C dating gave the age of the last faulting event
as between 13,793 cal BP and 7,939 cal BP.
The 2019 G-SHA Toyako Workshop, Japan
11
1B-5 Paleo-earthquake records of the Hengchun offshore structure, southern Taiwan
a Sze-Chieh Liu, b J. Bruce H. Shyu, c Yuan-Lu Tsai and de Chuan-Chou Shen
a Department of Geosciences, National Taiwan University, Taiwan, [email protected]
b Department of Geosciences, National Taiwan University, Taiwan, [email protected]
c Department of Geosciences, National Taiwan University, Taiwan
d Department of Geosciences, National Taiwan University, Taiwan
e High-precision Mass Spectrometry and Environment Change Laboratory (HISPEC), Department of Geosciences,
National Taiwan University, Taiwan
In the southernmost part of Taiwan, the Western Hengchun Tableland is a prominent
topographic feature, with several steps of late Pleistocene marine terraces forming the top of the
eastward tilting tableland, and uplifted Holocene coral reefs along the coast. To interpret the
formation of this tableland, an inferred Hengchun offshore structure has been proposed as an
active structure located offshore to the tableland’s west. However, the presence of this structure
is still under debate, since no record of paleo-earthquakes related to this structure has been
identified. In this study, we utilized fossil coral microatolls as paleo-sea-level indicators to
identify possible paleo-earthquake records produced by this structure. The highest level of
survival (HLS) of corals is limited by the low tide level. Once living corals grow to this level,
the upward growth will stop and they will grow outward instead, forming microatoll
morphology with a flat top surface. If microatolls were uplifted and killed by co-seismic uplift,
the elevation difference between microatolls and the HLS would represent the amount of uplift,
and the age of the coral would constrain the age of the earthquake event. In our field survey, we
identified uplifted Porites coral colonies at six sites along the coast, and found that they can be
separated into several groups. Based on our field survey data and U-Th dating results of
uplifted corals, we reconstructed a coastal uplift history of the area, and proposed several
paleo-earthquake events in the past 2,500 years. These results enabled us to further understand
the seismogenic properties and the possible earthquake recurrence intervals of the Hengchun
offshore structure.
The 2019 G-SHA Toyako Workshop, Japan
12

2A-1 The seismic future of the metropolitan city of Athens (Greece)
a K. I. Konstantinou, b V. Mouslopoulou, c V. Saltogianni
aDepartment of Earth Sciences, National Central University, Jhongli, 320 Taiwan, [email protected] bInstitute of Geodynamics, National Observatory of Athens, POB 20048, 11810 Athens, Greece cGFZ, Telegrafenberg, 14473 Potsdam, Germany
The existence of active faults near large cities poses significant risk to the life and property of its
inhabitants as well as to its public infrastructure. Here, we investigate the interplay between active
faulting, seismicity patterns and interseismic strain accumulation within a radius of 50 km around the
metropolitan area of Athens, the capital of Greece. We find that, during the period 2011-2018, a total of
4722 earthquakes occurred, the majority of which had local magnitudes < 3.0, with only four events
being of moderate magnitudes (ML 4.1-4.3). Precise relative locations, with horizontal and vertical
errors of < 1 km and 2 km, respectively, were calculated for 2666 of these events using the double-
difference algorithm hypoDD. Earthquake relocation was complemented by geodetic strain-rates that
derived from 30 permanent GPS stations and a database of 80 active (n=26) or possibly active (n=54)
faults that derived from analysis of high-resolution (5 m) digital elevation models. Comparison of the
above datasets shows that the majority of microseismicity clusters along faults of non-resolvable
postglacial activity (~16 kyr), while most of the faults which are associated with impressive postglacial
scarps and historic seismicity appear to be seismically quiet. Nevertheless, GPS data indicate that both,
faults with and without postglacial activity, currently accumulate elastic deformation that ranges, for
individual faults, from 0.5 to 1.5 mm/yr. These values are consistent with measurements that derive
from the geology and suggest that more than 50% of the mapped faults (n=52) are capable of
generating earthquakes of magnitudes between 6.0 and 6.5. Thus, in addition to the known active fault
sources, the metropolitan area of Athens may accommodate additional seismic sources which, despite
the fact that they are mainly characterized by long earthquake-recurrence intervals, are currently
associated with intense microseismicity and elastic strain accumulation, signifying the need for future
investigations on their seismogenic potential.
The 2019 G-SHA Toyako Workshop, Japan
13
2A-2 The Application and the Technical Issue of PSHA
a Toshihiro Yamada
a OYORMS Corporation, [email protected]
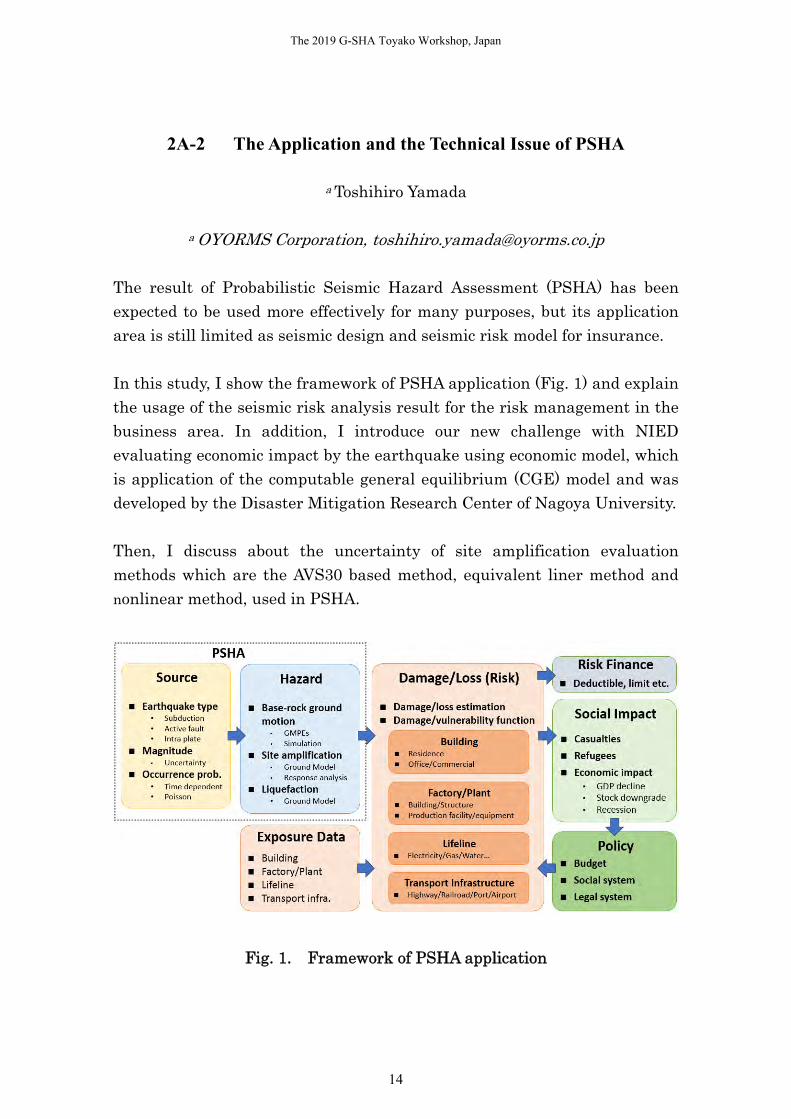
The result of Probabilistic Seismic Hazard Assessment (PSHA) has been expected to be used more effectively for many purposes, but its application area is still limited as seismic design and seismic risk model for insurance.
In this study, I show the framework of PSHA application (Fig. 1) and explain the usage of the seismic risk analysis result for the risk management in the business area. In addition, I introduce our new challenge with NIED evaluating economic impact by the earthquake using economic model, which is application of the computable general equilibrium (CGE) model and was developed by the Disaster Mitigation Research Center of Nagoya University.
Then, I discuss about the uncertainty of site amplification evaluation methods which are the AVS30 based method, equivalent liner method and
nonlinear method, used in PSHA.
Fig. 1. Framework of PSHA application
The 2019 G-SHA Toyako Workshop, Japan
14

2A-3 Analysis of aftershocks sequence of M >= 6.0 earthquakes in Taiwan with ETAS model
a Yiwun Liao, b Jiancang Zhuang, and c Kuo-Fong Ma
a Earthquake-Disaster & Risk Evaluation and Management (E-DREaM) Center of National Central University,
Zhongli, Taiwan, [email protected]
b The Institute of Statistical Mathematics, Tokyo, Japan
c Earthquake-Disaster & Risk Evaluation and Management (E-DREaM) Center of National Central University,
Zhongli, Taiwan, [email protected]
It is well known that the earthquake damage is not only from the mainshock, but also from
aftershocks, especially for a large significant earthquake. The consequent severe large
aftershocks often caused extensive building damages and fatality through the earthquake
sequence. To evaluate the hazard and risk from the large aftershocks after a severe earthquake,
we analyzed the aftershock sequences of the earthquakes with magnitude larger than 6.0 by
using two dimensional point source ETAS (Epidemic-Type Aftershock Sequence) model. To
carry out the analysis, we forecasted the spatiotemporal distribution of future aftershocks by
considering the aftershock sequence from 1 to 24 hours after the mainshock to investigate the
possible lag time for reliable aftershock forecasting (Figure 1 and 2). In our studies, we showed
that we can match in general the forecasted spatial distribution of aftershocks with the
occurrence pattern of the next-day aftershock sequence by considering the aftershocks in the
first few hours after the mainshock through the scoring method. Through these models testing
and justification using M >= 6.0 earthquakes in Taiwan, we hope to develop a reliable system
for forecasting the spatiotemporal distribution of aftershocks and the time-dependent hazard
analysis for future large mainshocks in real-time.
Figure 1. The end-of-time rates of (a) the mainshock, (b) 3-hour, (c) 12-hour, and (d) 24-hour aftershock models.
The 2019 G-SHA Toyako Workshop, Japan
15

Figure 2. The score distribution of (a) the mainshock, (b) 3-hour, (c) 12-hour, and (d) 24-hour aftershock models.
References Ogata, Y., & Zhuang, J. (2006). Space–time ETAS models and an improved extension. Tectonophysics, 413(1-2),
13-23. Zhuang J. (2006) Second-order residual analysis of spatiotemporal point processes and applications in model
evaluation. Journal of the Royal Statistical Society: Series B (Statistical Methodology), 68 (4), 635-653. doi: 10.1111/j.1467-9868.2006.00559.x.
Zhuang, J. (2011). Next-day earthquake forecasts for the Japan region generated by the ETAS model. Earth, planets and space, 63(3), 5.
Zhuang J., Ogata Y. and Vere-Jones D. (2002). Stochastic declustering of space-time earthquake occurrences. Journal of the American Statistical Association, 97: 369-380.
Zhuang J., Ogata Y. and Vere-Jones D. (2004). Analyzing earthquake clustering features by using stochastic reconstruction. Journal of Geophysical Research, 109, No.B5, B05301, doi:10.1029/2003JB002879.
The 2019 G-SHA Toyako Workshop, Japan
16

2A-4 Millennial-scale slip rate variations on major strike-slip faults in central New Zealand and examples of potential resulting impacts on hazard
estimation
a Russ Van Dissen, b Elizabeth Abbott, c Robert Zinke, d Dee Ninis, e James F. Dolan, f Timothy A. Little, g Edward J. Rhodes, h Nicola J. Litchfield and i Alexandra E. Hatem
a GNS Science, New Zealand, [email protected] b GNS Science, New Zealand, [email protected] c Jet Propulsion Laboratory, USA d Seismological Research Centre, Australia e University of Southern California, USA f Victoria University of Wellington, New Zealand g University of Sheffield, United Kingdom h GNS Science, New Zealand i United States Geological Survey, USA
Geological investigations over the last decade have demonstrated that major strike-slip
faults in central New Zealand (e.g., Awatere, Clarence, Wellington faults) have experienced
significant millennial-scale variations in slip rate over the last 10-12 kyr (1 kyr = 1000 years).
For example, the central Clarence Fault has had a dextral slip rate of ~2 mm/yr over the last ~8
kyr, whereas, over the preceding ~4 kyr it had a significantly faster rate of ~9 mm/yr. The
southern Wellington Fault provides an even more extreme example. Between ~5 kyr and 8 kyr
ago, it had a relatively slow slip rate of 1-2 mm/yr, whereas, between ~8 kyr and 10 kyr its slip
rate, at nearly 20 mm/yr, was approximately an order of magnitude faster.
In probabilistic seismic hazard assessment, the hazard contribution of an active fault (i.e., an
active fault earthquake source) is typically a function of its slip rate, and that slip rate is often
assumed to be constant. Here we investigate – in a first-order manner – potential impacts of the
above slip rate variations on probabilistic ground shaking hazard estimation. Specifically, we
utilise the New Zealand National Seismic Hazard Model and track changes in calculated peak
ground acceleration and spectral acceleration that result from slip rate variations on the above
faults equivalent in magnitude to those experienced in the past, and plausibly anticipated in the
future. We report these changes over a range of annual exceedance probabilities for a
representative suite of urban centres in central New Zealand (e.g., Wellington, Blenheim,
Kaikoura).
References Ninis, D., Little, T.A., Van Dissen, R.J., Litchfield, N.J., Smith, E.G.C., Wang, N., Rieser, U., Henderson, C.M.,
2013, Slip rate on the Wellington Fault, New Zealand, during the late Quaternary: Evidence for variable slip during the Holocene. Bulletin of the Seismological Society of America 103 (1): 559-579. doi: 10.1785/0120120162.
Zinke, R., Hollingsworth, J., Dolan, J., Van Dissen, R., 2019, Three-Dimensional surface deformation in the 2016 Mw 7.8 Kaikōura, New Zealand earthquake from optical image correlation: Implications for strain localization and long-term evolution of the Pacific-Australian plate boundary. Geochemistry, Geophysics, Geosystems 20 (3): 1609-1628. doi: 10.1029/2018GC007951.
The 2019 G-SHA Toyako Workshop, Japan
17

2A-5 Liquefaction-induced ground deformation caused by the shaking of the 2016 Meinong earthquake
a Ruey-Juin Rau, b Choon-Muar Ker, c Pei-Ching Tsai, d Li-Hsin Ho and e Kuo-En Ching
a Department of Earth Sciences, National Cheng Kung University, Taiwan, [email protected]
b Department of Earth Sciences, National Cheng Kung University, Taiwan
c Department of Earth Sciences, National Cheng Kung University, Taiwan
d Department of Earth Sciences, National Cheng Kung University, Taiwan
e Department of Geomatics, National Cheng Kung University, Taiwan, [email protected]
Liquefaction-induced lateral deformations have been commonly observed along the
riverbanks and the coastal areas where composed of unconsolidated sediments after nearby
moderate or large earthquakes occurred. Liquefaction case history database has been
established for liquefaction hazard and potential evaluations, however, there are very few cases
in the literatures showing the initiation, evolution and the deformation pattern of liquefaction.
The localized Hsinhua, Tainan area in SW Taiwan, had repeatedly experienced
liquefaction-induced damages after the nearby moderate (M 6.1-6.6) earthquakes occurred in
1946, 2010 and 2016, respectively. We established 70 campaigned-mode with 400-700 m
station-spacing and 9 continuous GPS stations in the Hsinhua area about three months before
the 2016 Meinong earthquake, and we made the first campaigned-mode GPS measurements
3-13 days before the event. The campaigned-mode GPS measurements were repeated 2-weeks,
six months and one year, respectively after the Meinong earthquake. Each campaign GPS site
was occupied 4-8 hours, and the data were calculated by Bernese 5.2 following the standard
GPS processing procedures. While the coseismic displacement of the overall Hsinhua area
directing mainly northwest-ward, the coseismic displacement within the dense 2x8 km2
Hsinhua GPS network shows NW-striking on stations located at two sides of the network and
on the contrary, sites intervened in the middle section of the network directing SE. Both the
NW- and SE-directing displacements have amplitudes of 20-100 mm. The sites with SE
motions form a band with a dimension of 2x5 km2 striking NE, normal to the regional
coseismic displacement direction. The localized SE-directing area coincides with the InSAR
results and roughly consistent with the published liquefaction prone area. In addition to the
liquefaction-induced deformation pattern, we will present the initiation and evolution of
liquefaction caused by the shaking of the 2016 Meinong earthquake.
The 2019 G-SHA Toyako Workshop, Japan
18
2A-6 In search of New Zealand’s hidden faults: towards a high resolution velocity field from InSAR and GPS observations
a I. J. Hamling, b T. J. Wright, c S. Hreinsdottir, deL. M. Wallace
a GNS Science, New Zealand, [email protected]
b University of Leeds, UK
c GNS Science, New Zealand
d GNS Science, New Zealand
e University of Leeds, UK
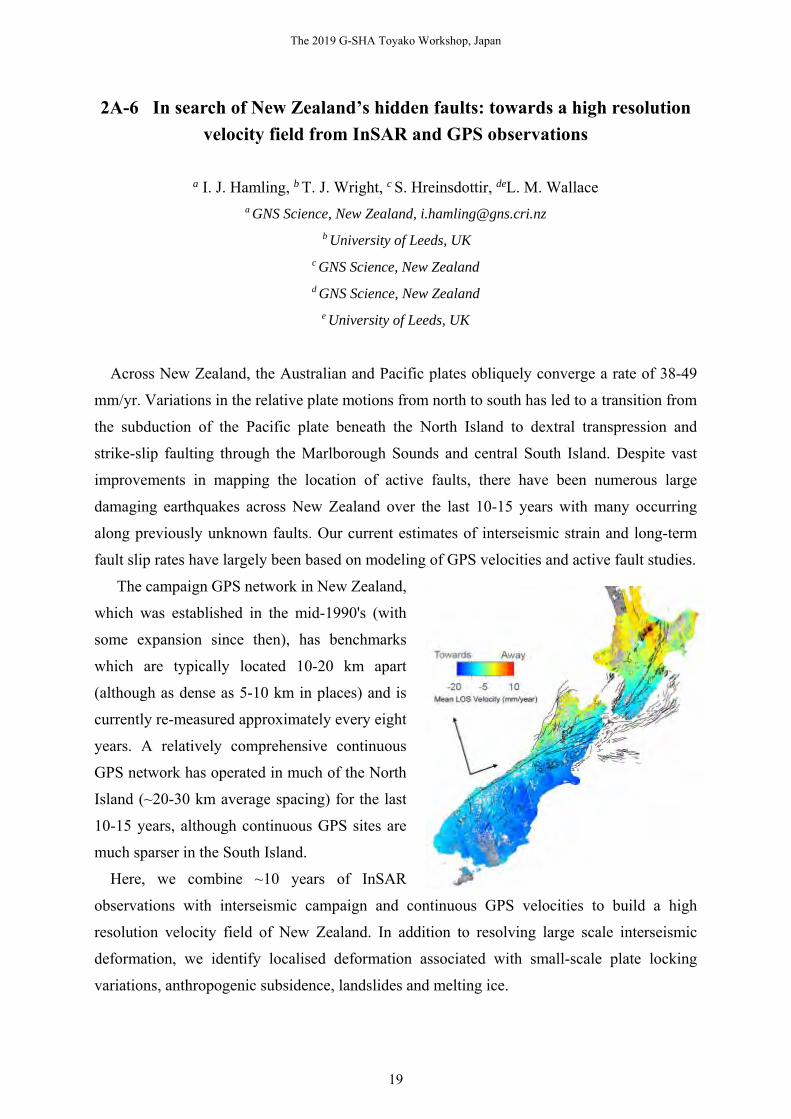
Across New Zealand, the Australian and Pacific plates obliquely converge a rate of 38-49
mm/yr. Variations in the relative plate motions from north to south has led to a transition from
the subduction of the Pacific plate beneath the North Island to dextral transpression and
strike-slip faulting through the Marlborough Sounds and central South Island. Despite vast
improvements in mapping the location of active faults, there have been numerous large
damaging earthquakes across New Zealand over the last 10-15 years with many occurring
along previously unknown faults. Our current estimates of interseismic strain and long-term
fault slip rates have largely been based on modeling of GPS velocities and active fault studies.
The campaign GPS network in New Zealand,
which was established in the mid-1990's (with
some expansion since then), has benchmarks
which are typically located 10-20 km apart
(although as dense as 5-10 km in places) and is
currently re-measured approximately every eight
years. A relatively comprehensive continuous
GPS network has operated in much of the North
Island (~20-30 km average spacing) for the last
10-15 years, although continuous GPS sites are
much sparser in the South Island.
Here, we combine ~10 years of InSAR
observations with interseismic campaign and continuous GPS velocities to build a high
resolution velocity field of New Zealand. In addition to resolving large scale interseismic
deformation, we identify localised deformation associated with small-scale plate locking
variations, anthropogenic subsidence, landslides and melting ice.
The 2019 G-SHA Toyako Workshop, Japan
19
2A-7 Probabilistic Fault Displacement Hazard Analysis : An Example of the Hualien area
ab Jia-Cian Gao, cd Chyi-Tyi Lee, ef Kuo-Fong Ma
a Graduate Institute of Applied Geology, National Central University, Taiwan, [email protected]
b Earthquake-Disaster & Risk Evaluation and Management Center, E-DREaM, Taiwan
c Graduate Institute of Applied Geology, National Central University, Taiwan
d Earthquake-Disaster & Risk Evaluation and Management Center, E-DREaM, Taiwan
e Earthquake-Disaster & Risk Evaluation and Management Center, E-DREaM, Taiwan, [email protected]
f Department of Earth Sciences, National Central University, Taiwan
Seismic impact to infrastructures may include strong ground-motion impact, fault
displacement and ground deformation. Coseismic surface displacements associated with large
earthquakes have caused significant damage to structures located on or near a fault and may
impact existing structures. A method have been proposed (Youngs et al., 2003) to estimate fault
displacement in a similarly probabilistic manner as the probabilistic seismic hazard analysis
(PSHA). Probabilistic fault displacement hazard analysis (PFDHA) is one such procedure that
provides an estimate of expected levels of slip on a fault due to surface rupture.
An earthquake of Mw 6.4 occurred in the Hualien area of eastern Taiwan on 6 February
2018. It caused surface ruptures in several areas mostly near the Milun Fault in Hualien City.
The offset reached its maximum of 30 cm. Thus, we try to select empirical distributions for
surface rupture, maximum and average displacement, spatial variability of slip, and other
random variables that are the key to implementing PFDHA. We calculated fault displacement
hazard and compared the results with the distribution of co-seismic surface ruptures though
field surveys.
The 2019 G-SHA Toyako Workshop, Japan
20

2A-8 Working towards integrating geodetic data into PSHA
a Ray Y. Chuang, b Kuo-En Ching, c Wu-Lung Chang, and d Ruey-Juin Rau
a Department of Geography, National Taiwan University, Taiwan, [email protected]
b Department of Geomatics, National Cheng Kung University, Taiwan, [email protected]
c Department of Earth Sciences, National Central University, Taiwan d Department of Earth Sciences, National Cheng Kung University, Taiwan, [email protected]
Geodetic techniques have shown great ability to monitor surface deformation,
providing useful information for estimating fault movement. Geodetic rates, fault-slip
rates derived from geodetic data, have been widely used in the geodesy community to
characterize seismic potential and strain partitioning. Especially, geodetic data could
give us insights into current fault locking and slip deficit at the present earthquake cycle,
which should be more sensitive to the next earthquakes. However, current probabilistic
seismic hazard assessments (PSHA) do not particularly incorporate either geodetic
rates or observations. Therefore, this study aims to discuss how to use geodetic
observations for seismic hazard assessments. We first compare geologic and geodetic
rates of major active faults in Taiwan. Geodetic rates are derived from three different
numerical models. Secondly, we propose a framework to incorporate geodetic data into
seismic hazard assessments.
The 2019 G-SHA Toyako Workshop, Japan
21

2B-1[Invited] 2018 and 2023 U.S. National Seismic Hazard Models
a M.D. Petersen and the National Seismic Hazard Model Project
a Chief National Seismic Hazard Model Project, U.S. Geological Survey, [email protected]
During 2017-2018, the National Seismic Hazard Model (NSHM) was updated by
incorporating (1) new median ground motion models, new estimates of their epistemic
uncertainties and aleatory variabilities, and new soil amplification factors for the central and
eastern U.S., (2) amplification of long-period ground motions in deep sedimentary basins in the
Los Angeles, San Francisco, Seattle, and Salt Lake City areas, (3) an updated seismicity catalog,
which includes new earthquakes that occurred between 2012 and 2017, and (4) improved
computer code and implementation details. Results show significantly increased ground
shaking in many (but not all) locations across the central and eastern U.S., including the four
urban areas (listed above) that overlie deep sedimentary basins in the western U.S. During
2019-2023 the NSHM will consider additional updates including: 3D simulations in urban
areas of Los Angeles and Seattle, additional sedimentary basin amplification models for other
urban areas (e.g., coastal plain of eastern and southern U.S., Reno, Las Vegas), non-ergodic
ground motion models that reconsider epistemic and aleatory uncertainty, and new geological
and geodetic data for faults spread across the U.S. These maps will be considered by the
Building Seismic Safety Council, American Society of Civil Engineers, and International
Building Code committees for inclusion in upcoming building codes. Due to population growth,
more people live and work in areas of high or moderate seismic hazard than ever before,
leading to higher risk of undesirable consequences from future ground shaking.
The 2019 G-SHA Toyako Workshop, Japan
22

2B-2[Invited] Exploring the Main Characteristics of GEM’s Global Mosaic of Hazard Models
a Marco agani, b Robin Gee, c Kendra Johnson, d Julio Garcia- elaez, and e Richard Styron a eismic a ard Team, lobal Earthquake odel oundation, taly, marco. [email protected] b
c
d
eismic a ard Team, lobal Earthquake odel oundation, taly eismic a ard Team, lobal Earthquake odel oundation, talyeismic a ard Team, lobal Earthquake odel oundation, talyeismic a ard Team, lobal Earthquake odel oundation, taly
anzeri, L., et al. (2014). Open uake Engine An Open Hazard (and Risk) Software for the Global Earthquake
Model. eismological Research etters 5, 692 702. agani, M., Garcia- elaez, J., Gee R., Johnson K., oggi V., Silva V., Simionato M., Styron R., Vigano D.,
Danciu L., Monelli D., and Weatherill G. (2019). The 201 version of the Global EarthquakeModel Hazard component. Earthquake Spectra, submitted.
Fig. 1. GEM s Global Hazard Map ( agani et al, 2019 v. 201 .1).
Earthquake Model suite.
These comprise for example a
global seismic hazard map
(see Figure 1), a global
exposure database and a
global risk model.
The global hazard map is
the combination of 30 hazard
maps computed using
different regional and national probabilistic seismic hazard models produced by international
projects, recognized national agencies and, to a lesser extent, by the GEM Secretariat.
Altogether the mosaic provides a good summary of the state-of-practice applied to
probabilistic seismic hazard analysis over the last ten years each model is uniformly
described using the Open uake Engine input file format ( agani et al., 2014). Taking
advantage of this homogenous representation of the SHA models, the GEM hazard team
is developing a suite of tools to appraise the main characteristics of the Seismic Source
and Ground-Motion haracterizations (SS and GM , respectively). These tools can
appraise the earthquake occurrence characteristics of the different earthquake source
typologies used in an SS or compare the ground motion produced by alternative ground
motion models in the SS for well-specified conditions. In this communication, we
provide a summary of the characteristics of the global hazard maps and the mosaic
and we illustrate the various comparisons between the hazard models included in the
mosaic.
References agani, M., Monelli, D., Weatherill, G., Danciu, L., rowley, H., Silva, V., Henshaw, ., utler, L., Nastasi, M.,
In December 201 , at the end of its second implementation phase, the Global Earthquake
Model (GEM) initiative released the first collection of products of the GEM s Global
e
The 2019 G-SHA Toyako Workshop, Japan
23

2B-3 Rate and State Seismicity Simulations for Seismic Hazard Analysis in Taiwan
a Hung-Yu Wu b Kuo-Fong Ma and c Bill Fry
a Earthquake Disaster & Risk Evaluation and Management Center, National Central University, Taiwan,
b Earthquake Disaster & Risk Evaluation and Management Center, National Central University,
Taiwan, [email protected]
c GNS Science, New Zealand, [email protected]
The seismic hazard analyzes and simulations of in-land large earthquakes are important to
evaluate the liability from the study of probabilistic seismic hazard assessment. To understand
the occurrence, the probabilities and the dynamic processing of large earthquake, we employed
the multi-cycle earthquake simulator RSQSim to exam the fundamental aspects of seismicity
distribution in spatial and time. This 3D, boundary element software assembles the friction law
and initial stress state to simulate the earthquakes in completely, complex seismogenic system.
In this research, we use the CWB earthquake catalog and Taiwan Earthquake Model (TEM) for
the RSQSim simulations. The heterogeneous initial stresses and recurrence seismic events
would be estimated in ten thousand years. Additionally, these information provide the near
optimal nucleation locations and seismic events propagation at the stress evolution in Taiwan
faulting systems. Through this process, we would like to examine the model parameters from
TEM, and understand the key discrepancy between models and simulators, which will bring the
mutual input to TEM for update discussion on slip rate and fault system; and the modification to
the model for earthquakes simulator.
The 2019 G-SHA Toyako Workshop, Japan
24
2B-4 TOWARDS GROUND MOTION PREDICTIONS FOR A LARGE HIKURANGI SUBDUCTION EARTHQUAKE: LESSONS FROM THE
KAIKŌURA EARTHQUAKE
a Caroline Holden, b Yoshi Kaneko and c Anna Kaiser
a GNS SCIENCE, New Zealand, [email protected] b GNS SCIENCE, New Zealand c GNS SCIENCE, New Zealand
The 2016 M7.8 Kaikōura, New Zealand, earthquake struck the East coast of the northern
South Island on November 13th 11:02 (UTM). The damaging earthquake generated extreme
surface displacements, land deformations and ground motions, a regional tsunami and triggered
significant slow slip events on the Hikurangi interface (Kaneko et al., 2017). Sadly, it also
caused 2 fatalities and many New Zealanders were affected by this earthquake.
The overall earthquake rupture process as suggested by advanced source models (Hamling
et al., 2017; Holden et al., 2017; Kaiser et al., 2017) is complex and unexpected. The
earthquake bypassed the Hope fault, largest source of regional seismic hazard, as it ruptured
exclusively to the North (despite most of the stress accumulated from the 2010-2016
Canterbury earthquake sequence was to the South). Source models based on teleseismic and/or
regional data suggest that the interface did contribute to the overall rupture (Bai et al., 2017;
Duputel & Rivera, 2017; Kaiser et al., 2017). However, many observations strongly support
evidence of minor (if any) contribution of the interface in the overall rupture (Holden et al.,
2017; Clark et al., 2017; Cesca et al., 2017).
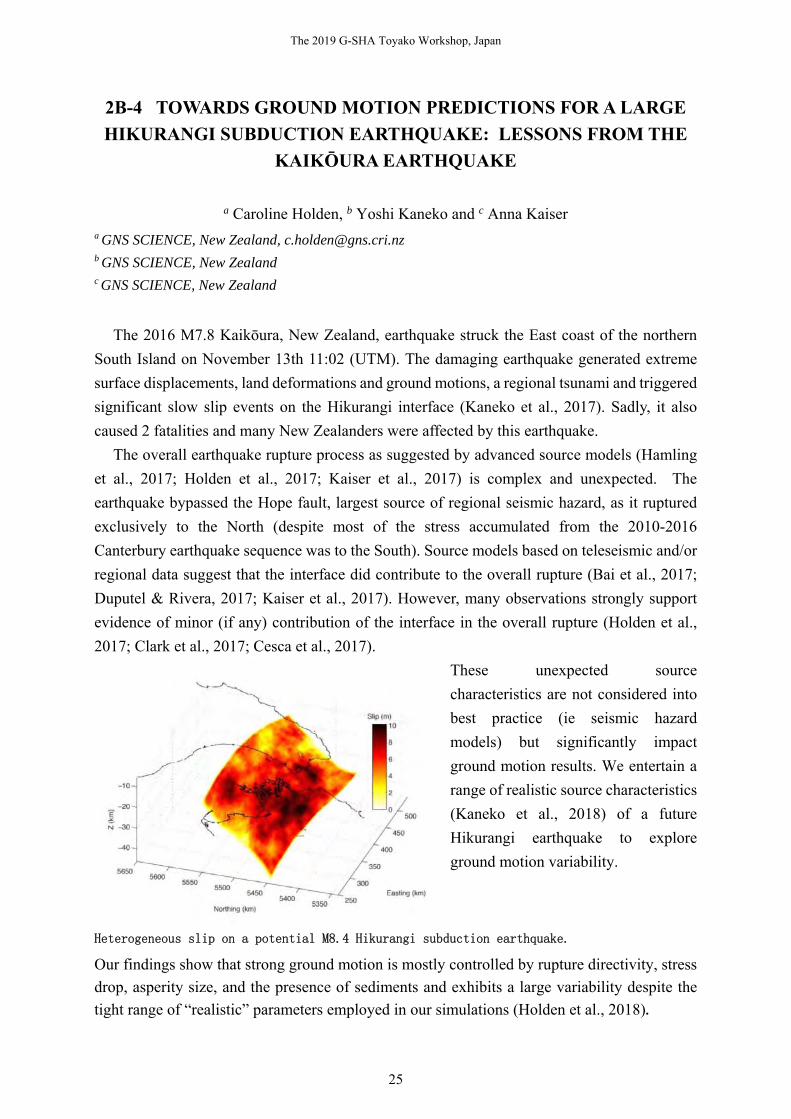
These unexpected source
characteristics are not considered into
best practice (ie seismic hazard
models) but significantly impact
ground motion results. We entertain a
range of realistic source characteristics
(Kaneko et al., 2018) of a future
Hikurangi earthquake to explore
ground motion variability.
Heterogeneous slip on a potential M8.4 Hikurangi subduction earthquake.
Our findings show that strong ground motion is mostly controlled by rupture directivity, stress
drop, asperity size, and the presence of sediments and exhibits a large variability despite the
tight range of “realistic” parameters employed in our simulations (Holden et al., 2018).
The 2019 G-SHA Toyako Workshop, Japan
25

2B-5 Broadband ground-motion waveform synthesis utilizing AI-based upsampling technique
a Takahiro Maeda, b Asako Iwaki, and c Hiroyuki Fujiwara
a National Research Institute for Earth Science and Disaster Resilience, Japan, [email protected]
b National Research Institute for Earth Science and Disaster Resilience, Japan, [email protected]
c National Research Institute for Earth Science and Disaster Resilience, Japan, [email protected]
For predicting broadband ground motion, a hybrid method is often used. The hybrid method
synthesizes broadband ground motion by summing up long-period and short-period ground
motion calculated separately. However, the long-period and short-period ground motions are
calculated using different velocity structure models, it is known that problems such as the shift
of travel time, discontinuity of spectral amplitude between the period range.
For this problem, Iwaki and Fujiwara (2013) proposed a method of synthesizing broadband
ground-motion waveform based on the relationship of ground-motion waveform between
long-period and short-period extracted from observation data. We considered this problem of
extracting the relationship between long-period and short-period ground motions as a problem
of upsampling in artificial intelligence (AI) and have studied this problem using the coupling
learning method (Nagata et al., 2016) which is one of machine learning methods (Maeda et al.,
2018, 2019). To construct a prediction model of a short-period ground-motion waveform from a
long-period ground-motion waveform based on AI, we can utilize a vast amount of strong
ground motion data recorded by K-NET and KiK-net.
We used an envelope shape of waveforms for narrowband of 0.5-1.0 Hz, 1-2 Hz, 2-4 Hz, 4-8
Hz, 8-16 Hz, and a Fourier amplitude spectrum for evaluating the similarity of observed and
predicted broadband ground motion. The data sets used for learning and testing of AI sites with
similar ground conditions, (3) records of multiple observation sites due to earthquakes of the
similar magnitude, (4) records of multiple observation sites due to earthquake occurring in the
same region, and (5) a whole records from (1) to (4). The prediction performance is slightly
higher in the case (1). Qualitatively, it is expected that the prediction performance in the case
(1) that can take into consideration the site-specific characteristic of ground motion will be
significantly higher and the result of this study suggests that there is room for improvement in
the similarity evaluation.
Acknowledgments: This work was partially supported by the Council for Science,
Technology and Innovation (CSTI) through the Cross-ministerial Strategic Innovation
Promotion Program (SIP), titled “Enhancement of societal resiliency against natural disasters”
(Funding agency: JST).
The 2019 G-SHA Toyako Workshop, Japan
26
2B-6 Dense array ambient noise correlations and seismic reflectivity of the megathrust
a Bill Fry
a GNS SCIENCE, New Zealand, [email protected]
We stack dense-array ambient noise autocorrelations to probe the Hikurangi Subduction
Zone megathrust in central New Zealand. Autocorrelations have been show to provide depth
estimates of strong impedance contrasts in layered media. We compute sub-array
autocorrelation functions from 10-station seismometer deployments over the subduction zone.
Using dense array techniques greatly enhances the signal-to-noise ratio of the autocorrelations,
allowing possible observations of the subduction interface reflector. Sub-arrays were installed
one each side of a transition from a region of geodetic coupling to the south and a geodetically
defined “unlocked” region to the north. Our experiment is designed to test the hypothesis that
persistent strong interface coupling occurs in dry regions of the megathrust whereas weak
coupling exists in regions with elevated pore fluids or pore fluid pressures. We would expect
high pore fluid pressures at the plate interface to produce larger amplitude reflections of
vertically propagating seismic waves, resulting in larger autocorrelation peaks. We observe
relatively higher amplitude autocorrelation spikes over the Porongohau region. In this area, the
plate interface is about 15km deep. It is an area that is commonly susceptible to triggering of
local earthquakes during dynamic stressing of passing waves from distant or regional
earthquakes and also triggering of microseismicity during local slow-slip events, presumably
from static stressing mechanisms. Of note, the region experienced particularly high seismicity
following the 2016 Mw7.8 Kaikoura earthquake. Our deployment captures the year following
this event. Our results provide a baseline from which to search for temporal changes in
reflectivity of the interface, allowing an approach to monitoring possible changes in pore-fluids
throughout the slow-slip / earthquake cycle.
The 2019 G-SHA Toyako Workshop, Japan
27

P-1 A revisit to the surface expression of the Milun Fault, east Taiwan
a Shao-Yi Huang, b Jiun-Yee Yen, c I-Chin Yen, and d Yu-Ting Kuo
a Institute of Earth Sciences, Academia Sinica, Taiwan, [email protected]
b Department of natural resources and environmental studies, National Dong Hwa University, Taiwan
c Graduate Institute of Applied Geology, National Central University, Taiwan, [email protected]
d Institute of Earth Sciences, Academia Sinica, Taiwan
On February 6, 2018, a moderate earthquake of MW 6.4 ignited at a shallow depth (~6.3 km)
of east Taiwan, resulting in severe damage to downtown Hualien and more than 200 casualties.
The strong ground shaking caused collapse and toppling of four buildings in the center of
Hualien City and led to outages of power and water for several days. The Milun Fault has a
record of recent activity during the 1951 earthquake series and was hence categorized as an
active fault with sinistral and reversal components. The 1951 earthquake reached Mw 7.3 and
was reported by many journalists and local geologists; that being said, as a lot of the damage
occurred in the form of building toppling or collapse and most of the records were documented
with relative geographic positions, the recognition of the fault trace became obscured due to the
lack of precise coordinates.
The 20180206 earthquake caught us off guard and offered the opportunity to revisit the
surface expression and the underground mechanics of the Milun Fault. The earthquake was
moderate yet the loss was devastating because the affected area was densely populated. Field
measurements show that the Milun Fault generated larger offsets in the north and declined
toward south. Development of step-overs were prominent as the fault crossed downtown area,
partly explained why the 1951 records were interpreted as three branches in this transpressional
section. The repeated occurrence of offsets at many sites demonstrated the high risk of surface
ruptures along the fault line, therefore a high resolution and precise mapping focusing on the
fault trace is preferably in this case. We learned our lessons and hope this humbling experience
can lend itself to build better disaster risk reduction and management plans in the future.
References Shao-Yi Huang, Jiun-Yee Yen, Bo-Lin Wu, I-Chin Yen, and Ray Y. Chuang (2019) Investigating the Milun Fault:
The coseismic surface rupture zone of the 2018/02/06 ML 6.2 Hualien earthquake, Taiwan, Terr. Atmos. Ocean. Sci., 30, 311-335, doi: 10.3319/ TAO.2018.12.09.03
Yu-Ting Kuo, Yu Wang, James Hollingsworth, Shao-Yi Huang, Ray Y., Chuang, Chih-Heng Lu, Yi-Chun Hsu, Hsin Tung, Jiun-Yee Yen, and Chung-Pai Chang (2018) Shallow Fault Rupture of the Milun Fault in the 2018 Mw 6.4 Hualien Earthquake: A High-Resolution Approach from Optical Correlation of Pléiades Satellite Imagery, Seismological Research Letters, 90, 1, 97-107, doi: 10.1785/0220180227
The 2019 G-SHA Toyako Workshop, Japan
28

P-2 Long-term fault slip rates and distributed deformation rates in Taiwan
orogenic belt by finite-element kinematic model
a Jyr-Ching Hu and b Yi-Jui Lee
a Department of Geosciences, National Taiwan University, Taiwan, [email protected]
b Disaster Prevention Technology Research Center, Sinotech Engineering Consultants, INC, Taiwan
This study used kinematic finite element code to estimate the long-term slip rate of faults
and the distributed permanent strain rate to assess the seismic hazard model in Taiwan orogenic
belt. The community data sets include thirsty-three inland active faults and two subduction
plate boundaries. The initial
input parameters of each fault
include the fault dip, rupture
depth and long-term slip rate
with consideration of oblique
slips on faults. This paper also
considered the oblique slips for
some active faults. The principal
stress direction data obtained
from the World Stress Map 2016.
We interpolated these stress
directions into each finite
element. The horizontal GPS
velocities which were removed
the velocity fields on fault grids
and non-tectonic velocities. The
plate boundary and Euler pole
used the default PB2002 data. The calculation results with compare with the long-term slip rate
inferred from two block models in Taiwan and the geological offset rates. The distributed
permanent strain rates showed a relatively high strain rate at active faults in southwestern
region of Taiwan which the transient deformation contributed by triggering of weak
decollement by moderate earthquakes. For instance, the optimized model will be finalized by
integrated complete long-term fault slip data and unresolved blind fault systems.
Fig. 1. Distributed permanent strain rates in Taiwan orogenic belt.
The 2019 G-SHA Toyako Workshop, Japan
29
P-3 Re-evaluation of Earthquake Probability Assessment for the ActiveFaults in Taiwan
a Yin-Tung Yen, b Yi-Rui Lee, c Yi-Rung Chuang, d J. Bruce H. Shyu, e Kuo-Shih Shao, fShen-Hsiung Liang, and g Chien-Liang Chen
a Sinotech Engineering Consultants, Inc., Taiwan, [email protected] b Sinotech Engineering Consultants, Inc., Taiwan, [email protected] c Sinotech Engineering Consultants, Inc., Taiwan, [email protected] d National Taiwan University, Taiwan, [email protected] e Sinotech Engineering Consultants, Inc., [email protected] f Sinotech Engineering Consultants, Inc., [email protected] g Sinotech Engineering Consultants, Inc., [email protected]
In the 2013-2016 project “Observation of Fault Activity (III): Integrated Monitoring of
Active Faults and Earthquake Probabilities Analysis”, the Central Geological Survey (CGS)
has established a procedure for estimating earthquake probabilities for the 33 active faults in
Taiwan. The procedure was based on experiences from Japan and the United States to establish
a methodology for earthquake probability assessment of existed active faults. Based on the
results of this project, the new 2017-2020 project plans to collect the latest parameters and to
examine fault geometry model for re-estimating the earthquake probabilities for the active
faults in Taiwan. The main tasks of this project are: (1) Re-evaluation of the parameters and
earthquake probabilities of the 33 active faults, (2) Collection of the parameters of additional
seismogenic structures, (3) Compilation of the parameter explanatory texts, which include fault
geometry, activity parameters, and outcrop photos of each active fault, and (4) Analysis of
possible issues while publishing the earthquake probability map, and to propose potential
coping strategies. The final goal is to provide the potential earthquake probability of each active
fault to be appropriately used for calculating earthquake insurance premiums, planning and
prioritizing expenditures for seismic upgrades of structures, and the development of building
codes.
The 2019 G-SHA Toyako Workshop, Japan
30

P-4 The Significant Fault Sources in Northern Taiwan
aKuan Yu Chen, bYi Ping Chen, cYing Ping Kuo, dAndrew, T. S. Lin, eYu Wen Chang, fHsun Jen Liu,
gChih Wei Chang, hKevin Clahan, iBor Shouh Huang, jChin Tung Cheng and kChiun Lin Wu a National Applied Research Laboratories-Nation Center for Research on Earthquake Engineering,
[email protected] b Institute of Oceanography, National Taiwan University, Taiwan c National Applied Research Laboratories-Nation Center for Research on Earthquake Engineering,
[email protected] d Department of Earth Sciences, National Central University, Taiwan e National Applied Research Laboratories-Nation Center for Research on Earthquake Engineering f National Applied Research Laboratories-Nation Center for Research on Earthquake Engineering gNational Applied Research Laboratories-Nation Center for Research on Earthquake Engineering h Lettis consultants international, Inc. Earth science consultants i Institute of Earth Sciences of Academia Sinica, Taiwan j ThinkTron Ltd., Taiwan k National Applied Research Laboratories-Nation Center for Research on Earthquake Engineering
The Seismic Source Characterization (SSC) models are developed by integrating
comprehensive data and evaluating various parameters of fault characteristics for probabilistic
seismic hazard analysis (PSHA).
The northern Taiwan orogenic belt has collapsed as a result of normal faulting in post-collision
stage since late Pliocene-early Pleistocene (Teng, 1996; Hsiao et al, 1998). The
submarine reflection seismic data interpretations indicate that the normal faults propagate from
offshore area into onshore area (Chen, 2014).
We identified five significant fault sources as primary faults, i.e. Sanchiao fault system, ST-II
fault system, Aoti offshore faults, S fault and
Northern Ilan fault system. We proposed the logic
tree approach to present their geometry (length, dip,
and seismogenic depth), kinematics (segmentation
and rupture sources), and activity (slip rate,
maximum magnitude, magnitude probability
distribution function (PDF)) in Northern Taiwan.
Fig. 1. The significant faults in Northern Taiwan.
References Chen, K. Y. (2014) A Study on Structural Development from Orogenic Belt to Extensional Backarc Setting in
Northern Taiwan and its Offshore Area. Doctoral Thesis, Department of Earth Sciences, National Central
University, Taiwan, pp.199.
Hsiao, L, Y., Huang, S. T., Teng, L. S. and Lin. K. A. (1998) Structural Characteristics of the Southern
Taiwan-Sinzi Folded Zone. Petroleum Geology of Taiwan, 32, 133-153.
Teng, L. S. (1996). Extensional collapse of the northern Taiwan mountain belt. Geology, 24(10), 949-952.
The 2019 G-SHA Toyako Workshop, Japan
31

P-5 Logic Tree of Fault Models: A Case Study of Hengchun Fault System in Southern Taiwan
a Ying-Ping Kuo, b Kuan-Yu Chen, c Yi Ping Chen, d Kevin Clahan, e Andrew T. S. Lin,
f Bor Shouh Huang, g J. Bruce H. Shyu, and h Chiun Lin Wu a National Center for Research on Earthquake Engineering, Taiwan, [email protected] b National Center for Research on Earthquake Engineering, Taiwan, [email protected] c National Taiwan University, Taiwan d Lettis consultants international, Inc. Earth science consultants e Department of Earth Sciences, National Central University, Taiwan f Instituteof Earth Sciences of Academia Sinica, Taiwan g National Taiwan University, Taiwan, [email protected] h National Center for Research on Earthquake Engineering, Taiwan
Taiwan is situated on the boundary between the Philippine Sea Plate and the Eurasian Plate,
with a convergence rate of approximately 90 mm/yr. The tectonic of Taiwan orogen is complex
and hence is recognized as a high seismicity area. Taiwan SSHAC Level 3 Project is executed
by the National Center for Research on Earthquake Engineering (NCREE) to integrate relevant
geological/geophysical literature and data, to evaluate the hazard-related parameters, and to
establish the logic trees for each seismic source around Taiwan. We evaluated various
parameters of fault characteristics by different nodes in logic trees for a site-specific
probabilistic seismic hazard analysis (PSHA). One of the four nuclear power plants, NPP3, is
located in Hengchun Peninsula, southern Taiwan. The Chaochou fault, the Hengchun fault, the
Hengchun offshore fault, and the Southwest Hengchun fault are regarded as Hegnchun fault
system by the Seismic Source Characteristic Technical Integrator (SSC TI) Team. In this study,
Hengchun fault system as being a significant primary
fault (located within a 20 km radius of NPP3) would be
presented with its final results of the logic tree. The
nodes in the logic tree of the Hengchun fault system
include geometry [trace, length, depth, dip], kinematics
[segmentations, rupture sources], and activity [slip rate,
aseismic ratio, maximum magnitude, magnitude PDF].
Fig. 1. The map of Hengchun fault system.
The 2019 G-SHA Toyako Workshop, Japan
32
P-6 GPU-accelerated Automatic Microseismic Monitoring Algorithm
aEn-Jui Lee, bWu-Yu Lioa, cDawei Mu, and dPo Chen aDepartment of Earth Sciences, National Cheng Kung University, Taiwan, ROC, [email protected]
bDepartment of Earth Sciences, National Cheng Kung University, Taiwan, ROC
cNational Center for Supercomputing Applications, IL, USA
dSchool of Energy Resources and Department of Geology and Geophysics, University of Wyoming, WY,
USA
We have developed an automatic microseismic monitoring method and have applied to the
2019 Southern California Ridgecrest Earthquake Sequence. The method consists of the
following steps: (1) We calculate kurtosis functions of bandpassed continuous seismograms
and apply backprojeciton for preliminary earthquake location. (2) We employ a deep learning
algorithm to identify P and S arrivals. (3) We then use the preliminary earthquake location and
more reliable P and S picks to relocate earthquakes. (4) We adopt the template matching
algorithm (TMA) to detect microseismic events in continuous seismic recordings. The
algorithm is based on Graphic Processing Units (GPUs) and therefore has been developed for
the heavy computational task. The algorithm can provide near real-time microseismic
monitoring and therefore able to benefit foreshocks and aftershocks detections of large
earthquakes.
The 2019 G-SHA Toyako Workshop, Japan
33

P-7 Stress drops for microseismicity in asperity-like dynamic fault models: actual values vs. estimates from spectral fitting and second-moment
approaches
abYen-Yu Lin and cdNadia Lapusta aDepartment of Earth Sciences, National Central University, Taoyuan, Taiwan, [email protected] bSeismological Laboratory, California Institute of Technology, Pasadena, USA cSeismological Laboratory, California Institute of Technology, Pasadena, USA dMechanical and Civil Engineering, California Institute of Technology, Pasadena, USA
Stress drop, an averaged difference between the shear stress on the fault before and after an
earthquake, is an important source parameter. The values estimated by typical seismological
methods (e.g., the spectral fitting approaches) suggest that the stress drop is moment-invariant with
large scatter and that the on-fault rupture duration tw obeys the scaling of 1/30wt M . However,
several observations show that microseismic events from the same location can have similar source
durations but different seismic moments, violating the commonly assumed scaling. We use
numerical simulations of earthquake sequences to demonstrate that strength variations over
seismogenic patches provide an explanation of such behavior, with the event duration controlled
by the patch size and event magnitude determined by how much of the patch area is ruptured. We
find that stress drops estimated by the spectral fitting analyses for the sources simulated in an
asperity-like fault model significantly increase with the event magnitude, ranging from 0.006 to 8
MPa. However, the actual stress drops determined from the on-fault stress changes are magnitude-
independent at ~3 MPa. Our findings suggest that fault heterogeneity results in local deviations in
the moment-duration scaling and in earthquake sources with complex shapes of the ruptured area,
for some of which stress drops may be significantly (~100-1000 times) underestimated by the
spectral fitting methods. We further apply the stress-drop estimation approach using second
moments, which aims to account for rupture directivity and elliptical sources. The second-moment
approach indeed works better, providing close estimates of stress drop for sources with rupture
areas similar to elliptical ones, but still significantly underestimates, by a factor of up to 30, stress
drops for more complex rupture shapes such as ring-like sources. Hence the estimated stress drops
still overall increase with the event magnitude, ranging from 0.1 to 2 MPa, but are overall closer
to the actual stress drop of ~3 MPa.
The 2019 G-SHA Toyako Workshop, Japan
34

P-8 Focal Mechanisms of LFEs in Parkfield by the amplitude inversion using synthetic waveforms
aeMiki Aso, bNaofumi Aso, cSatoshi Ide1, dDavid R. Shelly3 a The University of Tokyo
b Tokyo Institute of Technology
cThe University of Tokyo
d Geologic Hazards Science Center, U.S. Geological Survey, Golden, CO
e OYO RMS Corporation, [email protected]
Various types of earthquakes including ordinary earthquakes and slow earthquakes are
observed at the Parkfield section of the San Andreas Fault. Since Shelly et al. (2009) detected
low frequency earthquakes (LFEs) at Parkfield, various characteristics have been studied for
the 88 LFE families. Thomas et al. (2012) reported the variation in the sensitivities to the tidal
stress among LFE families. The stress variation across the San Andreas Fault is also found from
the focal mechanisms of ordinary earthquakes; i.e., there are reverse fault earthquakes at
several km away from the fault, such as Coalinga earthquake and San Simeon earthquake,
while most of the earthquakes are characterized by right-lateral strike slip, which is consistent
with plate motion.
In this study, we estimate the focal mechanisms of 88 LFE families in the catalog of Shelly
(2017). We first stack seismograms of over one million events in the catalog to improve the
signal-to-noise (S/N) ratio. Then, we evaluate the absolute amplitudes of original seismograms
using the stacked waveforms. The waveform amplitudes are inverted for the focal mechanisms
for each LFE family using synthetic waveforms. Specifically, we first estimate maximum
absolute amplitude of three-component waveforms for both stacked and synthetic waveforms,
then estimate site effect and focal mechanism by solving an inverse problem. Synthetic
waveforms are given by the wavenumber integration method by Zhu and Rivera (2002). As a
regional structure, we use 1D structure of velocity and attenuation near Parkfield extracted
from Eberhart-Phillips (2016).
As a result, while most of the focal mechanisms are strike-slip consistent with the plate
motion at the San Andreas Fault, those for families near central Parkfield and the family off the
surface trace contain large dip-slip components. These variations are consistent with the tidal
sensitivities of LFEs in Parkfield (Thomas et al., 2012). Our study reveals the regional
existence of dip-slip focal mechanisms even along a mature strike-slip fault system.
The 2019 G-SHA Toyako Workshop, Japan
35

P-9 Fault slip deficit rate derived from geodetic data for seismic hazardassessment
a Kuo-En Ching, b Wu-Lung Chang, c Ray Y. Chuang, d Yi-Jui Lee and d Yin-Tung Yen
a National Cheng Kung University, Taiwan, [email protected]
b National Central University, Taiwan
c National Taiwan University, Taiwan, [email protected]
d Sinotech Engineering Consultants, Inc., Taiwan c Sinotech Engineering Consultants, Inc., Taiwan, [email protected]
How to reasonably estimate fault slip rate using geodetic data is always an important
issue for seismic hazard assessment because (1) whether it is reliable to evaluate long-term
slip rate based on decadal geodetic observation; (2) the geodetic long-term slip rate is usually
one-order higher than geological long-term slip rate especially in Taiwan. In order to solve
this issue, a geological rate constraint is usually applied to the block model during the slip
rate estimation using geodetic data. In this case, the geodetic long-term slip rate will be
highly dependent on the geological slip rate. Therefore, whether geodetic long-term slip rate is
really comparable to the geological slip rate? Or could we estimate the reliable geodetic long-
term slip rate? If not, which information provided by geodetic data is useful for seismic
hazard assessment? Do we need the geological slip rate constraint in a block model? The
horizontal and vertical velocity fields in Taiwan were estimated based on the coordinate time
series analysis of more than 400 continuous GNSS stations, 700 surveyed-mode GNSS
measurements and 29 leveling routes from 2002 to 2018 collected by the Central Geological
Survey of Taiwan. These geodetic data were adopted to estimate fault slip rates in western
Taiwan. Based on our modeling results in central and northern Taiwan, slip deficit rate is
reasonably evaluated in the block model using geodetic data with geological rate constraint
instead of the long-term slip rate. In addition, the slip deficit rate is also more comparable
with geological slip rate. However, do we really need the geological slip rate constraint to
obtain the geodetic slip deficit rate? Based on the further coseismic source models of the
1999 Chi-Chi Taiwan earthquake and the 2015 Gorkha Nepal earthquake, coseismic slip
distribution on the decollement is possible. One possible source of the geological and
geodetic slip rate difference may hence come from the strain accumulation on decollement.
An updating block model is going to be test in western Taiwan to realize the meaning of
geological constraint in block model.
The 2019 G-SHA Toyako Workshop, Japan
36

P-10 Insight of the surface deformation in the southwestern Taiwan by using PSInSAR technique
aPing-Chen Chiang, bRay Y. Chuang, cChih-Heng Lu
aDepartment of Geography, National Taiwan University, Taipei, Taiwan, [email protected]
bDepartment of Geography, National Taiwan University, Taipei, Taiwan, [email protected]
cDepartment of Geography, National Taiwan University, Taipei, Taiwan
The modern geodetic data indicates that the surface deformation of southwestern Taiwan is
complicated. Many factors, such as fault movement, tectonic stress, and mud diaper activities,
control the horizontal and vertical movement in this area. In addition, after 2016 Mw 6.4
Meinong earthquake shocked the southwestern Taiwan, the spatiotemporal distribution of the
aftershocks implies that some blind structures may exist. It is an opportunity to characterize the
difference of surface deformation between postseismic and preseismic periods and to
understand the time-series surface behaviors. This study processed 105 Sentinel-1 ascending
images (27 images are between 2014/10/22 and 2016/02/02 and 78 images are between
2016/02/14 and 2018/12/24) and 76 Sentinel-1 descending images (18 images are between
2014/11/05 and 2016/02/04 and 58 images are between 2016/02/28 and 2018/12/26) with the
persistent scatters InSAR (PSI) method to estimate the difference of surface deformation in two
periods (Before and after the Meinong earthquake). Furthermore, the PSI results would be
verified by GPS data to evaluate the surface deformation of southwestern Taiwan, especially at
the Tainan table land and north Kaohsiung.
Keywords: radar, InSAR, surface velocity, crustal deformation
The 2019 G-SHA Toyako Workshop, Japan
37

P-11 Estimation of Coulomb Stress Changes from GPSSurface Displacements in the Taiwan Region
aLi-Chieh Lin, bRay Y. Chuang aDepartment of Geography, National Taiwan University, [email protected] of Geography, National Taiwan University, [email protected]
Earthquakes take place when the accumulated stress exceeds the capacity of the
surrounding materials can withstand. The failure of the rock materials then releases
accumulated energy and cause damage to the vicinity of the epicenter. Therefore, the
change of Coulomb Stress can be seen as a possible indicator prior to earthquakes
and can well explain the triggering of seismic events. Traditionally, the calculation of
Coulomb Stress utilizes a dislocation model assuming a uniform elastic half-space. In
this study, we estimate the Coulomb Stress change by using secular GPS surface
velocities. With the method used in this study, it provides a more straightforward and
easier way to understand the long-term change of Coulomb Stress. By analyzing the
change of Coulomb Stress, it may be helpful for earthquake forecasting and minimize
the damage which caused by hazardous earthquakes.
Keywords: stress tensor, strain rates, earthquake hazards, seismic potential
The 2019 G-SHA Toyako Workshop, Japan
38

P-12 Seismogenic characteristics of the plate collision zone: Application of the 2018 Hualien earthquake
a Strong Wen, bYi-Ying Wen, cKuo-En Ching, dYu-Lien Yeh, eYuan-Hsi Lee
a Department of Earth and Environmental Sciences, National Chung Cheng University, Chia-yi County, Taiwan,
b Department of Earth and Environmental Sciences, National Chung Cheng University, Chia-yi County, Taiwan
c Department of Geomatics, National Cheng Kung University, Tainan, Taiwan, [email protected]
d Department of Earth and Environmental Sciences, National Chung Cheng University, Chia-yi County, Taiwan
e Department of Earth and Environmental Sciences, National Chung Cheng University, Chia-yi County, Taiwan,
The 2018 Hualien earthquake occurred at the junction of the deformed continental crust of
Eurasian plate and the Heping sea basin, where a northeast trending seismic belt exists. In this
study, a 3D seismic tomographic inversion is used to investigate the seismogenic structures of
the 2018 Hualien earthquake sequence. An earthquake relocation procedure is performed and
the focal mechanisms are analyzed to study the faulting behavior. Our results indicate that the
source region of the 2018 Hualien earthquake consists of complex high-angle eastward and
westward dipping reverse faulting. We also observe that most earthquakes that have occurred in
the area exhibit considerable variation in Vp/Vs ratios. Fluid migration may have played an
essential role in causing the Vp/Vs ratio variation. Meanwhile, we also analyze the focal
mechanisms and conduct stress inversion for these swarms. The results show that these swarms
are energetic and short in duration and were dominated by right and left lateral strike-slip events
along a prominent lineation in EW and NW directions, respectively. Due to the collision is still
active and this compression produces micro-earthquakes likely linked to E-W or NW-SE
pre-exiting faults which are triggered with oblique-slip faulting. Therefore, the results are not
only giving better understanding the seismogenic structure beneath the eastern Taiwan, but also
can provide key information to properly assess seismic hazard analysis for the urban area. We
suggest that the mainshock of the 2018 Hualien earthquake may be associated with a
west-dipping fault, which is a blind fault tending toward the Heping sea basin and possibly
belonging to the Central Range fault system.
The 2019 G-SHA Toyako Workshop, Japan
39

P-13 Seismic disasters and volcanism associate with shallow velocity structures suggested from ambient seismic noise studies
in Tatun Volcano Group and Aso caldera
a Yu-Chih Huang, b Cheng-Horng Lin and c Tsuneomi Kagiyamaa National Center for Research on Earthquake Engineering, NARLabs, Taiwan, [email protected] b Institute of Earth Sciences, Academia Sinica, Taiwan, [email protected] c Aso Volcano Museum, Japan, [email protected]
The magmatic-hydrothermal systems can be investigated through imaging seismic velocity
structures, in particular, S-wave velocities (Vs) are generally correlated with hydrothermal
fluid or magma distributions. Since the basic theorem of ambient seismic noise has been
supported and is routinely used worldwide to investigate subsurface velocity structures. The
method uses diffuse wave fields with passive structural signals contained in ambient seismic
noise. We try to summarize the obtained shallow velocity structures with the volcanism of
Tatun Volcano Group (TVG) in Taiwan and Aso caldera in Japan. We suppose that faults play
a significant role with volcanic activity and landslides caused by strong ground shaking
during the 2016 Kumamoto and 2018 Hokkaido earthquakes should relate to loose pyroclastic
materials at the surface.
Various recent lines of evidence indicate that
TVG is a potentially active volcano, and that the
possibility of volcanic eruptions in the future
cannot be excluded. Most recent volcanic
activities in TVG are concentrated around, and
have been observed at Chishingshan (Mt. CS)
and Dayoukeng (DYK). Huang et al. (2017)
analyzed daily ambient seismic noise of the
vertical components from 2014 using a dense
seismic network of 40 broadband stations. We
investigated shallow crustal phase velocity
distributions with a 0.02° grid spacing in the
0.5–3 s period band and two Vs profiles transect
Mt. CS to depths of 3 km (Fig. 1). Low velocity
zones in the southeast of DYK may be
interpreted as hydrothermal reservoirs or
water-saturated Tertiary bedrock in the shallow
crust. High velocities conspicuously dominate
Fig. 1. 3D phase velocity maps and two Vs
profiles transect Mt. CS in the shallow 3 km crust.
(Huang et al., 2017)
The 2019 G-SHA Toyako Workshop, Japan
40
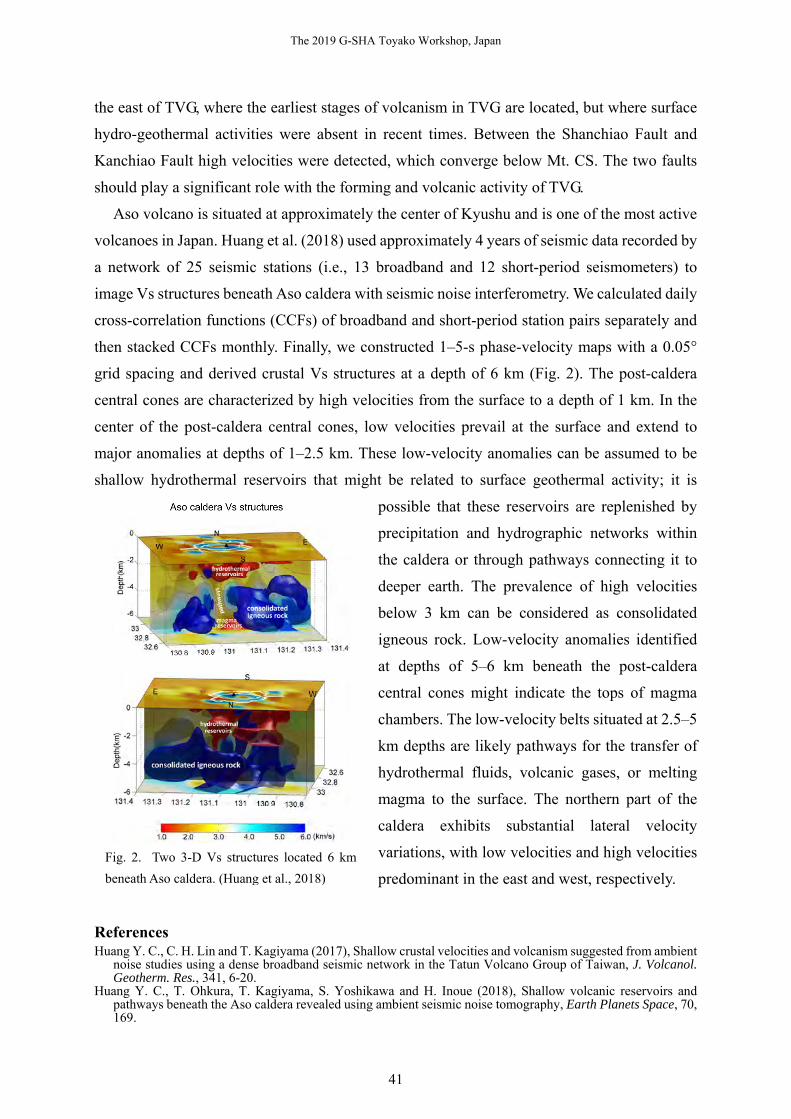
the east of TVG, where the earliest stages of volcanism in TVG are located, but where surface
hydro-geothermal activities were absent in recent times. Between the Shanchiao Fault and
Kanchiao Fault high velocities were detected, which converge below Mt. CS. The two faults
should play a significant role with the forming and volcanic activity of TVG.
Aso volcano is situated at approximately the center of Kyushu and is one of the most active
volcanoes in Japan. Huang et al. (2018) used approximately 4 years of seismic data recorded by
a network of 25 seismic stations (i.e., 13 broadband and 12 short-period seismometers) to
image Vs structures beneath Aso caldera with seismic noise interferometry. We calculated daily
cross-correlation functions (CCFs) of broadband and short-period station pairs separately and
then stacked CCFs monthly. Finally, we constructed 1–5-s phase-velocity maps with a 0.05°
grid spacing and derived crustal Vs structures at a depth of 6 km (Fig. 2). The post-caldera
central cones are characterized by high velocities from the surface to a depth of 1 km. In the
center of the post-caldera central cones, low velocities prevail at the surface and extend to
major anomalies at depths of 1–2.5 km. These low-velocity anomalies can be assumed to be
shallow hydrothermal reservoirs that might be related to surface geothermal activity; it is
possible that these reservoirs are replenished by
precipitation and hydrographic networks within
the caldera or through pathways connecting it to
deeper earth. The prevalence of high velocities
below 3 km can be considered as consolidated
igneous rock. Low-velocity anomalies identified
at depths of 5–6 km beneath the post-caldera
central cones might indicate the tops of magma
chambers. The low-velocity belts situated at 2.5–5
km depths are likely pathways for the transfer of
hydrothermal fluids, volcanic gases, or melting
magma to the surface. The northern part of the
caldera exhibits substantial lateral velocity
variations, with low velocities and high velocities
predominant in the east and west, respectively.
References Huang Y. C., C. H. Lin and T. Kagiyama (2017), Shallow crustal velocities and volcanism suggested from ambient
noise studies using a dense broadband seismic network in the Tatun Volcano Group of Taiwan, J. Volcanol. Geotherm. Res., 341, 6-20.
Huang Y. C., T. Ohkura, T. Kagiyama, S. Yoshikawa and H. Inoue (2018), Shallow volcanic reservoirs and pathways beneath the Aso caldera revealed using ambient seismic noise tomography, Earth Planets Space, 70, 169.
Fig. 2. Two 3-D Vs structures located 6 km
beneath Aso caldera. (Huang et al., 2018)
The 2019 G-SHA Toyako Workshop, Japan
41

P-14 Mapping profiled engineering bedrock in Taiwan from low cost densemicrotremor survey
a Jyun-Yan Huang,
b Kuo-Liang Wen,
c Che-Min Lin and
d Chun-Shiang Kuo
a National Center for Research on Earthquake Engineering, Taiwan, [email protected]
National Central University, Taiwan, [email protected] National Center for Research on Earthquake Engineering, Taiwan, [email protected]
d National Center for Research on Earthquake Engineering, Taiwan,[email protected]
Engineering bedrock was an important issue to consider local site response when studying seismology, the definition was mostly mentioned as the shallower interface of which underlying stratum has from 300 to 700 m/sec of the shear wave velocity. In frequency domain, in contrast, rather than to identify the shear wave velocity 3000- 3500 m/s seismic bedrock, the pre-dominant period of the ground that is close to the proper period of the structures constructed or planned on the mentioned ground is much more important for site response identification. Meanwhile, traditionally shear wave velocity structure inverted from geophysical methods were mostly used to find seismic bedrock and engineering bedrock but basically permanent strong motion stations, lots of earthquake records or proper measurement locations were needed in those methods such as receiver functions, ray tracing, seismic tomography, microtremor array etc. However, single station microtremor measurements were confirmed it could provide dominance frequency map and frequency-dependent site response in map-view for site effect study (Wen and Huang, 2012). It represented the information of deposit thickness and S-wave velocity of the main alluvium layer. Finally, dense microtremor surveys were done in Taiwan after Chi-Chi earthquake, including 3917 measurement sites spreading within sedimentary region such as basin, plain regions. The measurement interval was two to three kilometers in most of the region, and it was five hundred meters to one kilometer in the city. In this study, microtremor measurements were lined up as profiled H/V ratios. The preliminary results indicated high ratio of profiled H/V could link and it was corresponding to main boundary of high velocity contrast layer that was mostly engineering bedrock. Therefore, SungShan formation could be clearly mapping in Taipei basin in this case. The low cost dense microtremor survey could help to identify engineering bedrock for low seismicity country or region to constrain local site effect and might benefit to consider seismic hazard in the near future.
References Wen K.L. and J.Y. Huang (2012), Dense microtremor survey for site effect study in Taiwan, proceeding of 15 World Conference of Earthquake Engineering (WCEE), Lisboa.
The 2019 G-SHA Toyako Workshop, Japan
42
P-15 Long-period surface wave tomography of Taiwan and Seismic interferometry
aYing-Nien Chen, bYuancheng Gung, and c Ling-Yun Chiao
a Department of Earth and Environmental Sciences, National Chung Cheng University, Taiwan,
b Department of Geosciences, National Taiwan University, Taipei, Taiwan.
c Institute of Oceanography, National Taiwan University, Taipei, Taiwan.
Retrieving empirical Green functions (EGF) between seismic stations by cross-correlating
continuous seismic records has quickly become a popular technique in seismology. Based on
an implicit high-frequency approximation, the consensus is that the noise cross-correlation
function (NCF) of continuous seismic records resembles the Green’s Function (GF) of the far-
field surface wave between sensors. This perspective leads to the application of the long
interstation distance criterion in the dispersion measurements, and, accordingly, much of the
low-frequency content in the NCF is rejected. As the spatial extent of Taiwan and the 3-
wavelength criterion used in the study of noise are both limiting factors [T.-Y. Huang et al.,
2015; Tzu-Ying Huang et al., 2012], the resulting path distribution favors the N–S direction for
longer periods. Accordingly, the resolving power for azimuthal anisotropy studies is restricted
to shorter periods.
In this study, we show that it is more appropriate to consider the noise cross-correlation function
as a product of interference instead of the empirical Green’s Function of the far-field surface
wave between sensors. We present a new method based on hybrid peak delay time matching to
estimate the phase velocities at much lower frequencies of the noise cross-correlation function.
Using this method, the dispersion measurement can be extended to much longer periods,
allowing the probing of deeper structures with the same noise cross-correlation function dataset.
Because there are less limitations on the interstation distance in the approach proposed in this
study, the azimuthal coverage of the paths is considerably improved, and the frequency band of
the determined dispersion curves is greatly extended to include longer periods.
Reference :
Huang, T.-Y., Y. Gung, W.-T. Liang, L.-Y. Chiao and L. S. Teng (2012). "Broad-band Rayleigh wave tomography
of Taiwan and its implications on gravity anomalies." Geophysical Research Letters 39(5)
Huang, T.-Y., Y. Gung, B.-Y. Kuo, L.-Y. Chiao and Y.-N. Chen (2015). "Layered deformation in the Taiwan
orogen." Science 349(6249): 720-723.
The 2019 G-SHA Toyako Workshop, Japan
43

P-16 Modeling of Subsurface Velocity Structures in Sedimentary basins for the Tokai region, Japan, for broadband strong ground motion
prediction
a Atsushi Wakai, b Shigeki Senna, c Atsushi Yatagai, d Haruhiko Suzuki, e Yoshiaki Inagaki, fHisanori Matsuyama and g Hiroyuki Fujiwara
a National Research Institute for Earth Science and Disaster Resilience, Japan, [email protected] bNational Research Institute for Earth Science and Disaster Resilience, Japan, [email protected] c OYO Corporation d OYO Corporation e OYO Corporation f OYO Corporation gNational Research Institute for Earth Science and Disaster Resilience, Japan, [email protected]
For sophistication of strong ground motion prediction, it is one of the principal issues to
model subsurface velocity structures so that earthquake ground motions can be accurately
evaluated from 0.1 to 10 s in the broadband period. Therefore, it is indispensable to
comprehensively model shallow and deep velocity structures which have ever constructed
separately and to constructed subsurface velocity structure models so that earthquake
observation records can be reproduced.
In recent years, subsurface velocity structures have been modeled for the Kanto, the Tokai
and the Kumamoto region, in a national project.
The modeling procedure [Senna et al., 2019] is as follows. To begin with, initial deep
subsurface velocity structures were modeled based on the geological information, the
geophysical exploration data and subsurface velocity structure models constructed in the past
national investigations. Next, initial shallow velocity structures were modeled based on the
existing bore-hole data and surface geological and geomorphologic information which had ever
been collected from local governments and so on. Then, through integrating the deep models
and the shallow ones in the top surface of engineering basement (the Vs350m/s layer in this
study), initial subsurface velocity structures were modeled from the top surface of seismic
bedrock to ground surface.
Meanwhile, a lot of ground-motion records were collected through spatially dense and
uniform array microtremor measurements and earthquake observations at seismic stations in
the target regions. Using ground-motion characteristics such as disperse curves and H/V(R/V)
spectral ratios from ground-motion records, each 1-dimensional velocity structure was
estimated at each measurement point. With these results, the initial subsurface velocity structure
models were improved from the top surface of seismic bedrock to ground surface in the regions.
In this presentation, we will principally report on the modeling process and some features of
the improved models for the Tokai region. References S. Senna, A. Wakai, A. Yatagai, K. Jin, H Matsuyama, H. Suzuki and H. Fujiwara (2019), Modeling of the
subsurface structure from the seismic bedrock to the ground surface for a broadband strong motion evaluation
in Japan, 7th ICEGE Proc. Rome, 17-20 June 2019.
The 2019 G-SHA Toyako Workshop, Japan
44

P-17 Surface topography effects on seismic amplification in Jiu-Jiu peaks of Taiwan
a Chun-Te Chen and b Shiann-Jong Lee
aInstitute of Earth Sciences, Academia Sinica, Taipei, Taiwan, [email protected]
bInstitute of Earth Sciences, Academia Sinica, Taipei, Taiwan
A serious large range landslide in Jiu-Jiu peaks area induced by the Chi-Chi
earthquake, 1999 in Taiwan. In order to investigate the amplification of seismic
response on surface topography. We perform the 3D ground motion simulation in Jiu-
Jiu peaks area of Taiwan base on the spectral element method. The 20m resolution
Digital Elevation Model (DEM) data was applied to build a mesh model with realistic
terrain relief. To this end,
in a steep topography area
like Jiu-Jiu peaks, the
designed thin buffer
layers are applied to
dampen mesh distortion.
The three doubling mesh
layers near the surface
accommodate the finer
mesh model. The
numerical modeling
results show the higher
amplification of PGA on
the tops and ridges of Jiu-Jiu peaks than surrounding mountains, while the de-
amplification most occur near the valley and hillside (Fig 1). In contrast to a flat surface,
the relief topography could have a ±%50 variation in PGA amplification. The analysis
also indicated the topographically amplified seismic response mainly affected the
frequency band within 5-10 Hz. However, it worth further investigate the interaction
between the realistic topography and the velocity structure on how to impact the seismic
response in the different frequency band. The topographically seismic amplification
could contribute to a component of innovation in seismic hazard assessment.
Fig. 1. The PGA amplification of topography effects.
The 2019 G-SHA Toyako Workshop, Japan
45

P-18 An updated model of seismic hazard map for the Korean Peninsula
a Seongjun Park, b Gyubyeong Rah, and c Tae-Kyung Hong
a Yonsei University, Seoul, South Korea
bYonsei University, Seoul, South Korea
cYonsei University, Seoul, South Korea, [email protected]
A probabilistic analysis of seismic hazards is an essential part of natural hazard mitigation
for construction of safe society. The Korean Peninsula and its surrounding regions have low
seismicity according to the instrumental seismicity since 1978 when the national seismic
monitoring began..Historical literatures, however, present many destructive earthquake
records, suggesting a potential of large earthquakes. The recent M5-level earthquakes (M5.8,
M5.4) raised the public concerns on the potential seismic hazards. A limited number of
seismogenic structures were reported. There is difficulty to compile a seismic hazard map with
known seismogenic structures. We construct a seismic hazard map of the Korean Peninsula. We
collect over 2,000 historical and instrumental events since AD 2. The observed maximum
magnitude around the peninsula is M7.0. The background seismicity is assessed using
smoothed instrumental seismicity. The Gutenberg-Richter magnitude-frequency relationship is
determined to have b value of 0.96. The maximum magnitudes and b values are examined for
for seismotectonic provinces. We apply various forms of ground motion prediction equations
(GMPEs) that were verified through comparison with observed ground motion data. The
seismic hazard potentials are high in the southeastern Korean Peninsula and around Pyongyang.
The expected peak ground accelerations vary high with input parameters, requesting careful
analysis of seismic hazards potentials in the Korean Peninsula.
The 2019 G-SHA Toyako Workshop, Japan
46

P-19 Attenuation characteristics of Recent earthquakes occurred in Alaska and Southern California, the United States of America
a Hongjun Si
a Seismological Research Institute Inc., Japan, [email protected]
Recently, three significant earthquakes have occurred in Alaska and Southern California,
the USA. Two major earthquakes, the Mw6.5 and the Mw7.0 Ridgecrest earthquakes occurred
about 200 km north-northeast of Los Angeles, California, at 10:33:49 on 4 July and 20:19:53 on
5 July 2019 (PDT), respectively.
During these earthquakes, a
large amount of ground motion
recordings has been observed
and opened for public use on the
Center for Engineering Strong
Motion Data (CESMD). These
precious data made it possible to
investigate the characteristics of
ground motion recorded in
Alaska and Southern California,
the United States. In this study, we compare the attenuation characteristics of the strong ground
motions of the two earthquakes with the existing GMPEs developed in Japan and the United
States and investigate the spatial distribution of the observed ground motions.
The ground motion data used in this study are those compiled by CESMD. Among these
data, the records observed at the stations installed in buildings were excluded. The closest
distance from the seismic fault to an observation station is defined as the source distances. PGA
and PGV are defined as the larger one among the PGAs and PGVs of the two horizontal
components. Mw estimated by GCMT are used in the analysis.
As the preliminary results, we compared the PGAs and PGVs observed during the three
earthquakes occurred in the USA and the GMPE by Si and Midorikawa (1999), and found that
the observed PGAs for three earthquakes are generally consists with the predictions (Fig. 1).
References Si, H., Koketsu, K., & Miyake, H. (2019, 08). Preliminary study on the attenuation characteristics of ground
motion recorded during the 2019 Ridgecrest earthquakes. Poster Presentation at 2019 SCEC Annual Meeting.
Closest distance from seismic fault ( km )
P.G
.A (
cm
/s2 )
Mw = 6.5 (GCMT)Crustal
Si and Midorikawa (1999) +/-
100 101 102
101
102
103
Closest distance from seismic fault ( km )
P.G
.V (
cm
/s )
Mw = 6.5 (GCMT)CrustalSi and Midorikawa (1999) for
Vs=600m/s Vs=200m/s
100 101 102
100
101
102
Closest distance from seismic fault ( km )
P.G
.A (
cm
/s2 )
Mw = 7.0 (GCMT)Crustal
Si and Midorikawa (1999) +/-
100 101 102
101
102
103
Fig. 1. Comparison of PGAs recorded during the M6.4 and M7.0
2019 Ridgecrest, California earthquakes and the predictions by Si
and Midorikawa (1999) based on database in Japan.
The 2019 G-SHA Toyako Workshop, Japan
47
P-20 Spatial Distribution Databases of Ground Motion for the recent earthquakes in Taiwan, New Zealand, Italy and Japan
a Satoshi Shimizu and b Yasushi Komaru
a OYO RMS Corporation, Japan, [email protected]
b OYO RMS Corporation, Japan, [email protected]
The quantitative studies are important to understand and reveal the local risk of earthquake
hazard. We estimated the spatial distribution of ground motion for the recent earthquakes in
Taiwan, New Zealand, Italy and Japan, including 1999 Chi-Chi earthquake, 2016 Meinong
earthquake, 2011 Christchurch earthquake, 2016 Kaikoura earthquake, 2009 L’Aauila
earthquake, and 2016 Kumamoto earthquake. The spatial distribution of ground motion at the
engineering bedrock was estimated from the observed seismograms by using interpolation
after detrending attenuation effect which is called Simple-Kriging method. We use the local
seismic network, which is operated by CWB in Taiwan, Geo Net in New Zealand, EMS in
Italy, and NIED in Japan. To consider the site amplification, we used the surface velocity
Vs30 published by USGS in Taiwan, New Zealand and Italy, and also using Vs30 by J-SHIS
in Japan. We also used the dense Vs30 observation by CWB in Taiwan, and combined with
USGS data. The fault models were used as a point source or the planer faults published by the
previous studies.
We produced the databases of spatial distribution of ground motion as PGA, PGV, JMA
Intensity, SI, Sa, and JMA long-period grand motion class. These databases enable to
compare the earthquake hazard among countries. They will be released on the website.
The 2019 G-SHA Toyako Workshop, Japan
48
P-21 Assessing building amplification factor in Taiwan using dense building array
a Ming-Kai Hsu, bKuo-Fong Ma
a Earthquake-Disaster & Risk Evaluation and Management (E-DREaM) Center, National Central
University, Taiwan, [email protected] b Earthquake-Disaster & Risk Evaluation and Management (E-DREaM) Center, National Central
University, Taiwan, [email protected]
In this studying we intend to use the densely distributed Palert strong motion
stations, which were installed mainly in the first/2nd floor of buildings to evaluate the
amplification with dense distribution. We compare the peak ground acceleration (PGA)
value between recorded Palert ground-motions and that from ground motion prediction
equation (GMPE) to examine the empirical relationship and its possible characteristics
from site. Palert network is a high-density low-cost sensor network, which had
recording several thousand of records from earthquakes with magnitudes of ML 2.13 –
6.9 since 2011. Considering the earthquake with different types of focal mechanisms,
magnitude and receiving PGA value for each Palert station, we intend to realize the
sites effect evaluation in a denser manner to understand the scaling in amplification,
which is important for the future evaluation on earthquake scenario modeling from
hazard to risk. It is extremely important for the high population metropolitan urbans
such as Taipei region in Taipei basin. Through this exercise, we aim to establish the
amplification factor map and help the calculation of building damage seismic risk
assessment from developed fragility curves, especially with the evaluation on the new
definition of intensity scale of 2020.
The 2019 G-SHA Toyako Workshop, Japan
49

P-22 Development of the building damage detection model based on the deep-learning utilizing aerial photographs of the plural earthquakes
a Shohei Naito, b Hiromitsu Nakamura and c Hiroyuki Fujiwara
a National Research Institute for Earth Science and Disaster Resilience, Japan, [email protected]
bNational Research Institute for Earth Science and Disaster Resilience, [email protected]
cNational Research Institute for Earth Science and Disaster Resilience, [email protected]
It is important to estimate damage of buildings immediately after the earthquake, for supporting
disaster responses performed by the governments and the companies. For this purpose, we developed
the immediate damage detection model of buildings based on the deep-learning utilizing the remote
sensing images.
We developed the training data by utilizing images of multiple ortho-rectified vertical aerial photos,
and each photo was taken soon after the 2016 Kumamoto earthquake, the 1995 southern Hyogo
Prefecture earthquake, and the 2011 off the Pacific coast of Tohoku earthquake.
First, we classified damages of all buildings in each photo into four levels by means of the visual
judgment; LEVEL1: No damage, LEVEL2: slight damage, LEVEL3: moderate damage, LEVEL4:
collapsed. And we organized these damage levels as the GIS data, utilizing the building polygon
provided by the Geospatial Information Authority of Japan. Subsequently, we cropped patch images of
80-pixels square which include the main part of a common residence automatically, then extracted
approximately 330,000 patches which were labeled by each damage level.
Furthermore, we developed the damage classification model based on the Convolutional Neural
Network (CNN) referring the VGG (Simonyan and Zisserman, 2014), and then trained this model with
the patches cropped from aerial photos of the plural earthquakes. By utilizing this model, all buildings
inside the aerial photograph are automatically classified into four damage levels. Furthermore, as a
result of the 10-fold cross validation utilizing the training data generated by Hyogo, Tohoku, and the
Kumamoto earthquake, the recalls in each damage level were exceeding 70%. We think such accuracy
in four classifications is applicable for the disaster assessments in the context of estimating the
prioritization of manpower and resource.
By these methods, the immediate damage detection of the extensive area with an aerial photograph is
achieved. Besides, by application of the Bayesian updating method, the estimation result based on the
distribution of ground motion can be updated into the higher accuracy.
Additionally, we applied the Bayesian updating method of the J-RISQ (Kusaka et.al, 2017) to the
estimation result generated by the CNN-based damage classification model. In the case of the
main-shock of the Kumamoto earthquake, the estimation result of J-RISQ was overestimated compared
to the governmental field survey result. However, by utilizing the proposed Bayesian updating method
with aerial photos, we confirmed the estimation results get closer to the governmental result. For that
reason, we think the proposed method is applicable for supporting the disaster responses which is
performed by the municipality and the insurance company.
The 2019 G-SHA Toyako Workshop, Japan
50
P-23 It's Our Fault research programme: building earthquake resilience for the Wellington region
a Caroline Holden and a Delia Strong
a GNS SCIENCE, New Zealand, [email protected]
The It’s Our Fault programme started in 2006 to better understand Wellington region’s
earthquake risk. It is the most comprehensive study of its kind to look at the likelihood and
effects of major earthquakes, how these will affect people and infrastructure, and what we can
do to prepare and recover. It’s Our Fault is jointly funded by EQC (Earthquake Insurance),
Wellington City Council and Wellington Region Emergency Management Office.
On behalf of the scientists involved in the project, Caroline will be presenting topics that
include hazard studies such as Hikurangi rupture characterization, tsunami and landslide
modelling, and planning and policy needs, plus many others supporting evidence-based
decision making such as household rainwater tank storage or painting tsunami blue line ‘safe
zones’ on streets in coastal suburbs.
The 2019 G-SHA Toyako Workshop, Japan
51

P-24 Prototype of capital stock model of private enterprises by industry for all of Japan to predict economic damage by earthquakes and tsunamis
a H. Nakamura, b H. Fujiwara, c I. Takahashi, d S. Shimizu, and e M. Yamazaki
a National Research Institute for Earth Science and Disaster Resilience, Japan, [email protected] bNational Research Institute for Earth Science and Disaster Resilience, Japan, [email protected] c National Research Institute for Earth Science and Disaster Resilience, Japan d OYO RMS Corporation, Japan, [email protected] eNagoya University, Japan
In Cross-ministerial Strategic Innovation Promotion Program (SIP), NIED is developing an
economic damage prediction system for the purpose of supporting early economic recovery
after the Nankai Trough earthquake.
The system estimates direct and indirect economic damage from earthquakes and tsunamis
in all of Japan based on earthquake and tsunami hazard information in real time. It is necessary
to calculate the amount of damage to capital stock due to earthquake and tsunami inundation.
However, the gross capital stock data of private enterprises by industry is only published at the
prefectural level. Therefore, it lacks the spatial resolution necessary for sufficient damage
prediction reflecting earthquake and tsunami hazard information.
In this study, we prepared a mesh-level capital stock model of private enterprises by industry
of the whole Japan. The capital stock data of private enterprises published by the Cabinet Office
was used as the foundation. The spatial resolution was granulized to the city level, district level,
and then mesh level. The final capital stock model of private enterprises was obtained for each
mesh with 250 m and 50 m sizes for inland and coastal areas, respectively (Fig.1).
Fig.1 Examples of capital stock model of private enterprises by industry in mesh-level
Acknowledgements This work was supported by the Council for Science, Technology and Innovation (CSTI) through the Cross-ministerial Strategic Innovation Promotion Program (SIP).
The 2019 G-SHA Toyako Workshop, Japan
52

P-25 Study of factors in distribution and probability of landslides triggered by earthquakes in Taiwan
a Chia-Han Tseng and b Ruey-Juin Rau
a Graduated Institute of Applied Geology, National Central University, Taiwan, [email protected]
b Department of Earth Sciences, National Cheng-Kung University, Taiwan, [email protected]
Taiwan’s landscape is characterized by rugged terrains, for exogenic and endogenic
processes have both been constantly shaping the terrains since the Taiwan Island was formed.
The most destructive exogenic and endogenic processes in Taiwan are torrential rainfalls
brought by either monsoons or typhoons and
earthquakes, respectively. They often not
only alter the landform in the pattern of mass
wasting or landslides, but also consequently
make great loss of human lives and property.
occurring in 1999.
For the purposes of avoiding and reducing
the disaster resulting from landslides,
especially triggered by earthquakes, factors
which control the distribution and probability
of earthquake-triggered landslides are
studied. We select the most destructive
earthquake event ever recorded in Taiwan,
i.e., the Chi-Chi earthquake in 1999 (ML 7.3),
and the landslides triggered by the event (i.e.,
landslide inventory for the Chi-Chi
earthquake (Liao and Lee, 2009)).
Our preliminary results show that about
90% of the earthquake-triggered landslides
are dip slopes (i.e. cataclinal slopes) and occurred within the area where the PGA is larger than
250 gal (i.e. ≧ intensity 6; Fig. 1). In addition to the earthquake intensity, other factors which
control the distribution and probability of earthquake-triggered landslides, such as distance
from the epicenter, distance from the faulting fracture, lithology and slope angle, are also
necessary to be discussed for further analyses.
References Liao H.-W. and C.-T. Lee (2009), Landslides triggered by the Chi-Chi earthquake,
https://www.geospatialworld.net/article/landslides-triggered-by-the-chi-chi-earthquake/
Fig. 1. Distribution of the Chi-Chi Earthquake
landslides.
The 2019 G-SHA Toyako Workshop, Japan
53

P-26 Example of long-term volcanic risk assessment in Shikotsu caldera, Hokkaido, Japan
a Yoshinori Tokizane, b Masatsugu Wakaura, c Himeka Kikuchi and d Toshihiro Yamada
a OYO RMS Corporation, Japan, [email protected]
b OYO RMS Corporation, Japan
c OYO RMS Corporation, Japan, [email protected]
d OYO RMS Corporation, Japan, [email protected]
Mt. Tarumae and Eniwa Dake are active volcanoes located in the Shikotsu caldera, Hokkaido (Fig.1). Mt.
Tarumae experienced large-scale eruptions in 1667 and 1739. Those eruptions ejected a large amount of
pyroclastic fall and pyroclastic flow (Furukawa & Nakagawa, 2010). Shikotsu caldera was formed by the
catastrophic eruption in 44ka. The pyroclastic flow deposits at this event widely spread and reached Sapporo
city (Yamamoto, 2016), largest city in Hokkaido. In this study, we analyze the risk of ash fall and pyroclastic
flow from caused these volcanoes.
We quantify “exposed population” as the risk assessment. We defined that the “exposed population” is
the population which is exposed more than 10cm thickness pyroclastic fall deposit or extent of pyroclastic
flow. We used logic tree for risk analysis. To evaluate the ash fall hazard, we used the Tephra2 software
which is an advection-diffusion simulation. The pyroclastic flow hazard was evaluated using the energy cone
model (Fig.2).
References R. FURUKAWA and M. NAKAGAWA (2010), Geological map of Tarumae volcano, Geological survey of
Japan, AIST. T. Yamamoto (2016), Volume of erupted magma during the Shikotsu caldera-formation, Hokkaido, Japan.
Open-File Report of the Geological Survey of Japan, AIST, No.632, 1-51.
Fig. 1. Location of Shikotsu caldera
Fig. 2. Result of energy cone model and actual distribution
The 2019 G-SHA Toyako Workshop, Japan
54
![[XLS] · Web viewOthers China Singapore Taiwan Big Ten Ivy HongKong Japan Australia & Newzealand UK Canada USA Center for Innovative Teaching and Learning University of Northern Iowa](https://static.fdocuments.in/doc/165x107/5b427a187f8b9afa2c8b90e8/xls-web-viewothers-china-singapore-taiwan-big-ten-ivy-hongkong-japan-australia.jpg)


![[Psilocybin]Magic Mushrooms Of Australia & Newzealand-Allen](https://static.fdocuments.in/doc/165x107/5451e245b1af9f83248b4acc/psilocybinmagic-mushrooms-of-australia-newzealand-allen.jpg)


